
Effect of Nano-SiO2/PVA on Corrosion Behavior of Steel Rebar Embedded in High-Volume Fly Ash Mortar under Accelerated Chloride Attack


Abstract
:1. Introduction
2. Materials and Methods
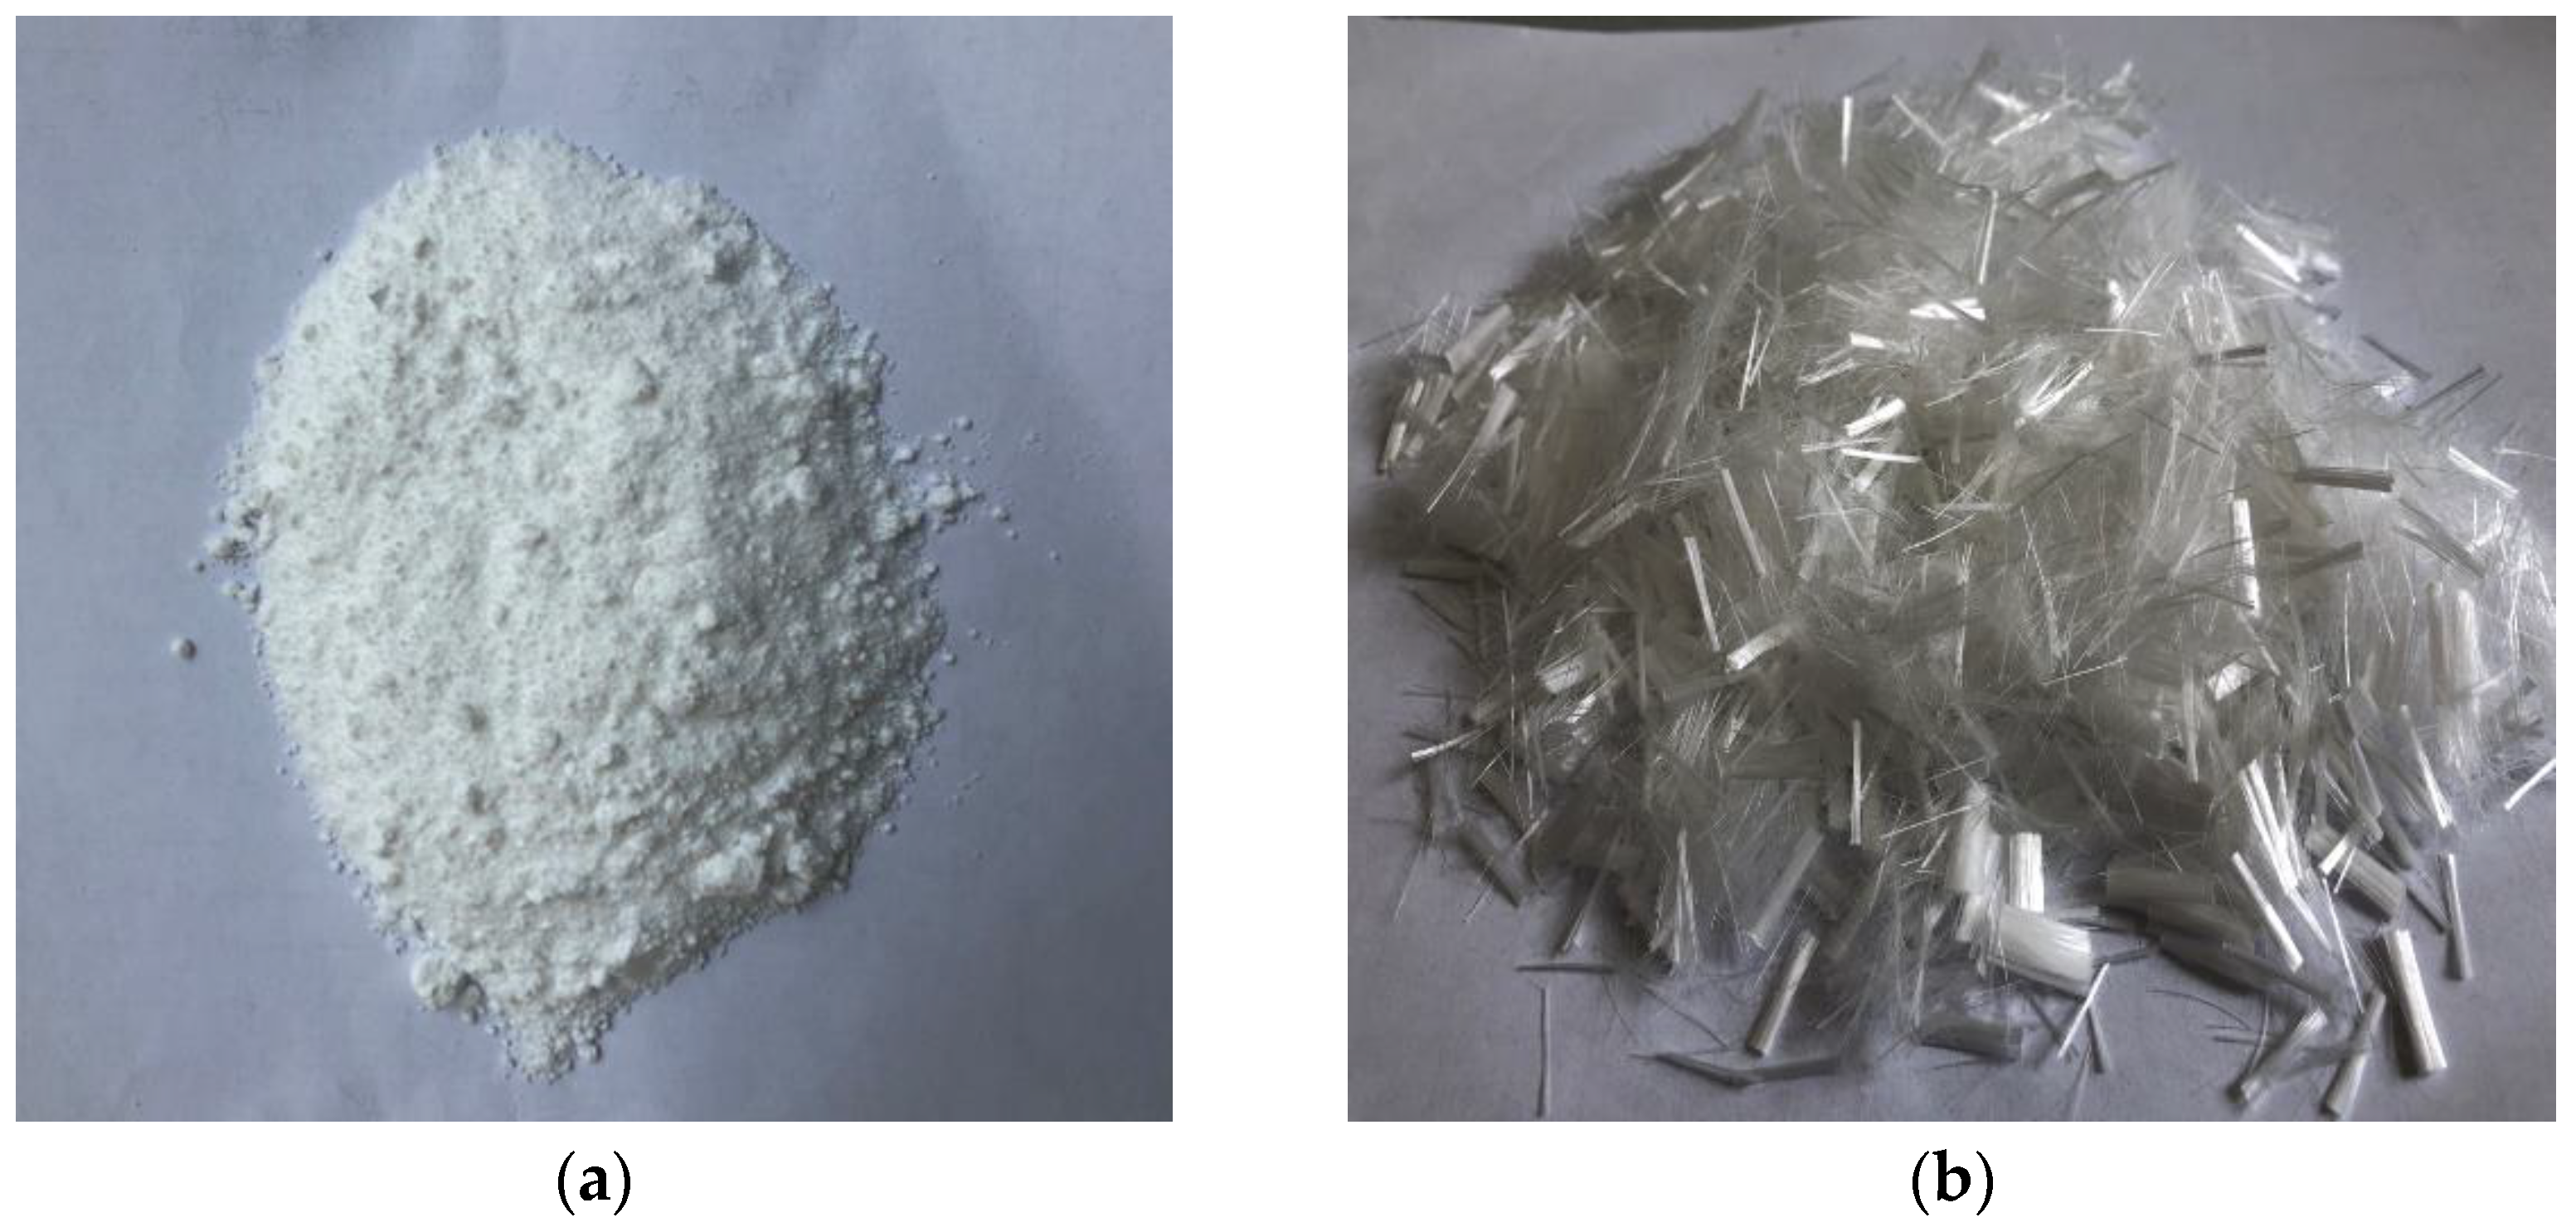
2.1. Materials
2.2. Specimen Preparation
- (1)
- Weighing the cement, sand, FA, NS, PVA fiber, water, and superplasticizer;
- (2)
- Dry-mixing the sand, cement, NS, FA, and superplasticizer for 2 min;
- (3)
- Adding water to the dry mixture and continuing to mix for 2 min;
- (4)
- Adding PVA fiber to the mixture with a certain fluidity along the stirring direction, and then stirring for 3 min;
- (5)
- Pouring the mixed mortar into molds prepared with pre-embedded steel rebar and ensuring good compaction;
- (6)
- Smoothing the surface of the specimens and wrapping the exposed steel rebar to prevent corrosion;
- (7)
- Demolding the specimens after 24 h and then curing them for 28 days in the curing room;
- (8)
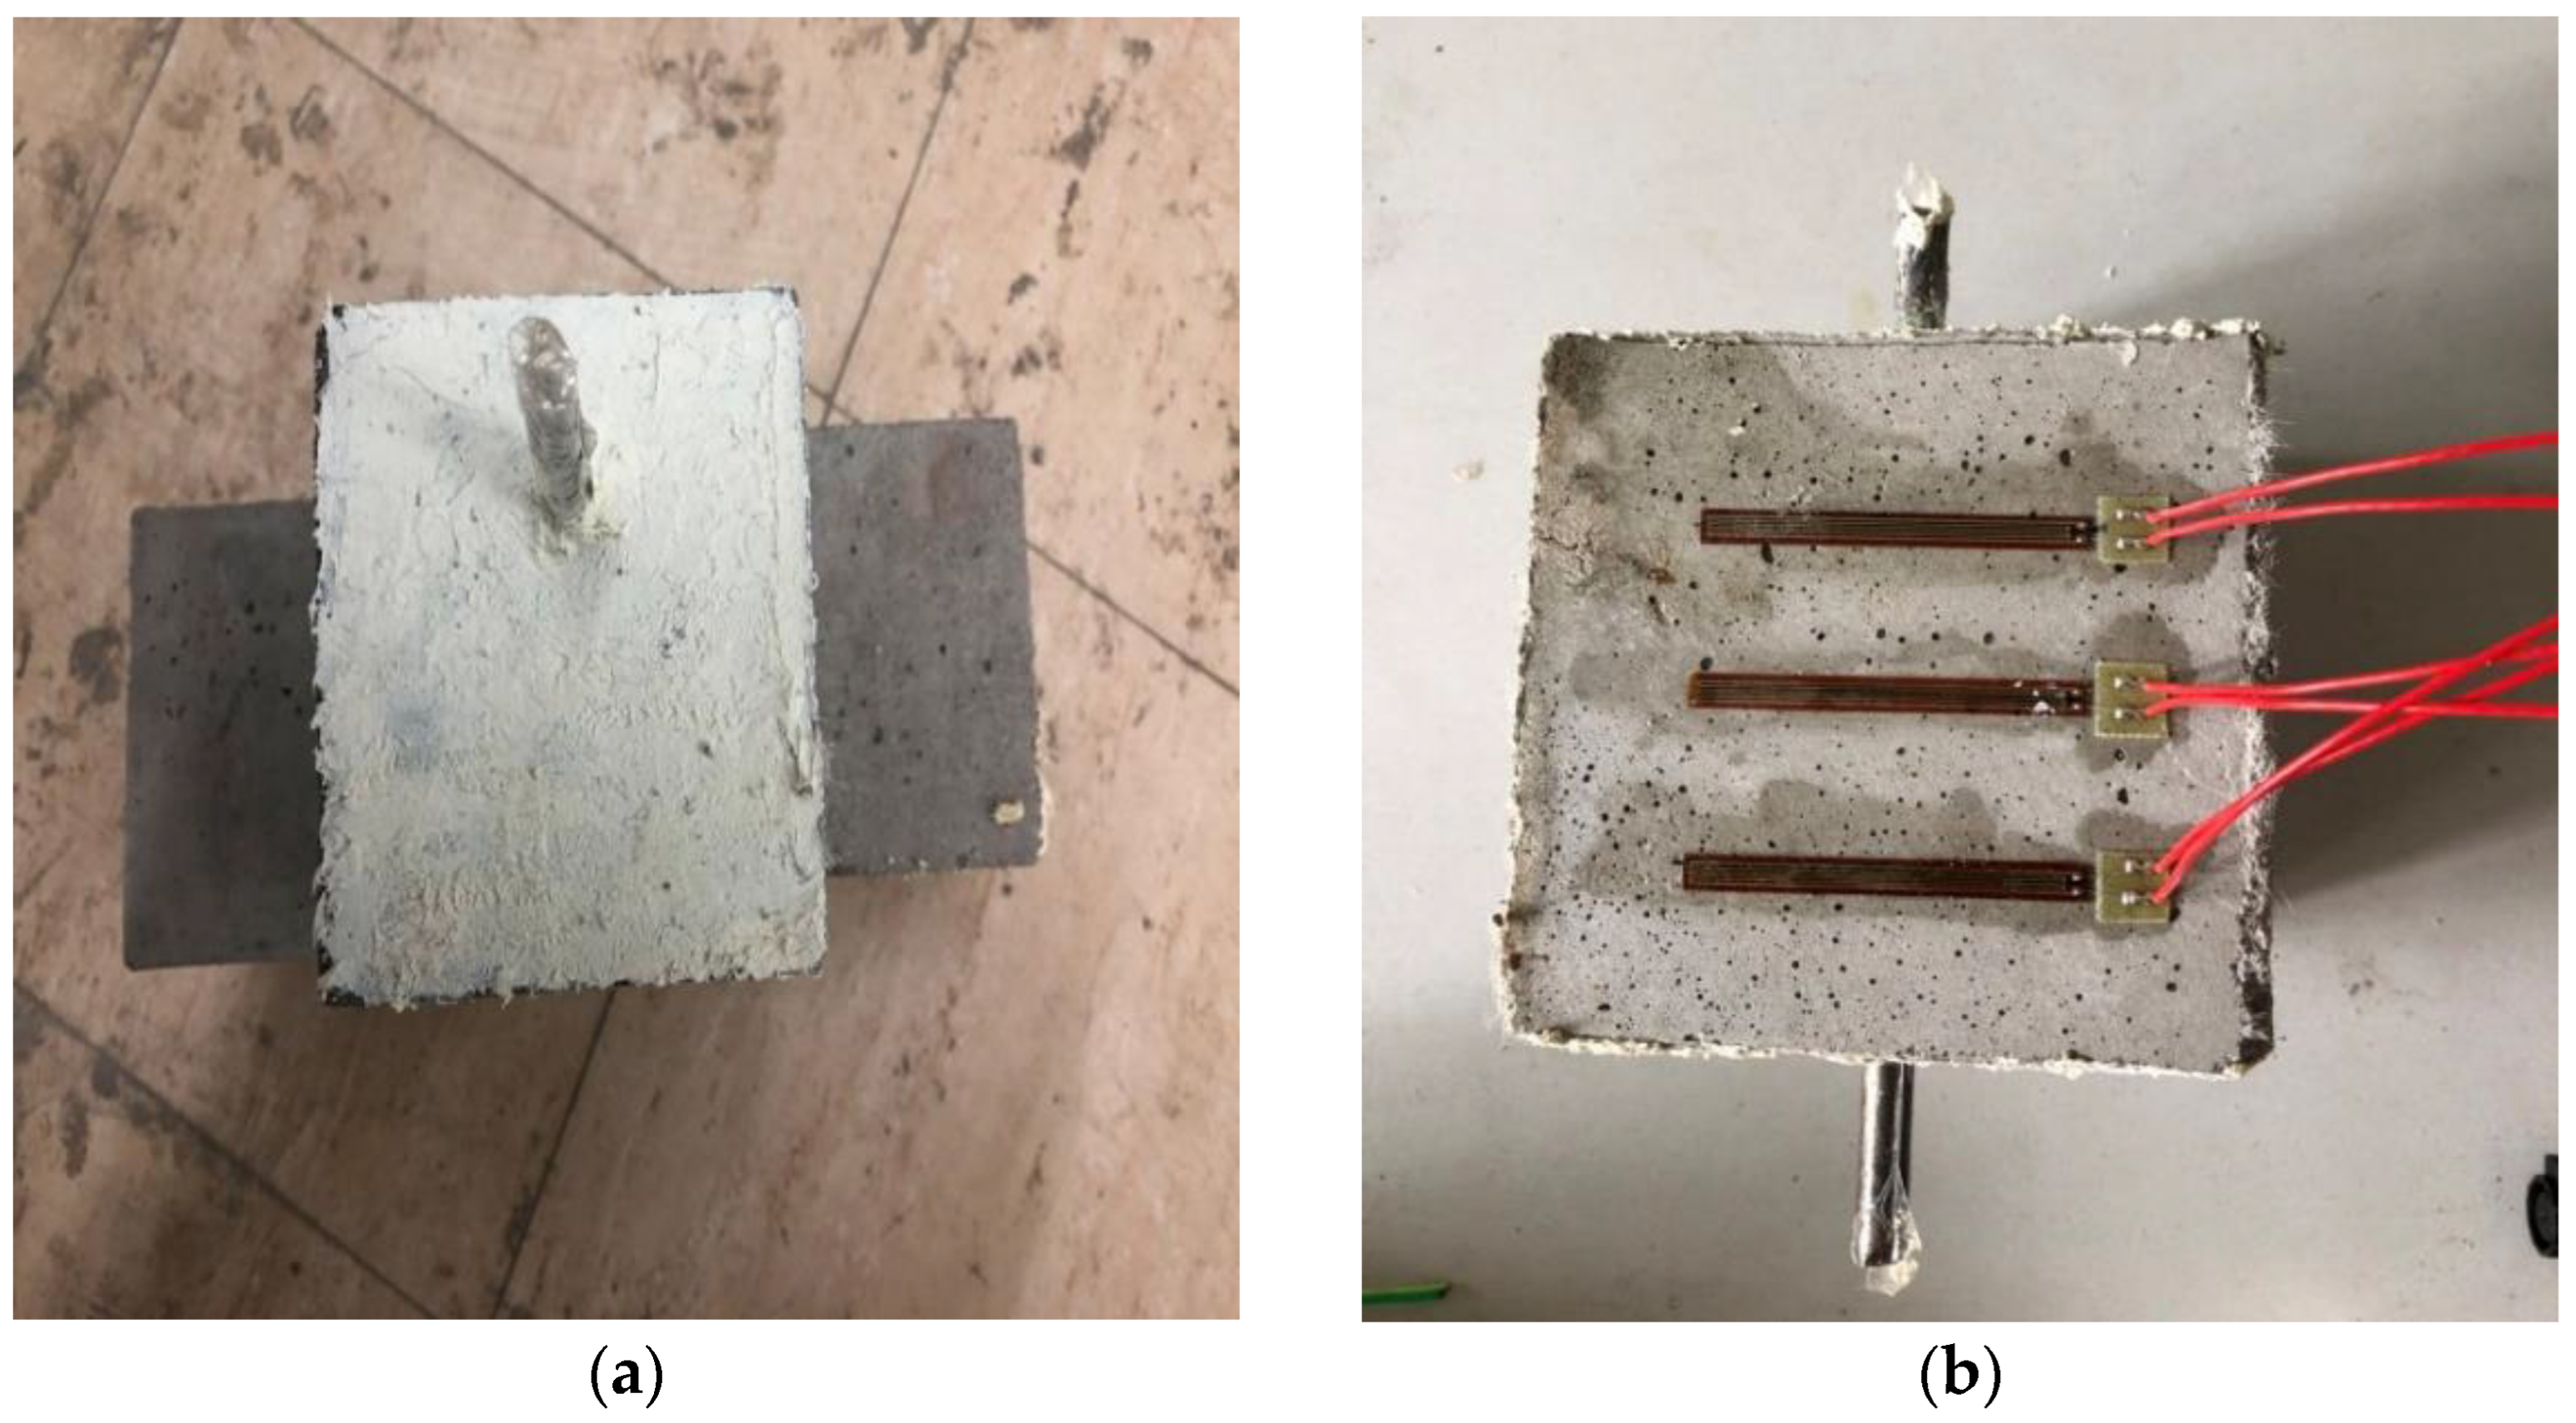
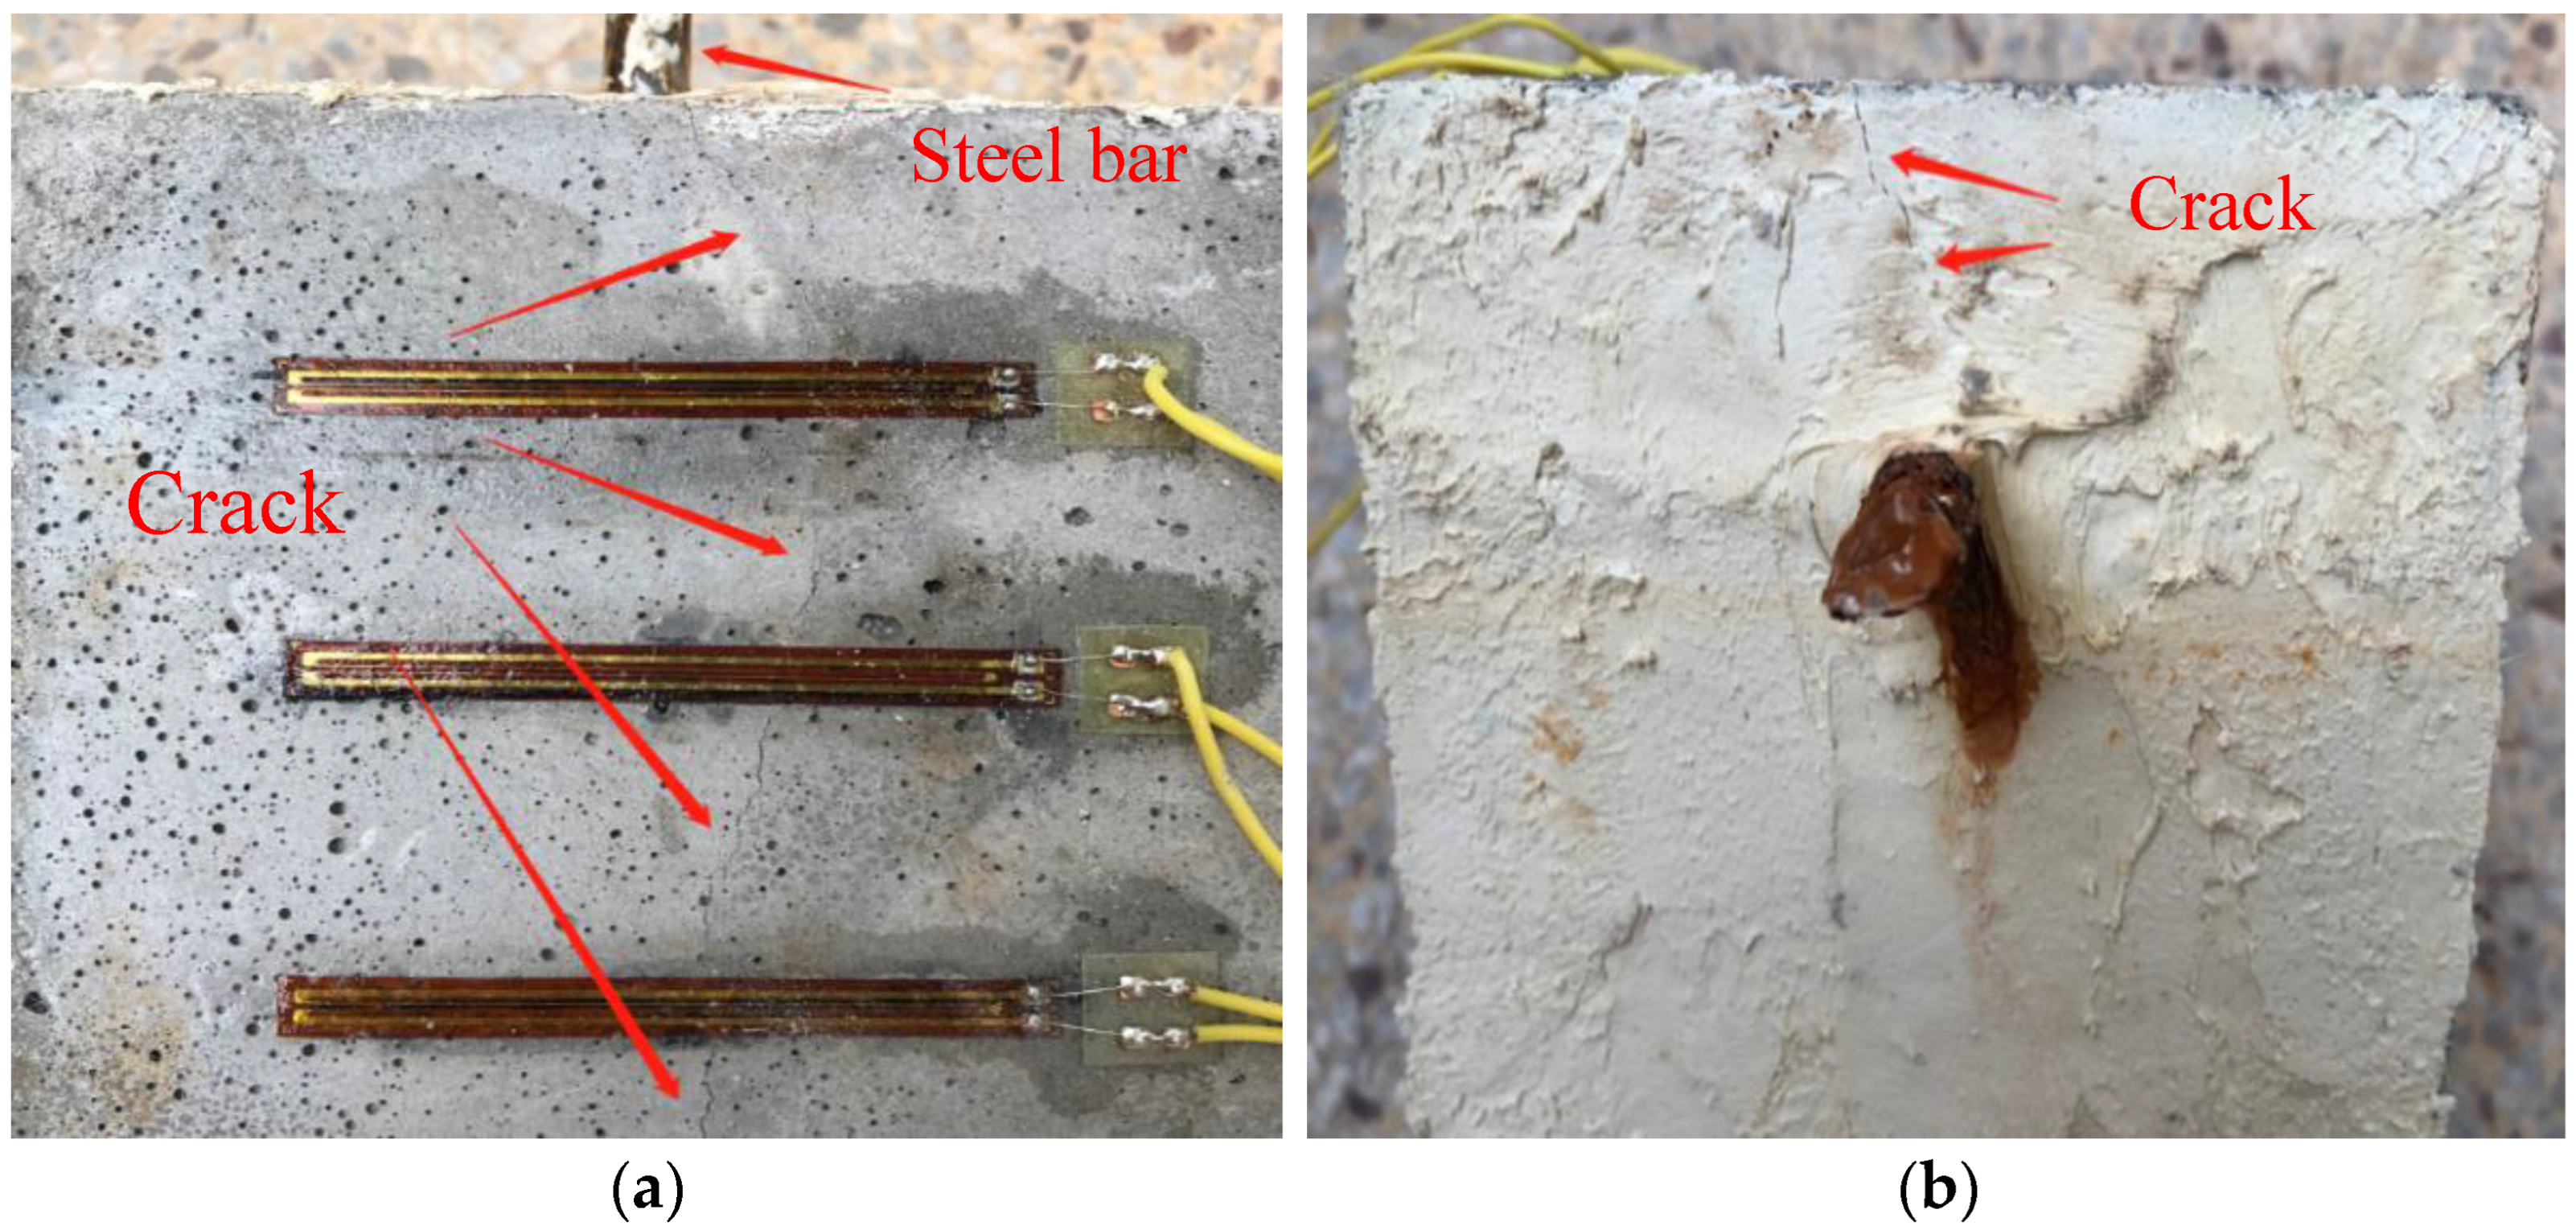
- Two days before the test, coating both sides of the exposed steel rebars with epoxy resin to prevent the solution from contacting the steel rebar through the surface (preventing “neck brittleness” damage, as shown in Figure 2a);
- (9)
- Pasting 3-strain gauges on the surface, 25 mm away from the steel rebar (as shown in Figure 2b).
2.3. Experimental Methods
2.3.1. Mechanical Performance Test
2.3.2. Water Absorption Test
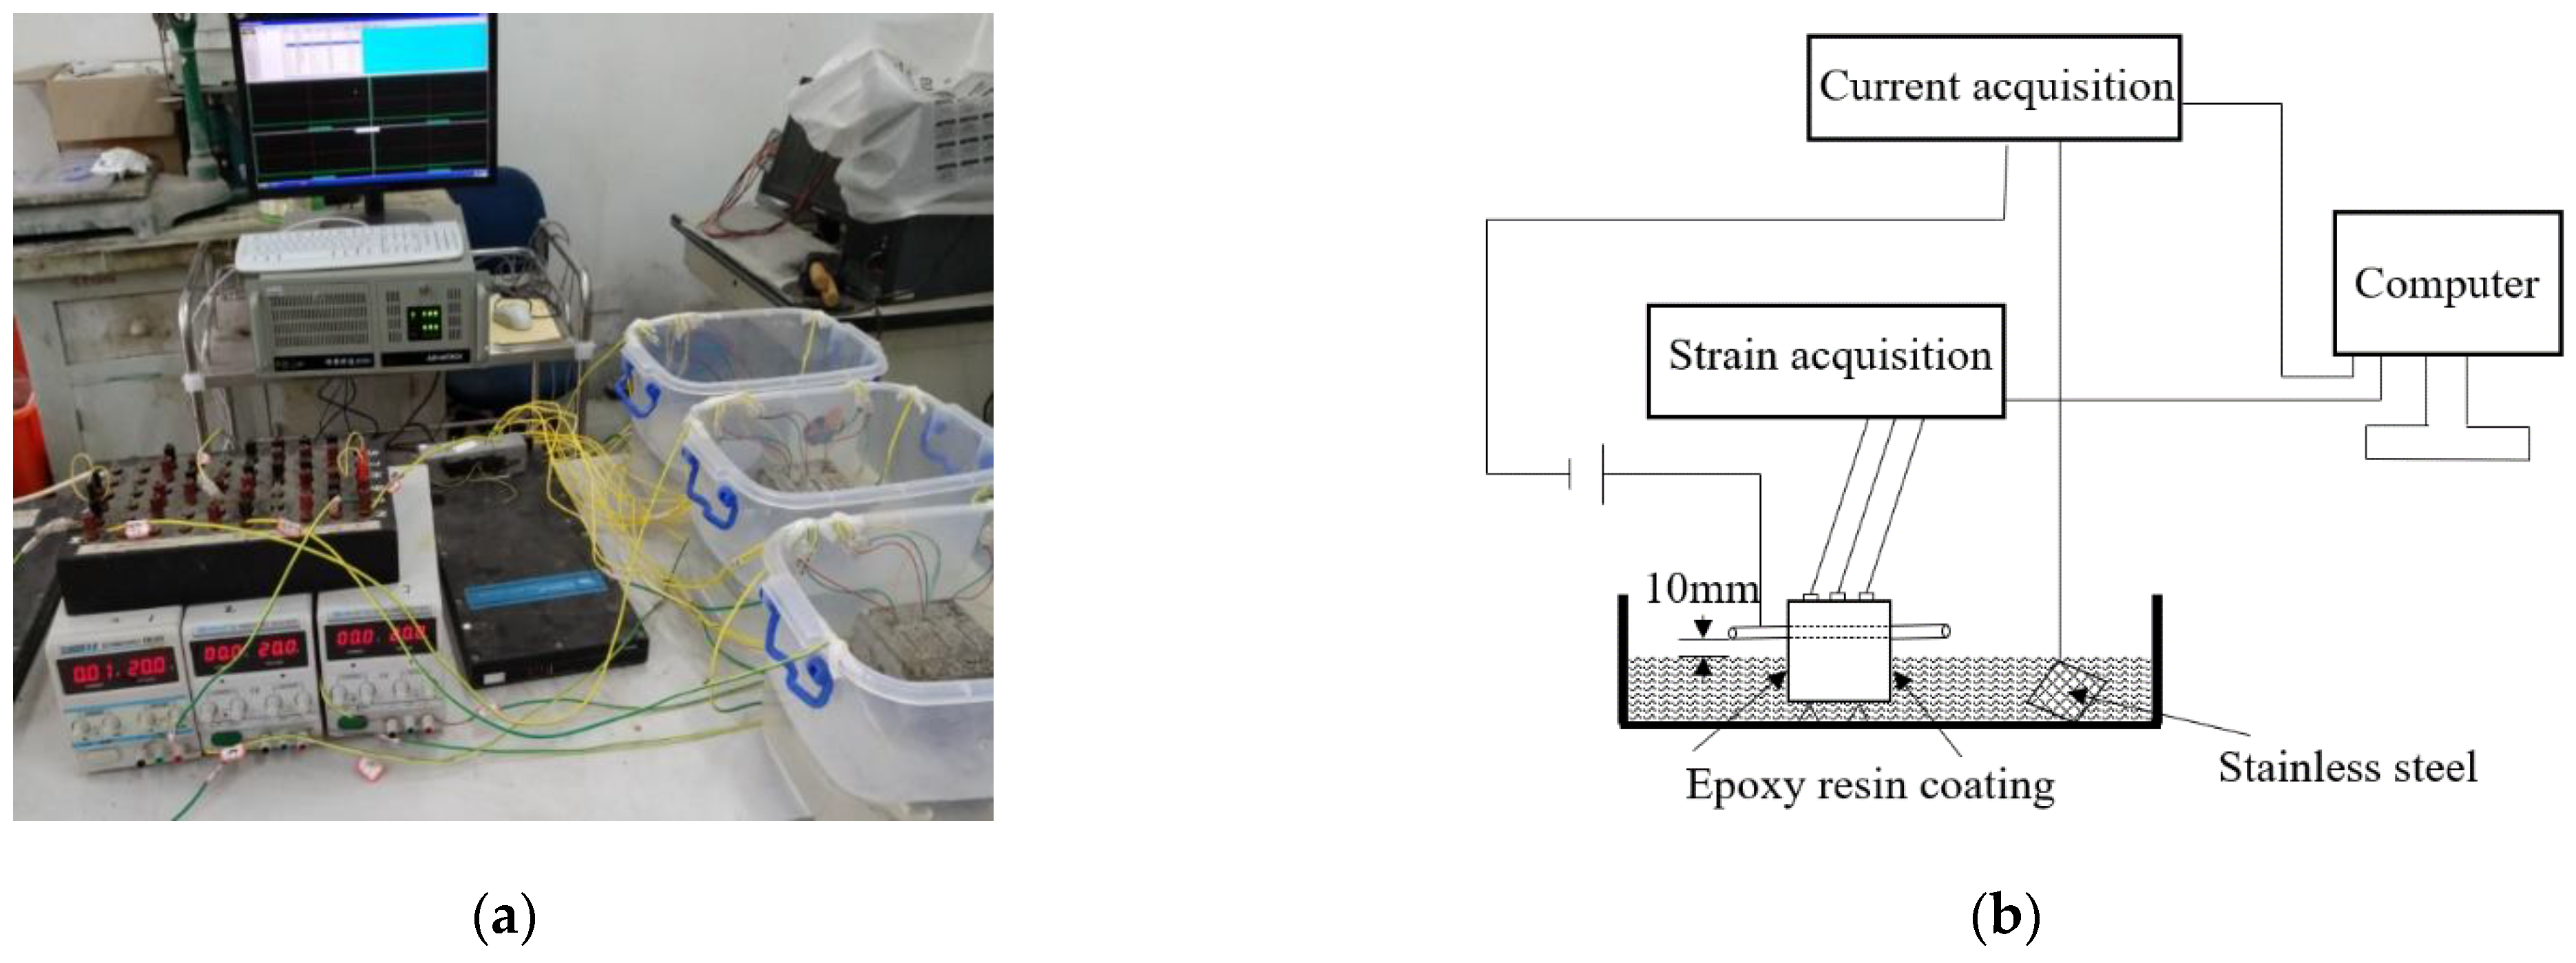
2.3.3. Impressed Voltage Accelerated Corrosion Test
3. Results and Discussion
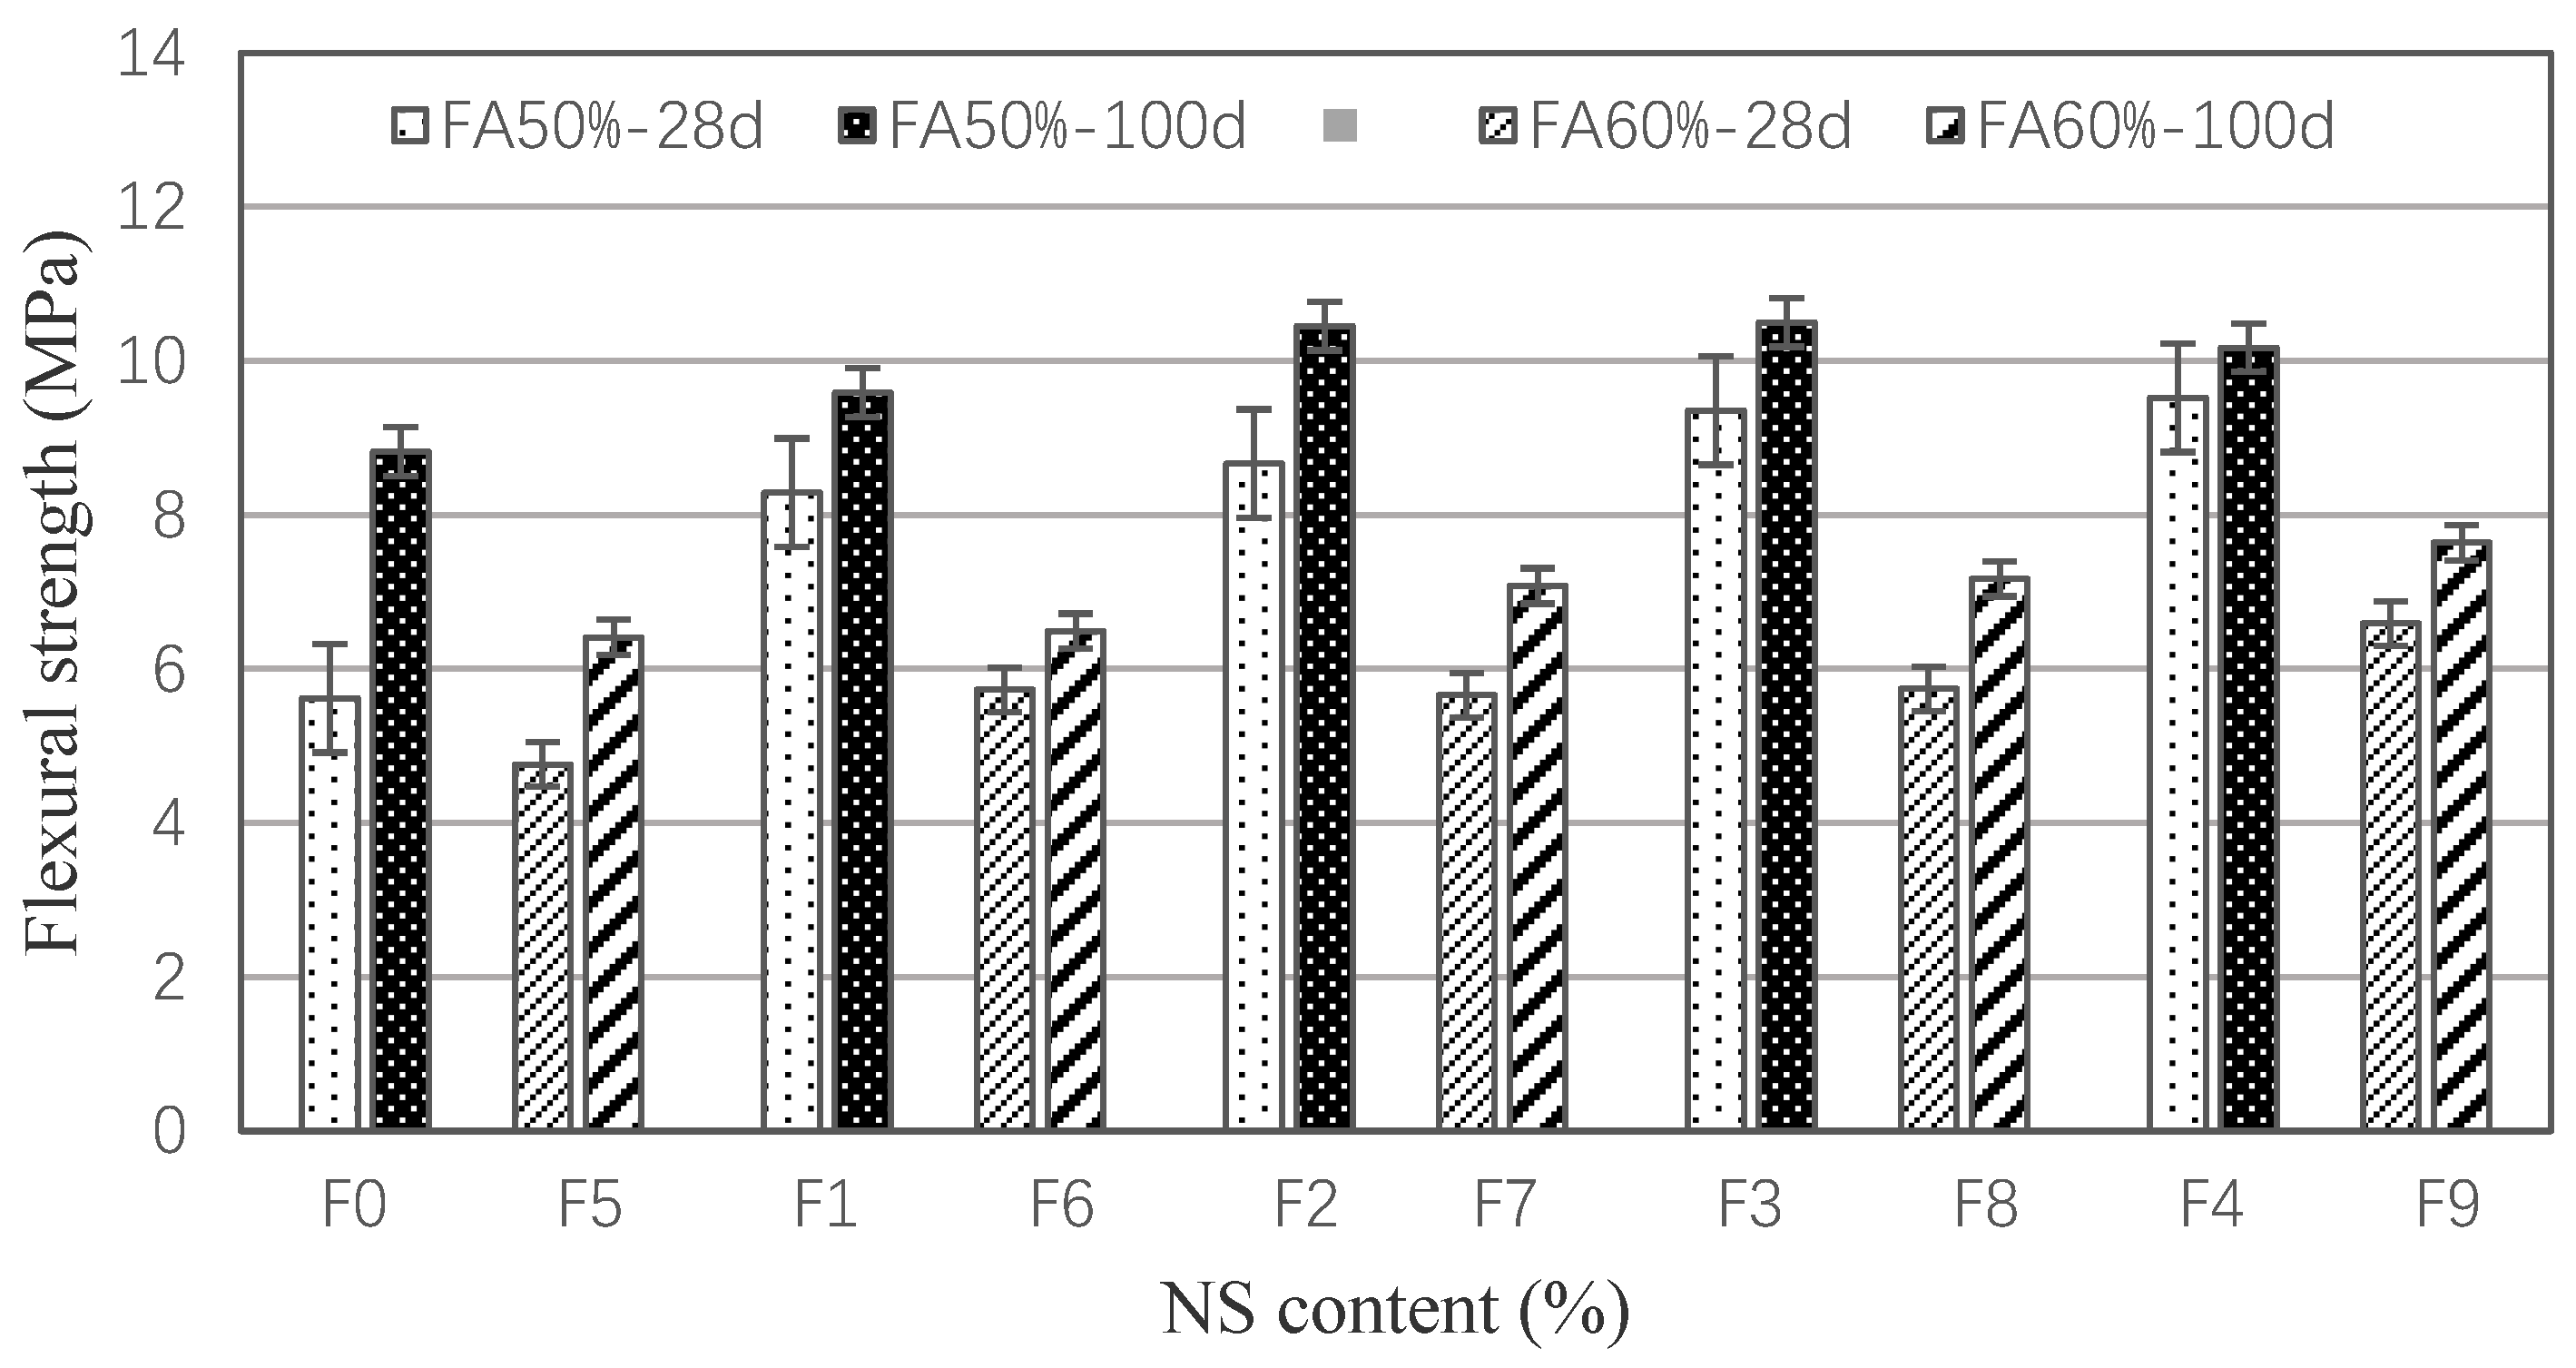
3.1. Mechanical Performance
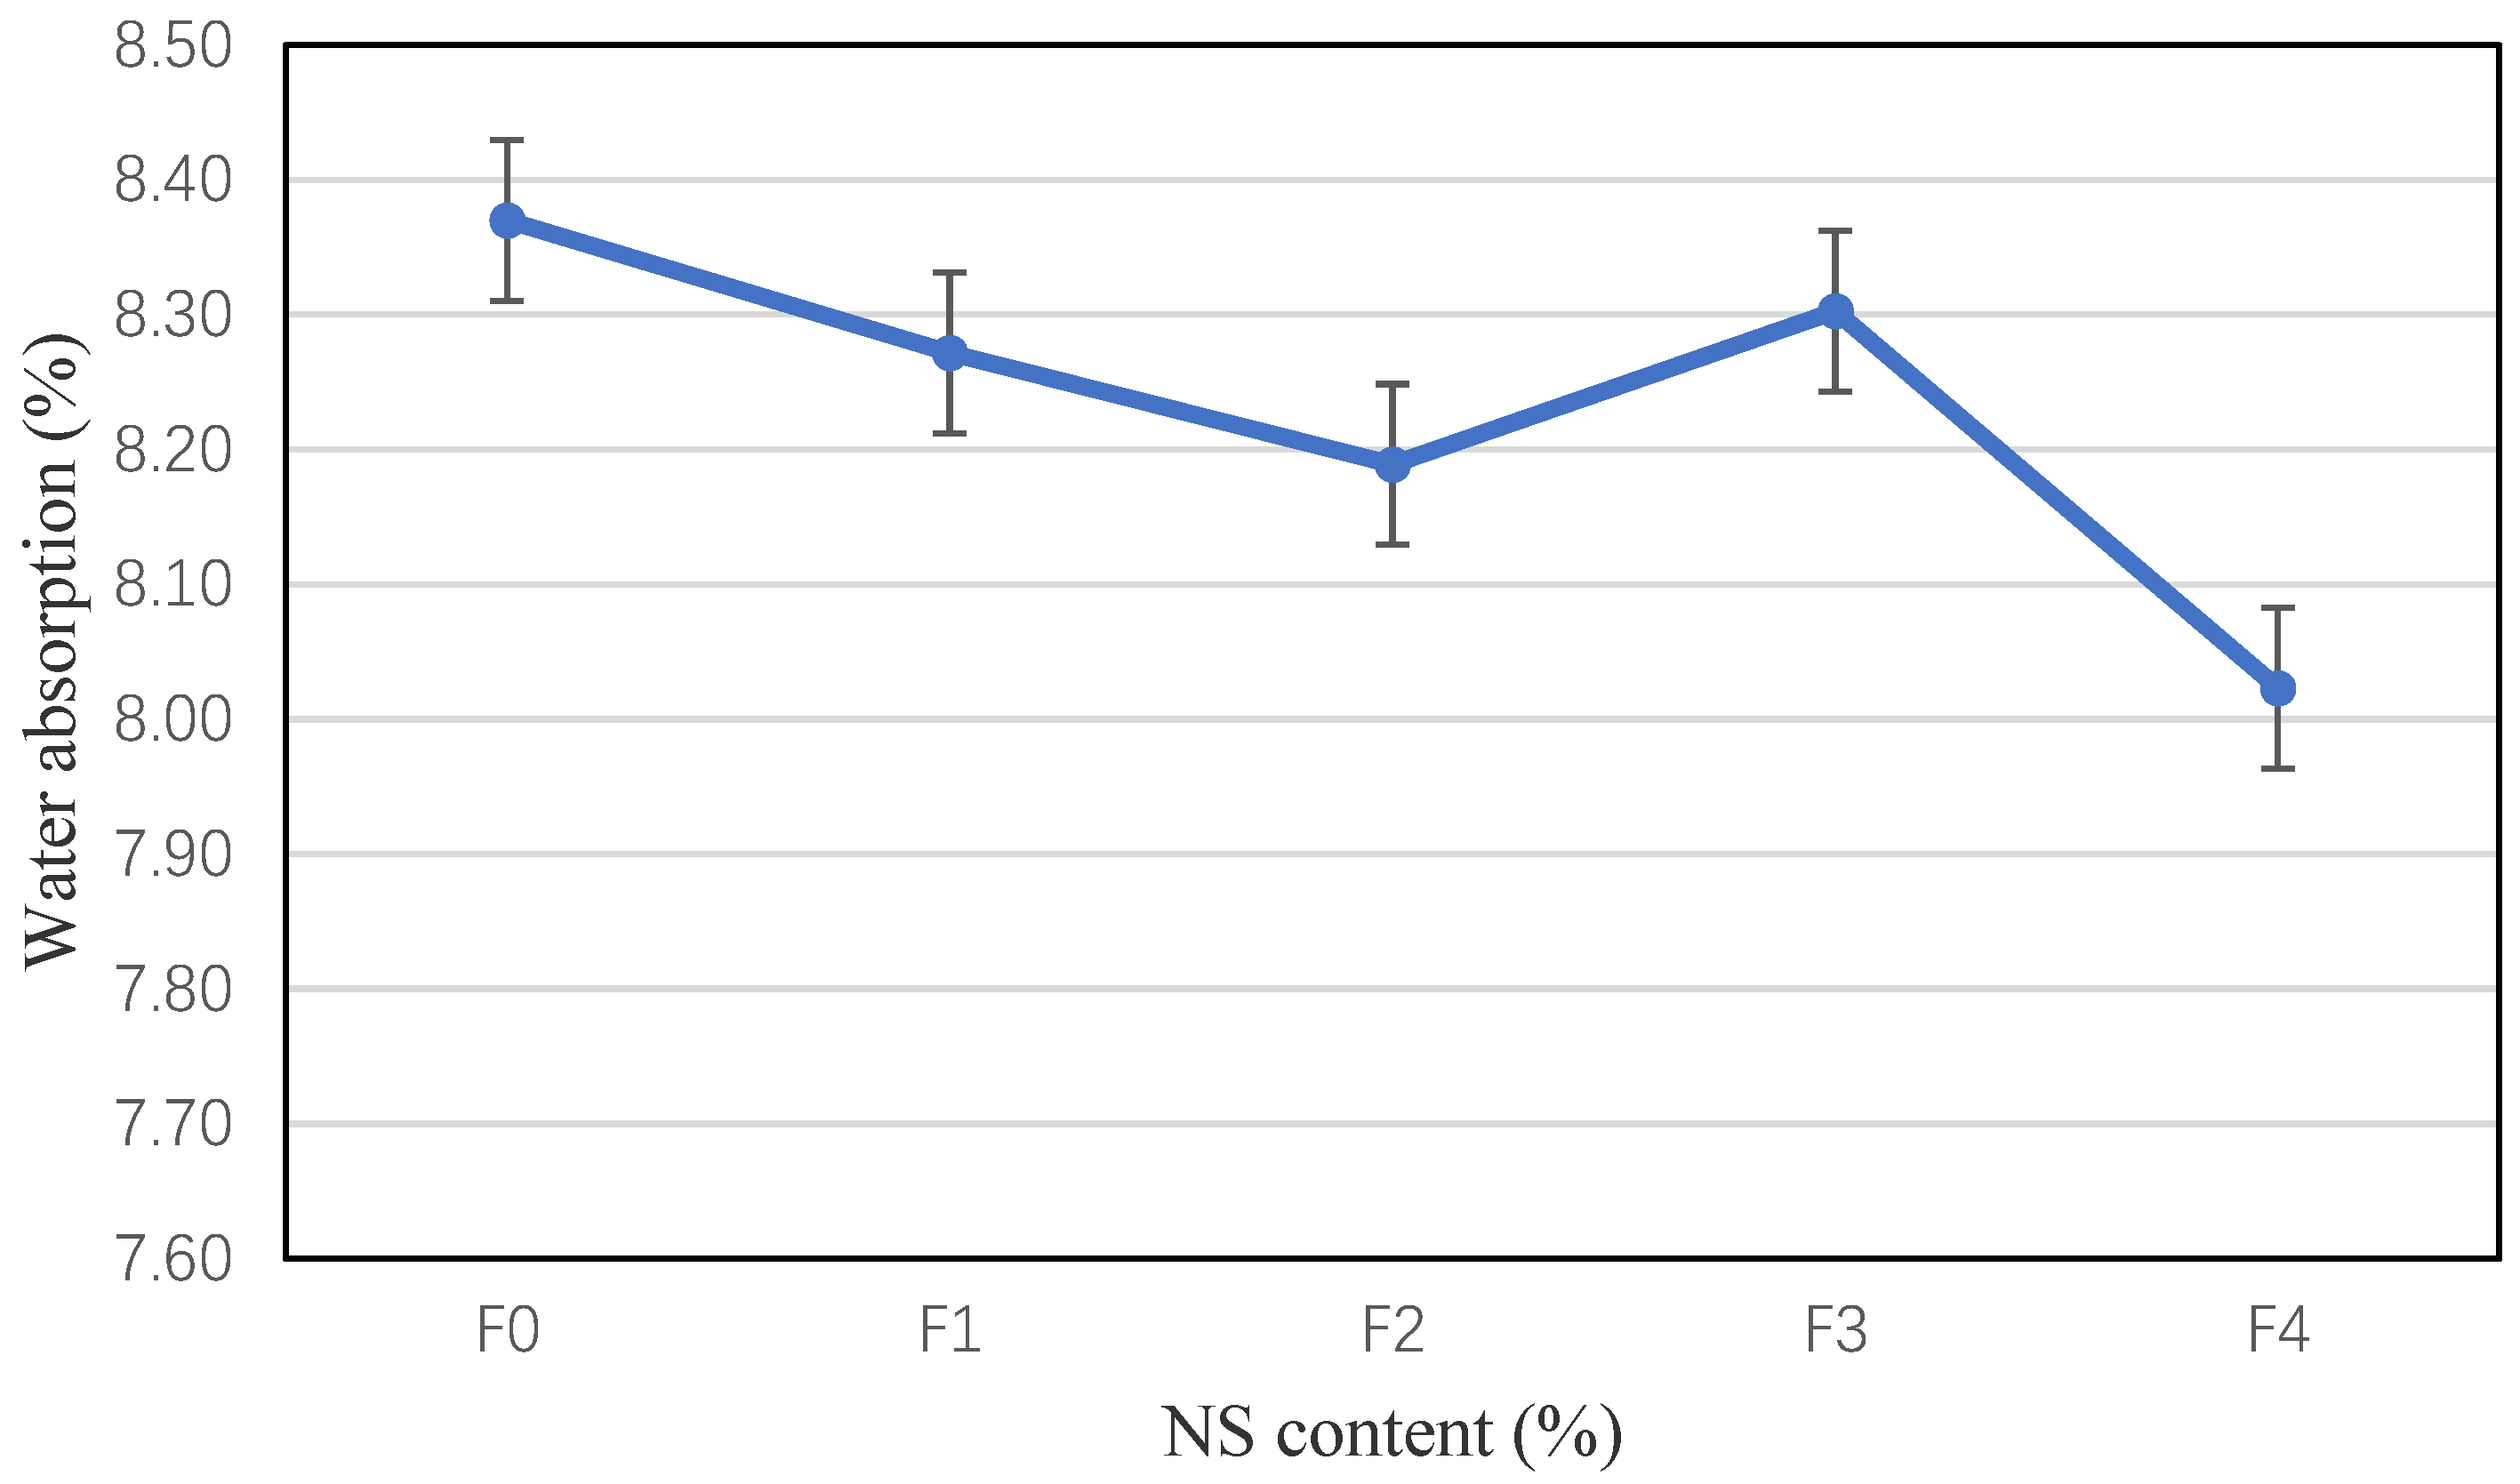
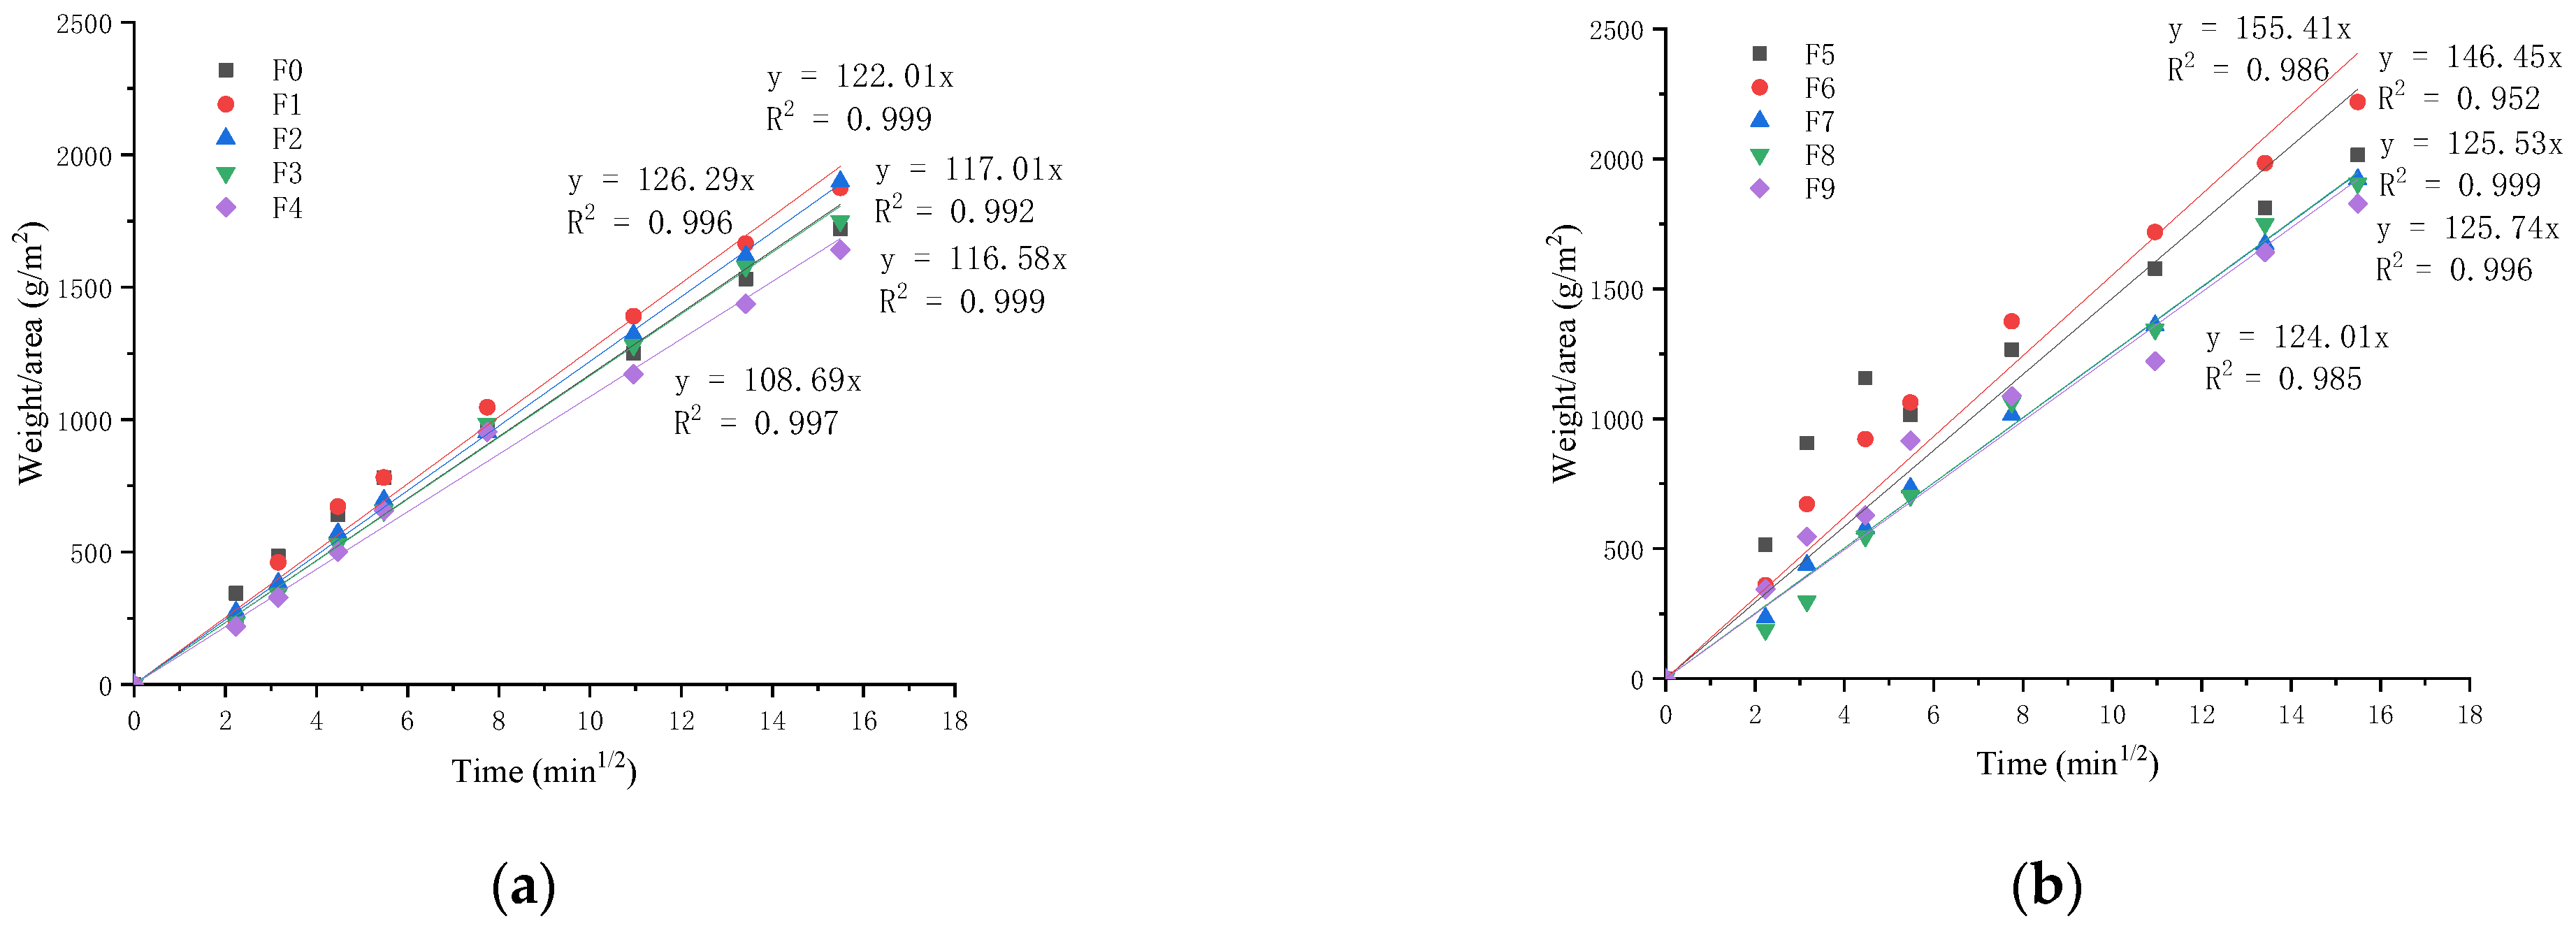
3.2. Water Absorption
3.3. Test Result of Accelerated Corrosion
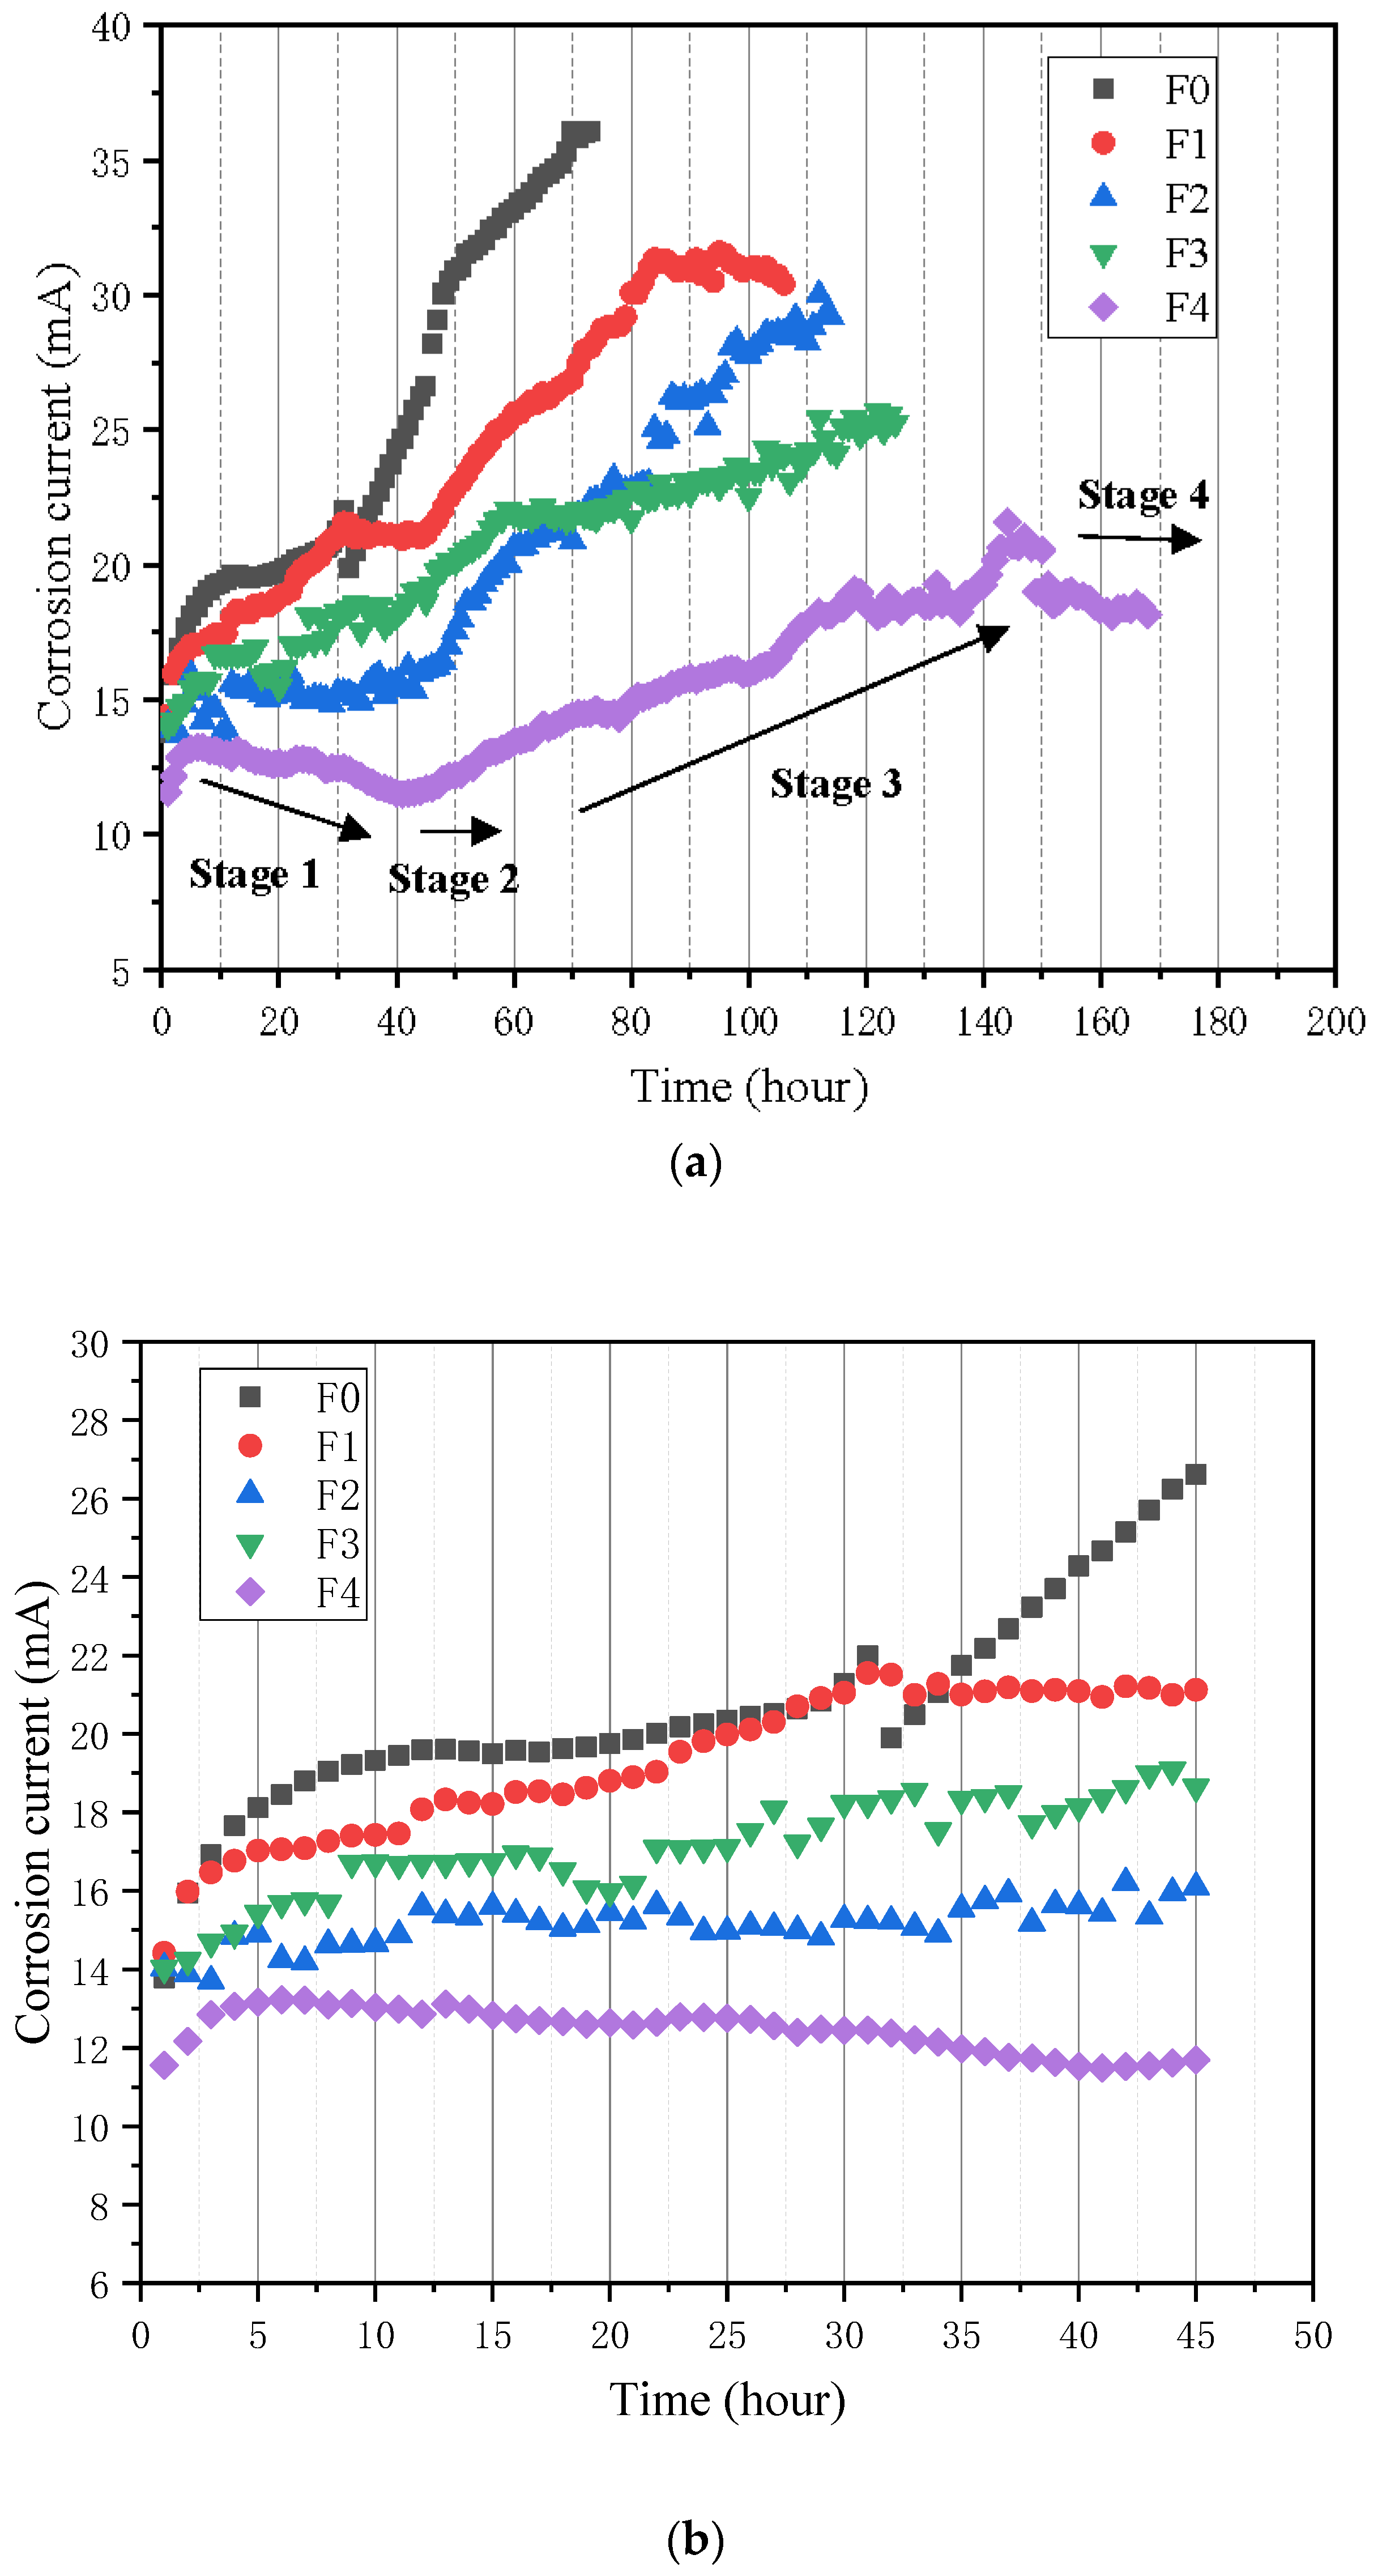
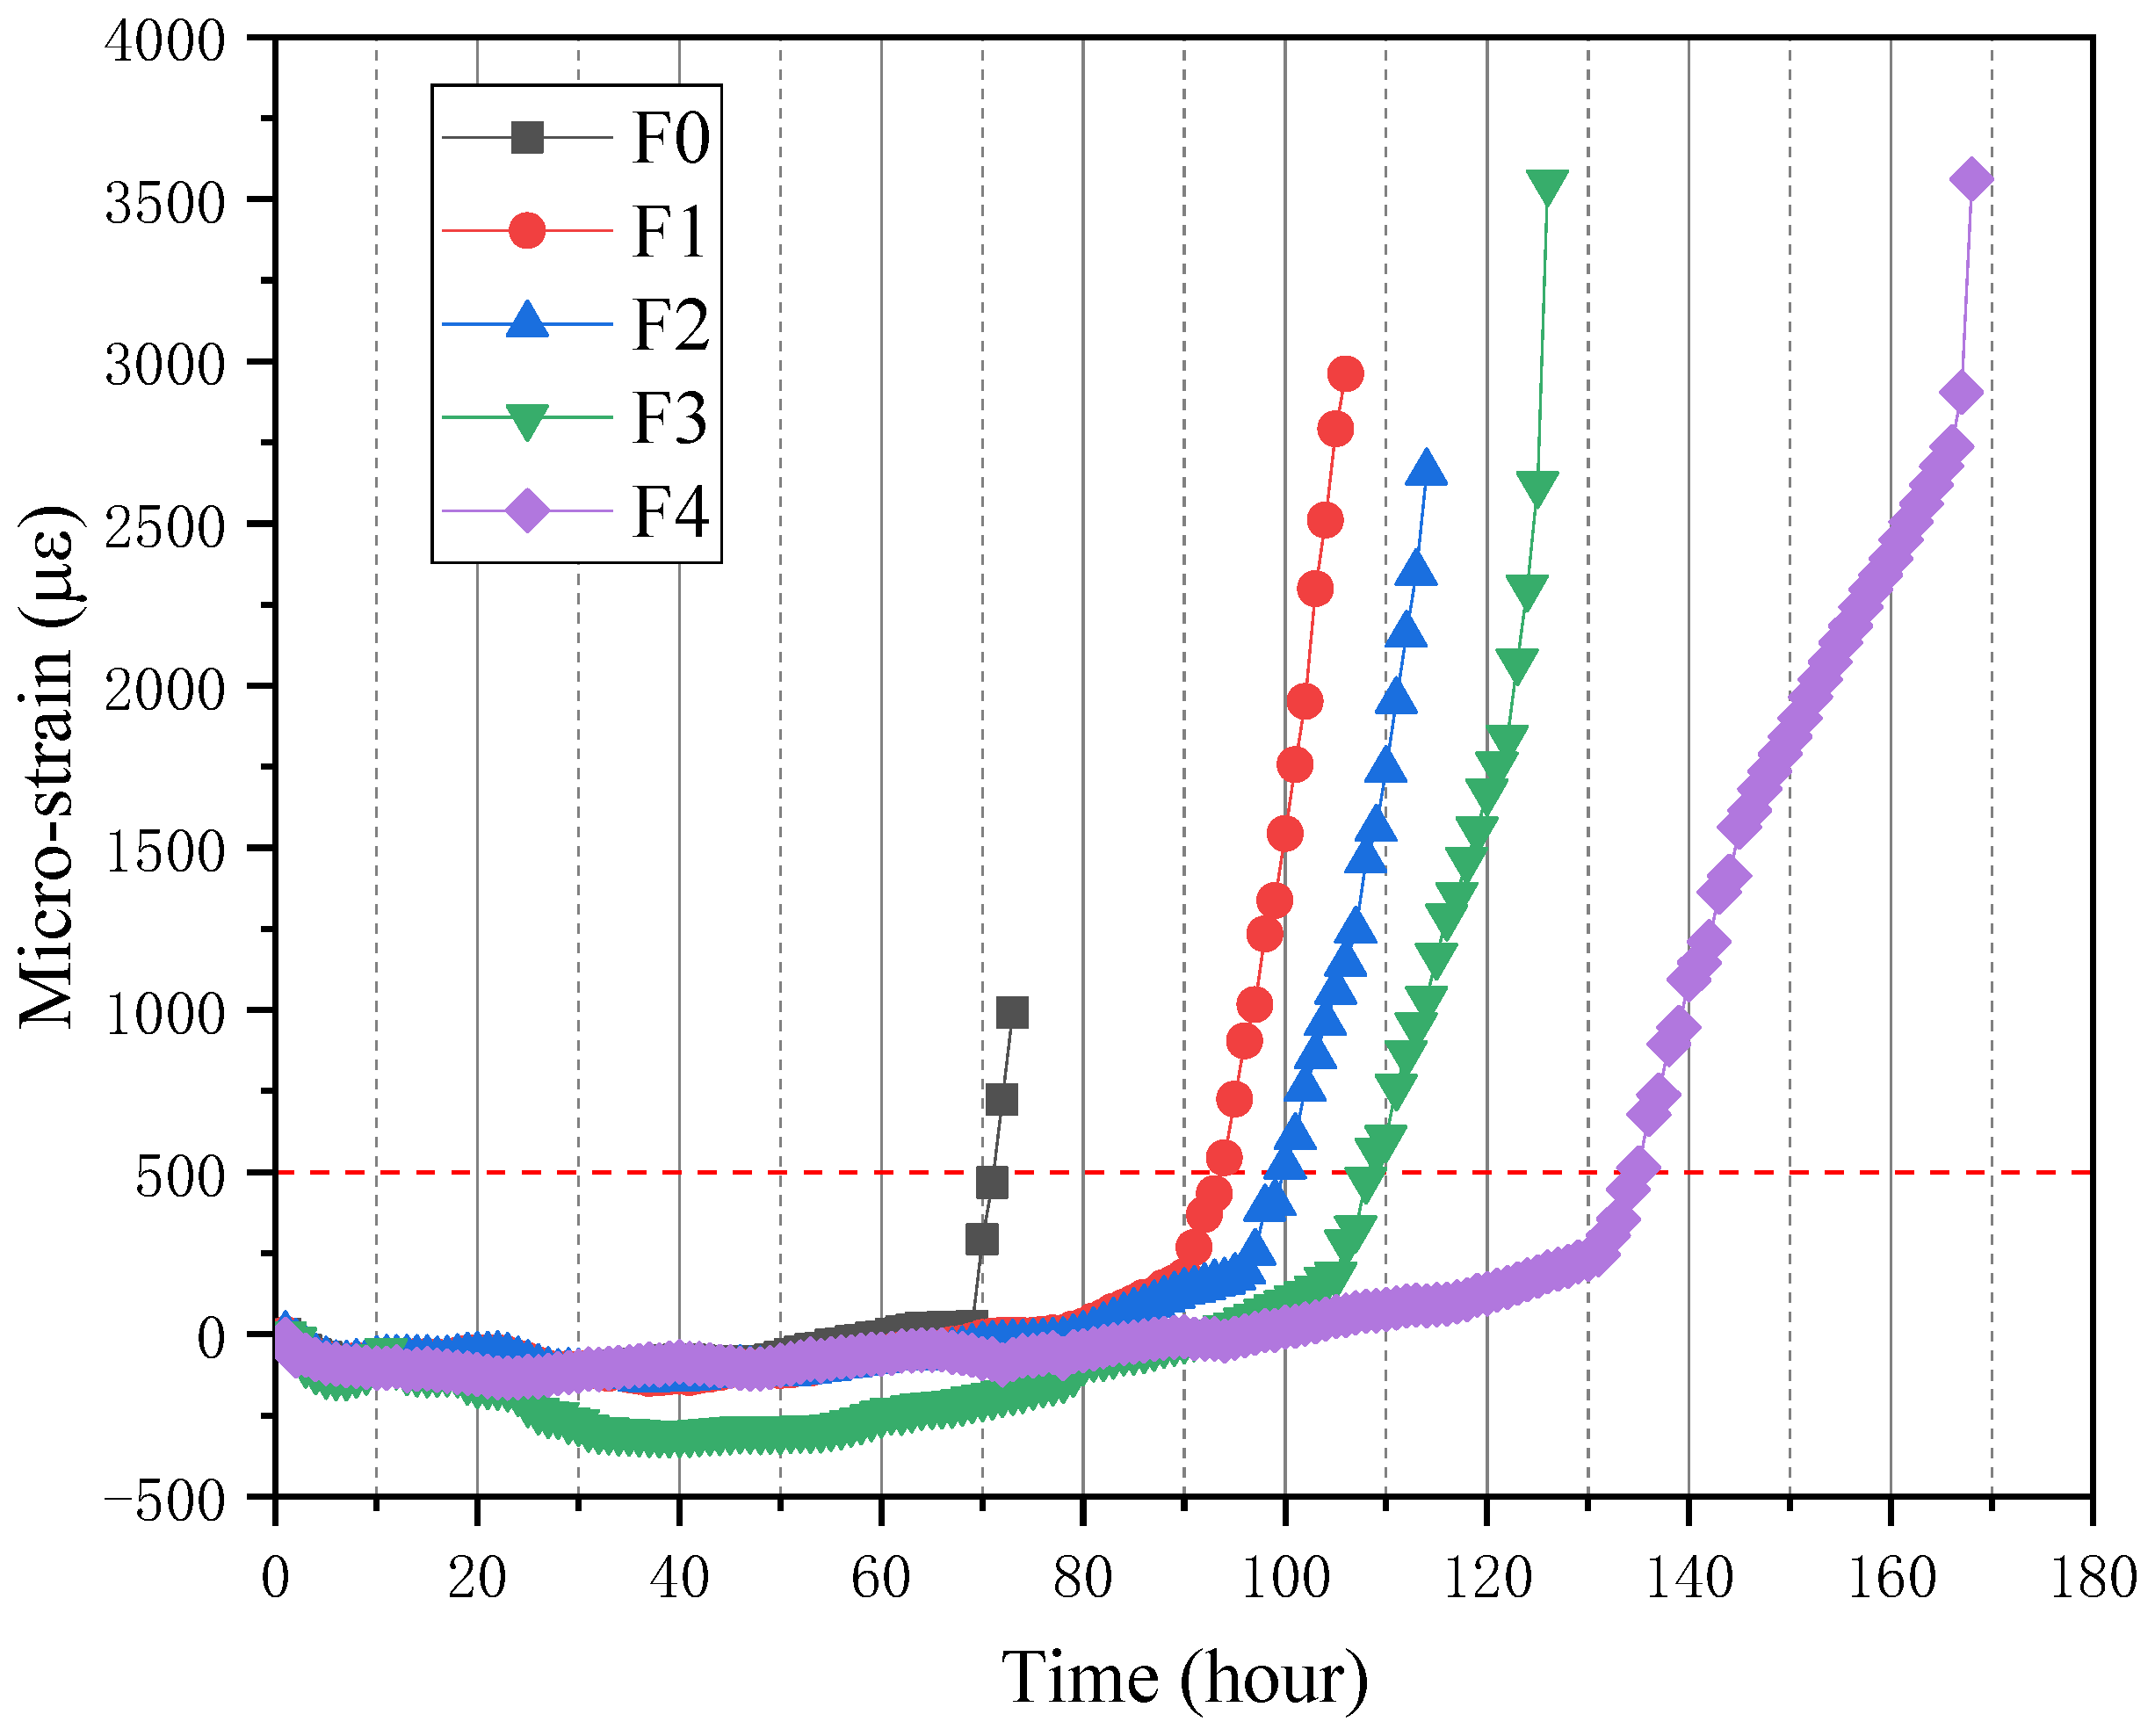
3.3.1. Impressed Current
3.3.2. Cracking Characteristics of Mortar Cover
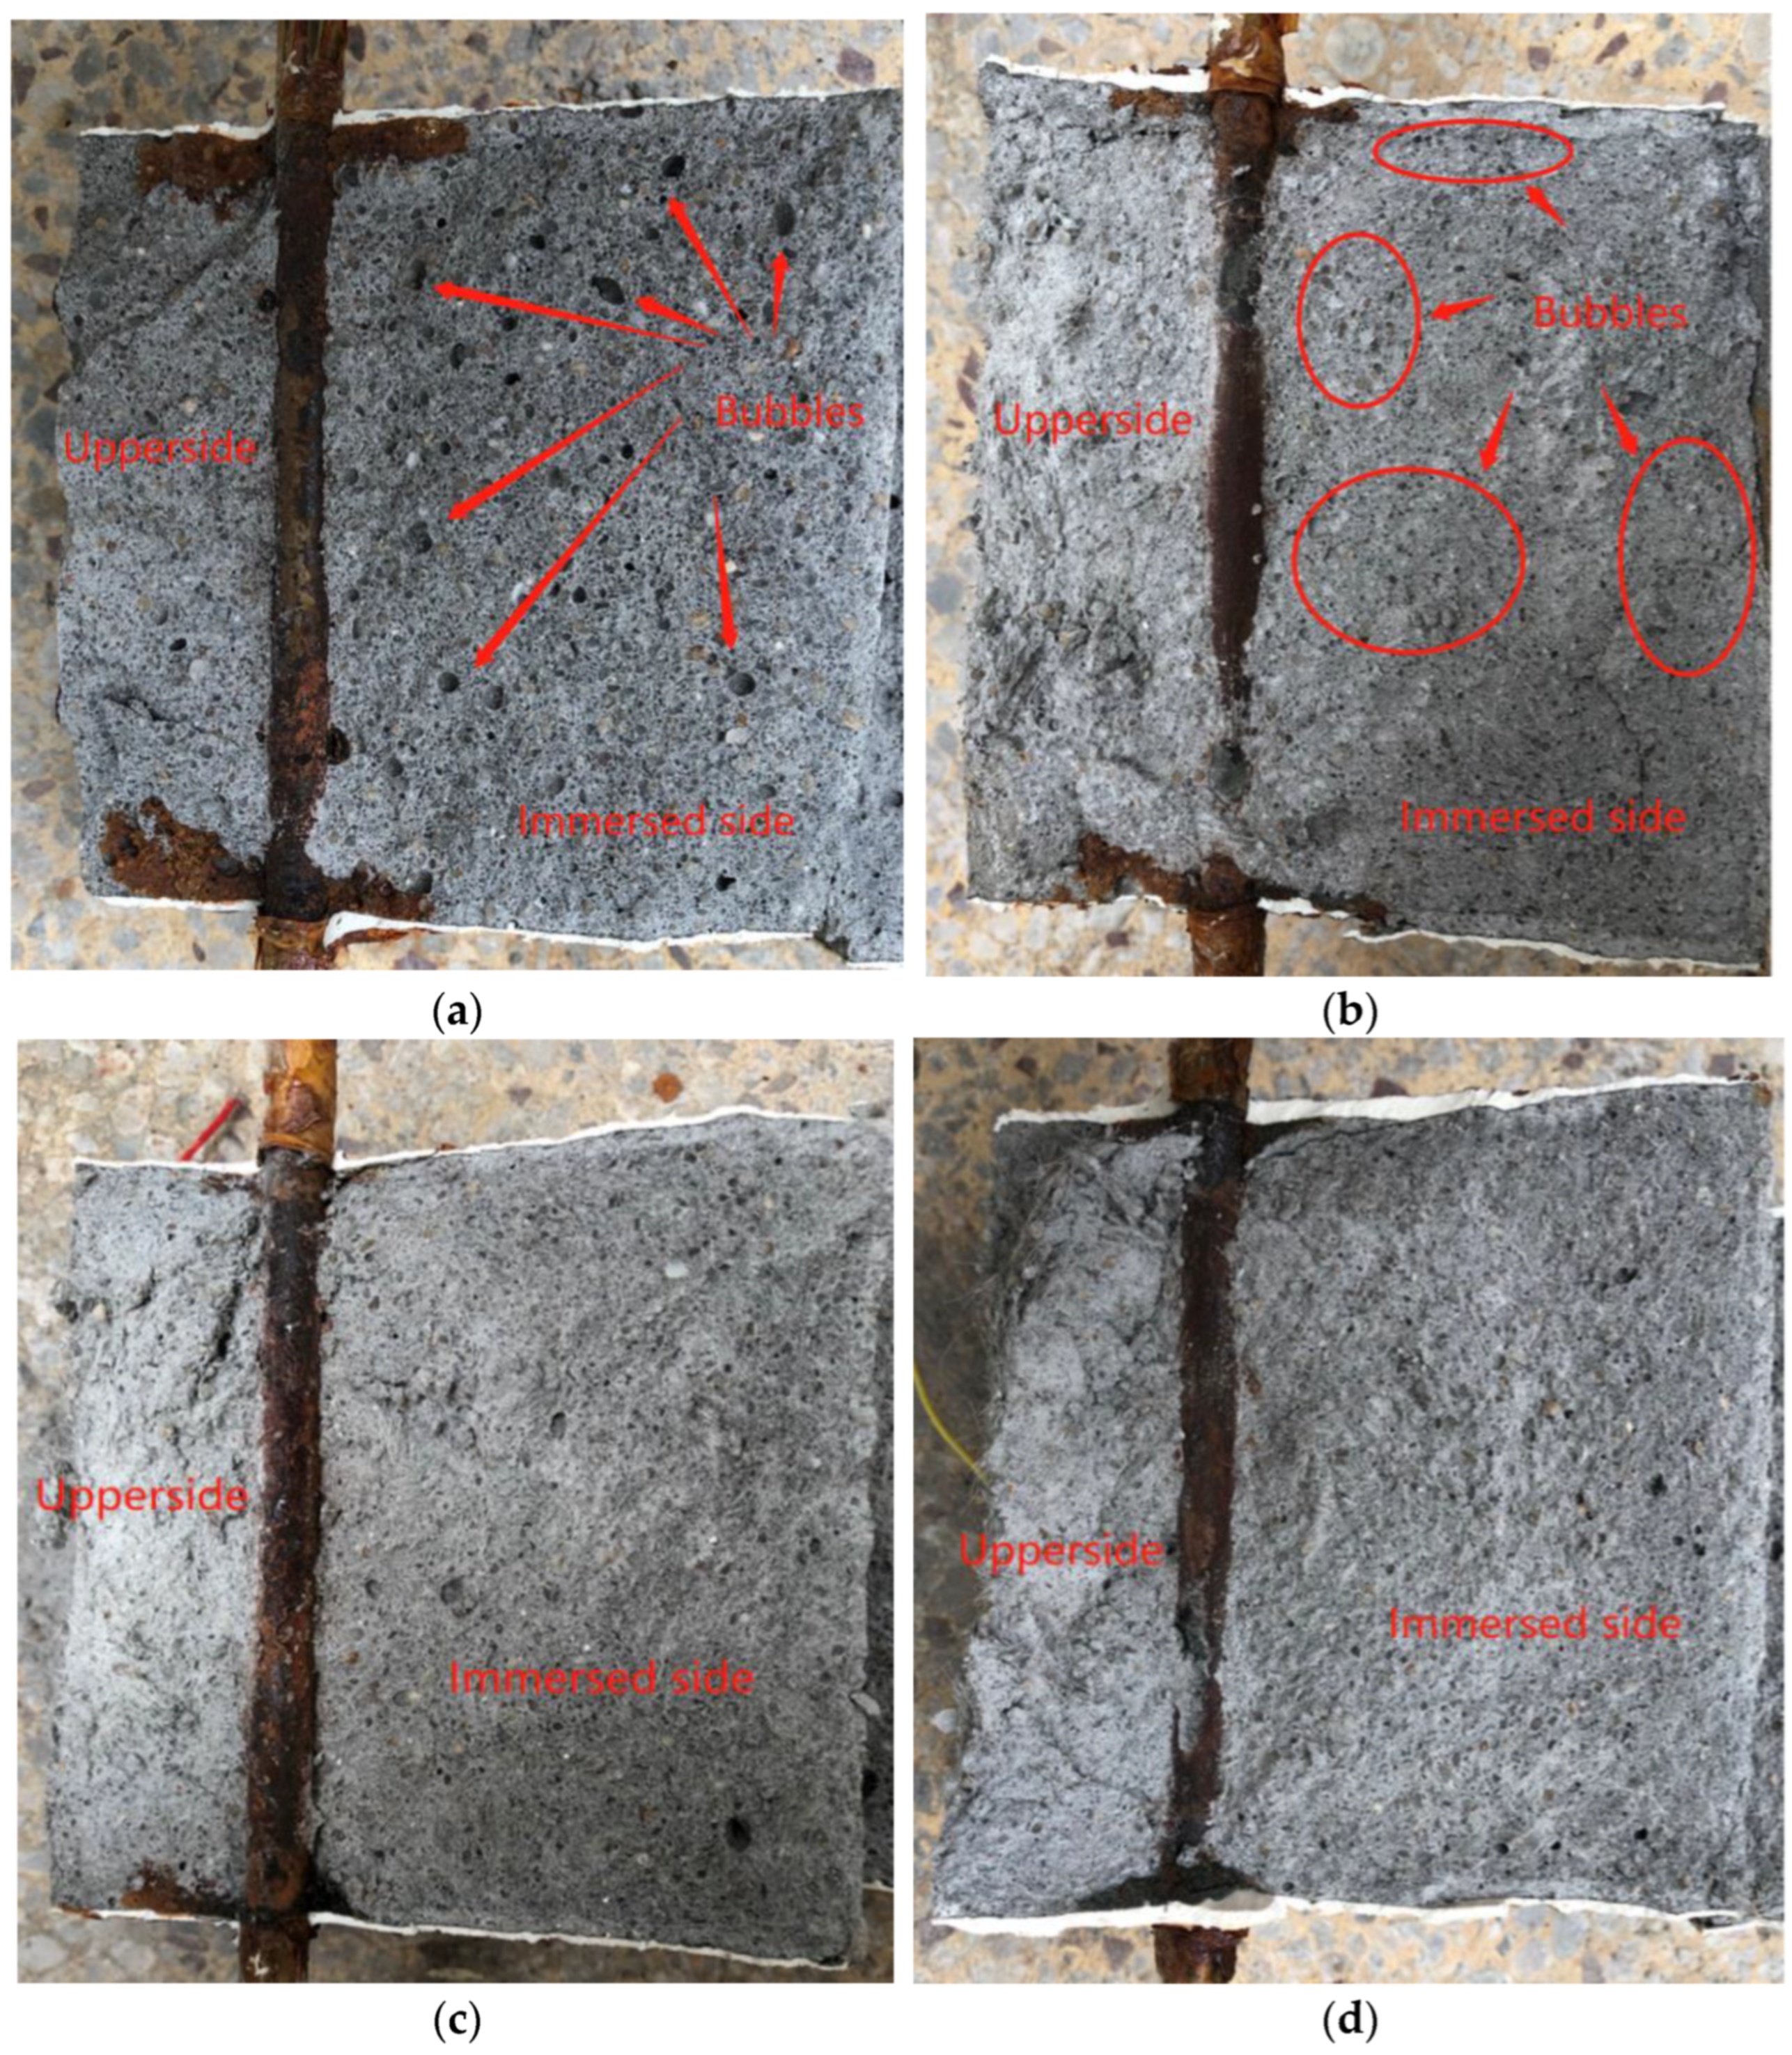
3.3.3. Mass Loss of Steel Rebar and Rust Distribution
4. Conclusions
Author Contributions
Funding
Data Availability Statement
Conflicts of Interest
References
- Gholampour, A.; Ozbakkaloglu, T. Performance of sustainable concretes containing very high volume Class-F fly ash and ground granulated blast furnace slag. J. Clean. Prod. 2017, 162, 1407–1417. [Google Scholar] [CrossRef]
- Yu, J.; Li, G.; Leung, C.K.Y. Hydration and physical characteristics of ultrahigh-volume fly ash-cement systems with low water/binder ratio. Constr. Build. Mater. 2018, 161, 509–518. [Google Scholar] [CrossRef]
- Jin, Z.; Xiong, C.; Zhao, T.; Du, Y.; Zhang, X.; Li, N.; Yu, Y.; Wang, P. Passivation and depassivation properties of Cr–Mo alloyed corrosion-resistant steel in simulated concrete pore solution. Cement Concr. Compos. 2022, 126, 104375. [Google Scholar] [CrossRef]
- Kumar Das, J.; Pradhan, B. Effect of sodium nitrite on chloride-induced corrosion of steel in concrete. Mater. Today Proc. 2022. [Google Scholar] [CrossRef]
- Hu, J.; Zhu, Y.; Hang, J.; Zhang, Z.; Ma, Y.; Huang, H.; Yu, Q.; Wei, J. The effect of organic core–shell corrosion inhibitors on corrosion performance of the reinforcement in simulated concrete pore solution. Constr. Build. Mater. 2021, 267, 121011. [Google Scholar] [CrossRef]
- Angst, U.M.; Elsener, B.; Larsen, C.K.; Vennesland, Ø. Chloride induced reinforcement corrosion: Electrochemical monitoring of initiation stage and chloride threshold values. Corros. Sci. 2011, 53, 1451–1464. [Google Scholar] [CrossRef]
- Yuxi, Z. State-of-art of corrosion-induced cracking of reinforced concrete structures. J. Southeast Univ. 2013, 43, 1122–1134. [Google Scholar]
- Wang, Z.; Yu, J.; Li, G.; Zhang, M.; Leung, C.K.Y. Corrosion behavior of steel rebar embedded in hybrid CNTs-OH/polyvinyl alcohol modified concrete under accelerated chloride attack. Cement Concr. Compos. 2019, 100, 120–129. [Google Scholar] [CrossRef]
- Yu, J.; Zhang, M.; Li, G.; Meng, J.; Leung, C.K.Y. Using nano-silica to improve mechanical and fracture properties of fiber-reinforced high-volume fly ash cement mortar. Constr. Build. Mater. 2020, 239, 117853. [Google Scholar] [CrossRef]
- Rong, Z.; Sun, W.; Xiao, H.; Jiang, G. Effects of nano-SiO2 particles on the mechanical and microstructural properties of ultra-high performance cementitious composites. Cement Concr. Compos. 2015, 56, 25–31. [Google Scholar] [CrossRef]
- Zhang, T.; Ma, B.; Wu, S.; Jin, Z.; Wang, J. Mechanical properties and hydration process of steel slag-cement binder containing nano-SiO2. Constr. Build. Mater. 2022, 314, 125660. [Google Scholar] [CrossRef]
- Ji, T. Preliminary study on the water permeability and microstructure of concrete incorporating nano-SiO2. Cem. Concr. Res. 2005, 35, 1943–1947. [Google Scholar] [CrossRef]
- Ghafari, E.; Costa, H.; Júlio, E.; Portugal, A.; Durães, L. The effect of nanosilica addition on flowability, strength and transport properties of ultra high performance concrete. Mater. Des. 2014, 59, 1–9. [Google Scholar] [CrossRef] [Green Version]
- Li, H.; Zhang, M.-H.; Ou, J.-P. Abrasion resistance of concrete containing nano-particles for pavement. Wear 2006, 260, 1262–1266. [Google Scholar] [CrossRef]
- Tobón, J.I.; Payá, J.; Restrepo, O.J. Study of durability of Portland cement mortars blended with silica nanoparticles. Constr. Build. Mater. 2015, 80, 92–97. [Google Scholar] [CrossRef]
- Jalal, M.; Pouladkhan, A.; Harandi, O.F.; Jafari, D. RETRACTED: Comparative study on effects of Class F fly ash, nano silica and silica fume on properties of high performance self compacting concrete. Constr. Build. Mater. 2015, 94, 90–104. [Google Scholar] [CrossRef]
- Kuo, W.-Y.; Huang, J.-S.; Lin, C.-H. Effects of organo-modified montmorillonite on strengths and permeability of cement mortars. Cem. Concr. Res. 2006, 36, 886–895. [Google Scholar] [CrossRef]
- Afroughsabet, V.; Teng, S. Experiments on drying shrinkage and creep of high performance hybrid-fiber-reinforced concrete. Cement Concr. Compos. 2020, 106, 103481. [Google Scholar] [CrossRef]
- Shaikh, F.U.A. Tensile and flexural behaviour of recycled polyethylene terephthalate (PET) fibre reinforced geopolymer composites. Constr. Build. Mater. 2020, 245, 118438. [Google Scholar] [CrossRef]
- Zhang, P.; Wang, K.; Wang, J.; Guo, J.; Hu, S.; Ling, Y. Mechanical properties and prediction of fracture parameters of geopolymer/alkali-activated mortar modified with PVA fiber and nano-SiO2. Ceram. Int. 2020, 46, 20027–20037. [Google Scholar] [CrossRef]
- Kan, L.-L.; Wang, W.-S.; Liu, W.-D.; Wu, M. Development and characterization of fly ash based PVA fiber reinforced Engineered Geopolymer Composites incorporating metakaolin. Cement Concr. Compos. 2020, 108, 103521. [Google Scholar] [CrossRef]
- Tsai, Y.-C.; Huang, J.-D. Poly(vinyl alcohol)-assisted dispersion of multiwalled carbon nanotubes in aqueous solution for electroanalysis. Electrochem. Commun. 2006, 8, 956–960. [Google Scholar] [CrossRef]
- Thong, C.C.; Teo, D.C.L.; Ng, C.K. Application of polyvinyl alcohol (PVA) in cement-based composite materials: A review of its engineering properties and microstructure behavior. Constr. Build. Mater. 2016, 107, 172–180. [Google Scholar] [CrossRef]
- Huang, J.; Wang, Z.; Li, D.; Li, G. Effect of Nano-SiO2/PVA Fiber on Sulfate Resistance of Cement Mortar Containing High-Volume Fly Ash. Nanomaterials 2022, 12, 323. [Google Scholar] [CrossRef]
- JGJ/T70-2009; Standard for Test Method of Performance on Building Mortar. Ministry of Construction of the People’s Republic of China: Beijing, China, 2009.
- GB/T 17671-1999; The State Bureau of Quality and Technical. Methods of Testing Cements-Determination of Strength Supervision. China Architecture & Building Press: Beijing, China, 1999.
- GB/T 9966.13-2021; Regulation, State Administration for Market, Administration, National Standardization. Test Methods for Natural Stone-Part 13: Determination of Water Absorption Coefficient by Capillarity. China Standard Press: Beijing, China, 2021.
- Luan, C.; Zhou, Y.; Liu, Y.; Ren, Z.; Wang, J.; Yuan, L.; Du, S.; Zhou, Z.; Huang, Y. Effects of nano-SiO2, nano-CaCO3 and nano-TiO2 on properties and microstructure of the high content calcium silicate phase cement (HCSC). Constr. Build. Mater. 2022, 314, 125377. [Google Scholar] [CrossRef]
- Chithra, S.; Senthil Kumar, S.R.R.; Chinnaraju, K. The effect of Colloidal Nano-silica on workability, mechanical and durability properties of High Performance Concrete with Copper slag as partial fine aggregate. Constr. Build. Mater. 2016, 113, 794–804. [Google Scholar] [CrossRef]
- Li, G. Properties of high-volume fly ash concrete incorporating nano-SiO2. Cem. Concr. Res. 2004, 34, 1043–1049. [Google Scholar] [CrossRef]
- Jang, B.S.; Oh, B.H. Effects of non-uniform corrosion on the cracking and service life of reinforced concrete structures. Cem. Concr. Res. 2010, 40, 1441–1450. [Google Scholar] [CrossRef]
- Zhao, Y.; Hu, B.; Yu, J.; Jin, W. Non-uniform distribution of rust layer around steel bar in concrete. Corros. Sci. 2011, 53, 4300–4308. [Google Scholar] [CrossRef]
- Graham, R.K.; Huang, B.; Shu, X.; Burdette, E.G. Laboratory evaluation of tensile strength and energy absorbing properties of cement mortar reinforced with micro- and meso-sized carbon fibers. Constr. Build. Mater. 2013, 44, 751–756. [Google Scholar] [CrossRef]
- Wen, C.; Tian, Y.; Mai, Z.; Hu, J.; Wang, G. Effect of macropores at the steel-concrete interface on localized corrosion behaviour of steel reinforcement. Cement Concr. Compos. 2022, 129, 104510. [Google Scholar] [CrossRef]


| Mass Fraction/% | Setting Time/min | Ft/MPa | Fc/MPa | ||||||||||
|---|---|---|---|---|---|---|---|---|---|---|---|---|---|
| SiO2 | Al2O3 | CaO | MgO | Na2O | K2O | Fe2O3 | SO3 | Initial setting | Final setting | 3 d | 28 d | 3 d | 28 d |
| 18.3 | 4.5 | 62.4 | 2.1 | 0.3 | 1.5 | 2.3 | 3.5 | 72 | 180 | 5.5 | 8.6 | 28.0 | 50.6 |
| Al2O3 | SiO2 | SO4 | K2O | CaO | TiO2 | MnO | Fe2O3 | |
|---|---|---|---|---|---|---|---|---|
| FA (%) | 37.3540 | 48.9115 | 1.1817 | 0.8178 | 5.4984 | 1.8097 | 0.0291 | 4.3979 |
| Diameter/mm | Length/mm | Density/g·cm−3 | Tensile Strength/MPa | Elastic Modulus/GPa | Elongation/% | Aspect Ratio |
|---|---|---|---|---|---|---|
| 0.038 | 12 | 1.3 | 1092 | 30 | 7 | 316 |
| Material | Mix Proportions/(kg·m–3) | Nano-SiO2 (wt)/% | PVA Fiber (vol)/% | Superplasticizer (wt)/% | |||
|---|---|---|---|---|---|---|---|
| Water | Cement | Fly Ash | Sand | ||||
| F0 | 400 | 500 | 500 | 1100 | 0 | 0 | 1.0 |
| F1 | 400 | 500 | 500 | 1100 | 0 | 1.0 | 1.0 |
| F2 | 400 | 500 | 500 | 1100 | 0.5 | 1.0 | 1.0 |
| F3 | 400 | 500 | 500 | 1100 | 1.0 | 1.0 | 1.0 |
| F4 | 400 | 500 | 500 | 1100 | 1.5 | 1.0 | 1.0 |
| F5 | 400 | 400 | 600 | 1100 | 0 | 0 | 1.0 |
| F6 | 400 | 400 | 600 | 1100 | 0 | 1.0 | 1.0 |
| F7 | 400 | 400 | 600 | 1100 | 0.5 | 1.0 | 1.0 |
| F8 | 400 | 400 | 600 | 1100 | 1.0 | 1.0 | 1.0 |
| F9 | 400 | 400 | 600 | 1100 | 1.5 | 1.0 | 1.0 |
| Time of Forming Microcracks on Rebar/Mortar Interface, tini (h) | Time of Forming Continuous Cracks inMortar Cover, tcr (h) | Time of Forming Visible Cracks on Mortar Surface, tvisi (h) | Mass Loss of Rebar (%) | Corrosion Level, ρ (%) | |
|---|---|---|---|---|---|
| F0 | 32 | 71 | 73 | 2.93 | 100 |
| F1 | 44 | 87 | 106 | 3.27 | 112 |
| F2 | 43 | 109 | 114 | 2.04 | 70 |
| F3 | 50 | 119 | 125 | 1.49 | 51 |
| F4 | 51 | 144 | 168 | 2.37 | 81 |
Publisher’s Note: MDPI stays neutral with regard to jurisdictional claims in published maps and institutional affiliations. |
© 2022 by the authors. Licensee MDPI, Basel, Switzerland. This article is an open access article distributed under the terms and conditions of the Creative Commons Attribution (CC BY) license (https://creativecommons.org/licenses/by/4.0/).
Share and Cite
Huang, J.; Wang, Z.; Li, D.; Li, G. Effect of Nano-SiO2/PVA on Corrosion Behavior of Steel Rebar Embedded in High-Volume Fly Ash Mortar under Accelerated Chloride Attack. Materials 2022, 15, 3900. https://doi.org/10.3390/ma15113900
Huang J, Wang Z, Li D, Li G. Effect of Nano-SiO2/PVA on Corrosion Behavior of Steel Rebar Embedded in High-Volume Fly Ash Mortar under Accelerated Chloride Attack. Materials. 2022; 15(11):3900. https://doi.org/10.3390/ma15113900
Chicago/Turabian StyleHuang, Jingjing, Zhongkun Wang, Dongsheng Li, and Gengying Li. 2022. "Effect of Nano-SiO2/PVA on Corrosion Behavior of Steel Rebar Embedded in High-Volume Fly Ash Mortar under Accelerated Chloride Attack" Materials 15, no. 11: 3900. https://doi.org/10.3390/ma15113900