Author Contributions
Conceptualization, J.M. and M.V.; methodology, J.M. and M.H.; software, M.V. and M.S.; validation, J.M., M.V. and M.H.; formal analysis, J.M. and M.V.; investigation, M.S.; resources, J.M. and M.V.; data curation, M.H. and M.S.; writing—original draft preparation, J.M. and M.V.; writing—review and editing, J.M. and M.V.; visualization, J.M.; supervision, J.M. and M.V.; project administration, M.S. and M.V.; funding acquisition, M.S. and M.V. All authors have read and agreed to the published version of the manuscript.
Figure 1.
Fundamental scheme of fused filament fabrication printer. The controlled deposition of material into structure allows printing of various infill pattern types.
Figure 1.
Fundamental scheme of fused filament fabrication printer. The controlled deposition of material into structure allows printing of various infill pattern types.
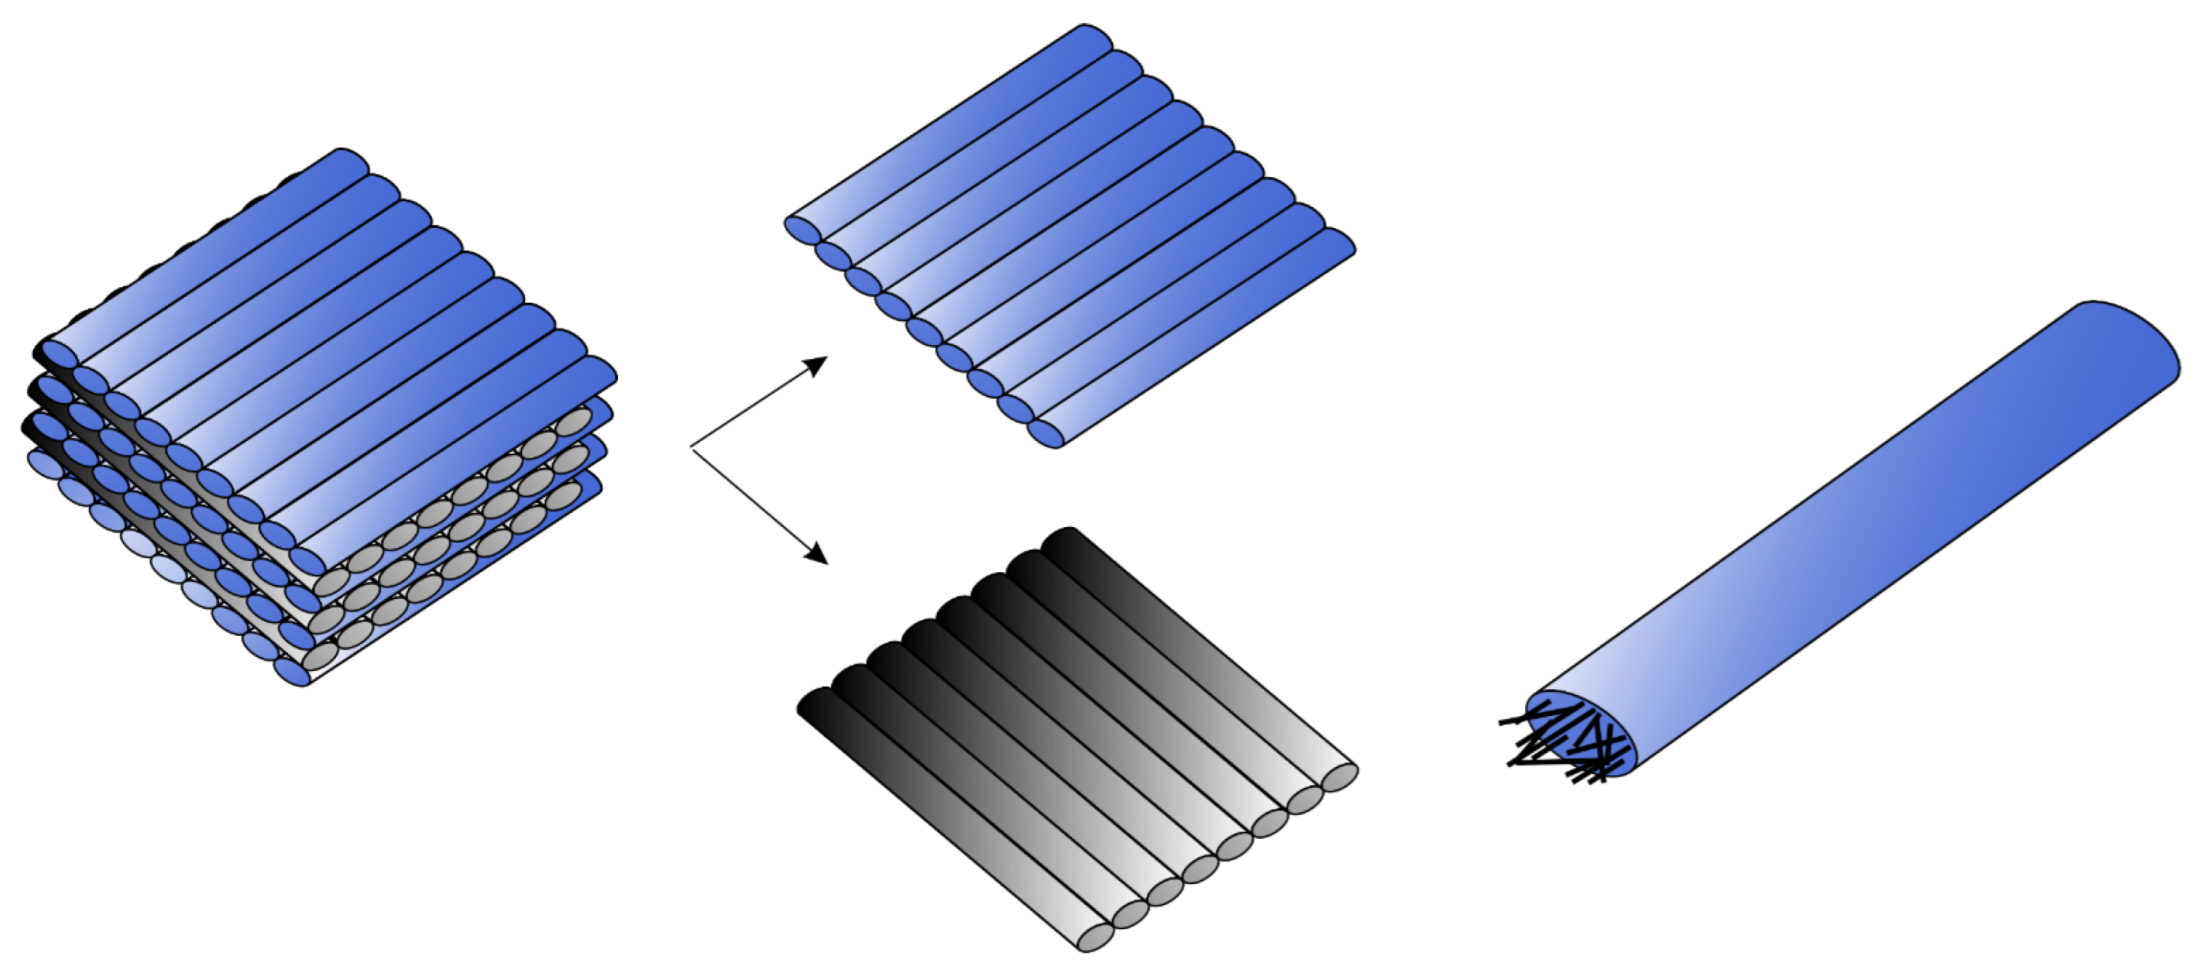
Figure 2.
Perpendicular ply sequence (left); laminas orientation (middle); filament reinforced with chopped carbon fibre (right).
Figure 2.
Perpendicular ply sequence (left); laminas orientation (middle); filament reinforced with chopped carbon fibre (right).
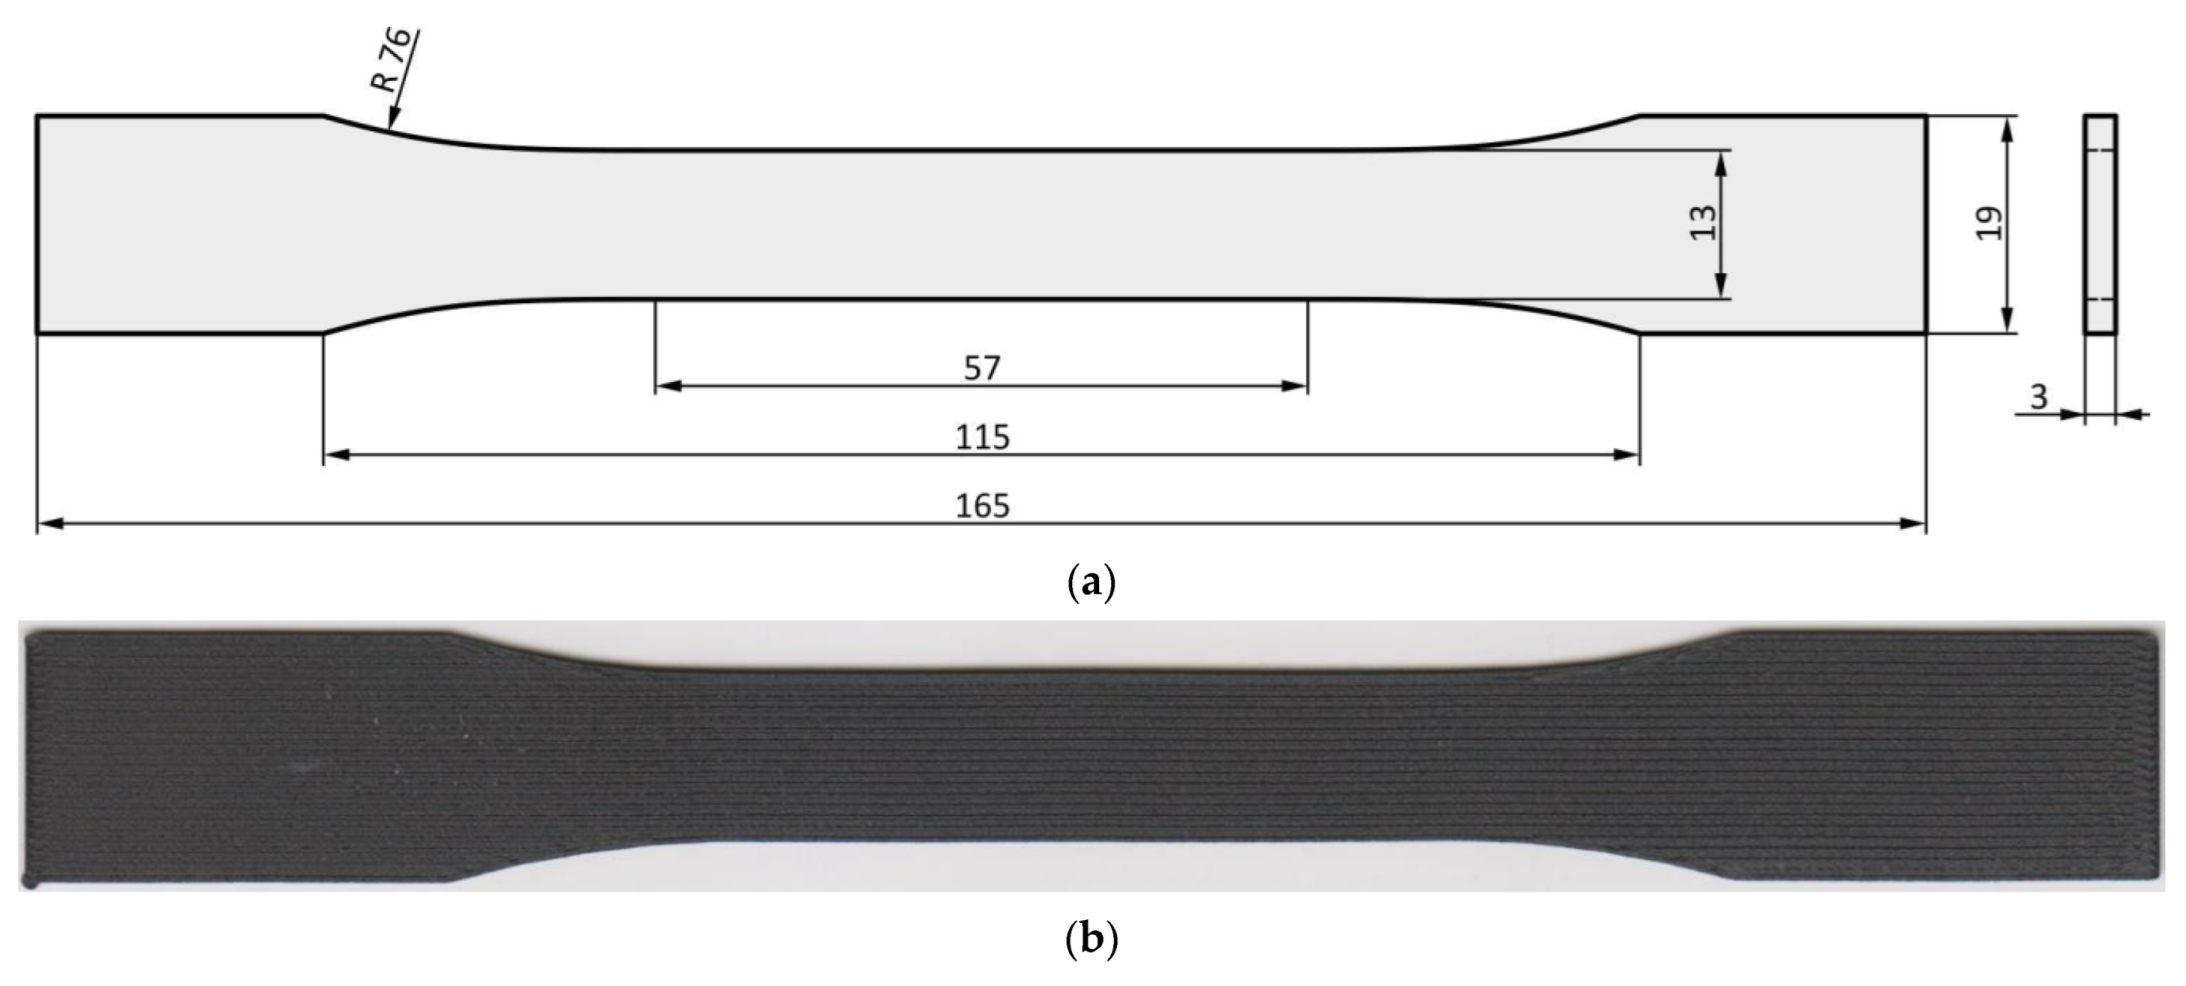
Figure 3.
Specimen shape: (a) dimensioned drawing according to ASTM D638-14; (b) photo of a printed specimen.
Figure 3.
Specimen shape: (a) dimensioned drawing according to ASTM D638-14; (b) photo of a printed specimen.
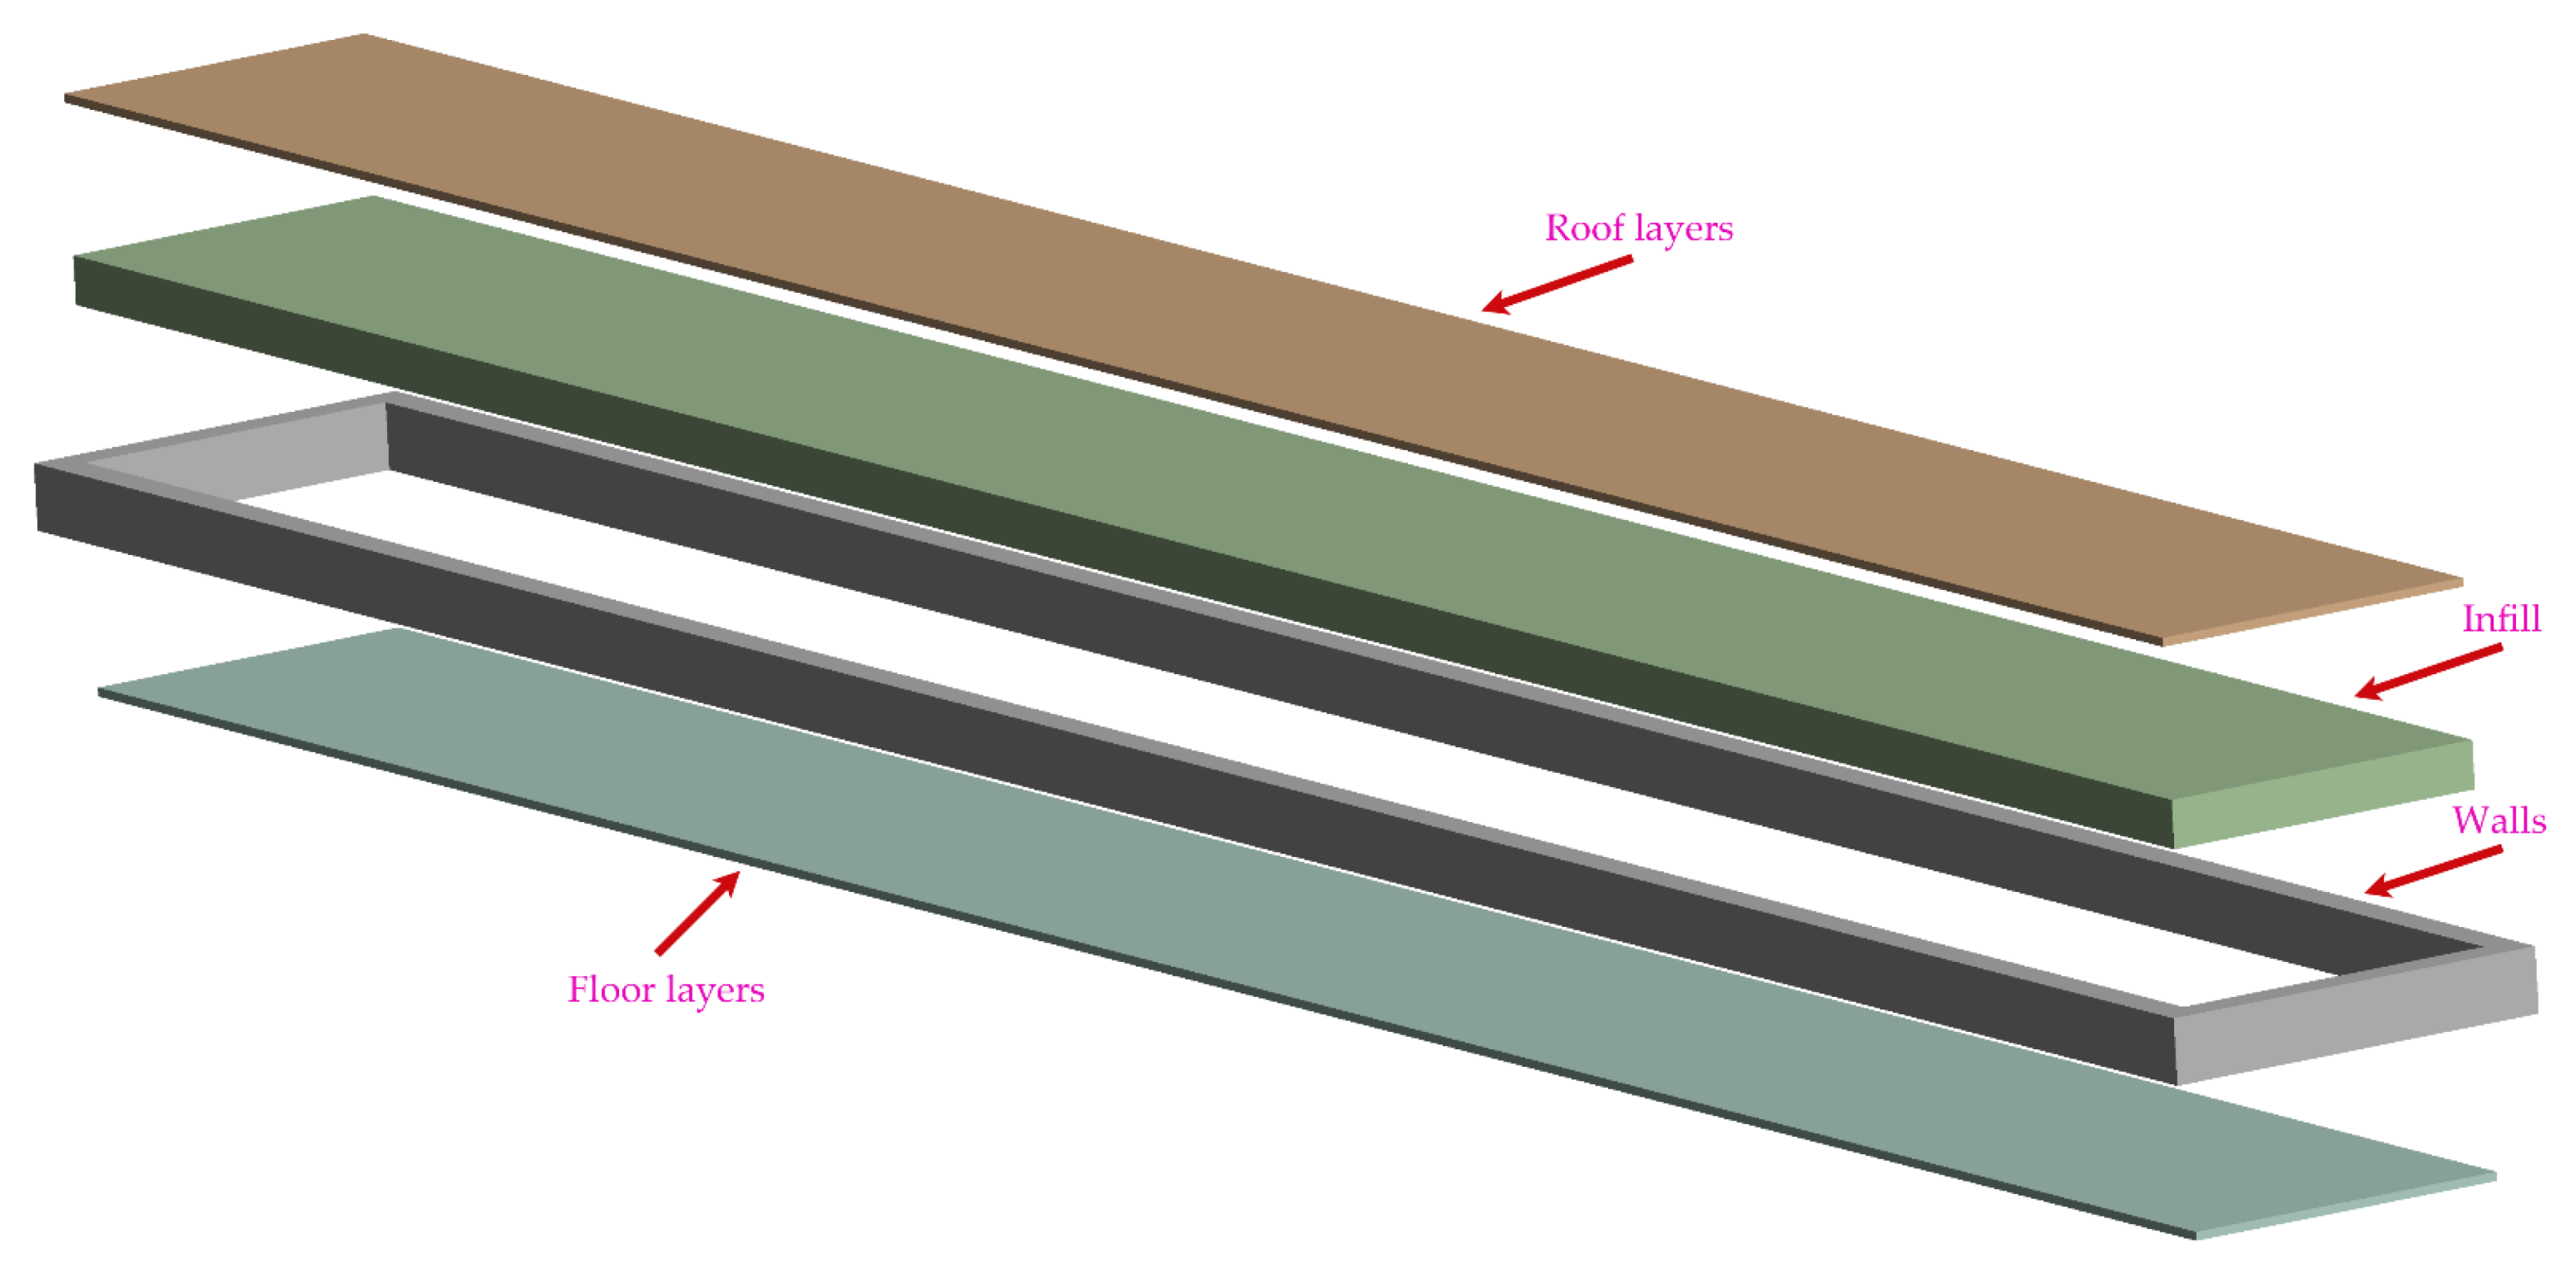
Figure 4.
Schematic sketch of printed parts.
Figure 4.
Schematic sketch of printed parts.
Figure 5.
Specimen A exceeds the printing bed. However, the rotation of the specimen to a specified degree (B—0 degrees; C—30 degrees; D—45 degrees) allows fitting the specimen on the printing bed and successful printing.
Figure 5.
Specimen A exceeds the printing bed. However, the rotation of the specimen to a specified degree (B—0 degrees; C—30 degrees; D—45 degrees) allows fitting the specimen on the printing bed and successful printing.
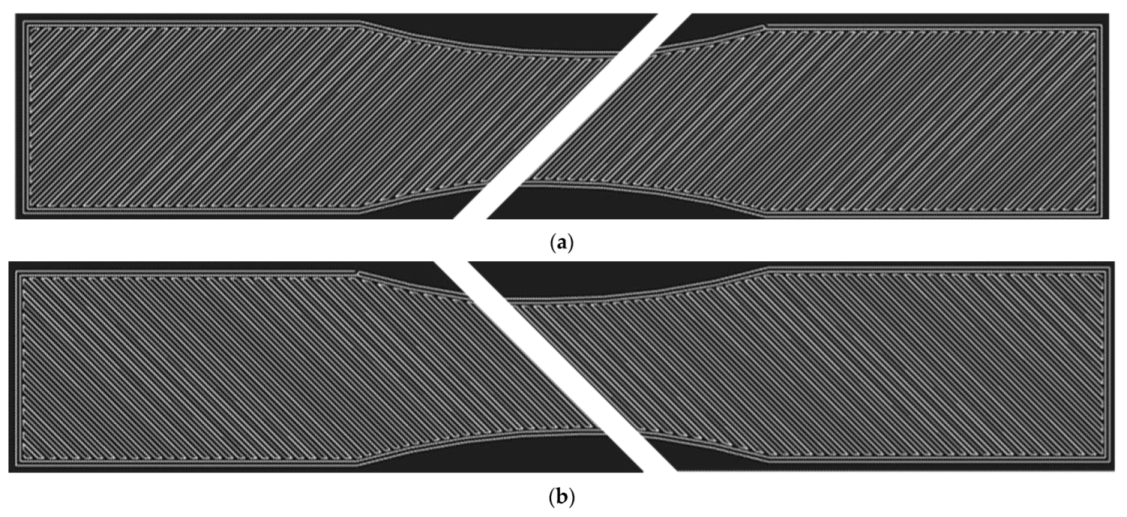
Figure 6.
Infill orientation to loading axis: (a) 45° angle; (b) −45° angle. The layers are stacked alternately. The white lines represent the defined path of material deposition.
Figure 6.
Infill orientation to loading axis: (a) 45° angle; (b) −45° angle. The layers are stacked alternately. The white lines represent the defined path of material deposition.
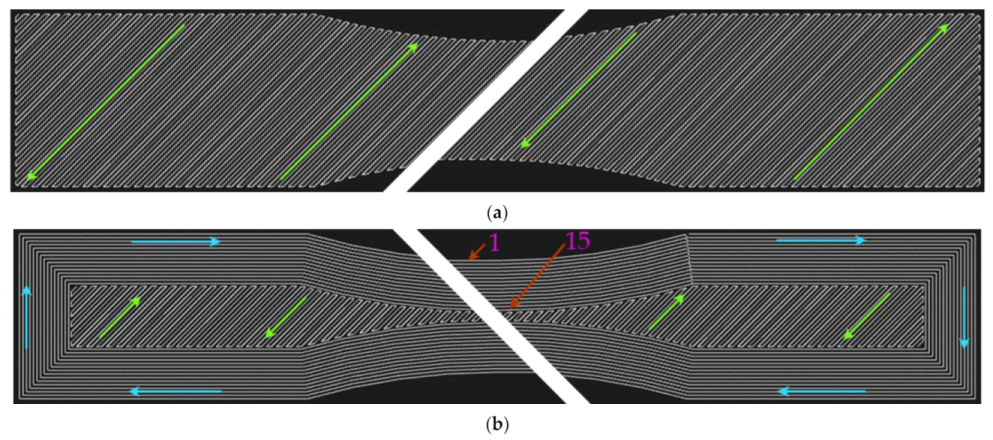
Figure 7.
Infill pattern (green arrows) with an orientation of 45 degrees to the loading axis: (a) without walls; (b) with 15 walls (blue arrows) around the specimen circumference.
Figure 7.
Infill pattern (green arrows) with an orientation of 45 degrees to the loading axis: (a) without walls; (b) with 15 walls (blue arrows) around the specimen circumference.
Figure 8.
Deposition of filaments in the narrowest part of lamina.
Figure 8.
Deposition of filaments in the narrowest part of lamina.
Figure 9.
Tensile diagrams for specimens with infill orientation: (a) 45/−45; (b) 0/90; (c) 15/−75; (d) 30/−60.
Figure 9.
Tensile diagrams for specimens with infill orientation: (a) 45/−45; (b) 0/90; (c) 15/−75; (d) 30/−60.
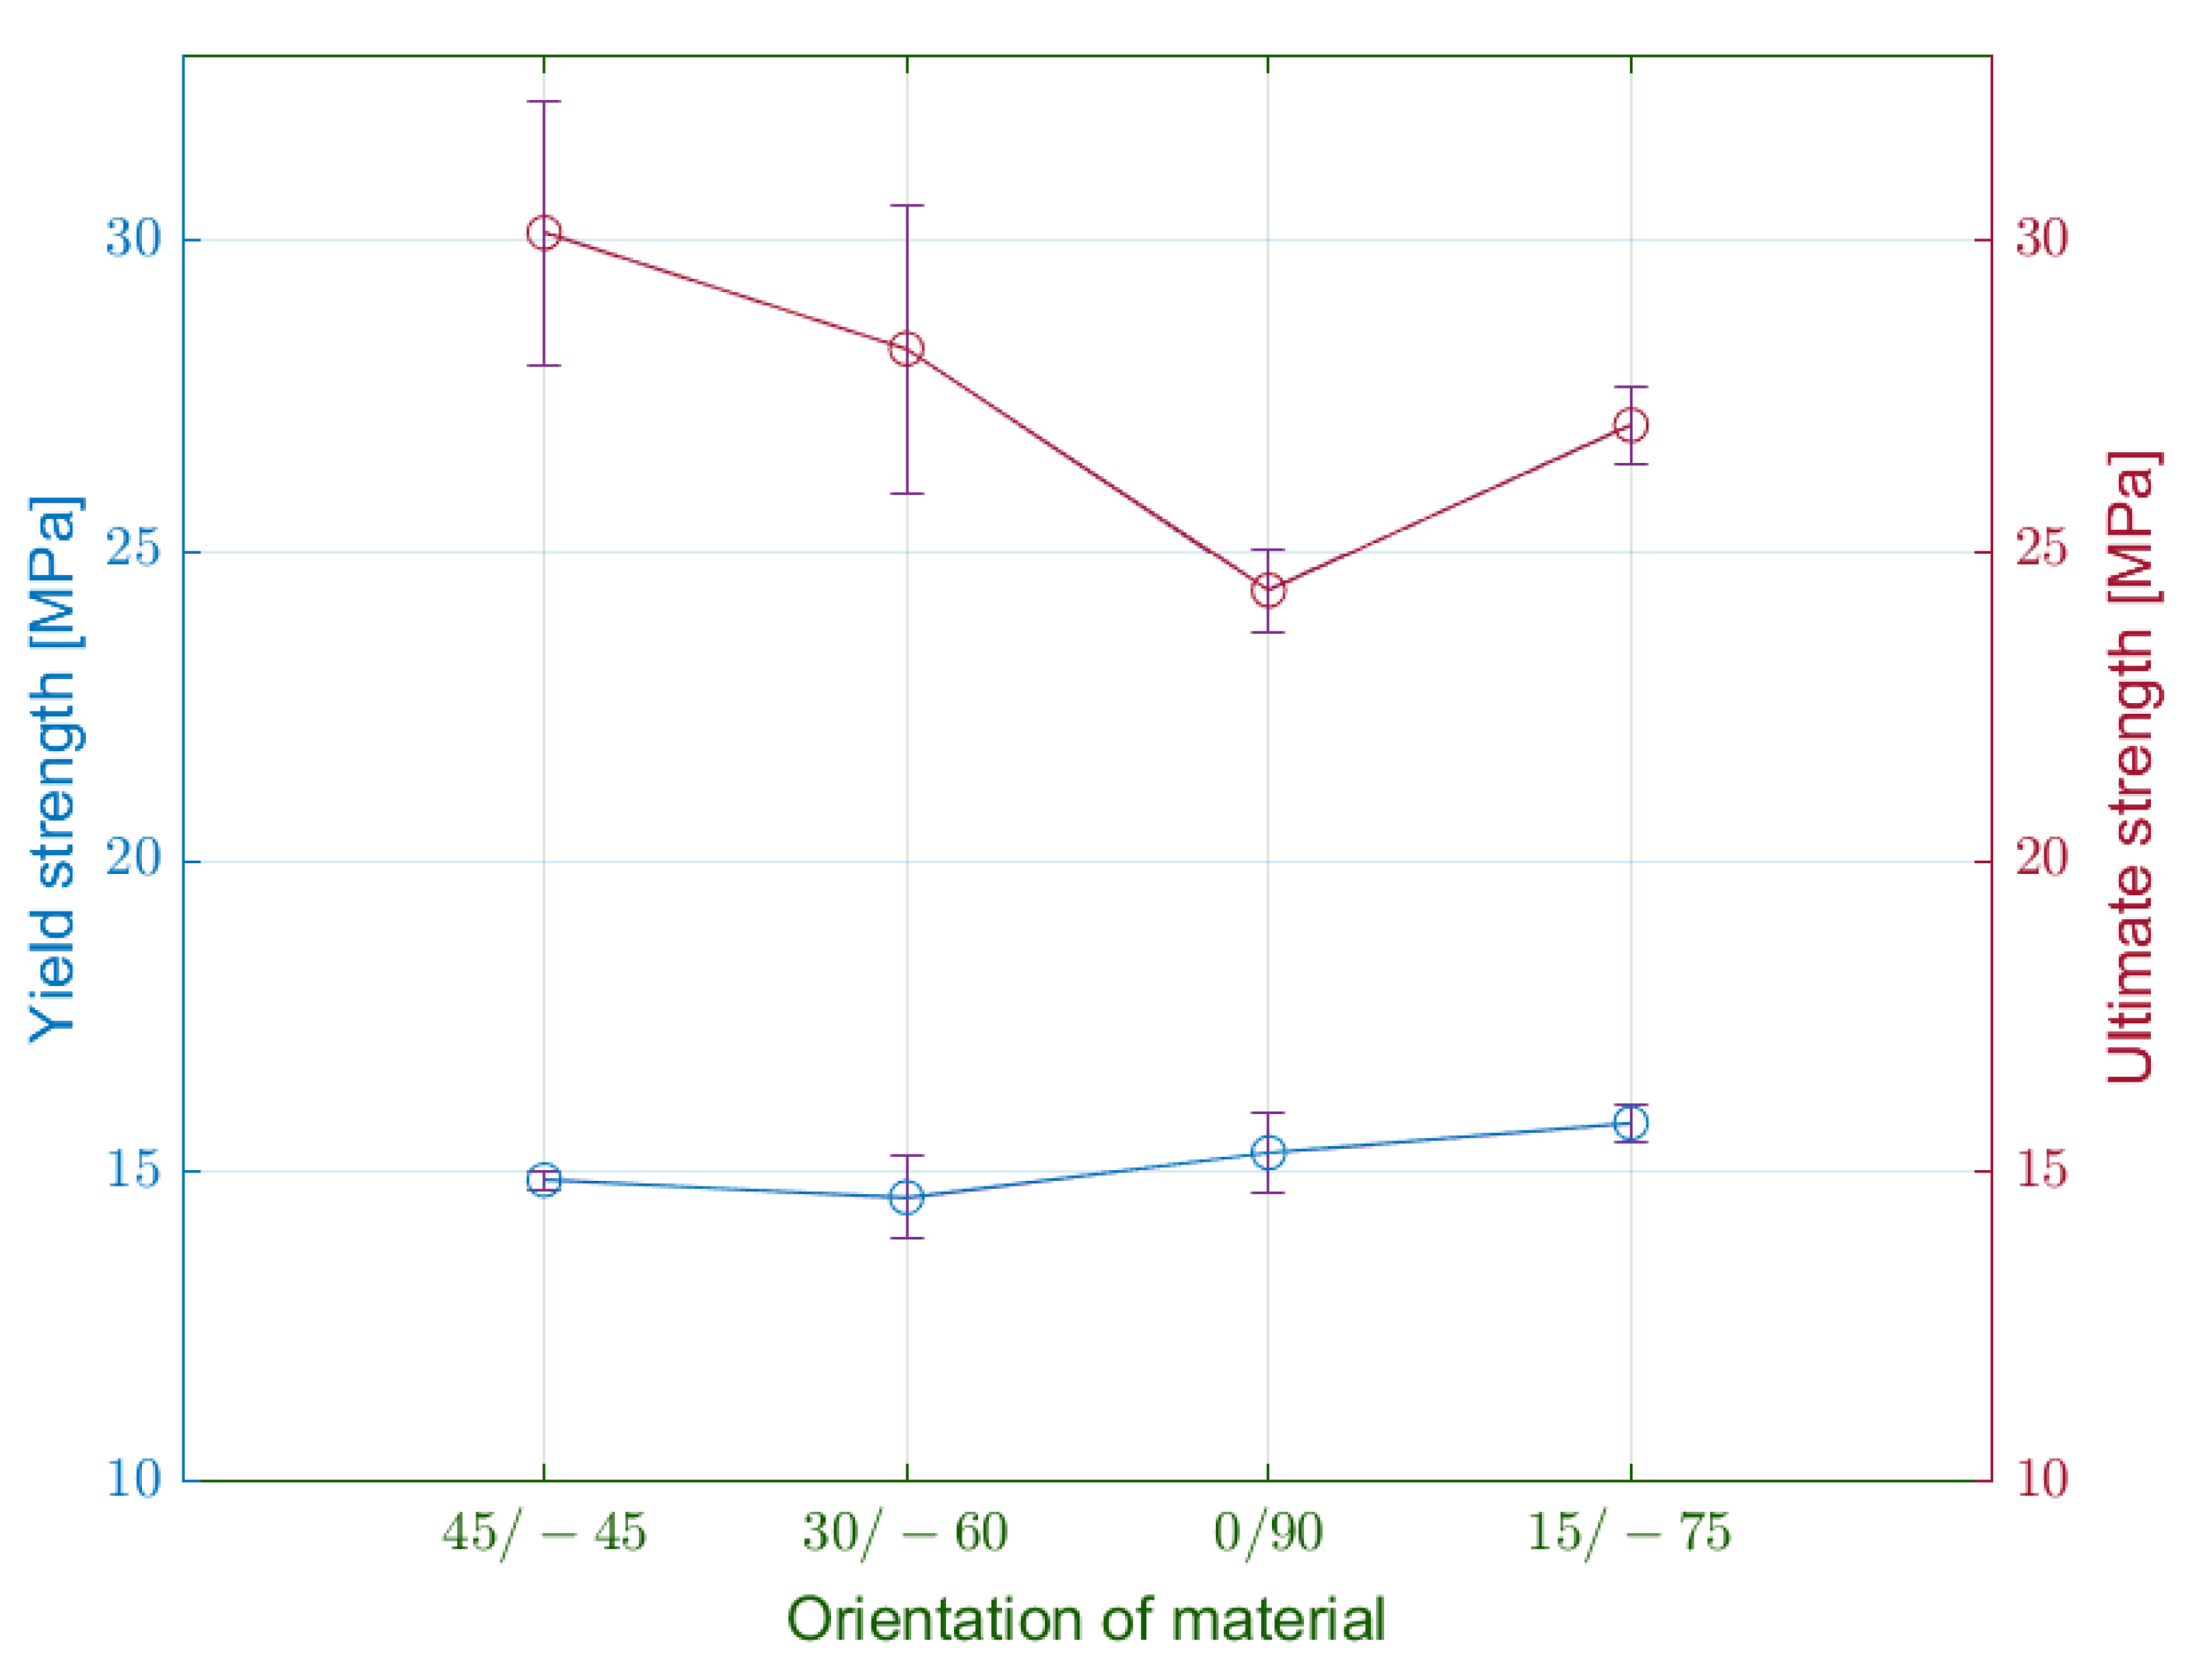
Figure 10.
Comparison of measured average values of yield strength and ultimate strength for selected infill orientations.
Figure 10.
Comparison of measured average values of yield strength and ultimate strength for selected infill orientations.
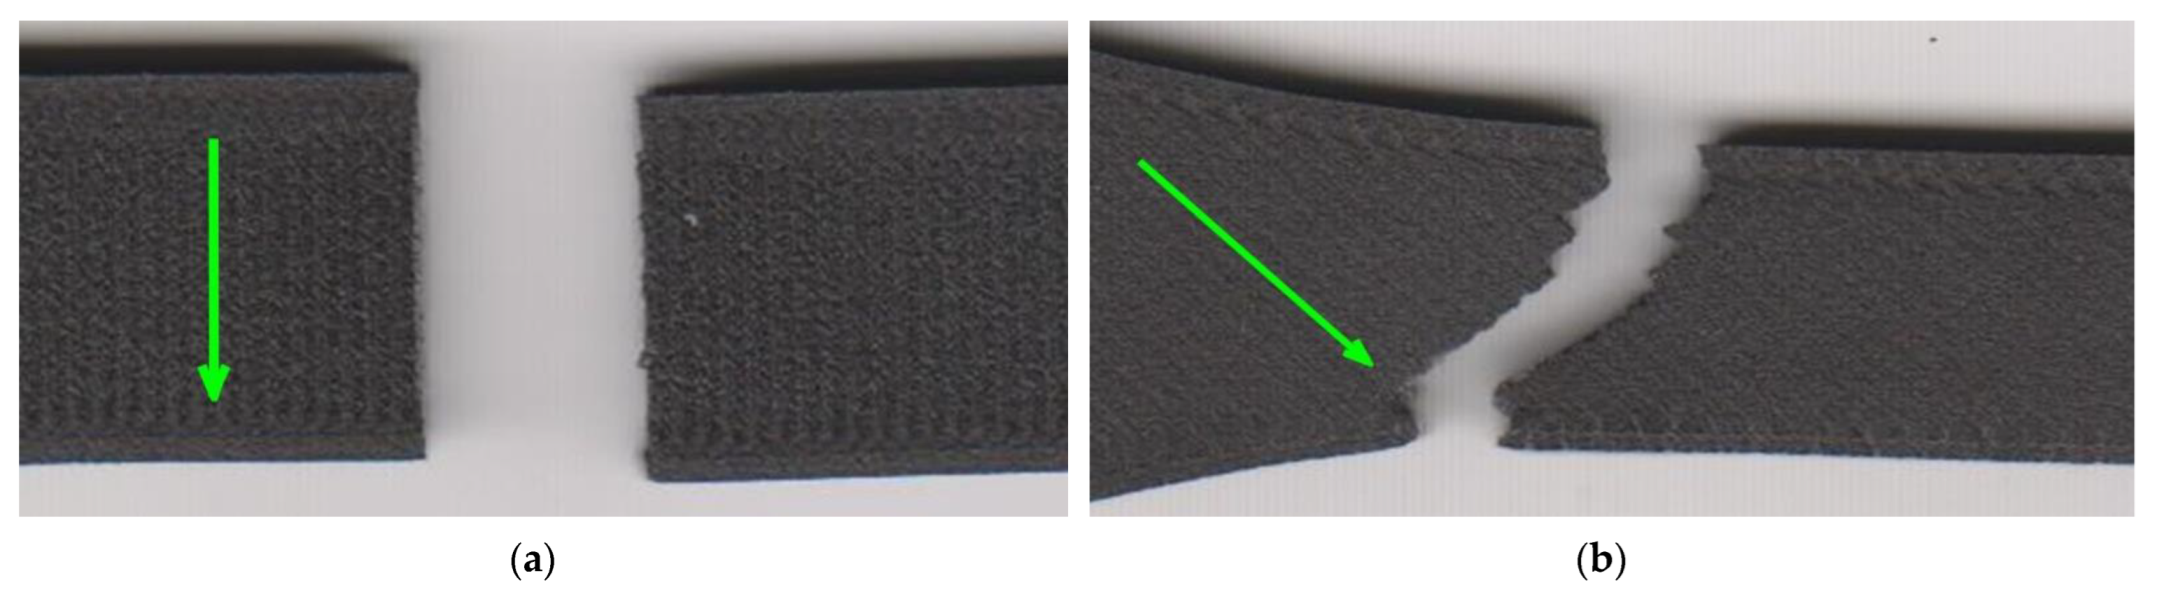
Figure 11.
Fractured specimens: (a) infill orientation 45/−45; (b) infill orientation 0/90.
Figure 11.
Fractured specimens: (a) infill orientation 45/−45; (b) infill orientation 0/90.
Figure 12.
Influence of infill orientation on strain at the yield limit and fracture strain.
Figure 12.
Influence of infill orientation on strain at the yield limit and fracture strain.
Figure 13.
Detail of fracture: (a) 0/90 infill strategy; (b) 45/−45 infill strategy. Green arrows present the orientation of the solid infill in the top layer.
Figure 13.
Detail of fracture: (a) 0/90 infill strategy; (b) 45/−45 infill strategy. Green arrows present the orientation of the solid infill in the top layer.
Figure 14.
SEM images of fractured specimen alpha: (a) 100× magnification, detector LVSD; (b) 300× magnification, detector LVSD; (c) 300× magnification, detector BSE; (d) 500× magnification, detector BSE.
Figure 14.
SEM images of fractured specimen alpha: (a) 100× magnification, detector LVSD; (b) 300× magnification, detector LVSD; (c) 300× magnification, detector BSE; (d) 500× magnification, detector BSE.
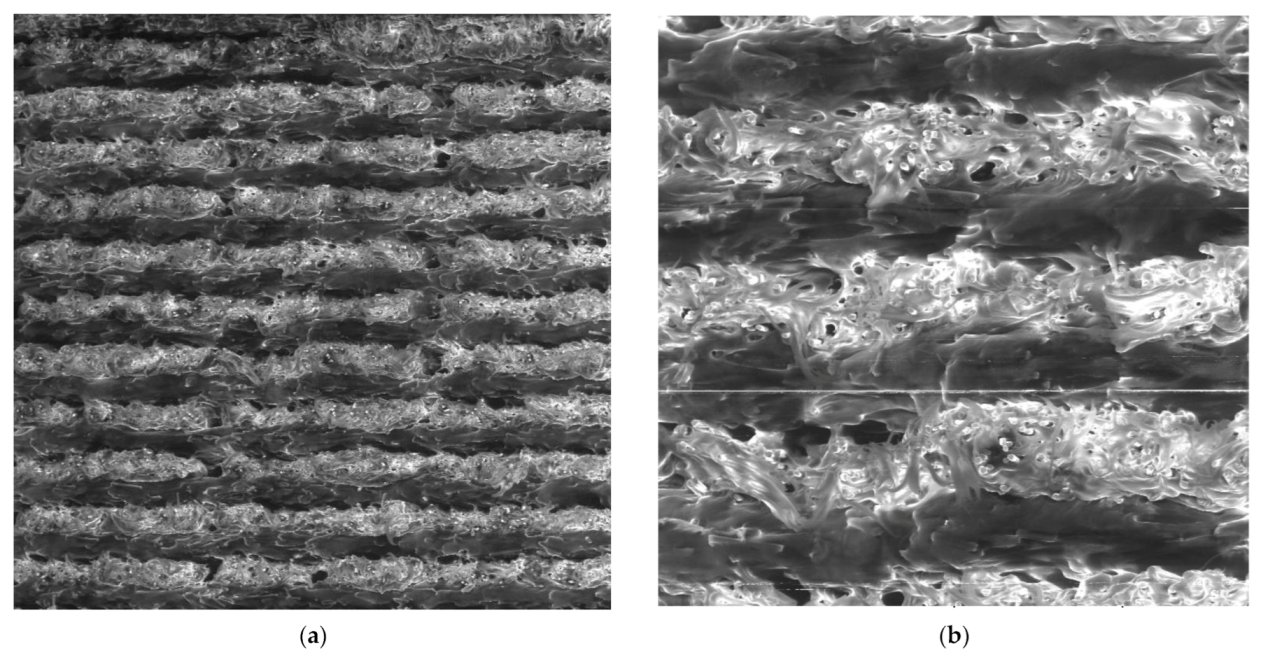
Figure 15.
SEM images of fractured specimen beta: (a) 100× magnification, detector LVSD, red box presents one filament; (b) 300× magnification, detector LVSD; (c) 300× magnification, detector BSE; (d) 500× magnification, detector BSE.
Figure 15.
SEM images of fractured specimen beta: (a) 100× magnification, detector LVSD, red box presents one filament; (b) 300× magnification, detector LVSD; (c) 300× magnification, detector BSE; (d) 500× magnification, detector BSE.
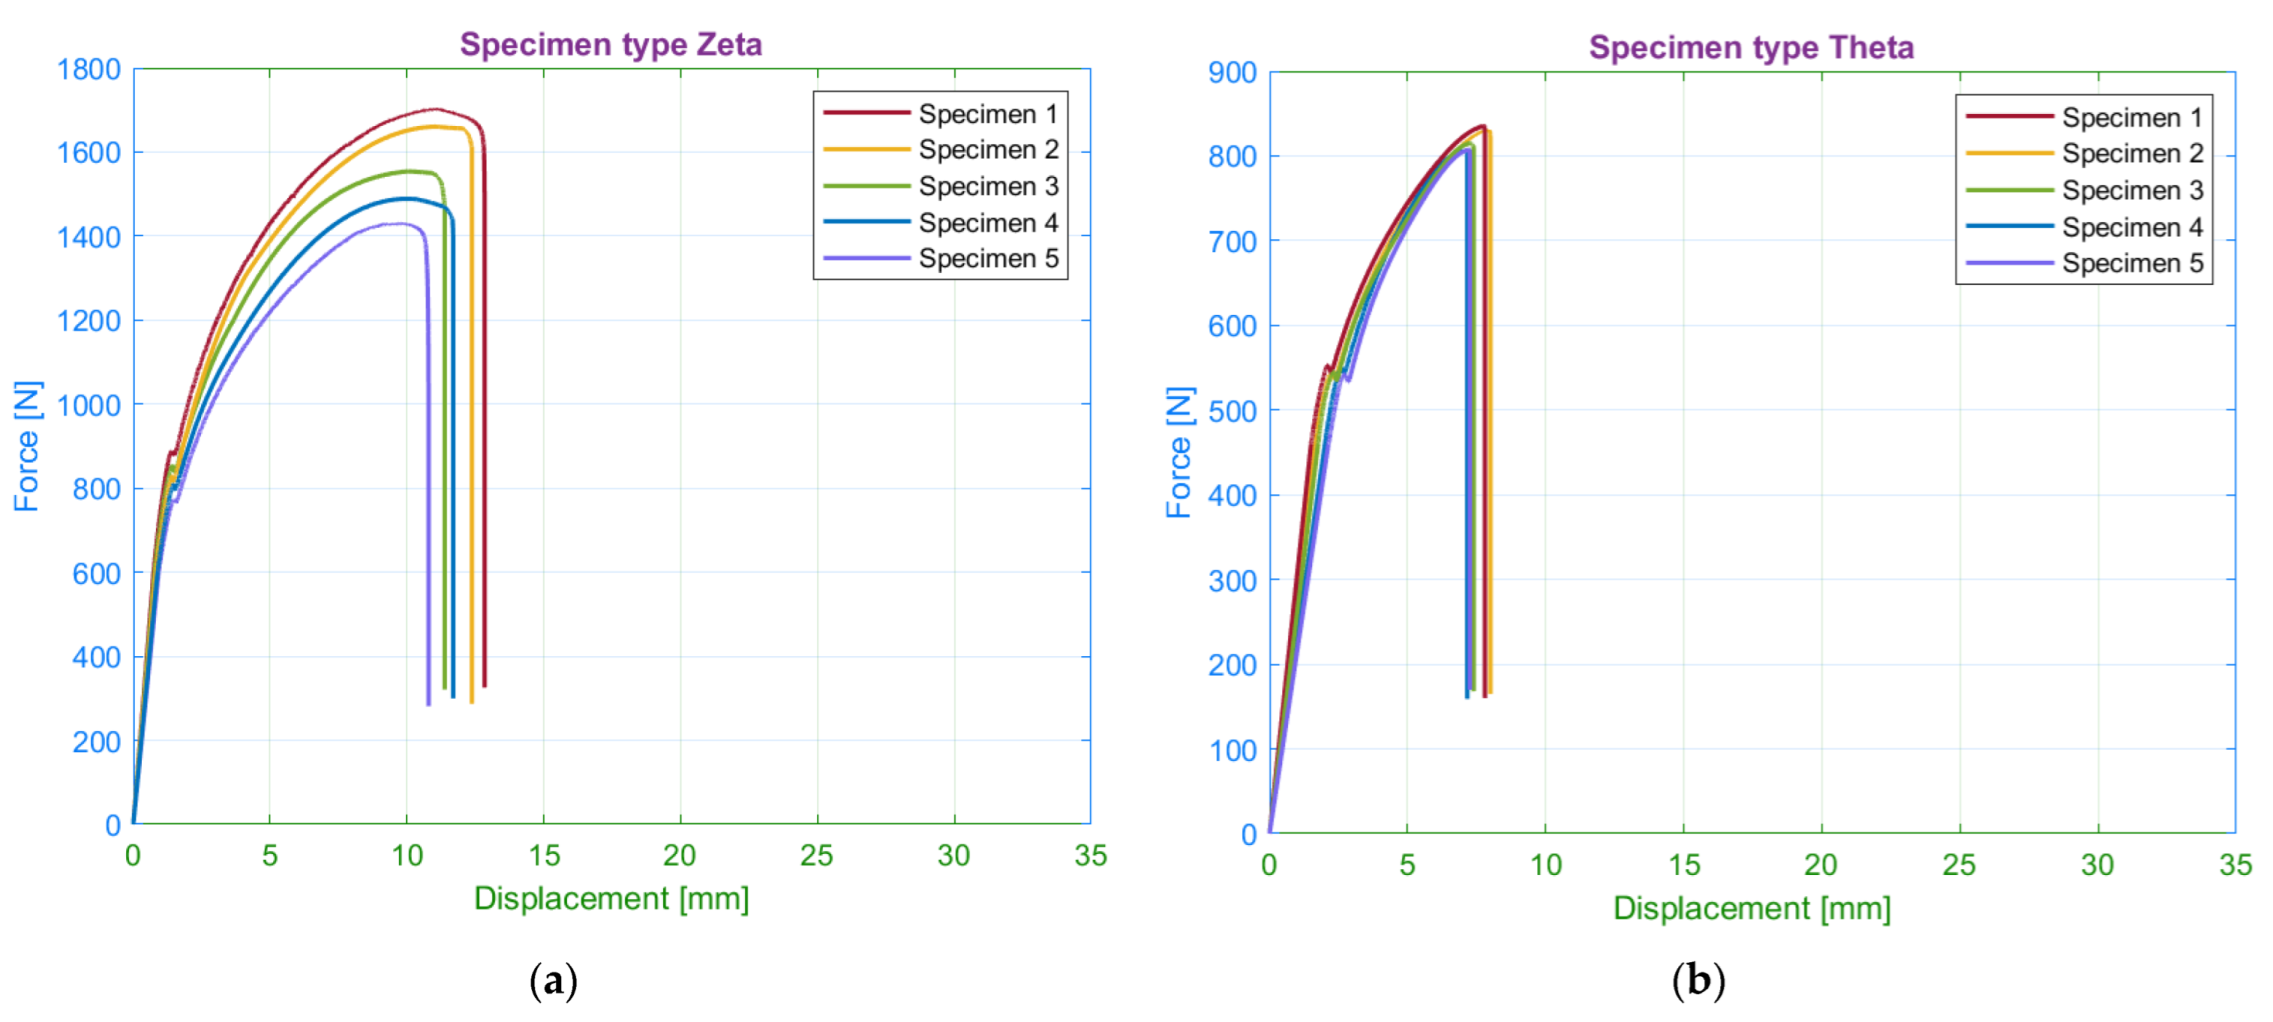
Figure 16.
Tensile diagrams for specimens: (a) with 15 walls; (b) without walls.
Figure 16.
Tensile diagrams for specimens: (a) with 15 walls; (b) without walls.
Figure 17.
Comparison of measured average values of yield strength and ultimate strength for the selected wall number.
Figure 17.
Comparison of measured average values of yield strength and ultimate strength for the selected wall number.
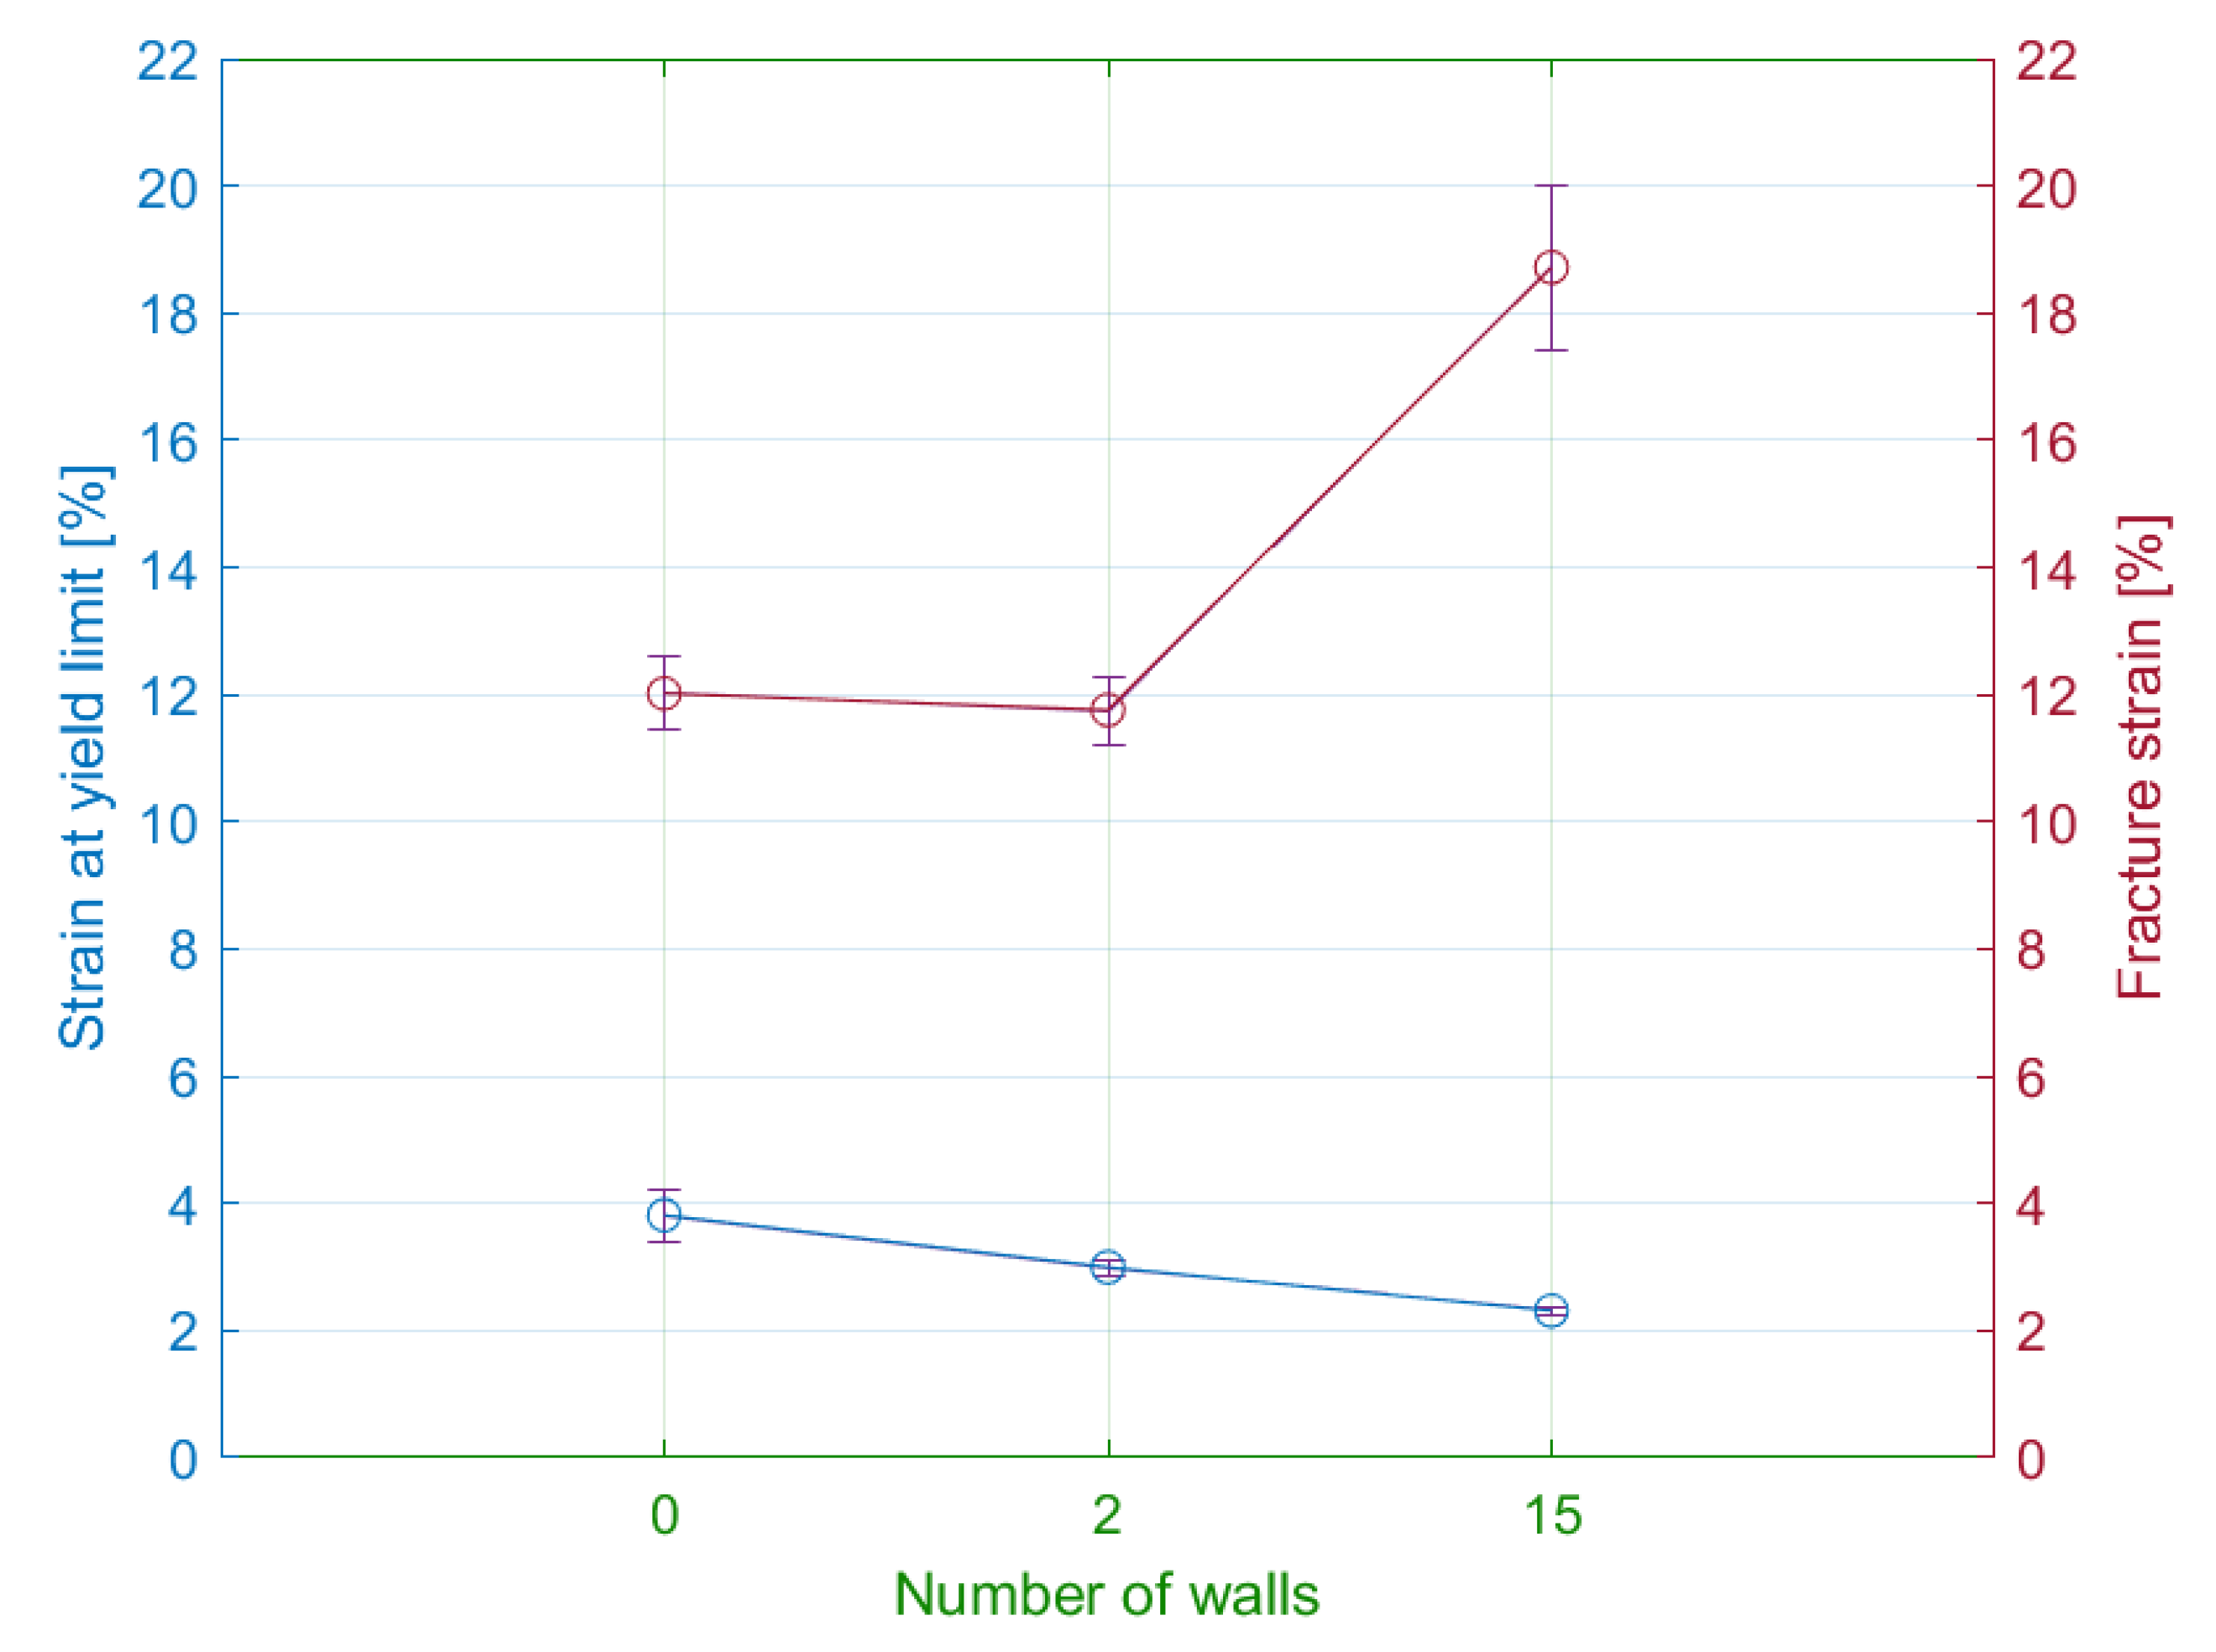
Figure 18.
Influence of the number of walls on the strain at yield limit and fracture strain.
Figure 18.
Influence of the number of walls on the strain at yield limit and fracture strain.
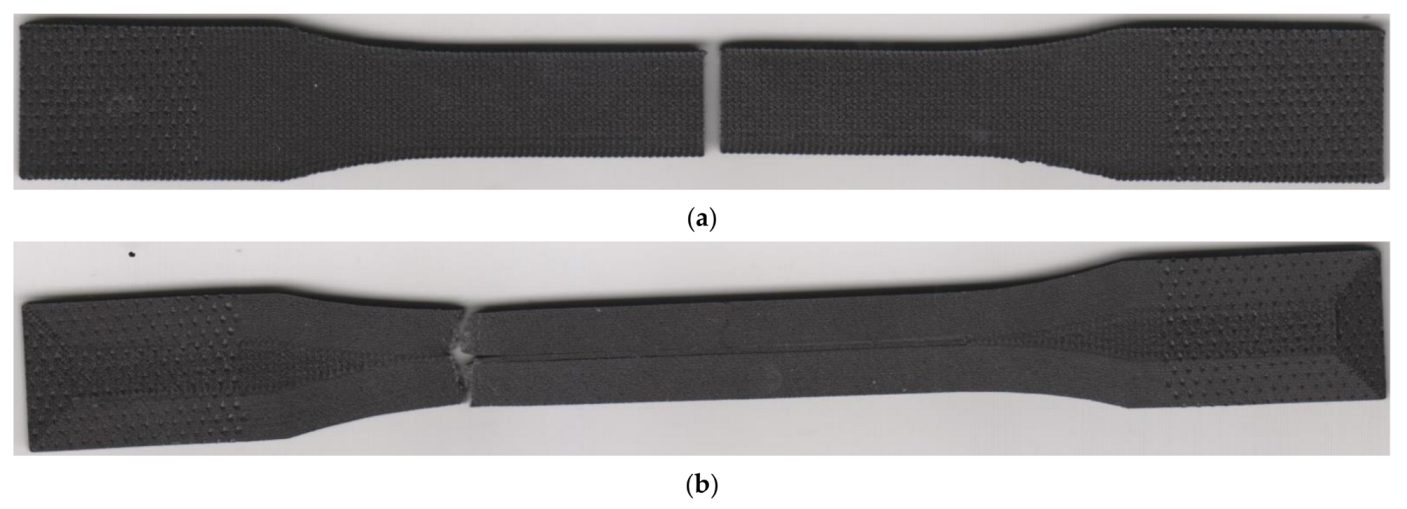
Figure 19.
Fractured specimens: (a) without walls (theta series); (b) with 15 walls (zeta series).
Figure 19.
Fractured specimens: (a) without walls (theta series); (b) with 15 walls (zeta series).
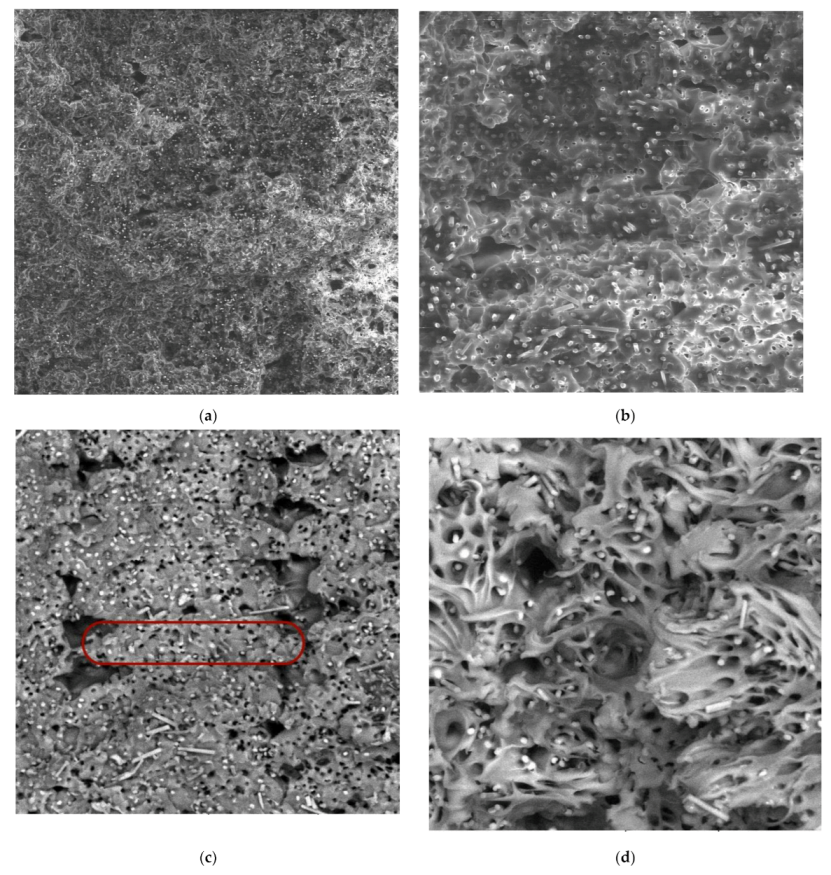
Figure 20.
SEM images of fractured specimen zeta: (a) 100× magnification, detector LVSD; (b) 300× magnification, detector LVSD; (c) 300× magnification, detector BSE, the red box presents one filament; (d) 500× magnification, detector BSE.
Figure 20.
SEM images of fractured specimen zeta: (a) 100× magnification, detector LVSD; (b) 300× magnification, detector LVSD; (c) 300× magnification, detector BSE, the red box presents one filament; (d) 500× magnification, detector BSE.
Figure 21.
Tensile diagrams for specimens with (a) 10 roof/floor layers; (b) 0 roof/floor layers.
Figure 21.
Tensile diagrams for specimens with (a) 10 roof/floor layers; (b) 0 roof/floor layers.
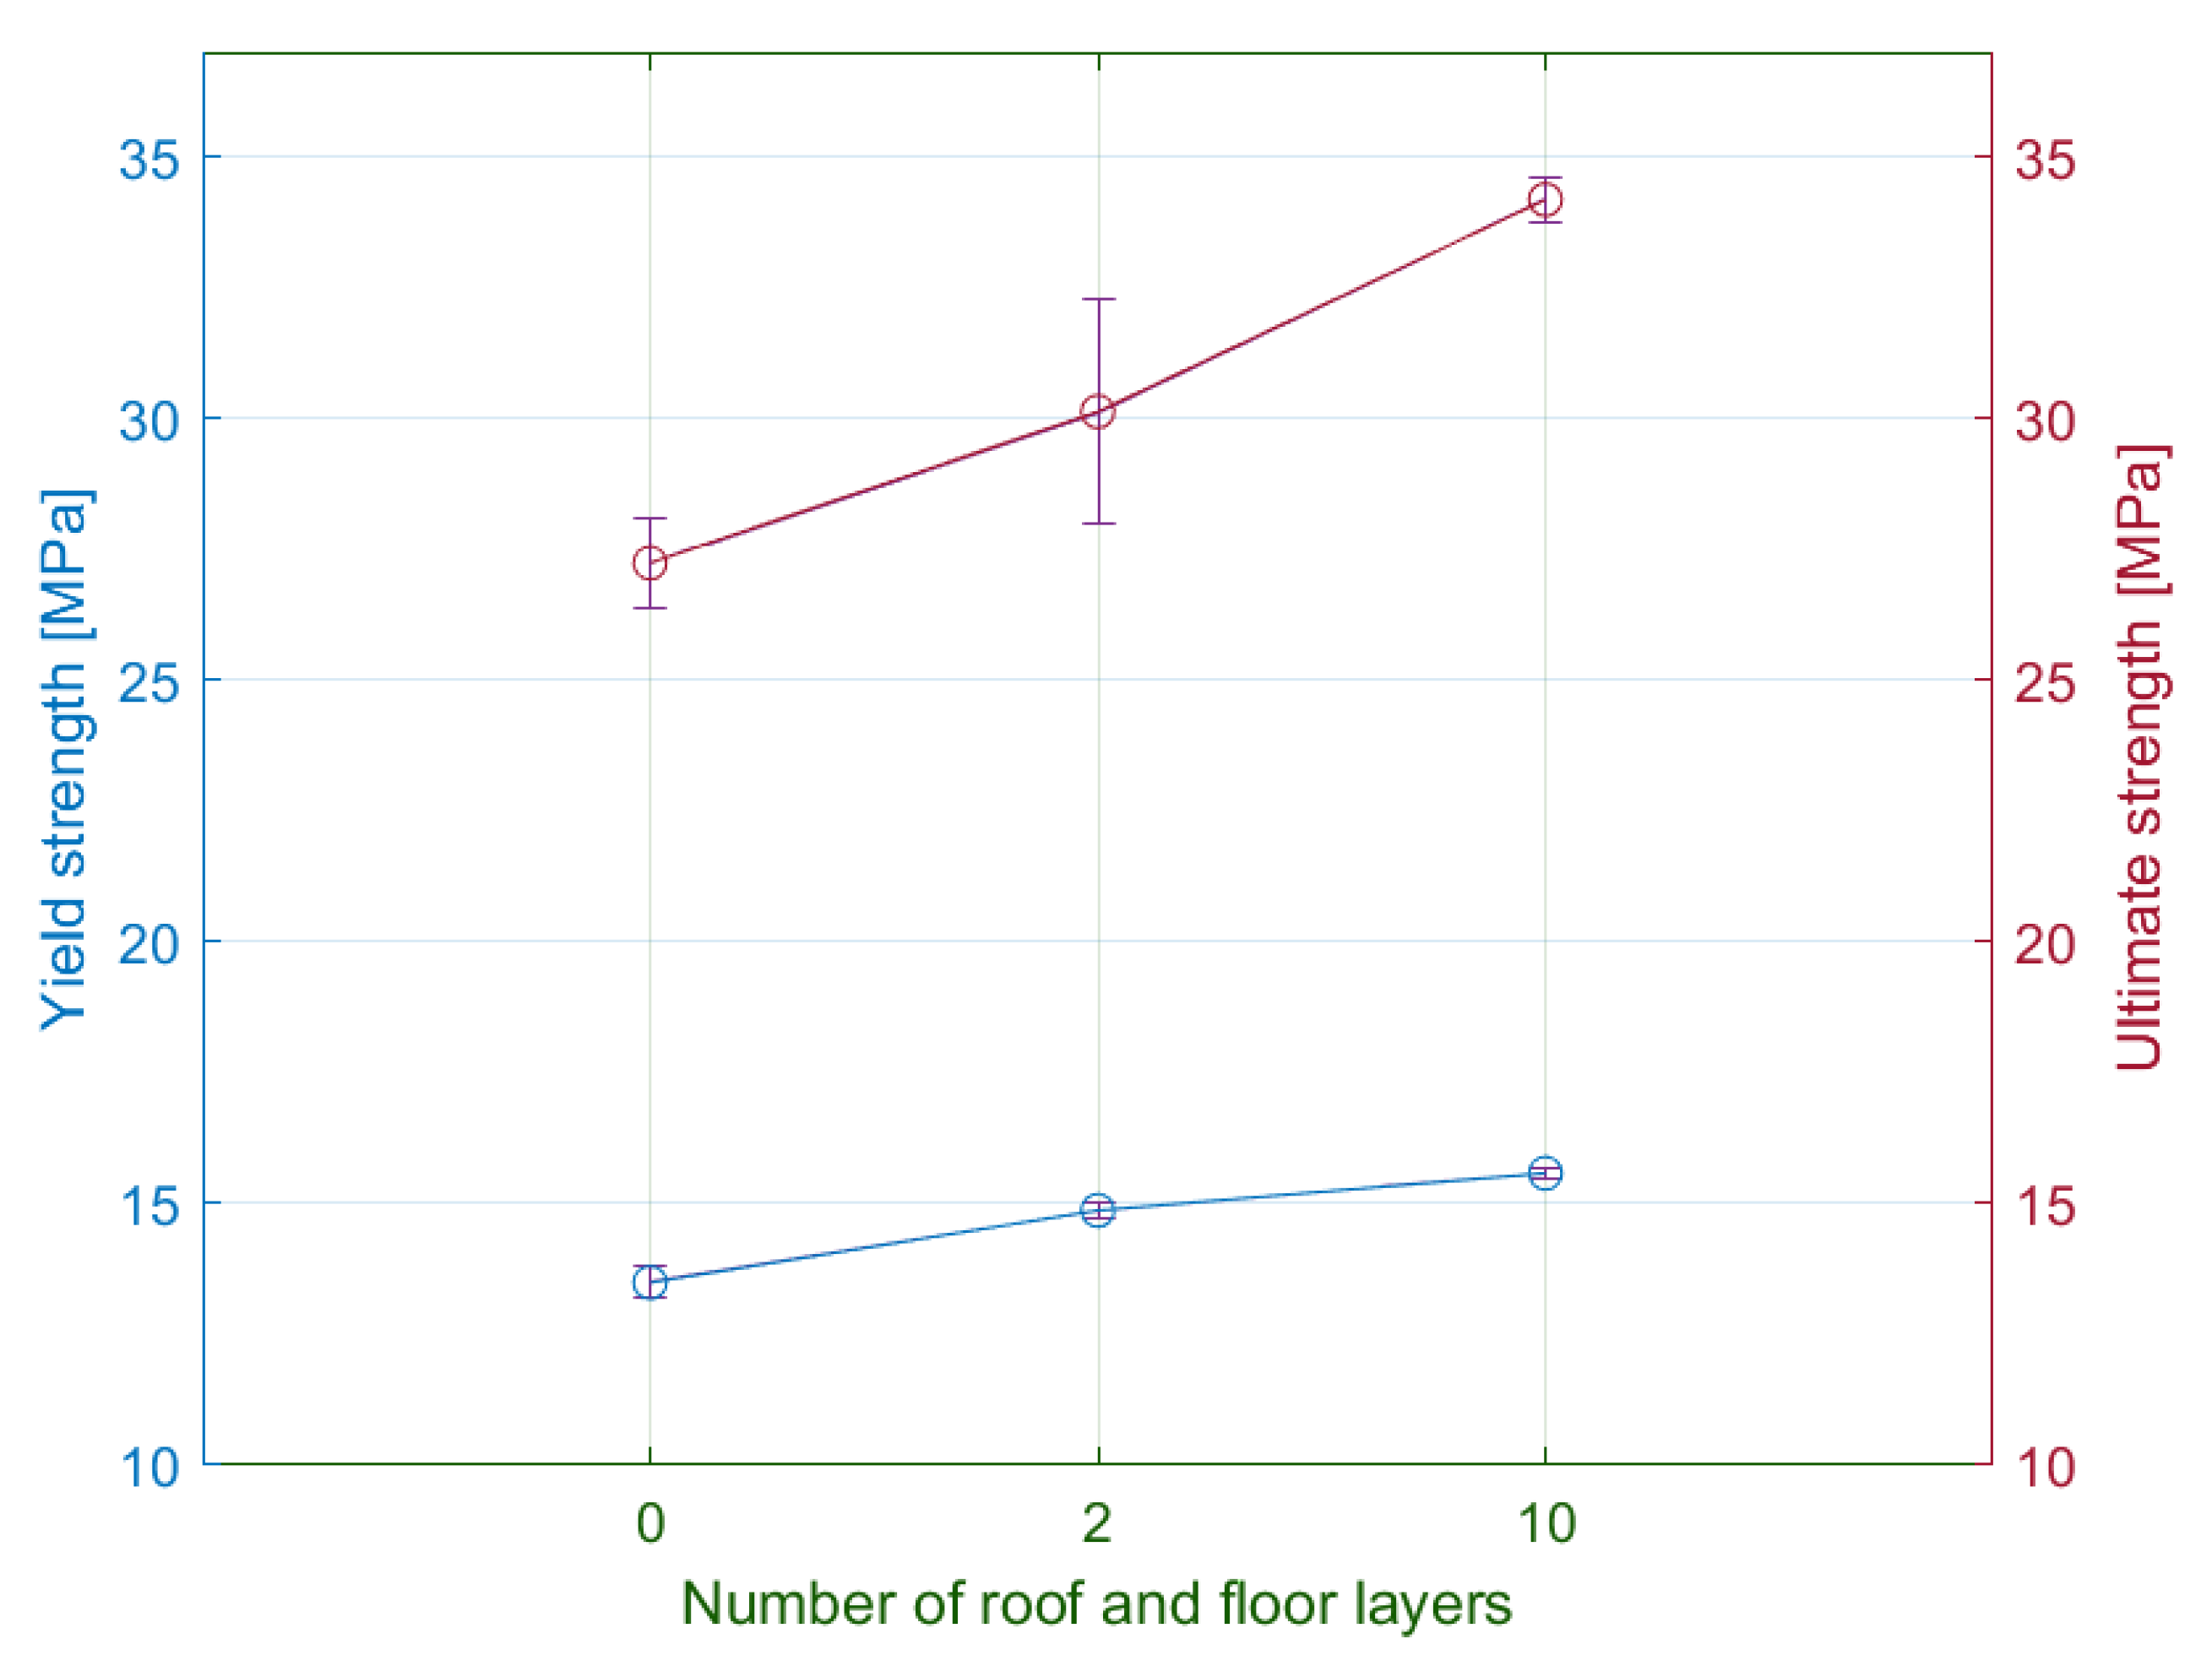
Figure 22.
Comparison of measured average values of yield strength and ultimate strength for the selected number of floor/roof layers.
Figure 22.
Comparison of measured average values of yield strength and ultimate strength for the selected number of floor/roof layers.
Figure 23.
Influence of the number of walls on the strain for the yield limit and fracture strain.
Figure 23.
Influence of the number of walls on the strain for the yield limit and fracture strain.
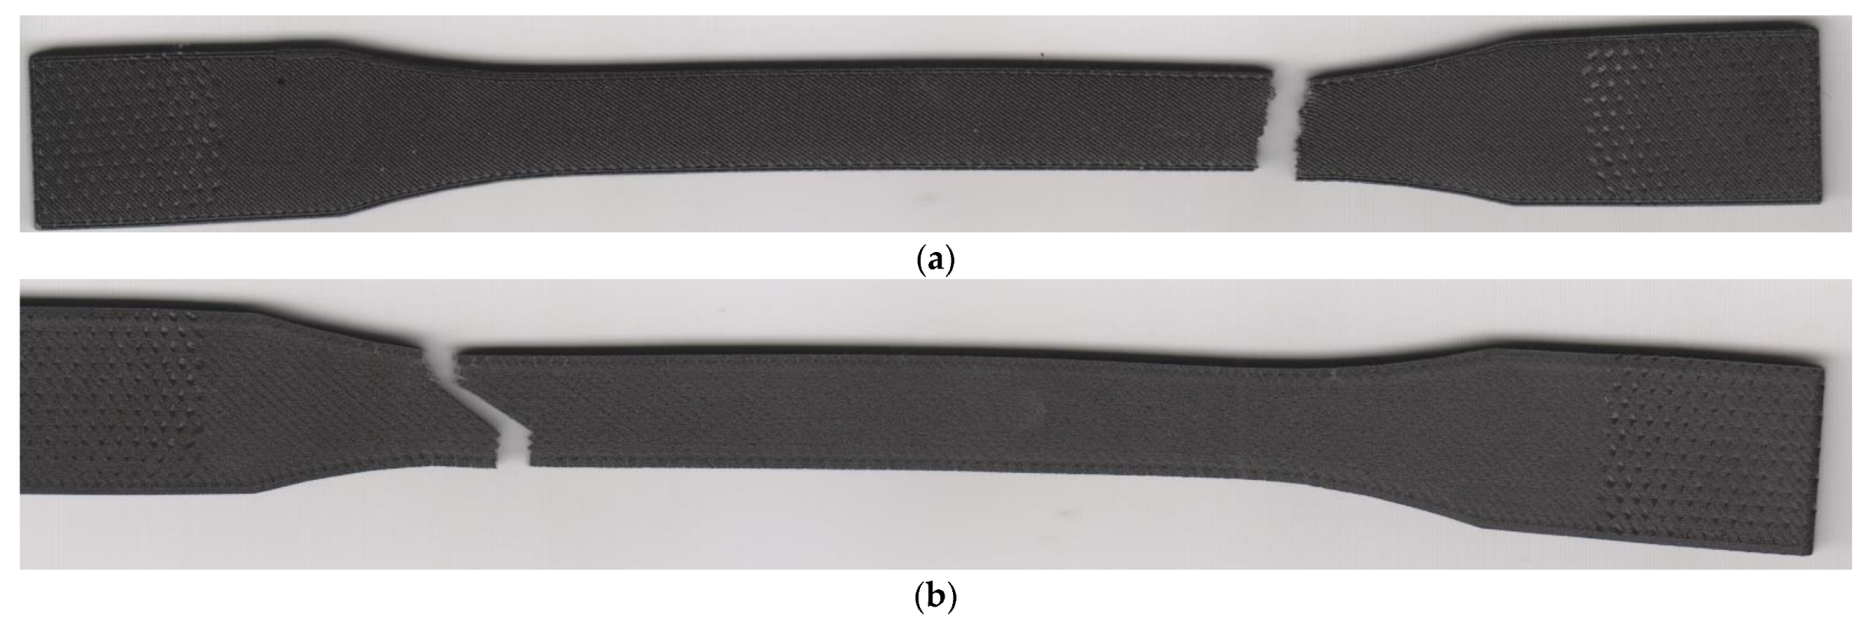
Figure 24.
Fractured specimens: (a) 10 floor/roof laminas (epsilon series); (b) 0 floor/roof laminas (eta series).
Figure 24.
Fractured specimens: (a) 10 floor/roof laminas (epsilon series); (b) 0 floor/roof laminas (eta series).
Figure 25.
Printing timeline of each laminate series.
Figure 25.
Printing timeline of each laminate series.
Table 1.
Mechanical properties of the material [
29].
Table 1.
Mechanical properties of the material [
29].
| Parameter | Nylon Reinforced with Chopped Carbon Fibre (Onyx) |
|---|
| Tensile modulus of elasticity [GPa] | 1.4 |
| Ultimate strength [MPa] | 30 |
| Tensile strain at brake [%] | 58 |
| Printing method | FFF |
Table 2.
Printing parameters.
Table 2.
Printing parameters.
| Parameter | Value |
|---|
| Layer thickness [mm] | 0.1 |
| Base plane of specimen | XY |
| Matrix filament orientation in lamina [degrees] | 0/90; 15/−75; 30/−60; 45/−45 |
| Number of walls | 0; 2; 15 |
| Fill density [%] | 100 |
| Infill type | Solid fill |
| Number of floor and roof layers | 0; 2; 10 |
| Number of laminas | 30 |
Table 3.
Results and specification of specimen series.
Table 3.
Results and specification of specimen series.
| Series | Number of Walls | Infill Orientation | Number of Roof/Floor Layers | Yielding Force [N] | Maximum Force [N] | Printing Time [min] | Specimen Weight [g] |
|---|
| Alpha | 2 | 45/−45 | 2 | 579.85 | 1175.203 | 83 | 8.48 |
| Beta | 2 | 0/90 | 2 | 597.28 | 950.62 | 81 | 8.3 |
| Gamma | 2 | 15/−75 | 2 | 615.91 | 1054.31 | 82 | 8.41 |
| Delta | 2 | 30/−60 | 2 | 569.25 | 1102.23 | 83 | 8.5 |
| Epsilon | 2 | 45/−45 | 10 | 607.82 | 1333.03 | 84 | 8.68 |
| Zeta | 15 | 0/90 | 2 | 830.78 | 1566.22 | 105 | 8.72 |
| Eta | 2 | 45/−45 | 0 | 526.05 | 1062.24 | 76 | 8.46 |
| Theta | 0 | 0/90 | 2 | 546.47 | 819.09 | 64 | 8.43 |
Table 4.
Elongation values for the selected infill orientations (mm).
Table 4.
Elongation values for the selected infill orientations (mm).
| Infill Orientation | Elongation at Yield Limit | Elongation at Fracture | Permanent Set |
|---|
| 45/−45 | 5.4364 | 27.81 | 12.35 |
| 0/90 | 3.81 | 7.84 | 1.98 |
| 15/−75 | 3.95 | 11.68 | 3.46 |
| 30/−60 | 4.86 | 17.39 | 6.42 |
Table 5.
Elongation values for selected numbers of walls (mm).
Table 5.
Elongation values for selected numbers of walls (mm).
| Number of Walls | Elongation at Yield Limit | Elongation at Fracture | Permanent Set |
|---|
| 15 | 2.94 | 11.75 | 4.44 |
| 0 | 4.85 | 7.55 | 2.47 |
Table 6.
Elongation values for the selected numbers of roof/floor layers (mm).
Table 6.
Elongation values for the selected numbers of roof/floor layers (mm).
| Number of Roof/Floor Layers | Elongation at Yield Limit | Elongation at Fracture | Permanent Set |
|---|
| 0 | 6.025 | 20.09 | 10.87 |
| 10 | 4.85 | 27.63 | 11.86 |
Table 7.
Influence of infill orientation on specimen weight.
Table 7.
Influence of infill orientation on specimen weight.
| Infill Type | Reduction of Specimen Weight [%] | Reduction of Maximum Force [%] |
|---|
| 45/−45 | - | - |
| 30/−60 | 0 | −6.2 |
| 15/−75 | −1 | −10.3 |
| 0/90 | −2.1 | −19.1 |
Table 8.
Influence of selected printing parameters on the reduction of specimen weight and ultimate strength.
Table 8.
Influence of selected printing parameters on the reduction of specimen weight and ultimate strength.
| Number of Walls | Weight Reduction [%] | Reduction of Ultimate Strength [%] | Number of Floor/Roof Layers | Weight Reduction [%] | Reduction of Ultimate Strength [%] |
|---|
| 15 | - | - | 10 | - | - |
| 0 | −3.3 | −47.7 | 0 | −2.5 | −20.3 |
Table 9.
Influence of the selected printing parameters on the reduction of printing time and ultimate strength.
Table 9.
Influence of the selected printing parameters on the reduction of printing time and ultimate strength.
| Number of Walls | Printing Time Reduction [%] | Reduction of Ultimate Strength [%] | Number of Floor/Roof Layers | Printing Time Reduction [%] | Reduction of Ultimate Strength [%] |
|---|
| 15 | - | - | 10 | - | - |
| 0 | −2.9 | −47.7 | 0 | −2.1 | −20.3 |


