Article

Study on Ultrasonic Nondestructive Testing of Self-Compacting Concrete under Uniaxial Compression Test

1
College of Water Resources & Civil Engineering, China Agricultural University, Beijing 100083, China
2
School of Engineering and Technology, China University of Geosciences, Beijing 100083, China
*
Author to whom correspondence should be addressed.
Materials 2022, 15(13), 4412; https://doi.org/10.3390/ma15134412
Submission received: 20 May 2022 / Revised: 16 June 2022 / Accepted: 18 June 2022 / Published: 22 June 2022

Abstract

:
To study the variation law of ultrasonic parameters of self-compacting concrete before and after damage under uniaxial compression test conditions, the C30 self-compacting concrete blocks stored for 7 days and 28 days were subjected to ultrasonic nondestructive testing, and the variation law of the sound time, amplitude, and sound velocity before and after the damage of self-compacting concrete blocks was emphatically analyzed. The concrete acoustic detection software was introduced to judge and analyze the abnormal values of the parameters of each measuring point, and the defect distribution map of each test block was obtained. The results showed that after curing the self-compacting concrete test block for 7 days and 28 days, the average value of sound time before and after the failure of each measuring point of the test block is small, and the average value of sound time before the failure is less than that after; the average amplitude after failure is smaller than that before failure, and the amplitude of some measuring points will be smaller than that before. The average sound velocity after failure is less than that before failure, and the internal defects appear and the structure is not dense. This study provides a theoretical basis for the application of ultrasonic detection technology in the field of self-compacting concrete and also provides a practical basis for the stability monitoring and failure warning of self-compacting concrete.

1. Introduction

Self-compacting concrete (SCC) is a new composite material developed based on ordinary concrete; with its gravity, it can be compacted and formed, which has excellent construction performance [1,2,3,4,5]. In recent years, it has been widely used in many projects [6,7,8,9], which has become a new direction for the development of concrete materials. For example, a super-high-rise project adopted C60 SCC for pouring [10], and Miyun Reservoir adopted C20 SCC for the second lining project of a tunnel pipe [11], and it is applied in high-speed railway project construction [12] and in pouring prefabricated components [13].
Although SCC has good working performance, during the use of SCC, its structure is affected by an external load, and it undergoes internal defects and cavity initiation and expansion; finally, it leads to structural damage, which seriously affects the bearing capacity and durability of the components [14,15,16,17,18,19]. Therefore, we must choose appropriate methods to judge whether there are defects in the use of SCC materials to ensure the safety of concrete structures. The change of ultrasonic parameters before and after SCC failure is studied, to ensure that the quality defects of SCC components are detected without damage [20,21,22], which is the trend of SCC engineering quality detection.
Sandrine Rakotonarivo [23] studied the influence of concrete interface transition zone on ultrasonic parameters. In general, the construction period of concrete construction is long and the coverage is wide, which is easily affected by external factors [24,25]. Therefore, various defects are prone to occur in the actual pouring process, thus affecting the structural stability of concrete engineering. As a dynamic nondestructive testing method [26,27,28,29,30], ultrasonic testing technology has been widely used in the field of concrete due to its strong applicability, high detection sensitivity, and timely detection results [8]. In the detection of SCC engineering with defects [31,32,33], it can locate the defect position more accurately and further determine the causes of defects. The principle [31] of using ultrasonic detection technology to detect SCC in projects is that the ultrasonic pulse source emits a high-frequency elastic pulse wave to SCC, and then the wave fluctuation characteristics are recorded. When there is a discontinuous interface in concrete, the wave impedance surface appears on the defect surface, and when the wave reaches the interface, the transmission and reflection of the wave are produced, and the energy received by the wave is reduced [34]. When the concrete has serious defects such as looseness, honeycomb, and holes, it will produce scattering and diffraction of waves [35]. According to the initial arrival time of the wave and the energy attenuation characteristics of the wave, the frequency change, and the degree of waveform distortion, the density parameters of concrete can be obtained [36]. By processing and analyzing the ultrasonic characteristics of different sides and heights, the nature, size, and spatial relationship of concrete defects can be identified. It can be seen that, compared with the traditional detection technology, ultrasonic detection technology greatly improves the efficiency and accuracy of the whole project detection [37].
Scholars have studied the SCC engineering by ultrasonic testing. Dong Junfeng [8] used ultrasonic to test the void defects of self-compacting concrete and proposed a more accurate method to judge the sound velocity of void defects. Hao Wenxiu [38] compared the influence of different concrete strengths on ultrasonic wave speed. Gu Xingyu [39] established a three-phase finite element model of asphalt concrete concerning the results of ultrasonic testing. Huang Zhengyu [40] studied a simple and practical method for qualitative analysis of ultrasonic detection of concrete defects and imaging. Qu Xiushu [41] proposed the superposition principle in the calculation of the rectangular concrete-filled steel tube column based on the test data of the ultrasonic inspection of the concrete-filled steel tube. Zhao Guoqi [42] used ultrasonic signals in a specific frequency domain to perform health inspections on key parts of large concrete structures. Zheng Dan [43] studied the influence of frequency and water content on ultrasonic testing of concrete. Zhu Ziqiang [44] studied the attenuation characteristics of ultrasonic waves in concrete. Chen Dongdong [45] studied the power spectrum characteristics of ultrasonic wave propagation in concrete. Lin Weizheng [46] studied the thickness of cement concrete with the ultrasonic detector. Qin Tienan [47] measured the thickness of a concrete coating by the ultrasonic wave and evaluated the uncertainty. Petr Cikrle [48] introduced the application of ultrasonic inspection in concrete bridges and measured the size of holes in concrete panels.
In this paper, an ultrasonic testing analyzer was used to collect ultrasonic parameters of SCC before and after the uniaxial compression test, to study the variation of ultrasonic parameters of SCC before and after failure, to determine the distribution of internal defects in SCC under load. The evolution law of internal defects of SCC after failure is obtained, it provides a theoretical basis for the application of ultrasonic testing technology to the field of SCC, and it also provides a practical basis for stability monitoring and failure warning of SCC engineering.

2. Experiment Preparation

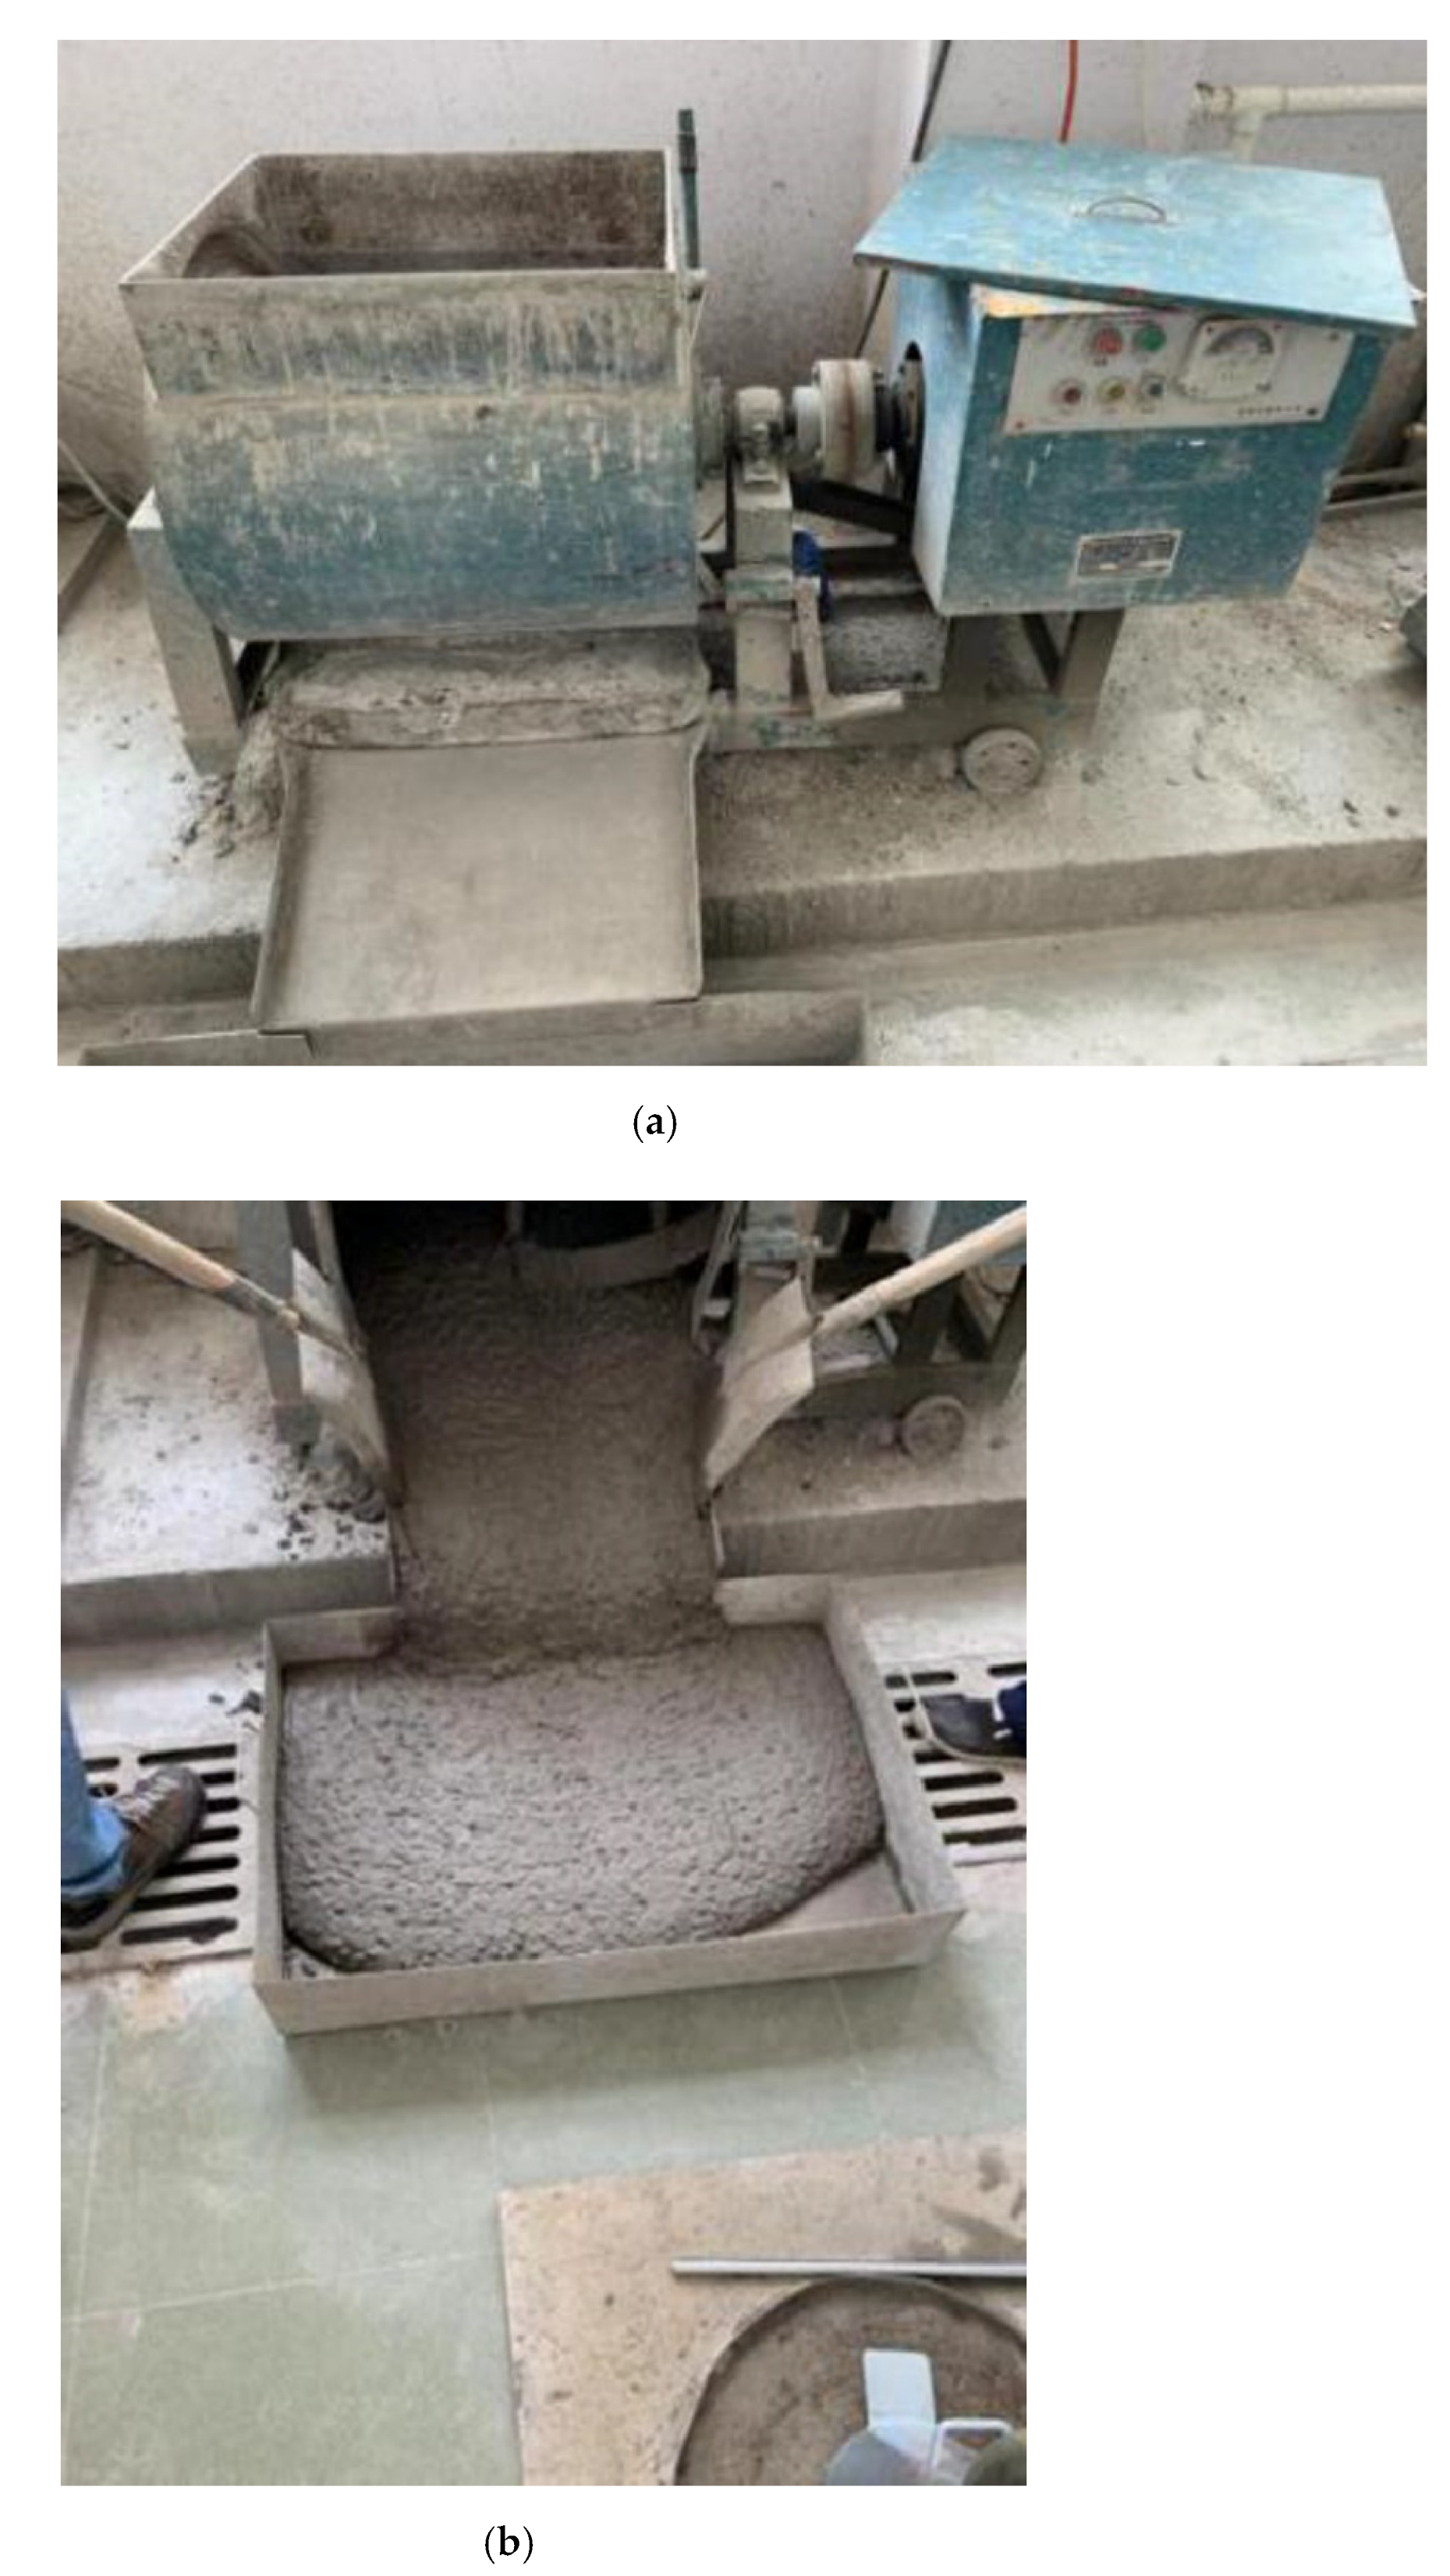
2.1. Test Raw Material and Proportion

The mixed design of SCC aims at the performance indexes needed in practical engineering [49]. The design code of SCC [50,51] and the experiment show that the working performance of the prepared concrete mixture meets the specified working requirements, and the designed proportioning scheme is scientific and feasible. Subsequent tests can be carried out with the prepared concrete [52,53]. Materials used in SCC mixtures are powders, natural aggregates, admixtures, and additives.
The cement selected is ordinary Portland cement with a grade of PO 42.5, the initial setting time is greater than 150 min, and the final setting time is less than 240 min. Natural aggregate mainly includes coarse aggregate and fine aggregate. The fine aggregate is river sand, the fineness modulus is 2.3–3.0, the main component is quartz sand, the surface is mostly round, the appearance is smooth, the texture is hard and dense, the porosity is low, the bonding force with cement is poor, the moisture content is 0.01%, and the water absorption is poor. The coarse aggregate is natural gravel, the particle size is 4.75–19 mm, the surface is rough and has the characteristics of porosity to absorb the cement slurry, and the bonding force with the cement is strong. The ratio of fine aggregate to coarse aggregate is 1.58. Admixture is a polycarboxylate water-reducing agent, and the main component is a polycarboxylate polymer masterbatch, with a high water-reducing rate, which can improve the fluidity of SCC by 25–35%, with good plasticity and being green and pollution-free. The performance indexes of raw materials used in the test are shown in Table 1.
According to the test requirements, C30 SCC was used for testing, and the ratios in Table 2 were obtained through multiple ratio tests. The SCC mix ratio is produced according to the design ratio. The quality of the required raw materials is weighed according to the design of each set ratio, and then crushed stone, fly ash, cement, and sand are added to the single-shaft forced concrete mixer in sequence (Figure 1a). Then, water and water reducer are added evenly during the mixing process, and the mixing process lasts for 3–5 min. After the mixing process is over, the mixer is turned off, the concrete mixture is placed upside down in the container, and the concrete is then mixed. The object is shown in Figure 1b.
We tested the slump extension, expansion time T500, v-shaped funnel time, and H2/H1 value of the concrete mixture [54]. Each test is shown in Figure 2.
See Table 3 for the work performance values and test results required by the SCC design code “Technical Specification for Self-compacting Concrete Application” JGJ/T 283-2012 and other requirements [55,56].

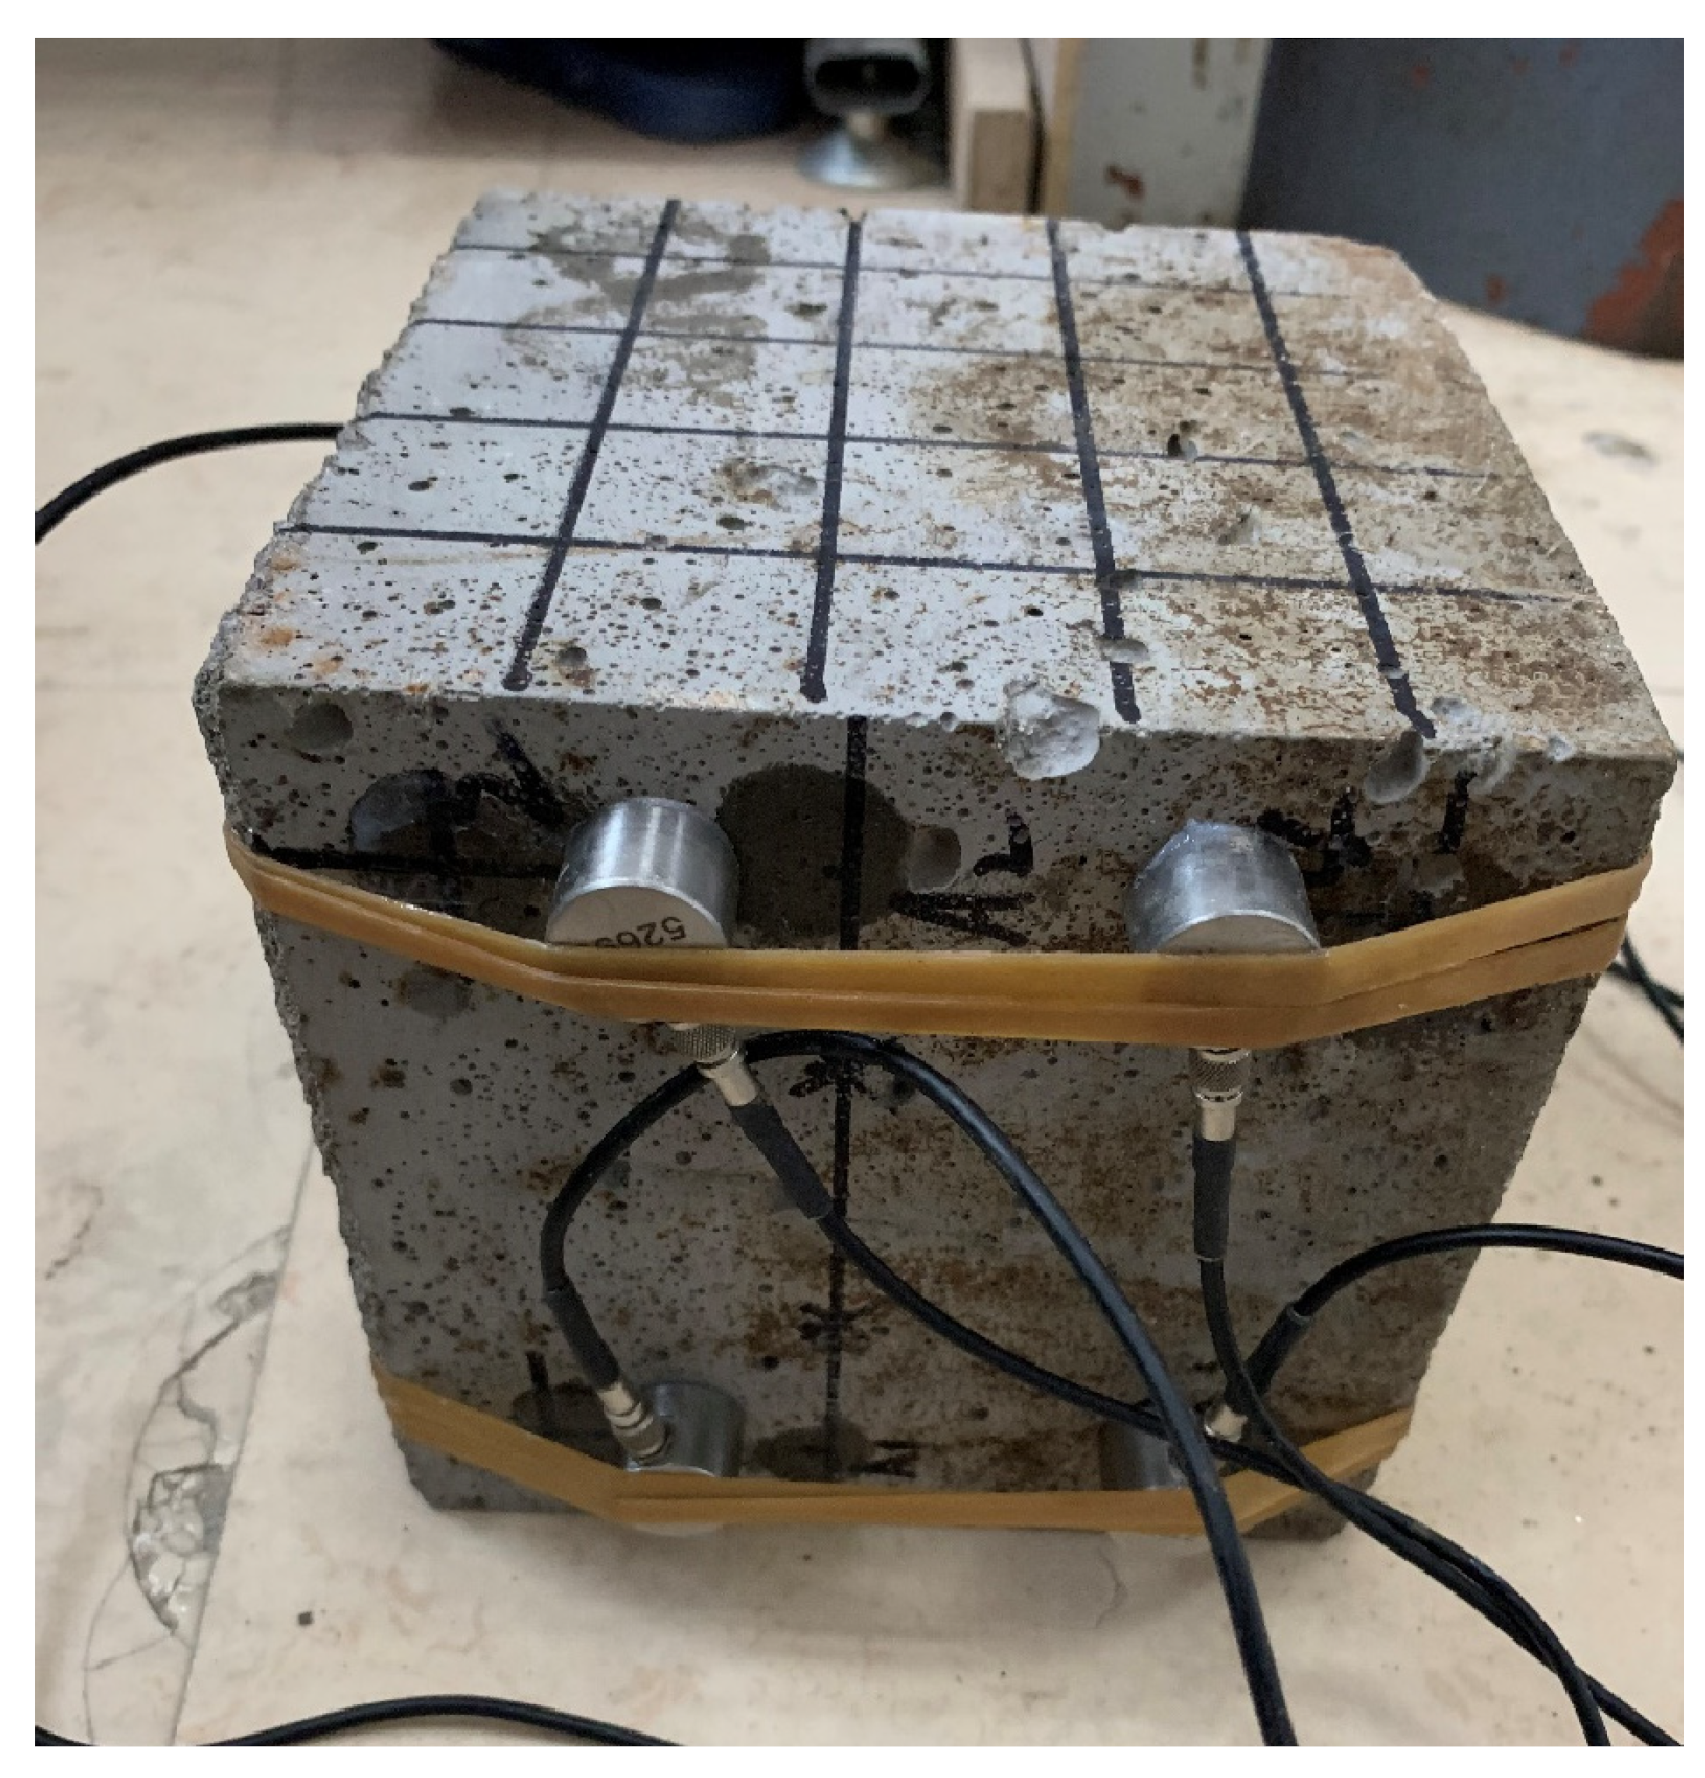
2.2. Specimen Design

Based on the design code of self-compacting concrete and the values obtained by tests [51,55,56,57], two groups of SCC test blocks (group A1 and group A2) with the specification of 150 mm × 150 mm × 150 mm were made, each as a set of three test blocks. After 24 h, the mold was removed and placed in the standard curing room for curing. Under the same curing conditions, the A1 test block was maintained for 7 days and the A2 test block was maintained for 28 days.
The experiment shows that the workability of the prepared concrete mixture meets the specified working requirements, and the designed mix proportion scheme is scientific and feasible. After that, tests can be carried out with the prepared SCC.

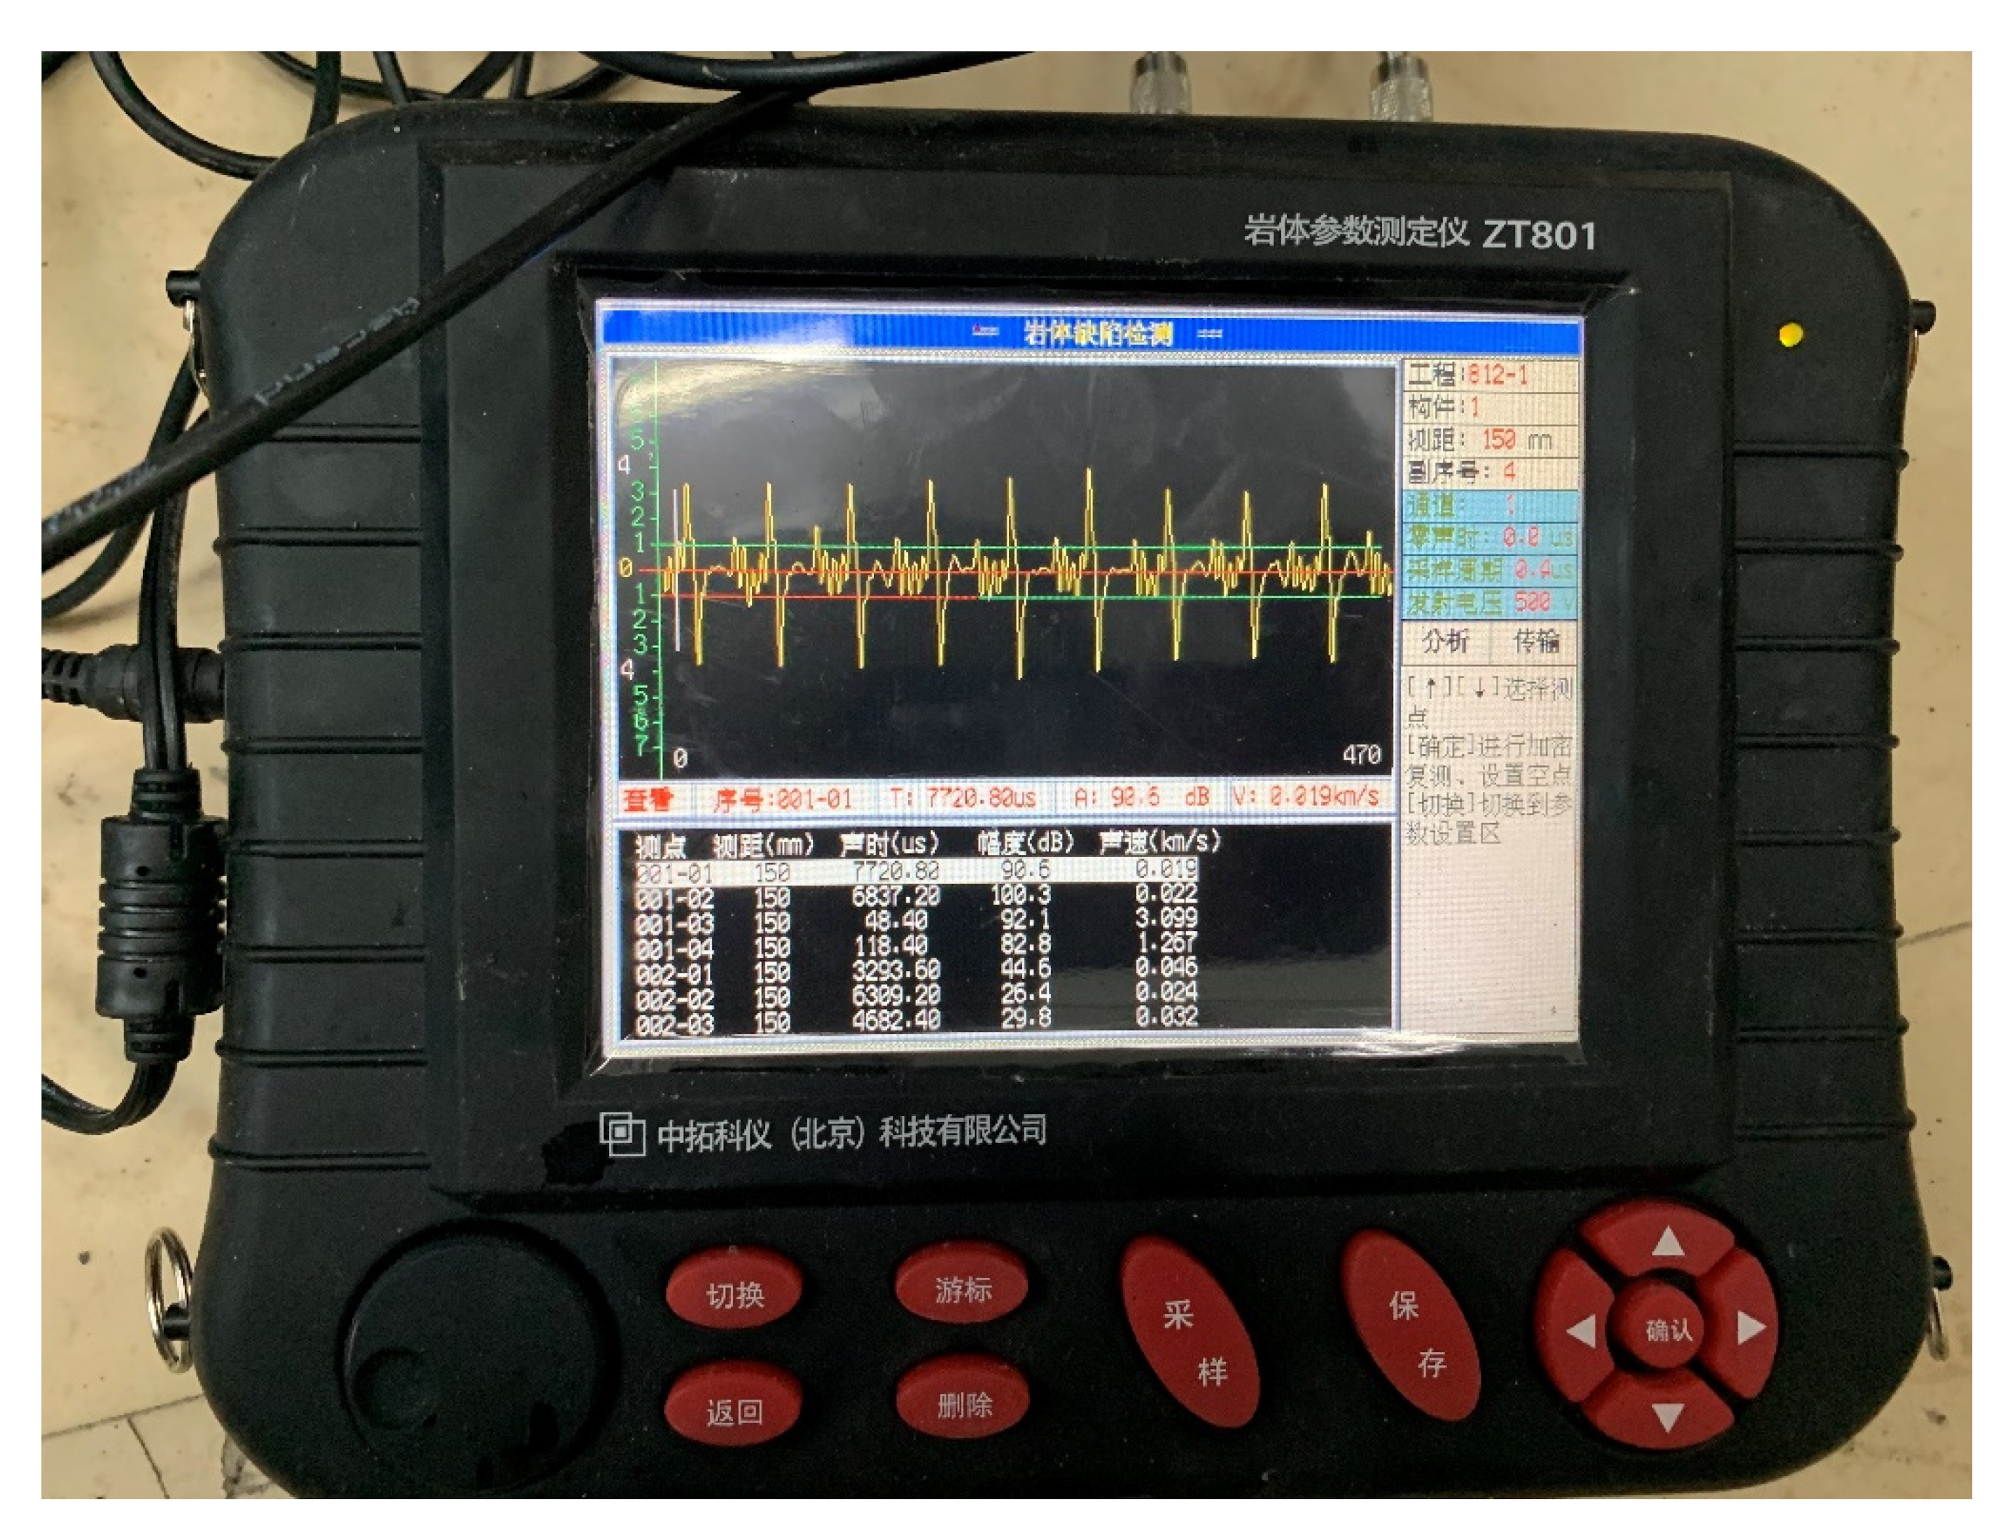
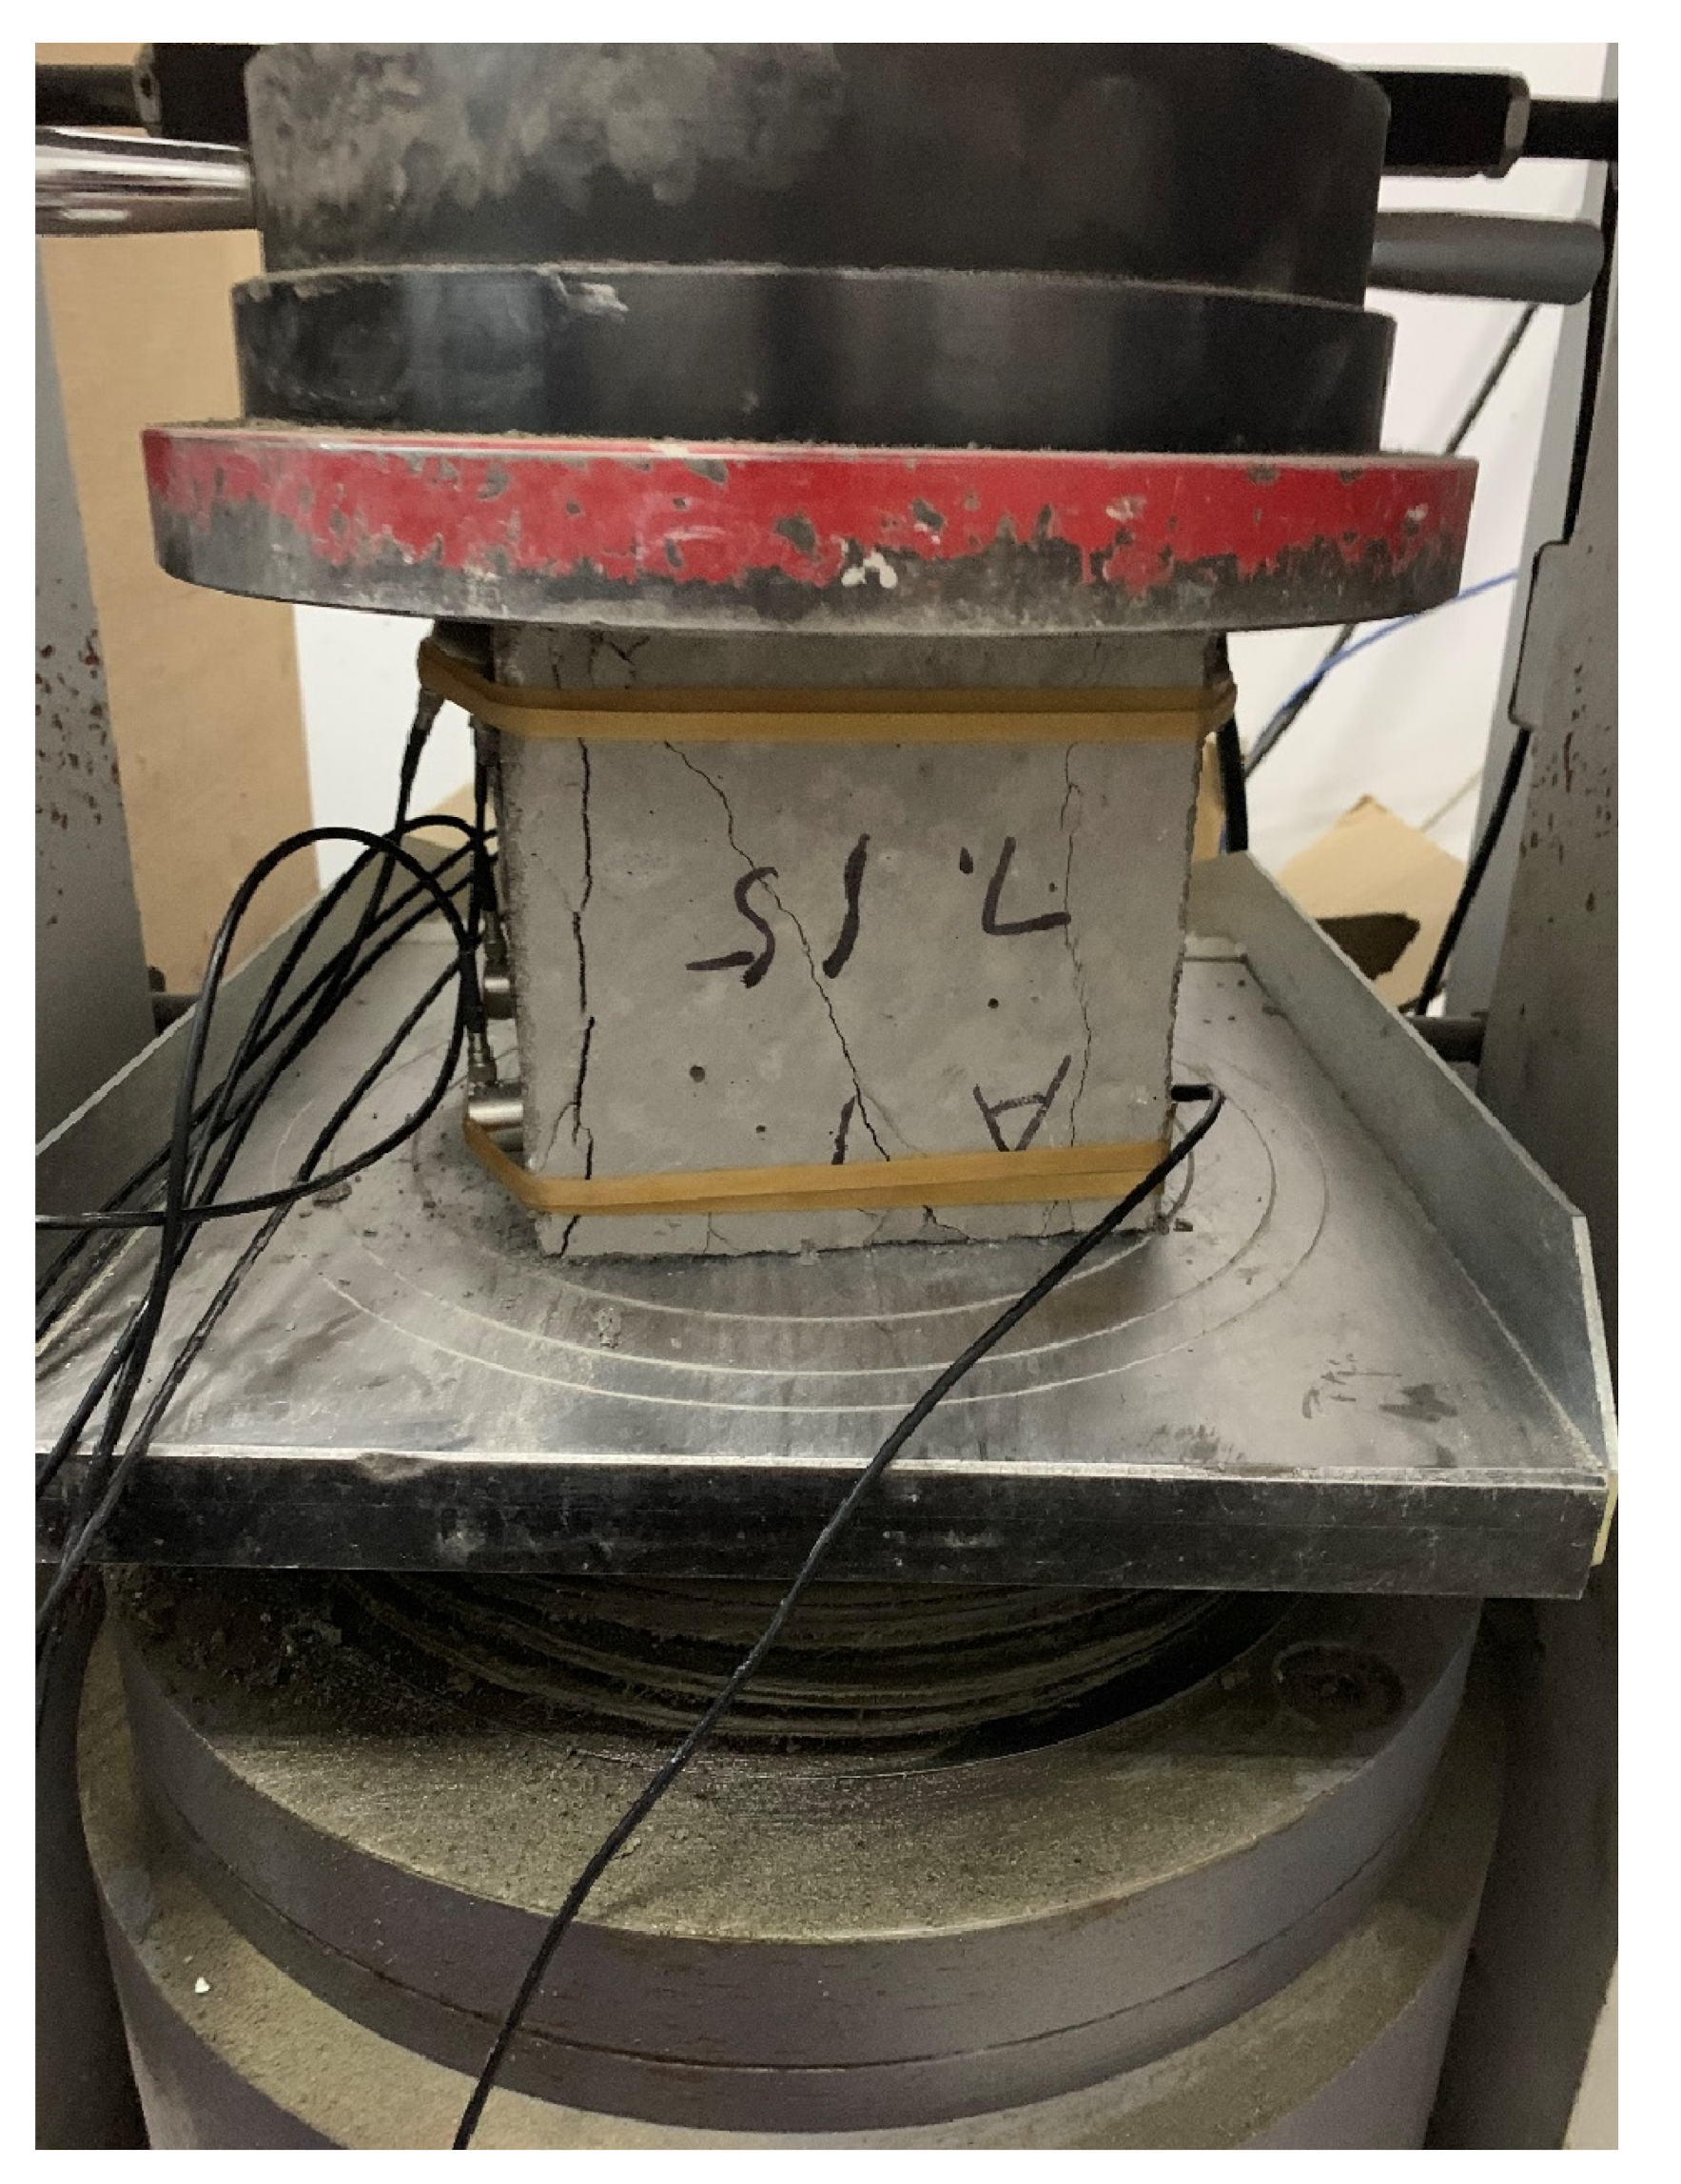
2.3. The Test Process

Similar to acoustic emission detection [57], ultrasonic testing technology was used to detect each test block after curing. An ultrasonic testing analyzer (The ZT801 geotechnical acoustic wave tester produced by Zhongtuo Technology (Beijing) Technology Co., Ltd. was selected for this test.) was used to collect ultrasonic parameters of test blocks A1 and A2 before and after the uniaxial compression test. Before the uniaxial compressive strength test of the self-compacting concrete block, we used the ultrasonic testing analyzer (as shown in Figure 3) to sample the data from the intact test block, which is relatively close to the transmitting transducer and the receiving transducer. On the test point, for the accuracy of the test, we reduced the friction between the transducer and the test surface of the test block, reduced the loss of energy, and used the coupling agent to tightly fit the transducer on the test point.
Then, we collected the relevant measuring point data. The sampling sequence is carried out according to the arrangement order of the measuring point. The sampling method of each measuring point is the same. If there is an error in the sampling of a measuring point, the measurement point is remeasured, the acoustic parameters of each measurement point are collected multiple times, and the average value of the collected data is obtained. When the uniaxial compressive strength test of the self-compacting concrete is completed, the measurement point of each specimen after failure is sampled, and the sampling method is the same as the operation before failure. The data sampled by the geotechnical acoustic wave detection analyzer (The ZT801 geotechnical acoustic wave tester produced by Zhongtuo Technology (Beijing) Technology Co., Ltd. was selected for this test.) include the sound speed, sound time, and amplitude of each measuring point.
For the experiment of pair measuring method (as shown in Figure 4) for data collection, the distance is 150 mm, the distance between measuring points is 0.25 m, the sampling period is 0.4 us, and the block surface is mesh of 5 × 5. We formed 25 test points, the detection of the surface relative to the surface, in the same position for 5 × 5 meshing, then formed, relatively, 25 test points, and the arrangement of the measuring points are shown in Figure 5. A uniaxial compression test was carried out with the WHY-2000 pressure testing machine (as shown in Figure 6, from China University of Geosciences (Beijing)), and the loading rate was 20 mm/min. The sensor layout of the text block is shown in Figure 7.

3. Analysis of Test Results

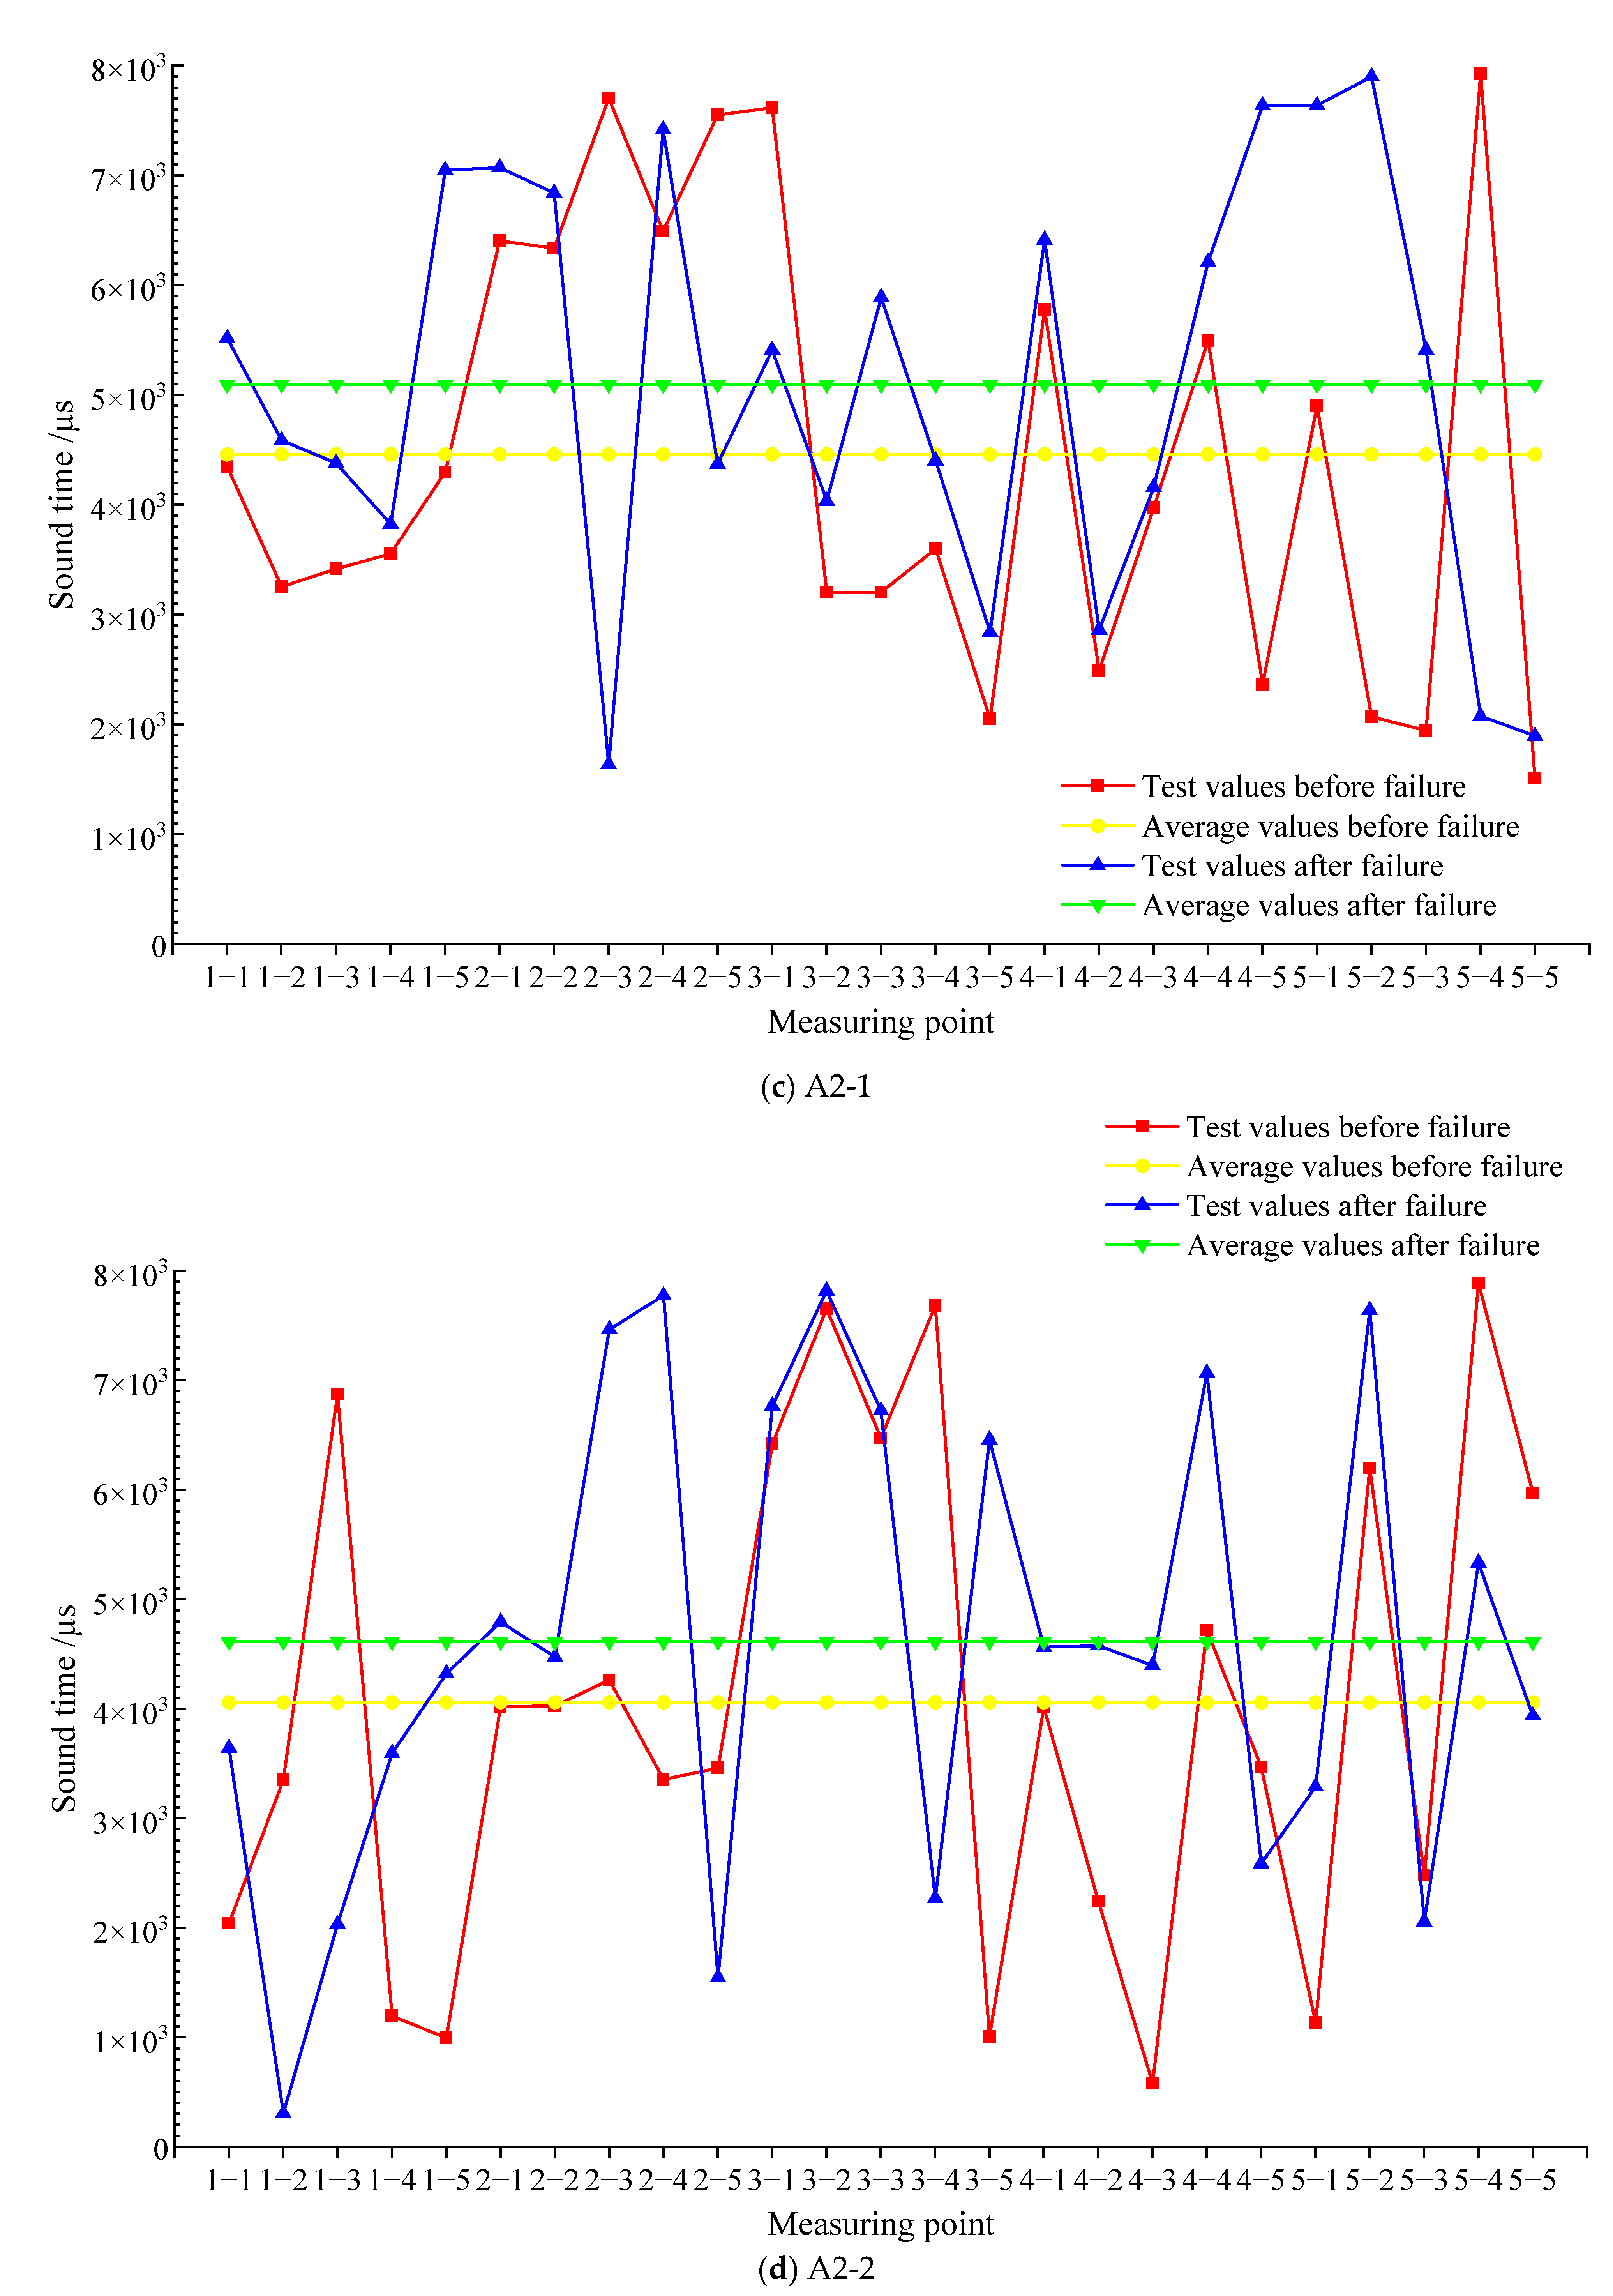
3.1. Analysis of Sound Time of Test Block

Figure 8 shows the sound time value of each measuring point before and after the failure of each test block and the average value of the sound time before and after the failure. As shown in Figure 8a, the average sound time value of test block A1-1 at each measuring point before destruction is 4859.1 μs, the average value of sound time at each measuring point after destruction is 5293.1 μs, the pre-damage average was 91.9% of the post-damage average, and the root-mean-square deviation of test block A1-1 before and after the damage is 2748.4 μs. Among the 25 measuring points, the sound time value of 17 measuring points before destruction is less than the sound time value after destruction, and the sound time value of most measuring points is greater than the sound time value before destruction. As a result, the average value of sound time after the destruction of test block A1-1 is obviously greater than the average value of sound time before destruction. As shown in Figure 8b, the average value of sound time of test block A1-2 at each measuring point before destruction is 4639.3 μs, and the average value of sound time at each measuring point after destruction is 5045.7 μs, the pre-damage average was 91.9% of the post-damage average, and the root-mean-square deviation of test block A1-2 before and after the damage is 2354.7 μs. The sound time value before the destruction of 14 measuring points is less than the sound time value after the destruction, and the sound time value of most measuring points after the destruction is greater than the sound time value before the destruction, so the average value of the sound time after the destruction of block A1-2 is greater than the average value of the sound time before the destruction. As shown in Figure 8c, the average sound time value of test block A2-1 at each measuring point before destruction is 4459.9 μs, the average value of sound time at each measuring point after destruction is 5099.3 μs, the pre-damage average was 87.5% of the post-damage average, and the root-mean-square deviation of test block A2-1 before and after the damage is 2689.5 μs. There are 21 detection points whose sound time value before destruction is less than that after destruction, and the sound time value of most detection points is greater than that before destruction, so the average value of sound time after the destruction of test block A2-1 is greater than that before destruction.
As shown in Figure 8d, the average sound time value of test block A2-2 at each measuring point before destruction is 4061.4 μs, the average value of sound time at each measuring point after destruction is 4618.2 μs, the pre-damage average was 87.9% of the post-damage average, and the root-mean-square deviation of test block A2-1 before and after the damage is 2698.1μs. In the test block, the sound time value after the destruction of 17 measuring points is greater than the sound time value before the destruction, so the average value of the sound time after the destruction is greater than the average value of the sound time before the destruction.
Above all, whether for the SCC test block after curing for 7 days or the SCC test block after curing for 28 days, the average value of sound time of the measured points before the destruction is less than the average value after the destruction, but the difference between the average value of sound time of the measured points before and after the destruction of each test block is small; this indicates that although internal defects occur in the test block after destruction, they are not sensitive to the influence of the average value of sound time. Combining Figure 8 with root-mean-square deviation analysis, the average value of sound time of some measuring points is significantly larger than that before the destruction. In theory, after the failure of the test block under the uniaxial compression test, defects and cracks appear in some structures. When ultrasonic encountered defects and cracks, scattering and reflection occurred. Ultrasonic would bypass defects and cracks and change the original propagation path.

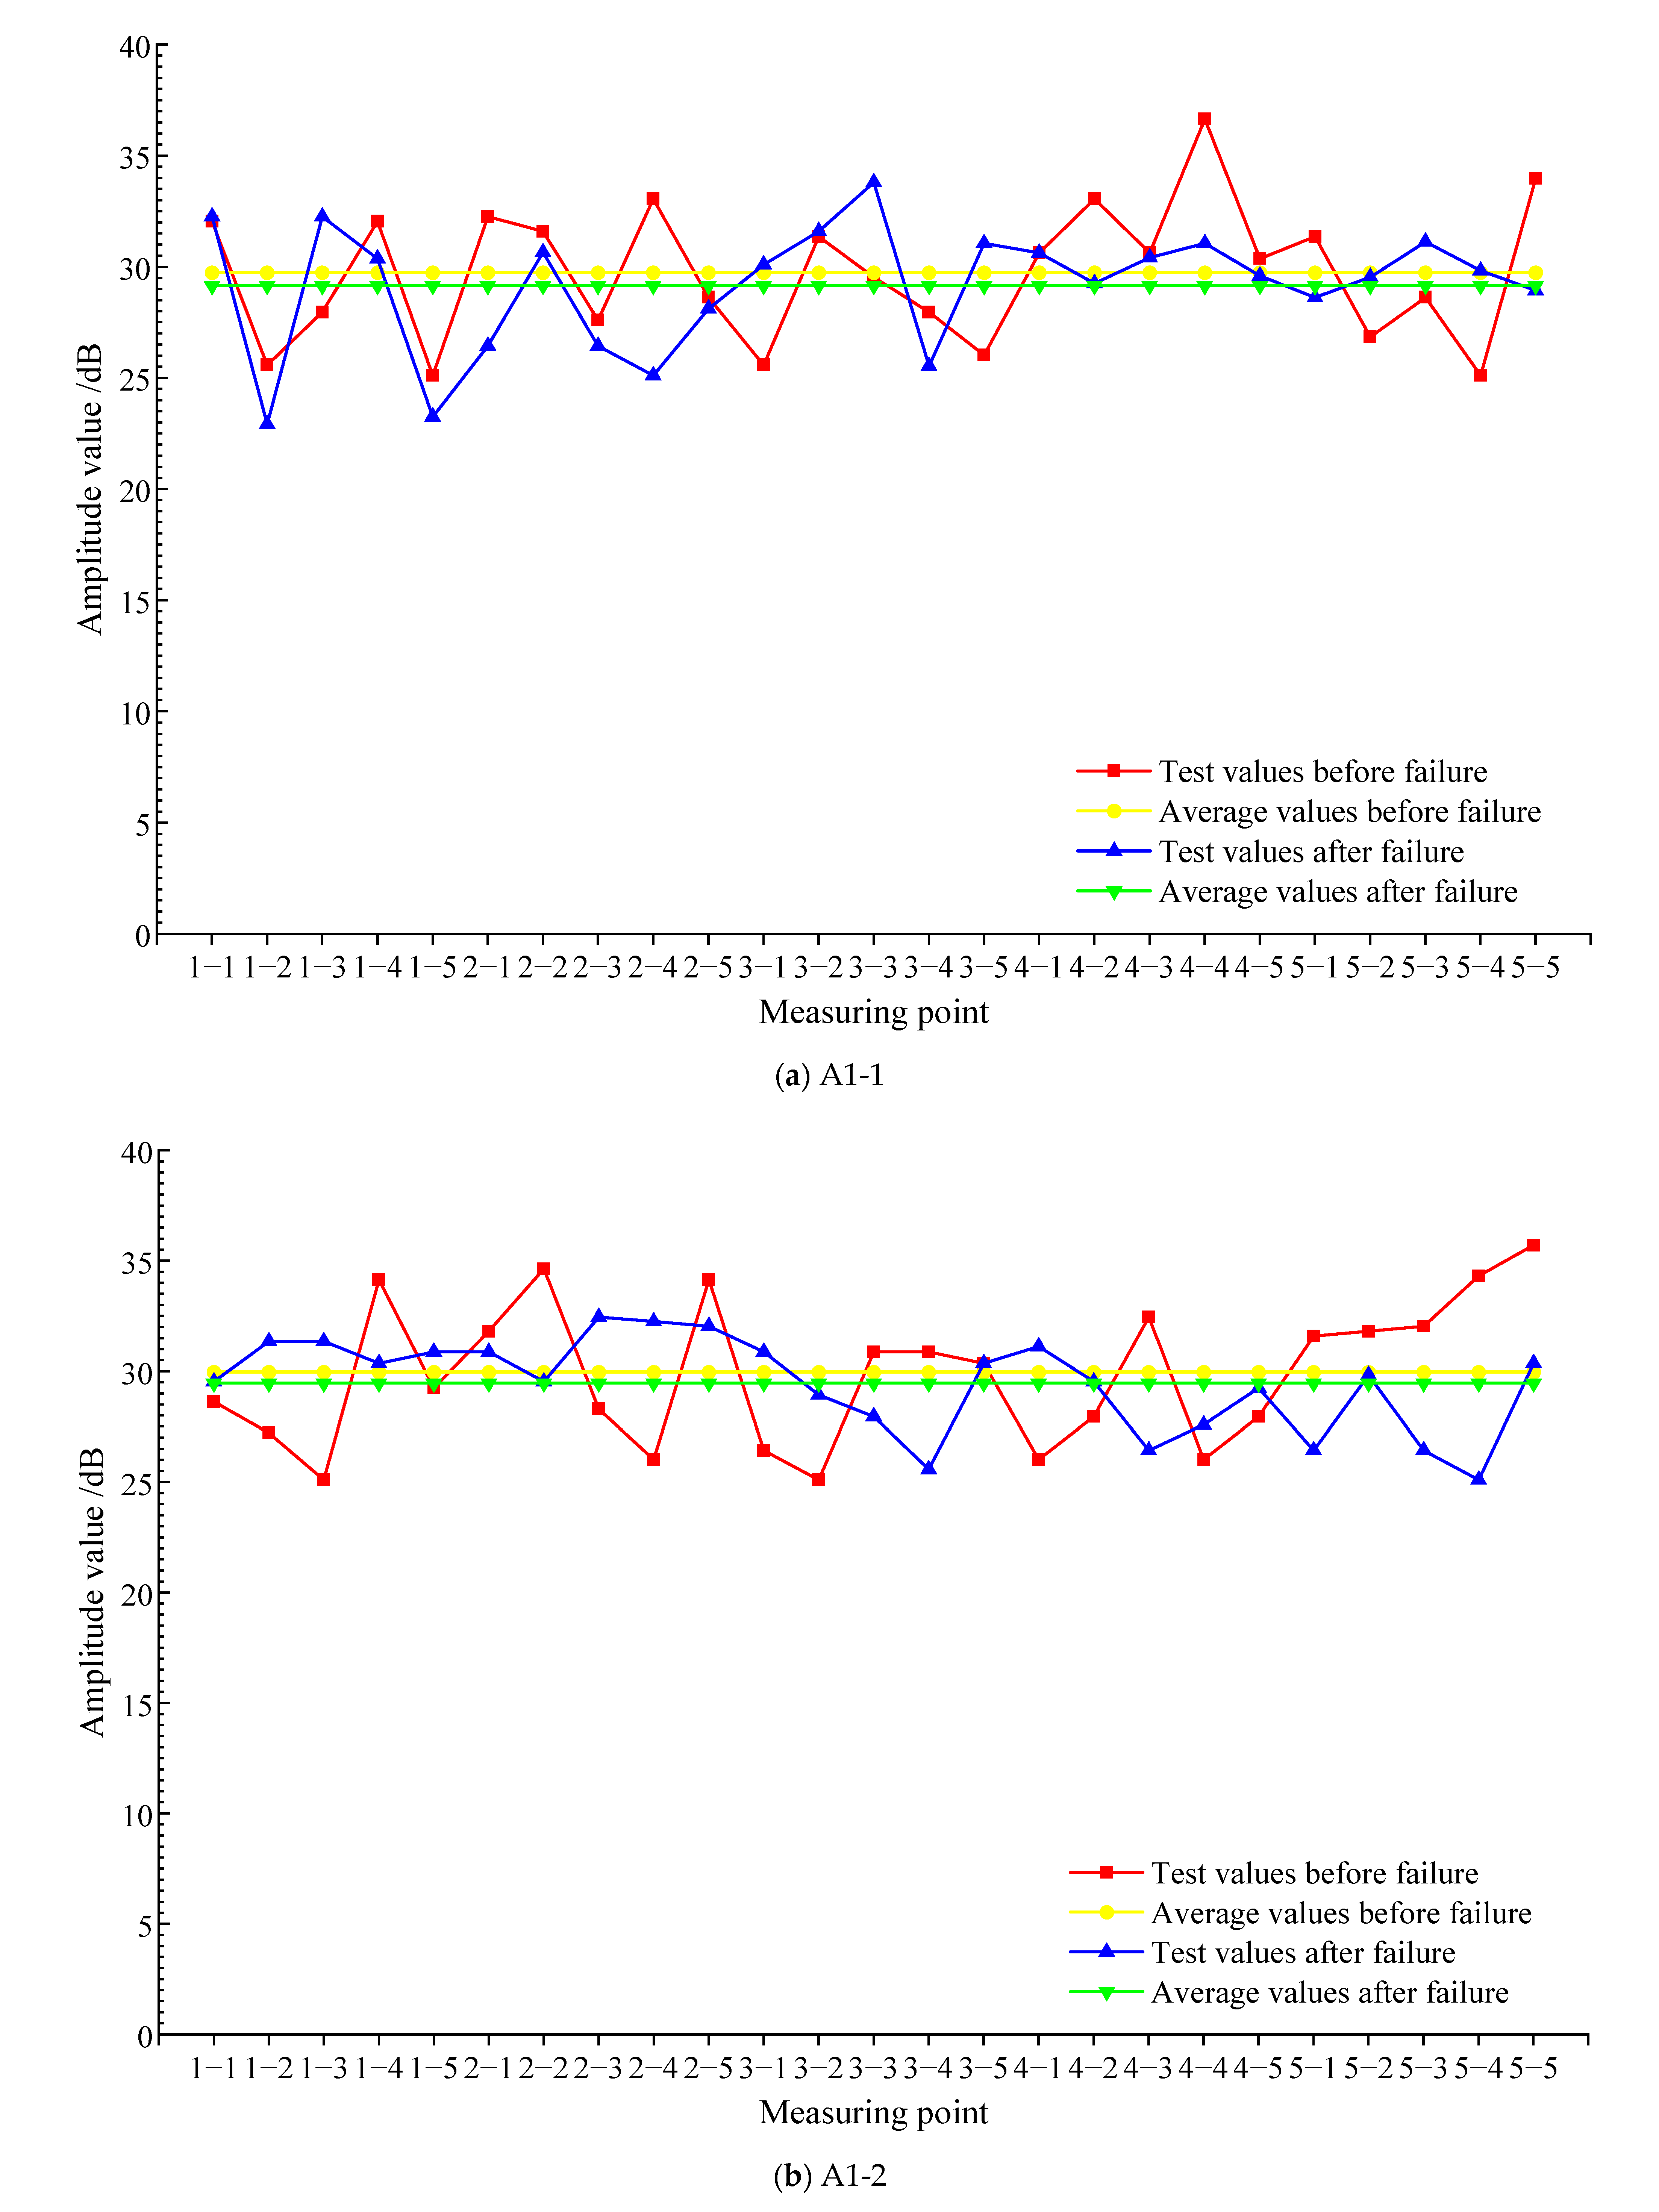
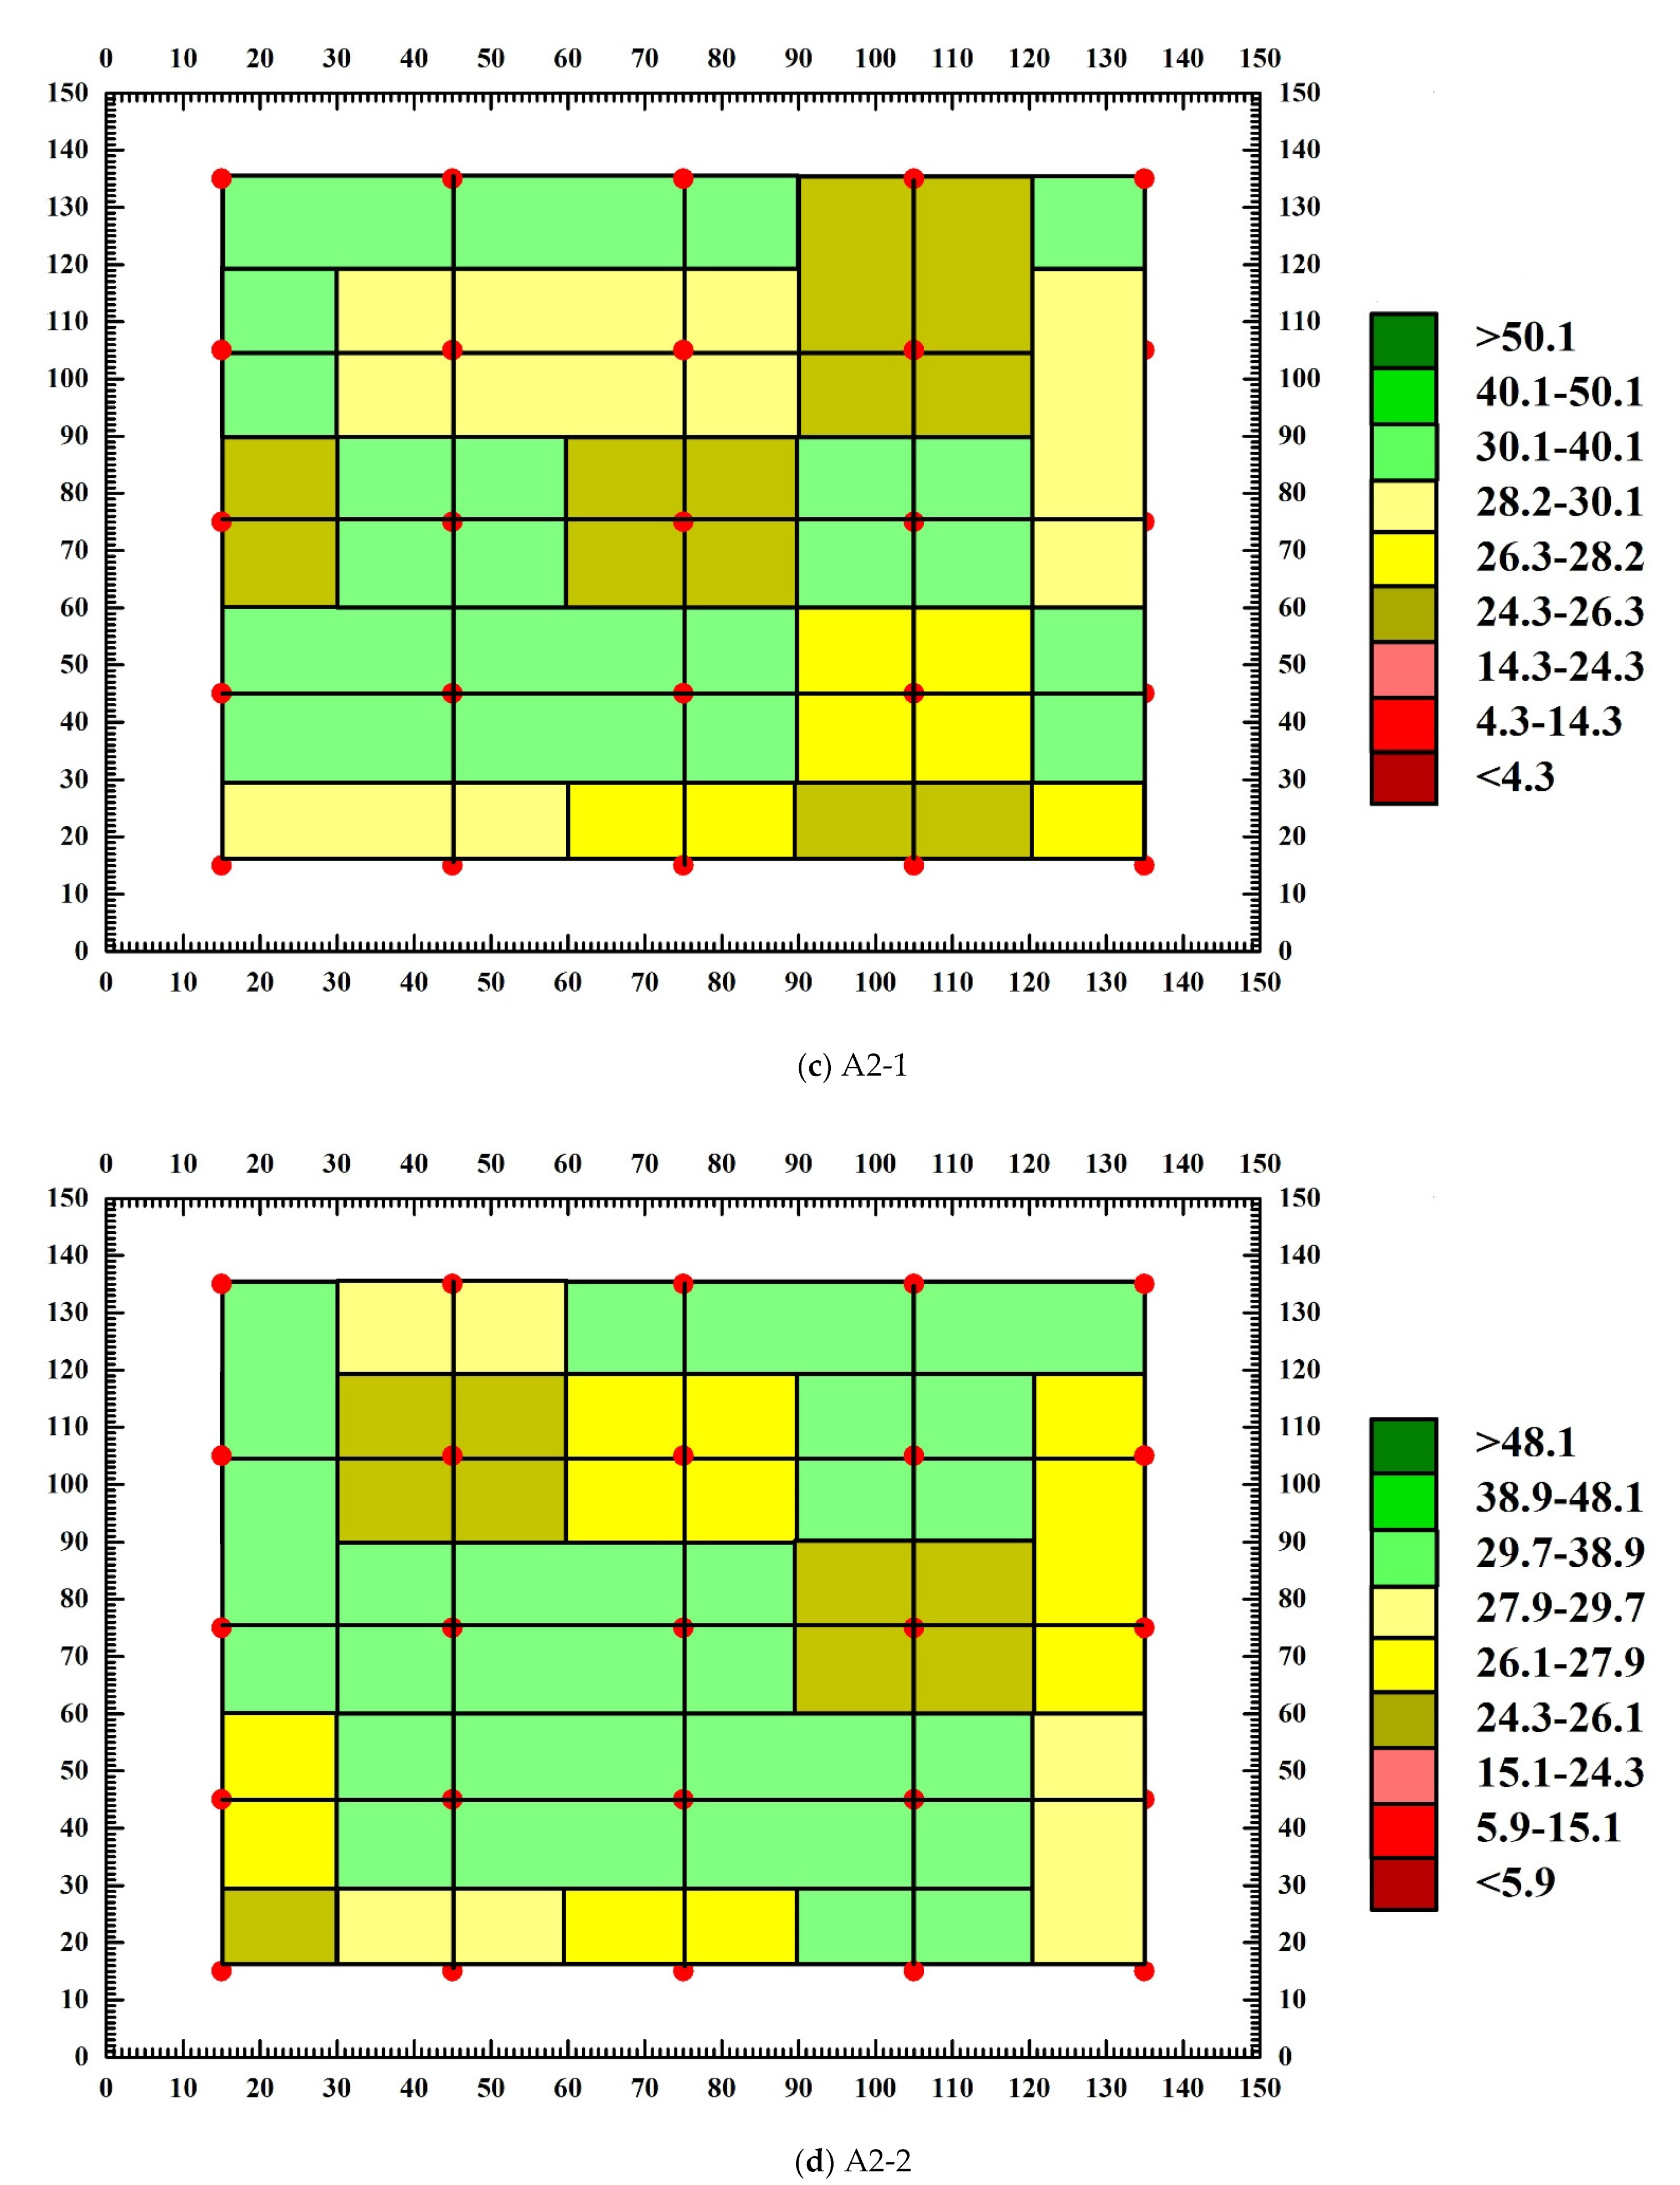
3.2. Analysis of Amplitude Value of Test Block

Figure 9 is the average value of the amplitude of each measuring point before and after the failure of each test block. According to Figure 9a, the average value of the amplitude of each measuring point before the failure of test block A1-1 is 29.74 dB, the average value of the amplitude of each measuring point after the failure is 29.16 dB, and the root-mean-square deviation of test block A1-1 before and after the damage is 3.51 dB. In each measuring point, the amplitude of 15 measuring points before failure is greater than that after failure, and the amplitude of most measuring points after failure is less than that before failure, resulting in the average value of the amplitude of A1-1 after failure being less than the average value of the amplitude before failure. According to Figure 9b, the average value of the amplitude of A1-2 before failure is 29.96 dB, the average value of the amplitude of each measuring point after failure is 29.46 dB, and the root-mean-square deviation of test block A1-2 before and after the damage is 4.34 dB. The amplitude of nearly half of the measuring points is smaller than that before failure, and the average value of A1-2 after failure is smaller than that before failure. It can be seen from Figure 9c that the average amplitude of each measuring point of test block A2-1 before failure is 30.13 dB, the average amplitude of each measuring point after failure is 29.16 dB, and the root-mean-square deviation of test block A2-1 before and after the damage is 4.06 dB. The amplitude of 14 measuring points before failure is greater than that after failure, and the amplitude of the remaining measuring points before failure is less than that after failure. The average amplitude of A2-1 after failure is smaller than the average value of amplitude before failure. From Figure 9d, it can be seen that the average amplitude of each measuring point of test block A2-2 before failure is 29.69 dB, the average amplitude of each measuring point after failure is 28.91 dB, and the root-mean-square deviation of test block A2-2 before and after the damage is 4.44 dB. The amplitude of most measuring points after the failure of the text block is smaller than that before failure so the average amplitude after failure is smaller than that before failure. Above all, whether for the SCC test block after curing for 7 days or the SCC test block after curing for 28 days, the average value of the amplitude of the measured points after the failure is smaller than the average value before the failure, but the difference between the average value of the amplitude of the measured points before and after the failure of each test block is smaller. Combining Figure 9 with root-mean-square deviation analysis, the amplitude of some measured points is significantly smaller than that before the failure. This is because the defects and cracks in the structure will lead to scattering and reflection during the ultrasonic wave propagation, and the ultrasonic wave will attenuate obviously, which will lead to the amplitude of some measuring points becoming smaller.

3.3. Analysis of Sound Velocity of the Text Block

Figure 10 shows the average value of the sound velocity of each measuring point before and after the failure of each test block. It can be seen from Figure 10a that the average sound velocity of each measuring point of test block A1-1 before failure is 0.042 km/s, the average sound velocity of each measuring point after failure is 0.039 km/s, and the root-mean-square deviation of test block A2-1 before and after the damage is 0.034 km/s. In all measuring points, more than half of the sound velocity after failure is less than that before failure, and the average sound velocity of test block A1-1 before failure is greater than that after failure. It can be seen in Figure 10b that the average value of the sound velocity of each measuring point of test block A1-2 before failure is 0.039 km/s, the average value of the sound velocity of each measuring point after failure is 0.036 km/s, and the root-mean-square deviation of test block A2-1 before and after the damage is 0.023 km/s. The average value after failure is 92.3% of the average value before failure. The average value of the sound velocity of 18 measuring points after failure is less than that before failure. The average value of the sound velocity of test block A1-2 before failure is greater than that after failure. It can be seen from Figure 10c that the average sound velocity of each measuring point of test block A2-1 before failure is 0.042 km/s, the average value of the sound velocity of each measuring point after failure is 0.039 km/s, and the root-mean-square deviation of test block A2-1 before and after the damage is 0.025 km/s. The average value of sound velocity before and after the failure of the text block is the same as that of A1-1. The average value of sound velocity before failure of A2-1 is greater than that after failure. According to Figure 10d, the average value of sound velocity after the failure of 16 measuring points of A2-2 is less than that before failure. The average value of the sound velocity of each measuring point before failure is 0.062 km/s, and the root-mean-square deviation of test block A2-1 before and after the damage is 0.069 km/s. The average value of the sound velocity of each measuring point after failure is 0.046 km/s, and the average value after failure is 74.2% of the average value before failure. The average value of the sound velocity of test block A2-2 after failure is smaller than the average value before failure.
Above all, whether for the SCC test block after curing for 7 days or the SCC test block after curing for 28 days, the average value of the sound velocity after the destruction of each measuring point is smaller than the average value before the destruction. Combining Figure 10 with root-mean-square deviation analysis, the sound velocity value of some measuring points is significantly smaller than that before the destruction. This is because the internal medium is more uniform before the failure of the SCC test block. Therefore, the ultrasonic wave propagates at a relatively high speed inside the test block. However, in the later stage, due to the failure of the text block, defects appear in part of the structure of the text block, resulting in the noncompactness of the structure of part of the text block. Therefore, the sound velocity value of some measuring points will decrease significantly.

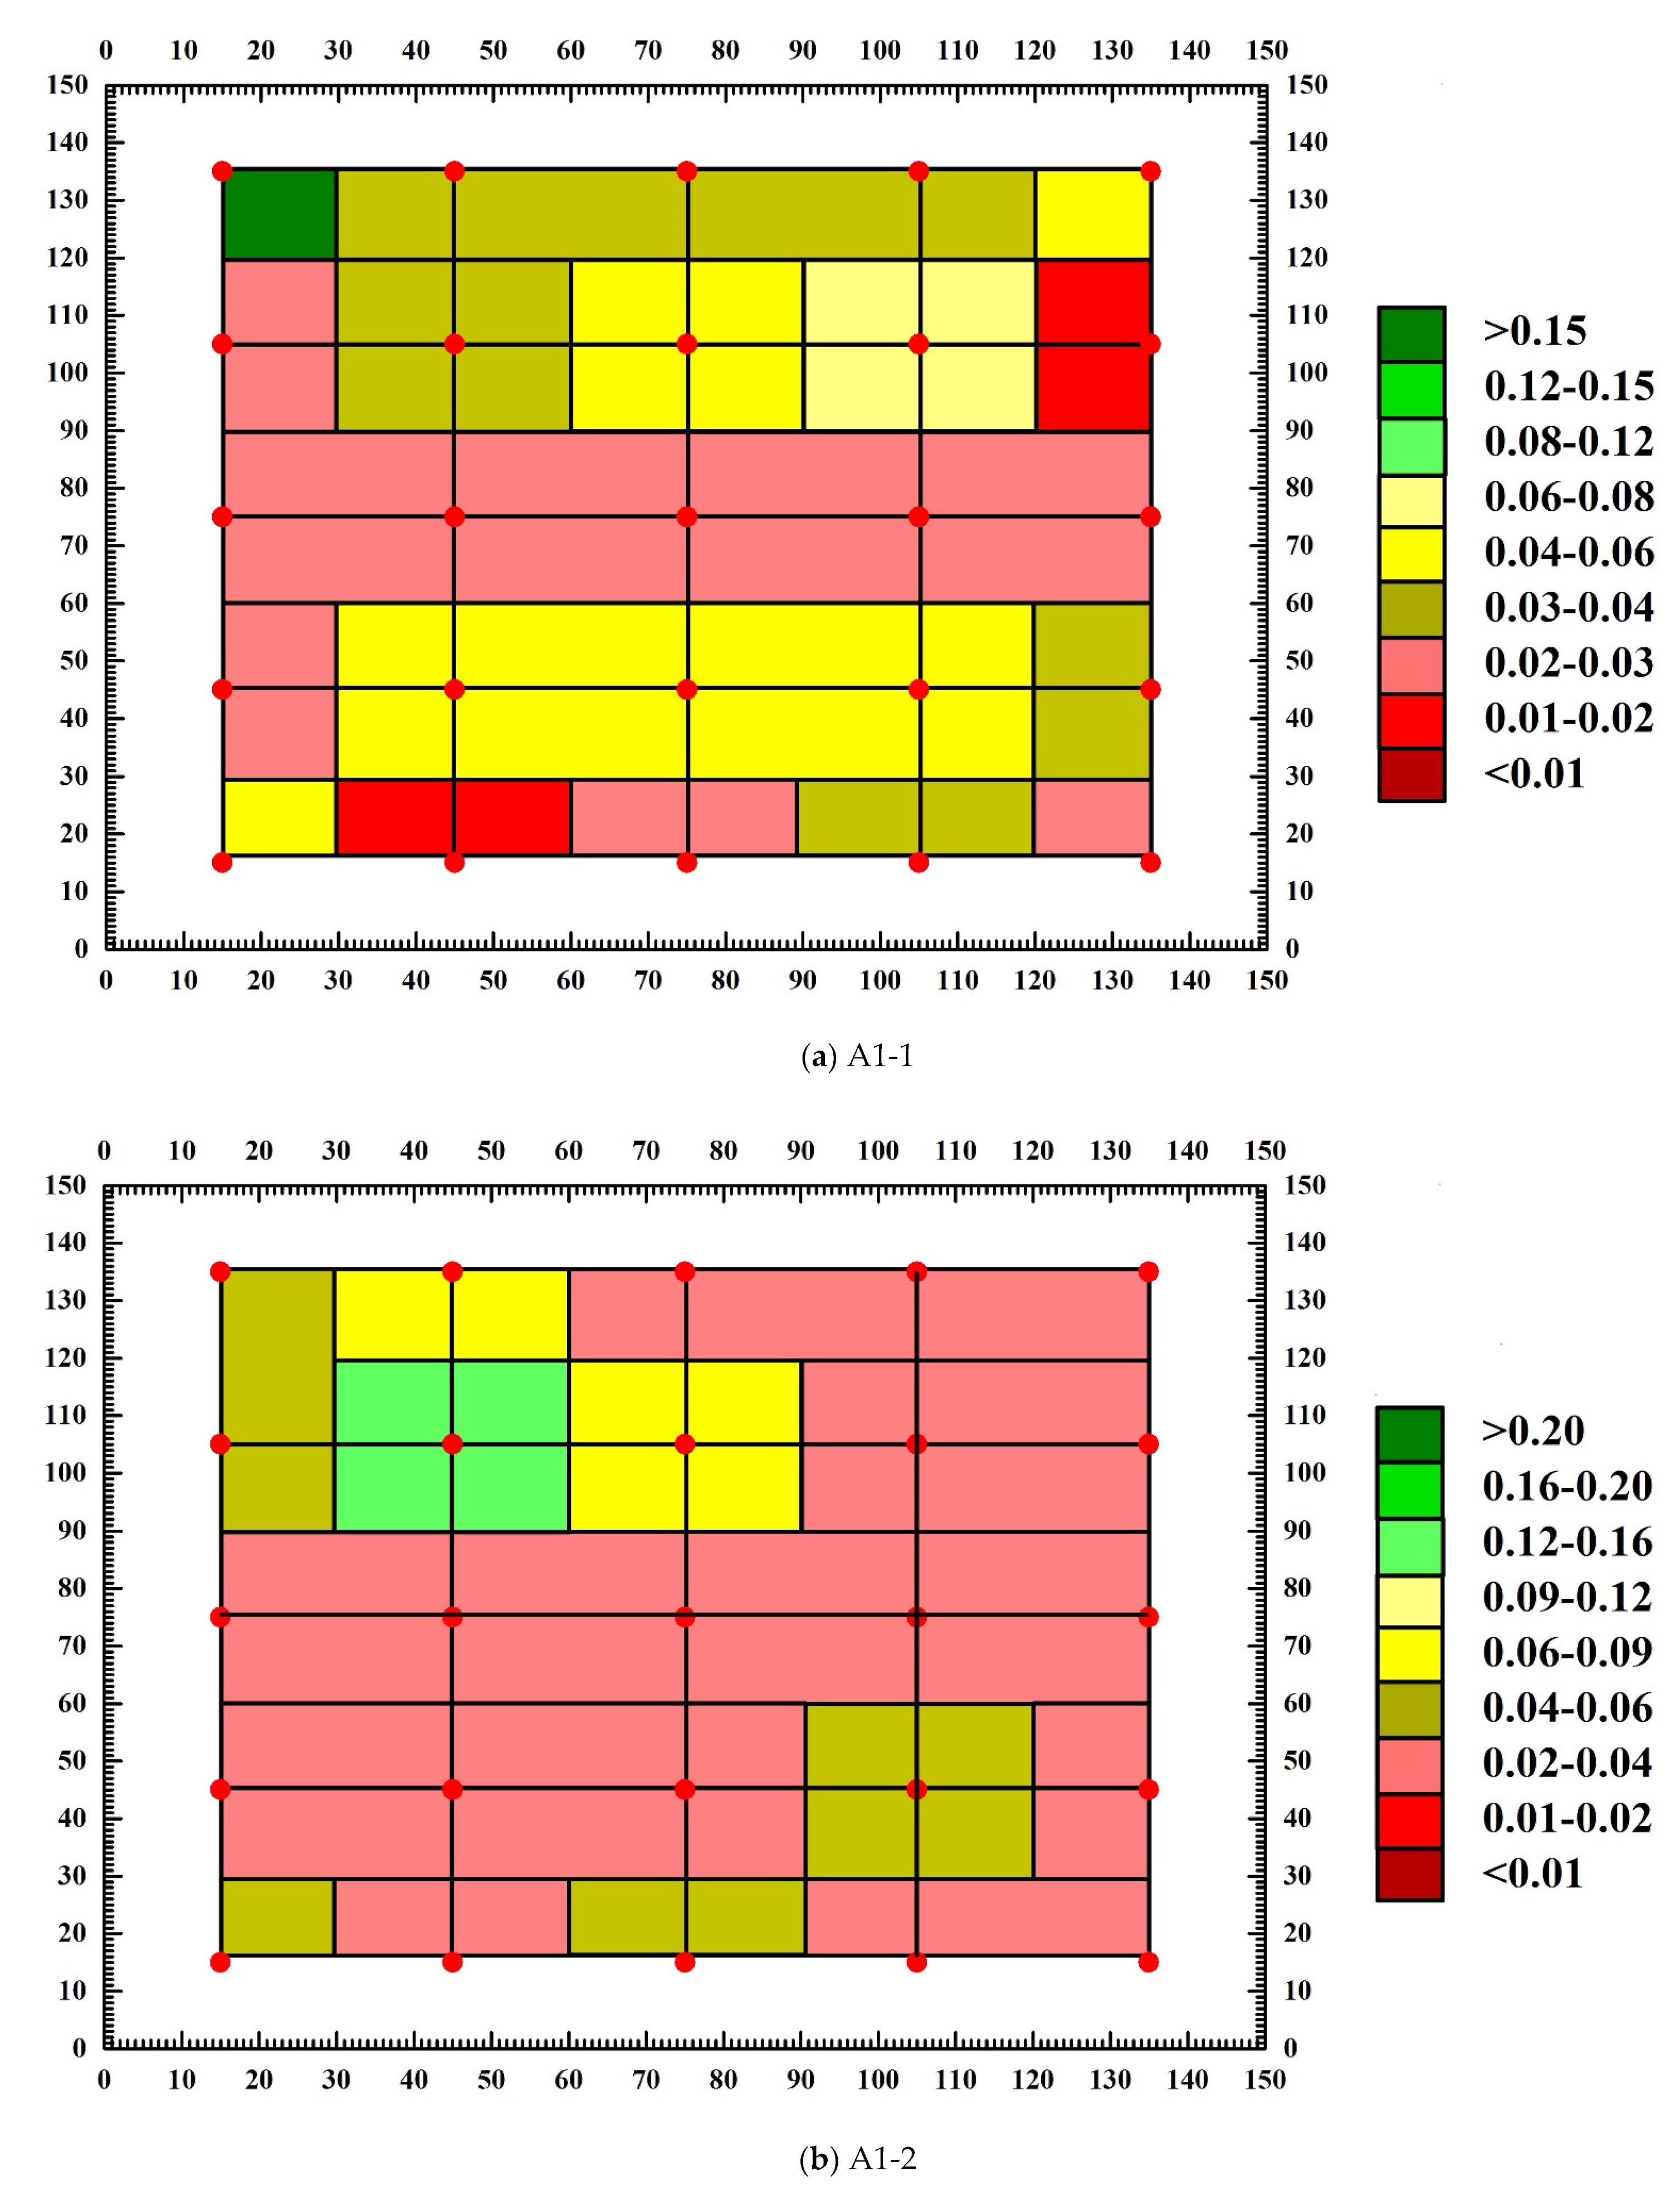
3.4. Analysis of Abnormal Values of Measuring Points

Through the calculation of concrete sound wave detection and analysis software, the sound velocity chromatogram and amplitude chromatogram before and after the destruction of each SCC test block are obtained, and the abnormal measuring points and abnormal values of the text block are judged. Figure 11 and Figure 12 are the amplitude chromatogram before and after the destruction of the text block, and Figure 13 and Figure 14 are the sound velocity chromatogram before and after the destruction of the text block. It can be seen from Figure 11 and Figure 12 that before the uniaxial compression test, the amplitude of each measuring point of each test block has no abnormal value, but after the destruction of test block A1-1, it is calculated that the abnormal judgment value of a single point is Vo1 = 0.363 km/s, Ao1 = 28.45 dB, the adjacent abnormal judgment value is Vo2 = 0.177 km/s, Ao2 = 29.59 dB, and the amplitude of measuring points 1-2, 2-1, 2-3, and 2-4 are abnormal (the abnormal measuring points have been marked on the diagram); the abnormal values are 22.92 dB, 26.44 dB, 26.44 dB, and 25.11 dB. After the test block A1-2 is damaged, the single point abnormal judgment value is Vo1 = 0.007 km/s, Ao1 = 28.88 dB, the adjacent abnormal judgment value is Vo2 = 0.010 km/s, Ao2 = 29.51 dB, and the amplitude of test points 3-3, 3-4, 4-3, 4-4, 5-1, 5-3, and 5-4 are abnormal; the abnormal values are 27.96 dB, 25.58 dB, 26.44 dB, 27.60 dB, 26.44 dB, 26.44 dB, and 25.11 dB. After test block A2-1 is damaged, the single point abnormal judgment value Vo1 = 0.005 km/s, Ao1 = 26.61 dB, adjacent abnormal judgment value Vo2 = 0.014 km/s, Ao2 = 27.78 dB, and the amplitude of test points 1-1, 1-2, and 3-3 are abnormal; the abnormal values are 24.61 dB, 24.08 dB, and 25.11 dB. After the A2-2 test block is damaged, the judgment value of single point abnormality is Vo1 = 0.738 km/s, Ao1 = 26.74 dB, the judgment value of adjacent abnormality is Vo2 = 0.396 km/s, Ao2 = 27.89 dB, and the amplitude of measurement points 1-1, 1-5, 2-1, and 3-3 are abnormal; the abnormal values are 24.08 dB, 25.11 dB, 26.02 dB, and 24.61 dB. It can be seen from Figure 12 and Figure 13 that there is no obvious abnormality in the sound velocity value before and after the failure of the text block. Through the analysis of the above data, it can be seen that after the failure of each compact concrete test block under the uniaxial compression test, defects and cracks will appear in some structures, resulting in the uncompact structure in some areas. When ultrasonic waves encounter defects and cracks, they will be scattered and reflected, and attenuated significantly. The ultrasonic waves will bypass the defects and cracks and change the original propagation path. Therefore, after the failure of the test block, the defects of the internal structure will cause the amplitude of some measuring points to be abnormal, while the sound velocity value is not abnormal.
Figure 15 is the test block defect distribution diagram obtained after the calculation and analysis of the above abnormal measurement points. Before the failure of the text block, the sound velocity amplitude is normal, while the acoustic parameter value is abnormal after the failure. The area with a color anomaly in the figure is the part with the abnormal amplitude value and sound velocity value of the text block. The figure shows that the abnormal value of the block is mainly amplitude value, there are no obvious abnormal sound velocity values, the area of the abnormal amplitude of block A1-1 is concentrated between rows 1-2 and the area of the abnormal amplitude of block A1-2 is concentrated between rows 3–5, the area of the abnormal amplitude of block A2-1 is only concentrated in the top and center of the block, and of the block, A2-2 is concentrated in the center and edge of the block.

4. Conclusions

Through the ultrasonic nondestructive testing method, we studied the failure process of SCC under the uniaxial compression test, and the following conclusions were obtained:
i.
An ultrasonic testing analyzer was used to study the variation of ultrasonic parameters of SCC before and after uniaxial compression test failure; the evolution law of internal defects of SCC after failure was obtained, which provided a theoretical basis for the application of ultrasonic testing technology in the field of SCC.
ii.
After curing the SCC test block for 7 days and 28 days, the sound value before and after the failure had the following rules: The average value of sound time before and after the failure of each measuring point is smaller than that after the failure, but the difference between the average value before and after the failure is small. Defects and cracks appeared in some structures, the ultrasonic propagation path was longer than before the failure, and the sound time value of some measuring points was significantly larger than before the failure.
iii.
The amplitude before and after the failure of the test block has the following rules: The average value of the measured points after the failure is smaller than the average value before the failure. Structural defects and cracks cause scattering and reflection during the ultrasonic wave propagation, the ultrasonic wave shows obvious attenuation, and the amplitude of some measured points is significantly smaller than that before the failure.
iv.
The sound velocity values before and after the failure of the test block have the following rules: The average value of the sound velocity after the failure of each measuring point is smaller than the average value before the failure. The test block is damaged, and some of the structures are defective, resulting in the uncompacted structure of part of the block, and the sound velocity value of some measuring points is significantly smaller than before the destruction.
v.
During the SCC ultrasonic testing process, the ultrasonic velocity was affected by many factors. In the subsequent testing process, the influence of these factors must be reduced.

Supplementary Materials

The following supporting information can be downloaded at: https://www.mdpi.com/article/10.3390/ma15134412/s1. The information for Figures S1–S3 can be found in an excel file named figure data in the Supplementary Materials.

Author Contributions

Conceptualization, Y.S.; validation, Y.L.; resources, G.W.; writing—original draft preparation, Y.S.; visualization, Y.L.; supervision, G.W.; project administration, G.W. All authors have read and agreed to the published version of the manuscript.

Funding

This work is supported by the Beijing Natural Science Foundation (8214060), National Natural Science Foundation of China (42107164).

Institutional Review Board Statement

Not applicable.

Informed Consent Statement

Not applicable.

Data Availability Statement

The data presented in this study are available in Supplementary Material figure data.

Acknowledgments

This work is supported by the Beijing Natural Science Foundation (8214060), National Natural Science Foundation of China (42107164).

Conflicts of Interest

The authors declare that they have no conflicts of interest to report regarding the present study.

References

  1. Wenxu, L.I.; Kunlin, M.A.; Long, G.; Xie, Y.; Cong, M.A.; Ning, L.I. Stability Dynamic Monitoring and Simulation of Self-compacting Concrete: A Review. Mater. Rep. 2019, 33, 2206–2213. [Google Scholar]
  2. Kamal, M.M.; Safan, M.A.; Bashandy, A.A.; Khalil, A.M. Experimental investigation on the behavior of normal strength and high strength self-curing self-compacting concrete. J. Build. Eng. 2018, 16, 79–93. [Google Scholar] [CrossRef]
  3. Cabrera, M.; Martinez-Echevarria, M.J.; Lopez-Alonso, M.; Agrela, F.; Rosales, J. Self-Compacting Recycled Concrete Using Biomass Bottom Ash. Materials 2021, 14, 6084. [Google Scholar] [CrossRef] [PubMed]
  4. Shi, F.; Cao, P.; Wang, Z.; Gan, Y.; Zhou, C.; Liu, K. An Experimental Study of Dynamic Compression Performance of Self-Compacting Concrete. Materials 2020, 13, 3731. [Google Scholar] [CrossRef] [PubMed]
  5. Lehner, P.; Hornakova, M.; Hrabova, K. Sensitivity Analysis of Stochastic Calculation of SCC Regarding Aggressive Environment. Materials 2021, 14, 6838. [Google Scholar] [CrossRef]
  6. Ferrari, G.; Surico, F.; Brocchi, A.; Banfi, E.; Maltese, C.; Squinzi, M. Method for producing aggregates from cement compositions. U.S. Patent 9,216,925, 22 December 2015. [Google Scholar]
  7. Hou, H. Research on Preparation and Casting Construction Technology of Self-compacting Concrete in Marine Climate Environments. J. Coast. Res. 2020, 115, 1–3. [Google Scholar] [CrossRef]
  8. Dong, J.; Wang, Y.; Zan, S. Study on ultrasonic detection about void defects of concrete filled rectangular steel tube. Build. Sci. 2018, 34, 103–107. [Google Scholar]
  9. Tariq, S.; Scott, A.N.; Mackechnie, J.R.; Shah, V. Durability of High Volume Glass Powder Self-Compacting Concrete. Appl. Sci. 2020, 10, 8058. [Google Scholar] [CrossRef]
  10. Yin, Y.; Zeng, H.; Zheng, X. Iop. Research on Construction Method of Concrete Filled Steel Column. In Proceedings of the 6th International Conference on Environmental Science and Civil Engineering (ESCE), Nanchang, China, 4–5 January 2020. [Google Scholar]
  11. Tan, P. Application of Self-Compacting Concrete in Secondary Lining Engineering of Tunnel Tube. Archit. Technol. 2016, 47, 636–638. [Google Scholar]
  12. Cheng, W. Technical Characteristics of Self-compacting Concrete and Its Application in High Speed Railway. China Railw. 2018, 10, 79–84. [Google Scholar]
  13. Tian, P.Y. Application of Self-compacting Concrete in Precast Components. China Concr. Cem. Prod. 2018, 12, 30–33. [Google Scholar]
  14. Zeng, Z.-p.; Huang, X.-d.; Yan, B.; Wang, W.-d.; Shuaibu, A.A.; He, X.-f. Research on the fatigue performance of self-compacting concrete structure in CRTSIII slab ballastless track under the action of heavy haul train. Constr. Build. Mater. 2021, 303, 124465. [Google Scholar] [CrossRef]
  15. He, J.; Huang, H.; Jiang, H.; Zhou, Y.; Jin, F.; Zhang, C. Experimental investigation into mode-I interfacial fracture behavior between rock and self-compacting concrete in rock-filled concrete. Eng. Fract. Mech. 2021, 258, 108047. [Google Scholar] [CrossRef]
  16. Chen, X.; Wang, J.; Tian, H. Tests for acoustic emission characteristic recognition parameters of rubber self-compacting concrete in fatigue fracture process. J. Vib. Shock. 2021, 40, 129–136. [Google Scholar]
  17. Fu, Z.W.; Wang, X. Study of ultrasonic nondestructive testing detecting the defects of concrete components. Rock Soil Mech 2007, 6 Supplement S1. [Google Scholar]
  18. Liu, C.; Wu, T. Experiments on Mechanical Properties of Recycled Self-Compacting Concrete under Freeze-Thaw Conditions. Bull. Chin. Ceram. Soc. 2018, 37, 2640–2645. [Google Scholar]
  19. Long, G.; Yang, Z.; Bai, C.; Ma, K.; Xie, Y. Durability and Damage Constitutive Model of Filling Layer Self-compacting Concrete Subjected to Coupling Action of Freeze-thaw Cycles and Load. J. Chin. Ceram. Soc. 2019, 47, 855–864. [Google Scholar]
  20. Nguyen, N.T.; Sbartai, Z.M.; Lataste, J.F.; Breysse, D.; Bos, F. Assessing the spatial variability of concrete structures using NDT techniques – Laboratory tests and case study. Constr. Build. Mater. 2013, 49, 240–250. [Google Scholar] [CrossRef]
  21. Ridgley, K.E.; Abouhussien, A.A.; Hassan, A.A.A.; Colbourne, B. Characterisation of damage due to abrasion in SCC by acoustic emission analysis. Mag. Concr. Res. 2019, 71, 85–94. [Google Scholar] [CrossRef]
  22. Nepomuceno, M.C.S.; Lopes, S.M.R. Iop. Analysis of Within-Test Variability of Non-Destructive Test Methods to Evaluate Compressive Strength of Normal Vibrated and Self-Compacting Concretes. In Proceedings of the World Multidisciplinary Civil Engineering-Architecture-Urban Planning Symposium (WMCAUS), Prague, Czech Republic, 12–16 June 2017. [Google Scholar]
  23. Ramaniraka, M.; Rakotonarivo, S.; Payan, C.; Garnier, V. Effect of the Interfacial Transition Zone on ultrasonic wave attenuation and velocity in concrete. Cem. Concr. Res. 2019, 124, 105809. [Google Scholar] [CrossRef]
  24. Suaris, W.; Fernando, V. Ultrasonic Pulse Attenuation as A Measure of Damage Growth During Cyclic Loading of Concrete. Aci Mater. J. 1987, 84, 185–193. [Google Scholar]
  25. Ravindrarajah, R.S. Evaluation of Compressive Strength For High-Strength Concrete By Pulse Velocity Method. NDT E Int. 1997, 30, 260. [Google Scholar]
  26. Yu, J.; Xu, F.; Xu, B.; Surez, E.; Gallego, A. Application of acoustic emission tomography in concrete structures. J. Southeast Univ. Nat. Sci.Ed. 2014, 44, 822–825. [Google Scholar]
  27. Suraneni, P. Ultrasonic Wave Reflection Measurements on Self-Compacting Pastes and Concretes. Master’s Thesis, University of Illinois Urbana-Champaign, Champaign, IL, USA, 2011. [Google Scholar]
  28. Bu, L.; Zhao, Y. Experimental Study on On-Site Detection Method of Compressive Strength of High-Strength Self-Compacting Concrete. J. Shenyang Jianzhu Univ. Nat. Sci. 2020, 36, 412–420. [Google Scholar]
  29. Guneyisi, E.; Gesoglu, M. Properties of self-compacting portland pozzolana and limestone blended cement concretes containing different replacement levels of slag. Mater. Struct. 2011, 44, 1399–1410. [Google Scholar] [CrossRef]
  30. Li, H.; Yin, J.; Yan, P.; Sun, H.; Wan, Q. Experimental Investigation on the Mechanical Properties of Self-Compacting Concrete under Uniaxial and Triaxial Stress. Materials 2020, 13, 1830. [Google Scholar] [CrossRef] [PubMed]
  31. Schickert, G. Critical reflections on non-destructive testing of concrete. Mater. Struct. 1984, 17, 217–223. [Google Scholar] [CrossRef]
  32. Liang, M.T.; Wu, J. Theoretical elucidation on the empirical formulae for the ultrasonic testing method for concrete structures. Cem. Concr. Res. 2002, 32, 1763–1769. [Google Scholar] [CrossRef]
  33. Revilla-Cuesta, V.; Faleschini, F.; Zanini, M.A.; Skaf, M.; Ortega-Lopez, V. Porosity-based models for estimating the mechanical properties of self-compacting concrete with coarse and fine recycled concrete aggregate. J. Build. Eng. 2022, 44. [Google Scholar] [CrossRef]
  34. Wan, P.; Lei, X.; Xu, B.; Song, H. A Strain Rate-Dependent Damage Evolution Model for Concrete Based on Experimental Results. Adv. Civ. Eng. 2021, 2021. [Google Scholar] [CrossRef]
  35. Zhu, W.-F.; Chen, X.-J.; Li, Z.-W.; Meng, X.-Z.; Fan, G.-P.; Shao, W.; Zhang, H.-Y. A SAFT Method for the Detection of Void Defect inside a Ballastless Track Structure Using Ultrasonic Array Sensors. Sensors 2019, 19, 4677. [Google Scholar] [CrossRef] [Green Version]
  36. Chen, M.; Jia, Y.; Chen, G.; Chi, D.; Wang, Y. Research on the Damage Condition of Reinforced Concrete Filled Steel Tubes Under Axial Load Using Ultrasonic Testing. Eng. Mech. 2019, 36, 172–179. [Google Scholar]
  37. Akkaya, Y.; Voigt, T.; Subramaniam, K.V.; Shah, S.P. Nondestructive measurement of concrete strength gain by an ultrasonic wave reflection method. Mater. Struct. 2003, 36, 507–514. [Google Scholar] [CrossRef]
  38. Hao, W.X.; Liang, L.I.; Sun, J.H.; Xiao, X.U. Experimental studies the work stress of concrete axial compression columns by ultrasonic testing. J. Hebei Agric. Univ. 2018, 41, 104–107. [Google Scholar]
  39. Xing-yu, G.; Shu-wei, L.; Qiao, D.; Xiang-rong, X.; Da-wei, X.; Tian-jie, Z. Attenuation Characteristics and Influencing Factors of Ultrasonic Testing of Asphalt Concrete. China J. Highw. Transp. 2020, 33, 316. [Google Scholar]
  40. Huang, Z.Y.; Ji, X.L.; Huang, L. Qualitative analytical method of imaging the concrete flaws by ultrasonic test. J. Hunan Univ. Nat. Ences 2008, 35, 5–8. [Google Scholar]
  41. Qu, X.; Liu, Q. Study on axial compression performance of rectangle concrete filled steel tubular columns. Build. Sci. 2018, 34, 37–42. [Google Scholar]
  42. Zhao, G.; Zhang, D.; University, J. Review: Concrete Structural Health Monitoring with Ultrasonic Techinque. Struct. Eng. 2018, 34, 151–156. [Google Scholar]
  43. Zheng, D.; Ren, T. Influence of frequency and water content on ultrasonic damage testing in concrete. J. Hydraul. Eng. 2014, S1, 5. [Google Scholar]
  44. Zhu, Z.; Yu, B.; Mi, S.; Yu, T.; Zhou, Y. Ultrasonic attenuation characteristics of ultrasonic in concrete. Zhongnan Daxue Xuebao (Ziran Kexue Ban)/J. Cent. South Univ. Sci.Technol. 2014, 45, 3900–3907. [Google Scholar]
  45. Chen, D.; Montano, V.; Huo, L.; Fan, S.; Song, G. Detection of subsurface voids in concrete-filled steel tubular (CFST) structure using percussion approach. Constr. Build. Mater. 2020, 262, 119761. [Google Scholar] [CrossRef]
  46. Al-Mufti, R.L.; Fried, A.N. Non-destructive evaluation of reclaimed asphalt cement concrete. Eur. J. Environ. Civ. Eng. 2018, 22, 770–782. [Google Scholar] [CrossRef] [Green Version]
  47. QINTienan; Huaxiong, M.A.; Tao, C.; Cong, T.; Wenfeng, Z.; Yan, Y. Uncertainty Evaluation of Ultrasonic Thickness Measurement of Coatings on Concrete. J. Build. Mater. 2016, 19, 177–180. [Google Scholar]
  48. Janku, M.; Cikrle, P.; Grosek, J.; Anton, O.; Stryk, J. Comparison of infrared thermography, ground-penetrating radar and ultrasonic pulse echo for detecting delaminations in concrete bridges. Constr. Build. Mater. 2019, 225, 1098–1111. [Google Scholar] [CrossRef]
  49. Green, L.S.; Faergestad, E.M.; Poole, A.; Chandler, P.M. Preparation and Application of Machine-Made Sand Concrete with C50 Fly Ash. Fly Ash Compr. Util. 2006, 2, 28–29. [Google Scholar]
  50. Xingjun, L.; Ding, Y.; Cao, M. Progress of the researching on proportional rate design methods of self-compacting concrete. Concrete 2013, 8, 696–706. [Google Scholar]
  51. Wen, X.Q.; Wang, J.L.; Shan, J.H.; Liu, Y.; Long, F. Research on comparative experiments of proportion design method of self-compacting concrete. Concrete 2011, 28, 103–193. [Google Scholar]
  52. Edamatsu, Y.; Nishida, N.; Ouchi, M. A rational mix-design method for self-compacting concrete considering interaction between coarse aggregate and mortar particles. Mater. Struct. 1999, 309–320. [Google Scholar]
  53. Shi, C.; Yang, X.; Yu, Z.; Khayat, H. Design and application of self-compacting lightweight concretes. In Proceedings of the SCC’2005-China: 1st International Symposium on Design, Performance and Use of Self-Consolidating Concrete, Changsha, China, 26–28 May 2005; pp. 55–64. [Google Scholar]
  54. Ashtiani, M.S.; Scott, A.N.; Dhakal, R.P. Mechanical and fresh properties of high-strength self-compacting concrete containing class C fly ash. Constr. Build. Mater. 2013, 47, 1217–1224. [Google Scholar] [CrossRef]
  55. Tang, M.; Yang, S.; Guo, J.; Zhang, C.; Lu, M. Mix Design of Self-compacting Concrete Considering the Effect of Limestone Powder on Rheology. J. Build. Mater. 2022, 25, 191–198. [Google Scholar]
  56. Habibi, A.; Ghomashi, J. Development of an optimum mix design method for self-compacting concrete based on experimental results. Constr. Build. Mater. 2018, 168, 113–123. [Google Scholar] [CrossRef]
  57. Sun, Y.; Wang, G.; Li, Y. Study on Acoustic Emission Characteristics of Self-Compacting Concrete under Uniaxial Compression Test. J. Renew. Mater. 2022, 10, 2287–2302. [Google Scholar] [CrossRef]
Figure 1. Photos of (a) single horizontal-axis forced concrete mixer and (b) finished SCC mixture.
Materials 15 04412 g001
Figure 2. (a) Slump extension test; (b) extension time T500 test; (c) V funnel test; (d) L flow meter test.
Materials 15 04412 g002
Figure 3. ZT801 Geotechnical Acoustic Tester.
Materials 15 04412 g003
Figure 4. Pair measuring method.
Materials 15 04412 g004
Figure 5. The layout of measuring points. (a) two-dimensional; (b) three-dimensional.
Materials 15 04412 g005
Figure 6. Pressure testing machine.
Materials 15 04412 g006
Figure 7. Sensor layout position.
Materials 15 04412 g007
Figure 8. The sound time value before and after the failure of each test block.
Materials 15 04412 g008aMaterials 15 04412 g008b
Figure 9. The amplitude value before and after the failure of each test block.
Materials 15 04412 g009aMaterials 15 04412 g009b
Figure 10. The sound velocity before and after the failure of each test block.
Materials 15 04412 g010aMaterials 15 04412 g010b
Figure 11. Amplitude chromatogram of test block before destruction.
Materials 15 04412 g011aMaterials 15 04412 g011b
Figure 12. Amplitude chromatogram after test block destruction.
Materials 15 04412 g012aMaterials 15 04412 g012b
Figure 13. Sound velocity chromatogram before test block destruction.
Materials 15 04412 g013aMaterials 15 04412 g013b
Figure 14. Sound velocity chromatogram after test block destruction.
Materials 15 04412 g014aMaterials 15 04412 g014b
Figure 15. Defect distribution after the failure of each test block.
Materials 15 04412 g015aMaterials 15 04412 g015b
Table 1. Performance index of each raw material.
PerformanceBulk DensityPerformance DensityFineness ModulusInitial Setting TimeFinal
Setting Time
Fineness
Raw Material
Ordinary Portland cement----3100 kg/m3---->150 min<240 min----
River sand1600 kg/m32600 kg/m32.3–3.0------------
Fly ash (grade 1)----2400 kg/m3----------------
Gravel1500 kg/m31600 kg/m3----------------
Polycarboxylic water reducer------------------------
Table 2. Mix proportion of SCC.
Raw MaterialCementFly AshSandGravelWaterWater Reducer
Mix proportion20.18 kg5.69 kg40.74 kg25.87 kg9.31 kg0.164 kg
Table 3. Measured and specified values of performance of SCC.
IndexTest PerformanceNumerical RangeMeasured Value
Slump flow (mm)Filling propertySF2 (660–755)720
Extension time T500 (s)Filling property2–54.2
V-funnel time (s)Filling property9–2018.4
H2/H1Interstitial permeability≥0.81.0
Publisher’s Note: MDPI stays neutral with regard to jurisdictional claims in published maps and institutional affiliations.

