
A New Model Supporting Stability Quality of Materials and Industrial Products


Abstract
:1. Introduction
2. Model
2.1. Concept of Model
2.2. Conditions and Justification for Choice of Methods for Model
2.3. Model Assumptions and Conditions Ensuring Its Novelty
2.4. Characteristics of Model
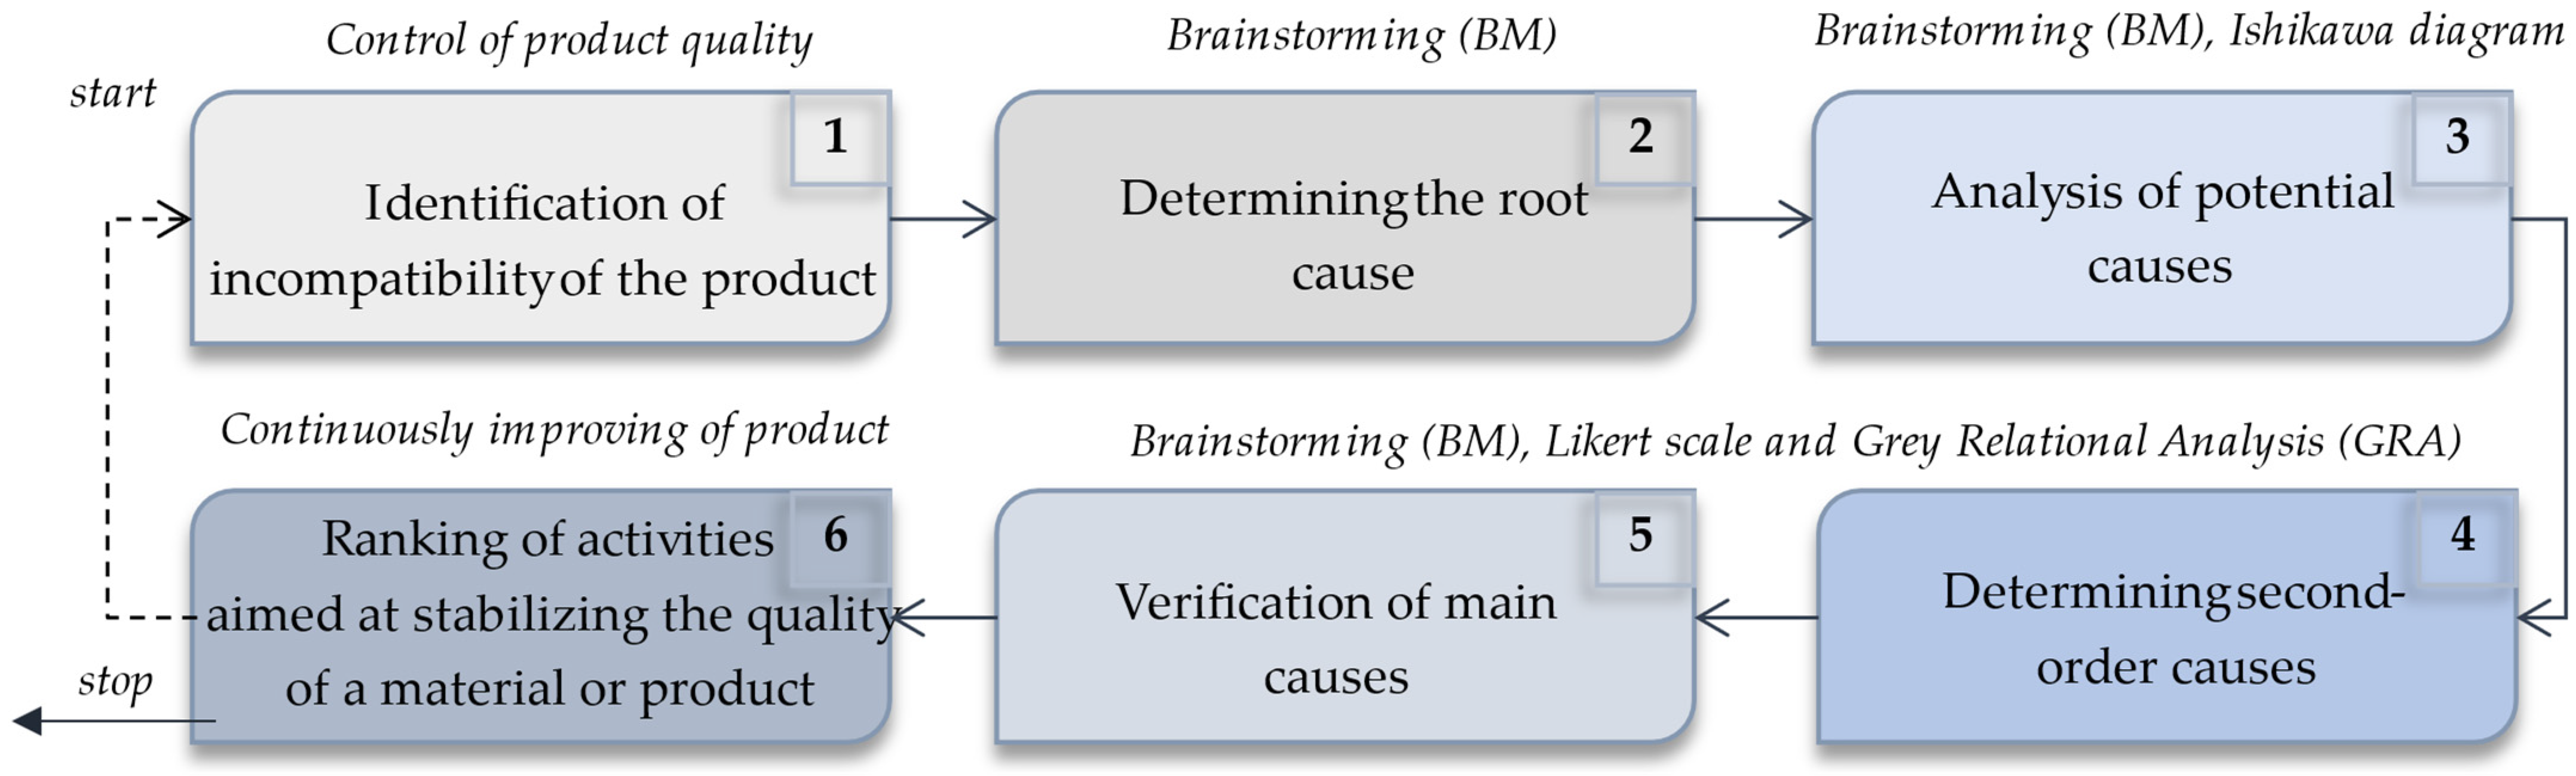
- Stage 1. Determine the main incompatibility and purpose of the analysis
- Stage 2. Choice of the team of experts
- Stage 3. Determine the root cause
- Stage 4. Identify the potential causes
- Stage 5. Verify the potential causes
- Step 5.1. Reduction of unreal causes
- Step 5.2. Grouping potential causes
- Stage 6. Determine the second-order causes
- Stage 7. Identify the main causes
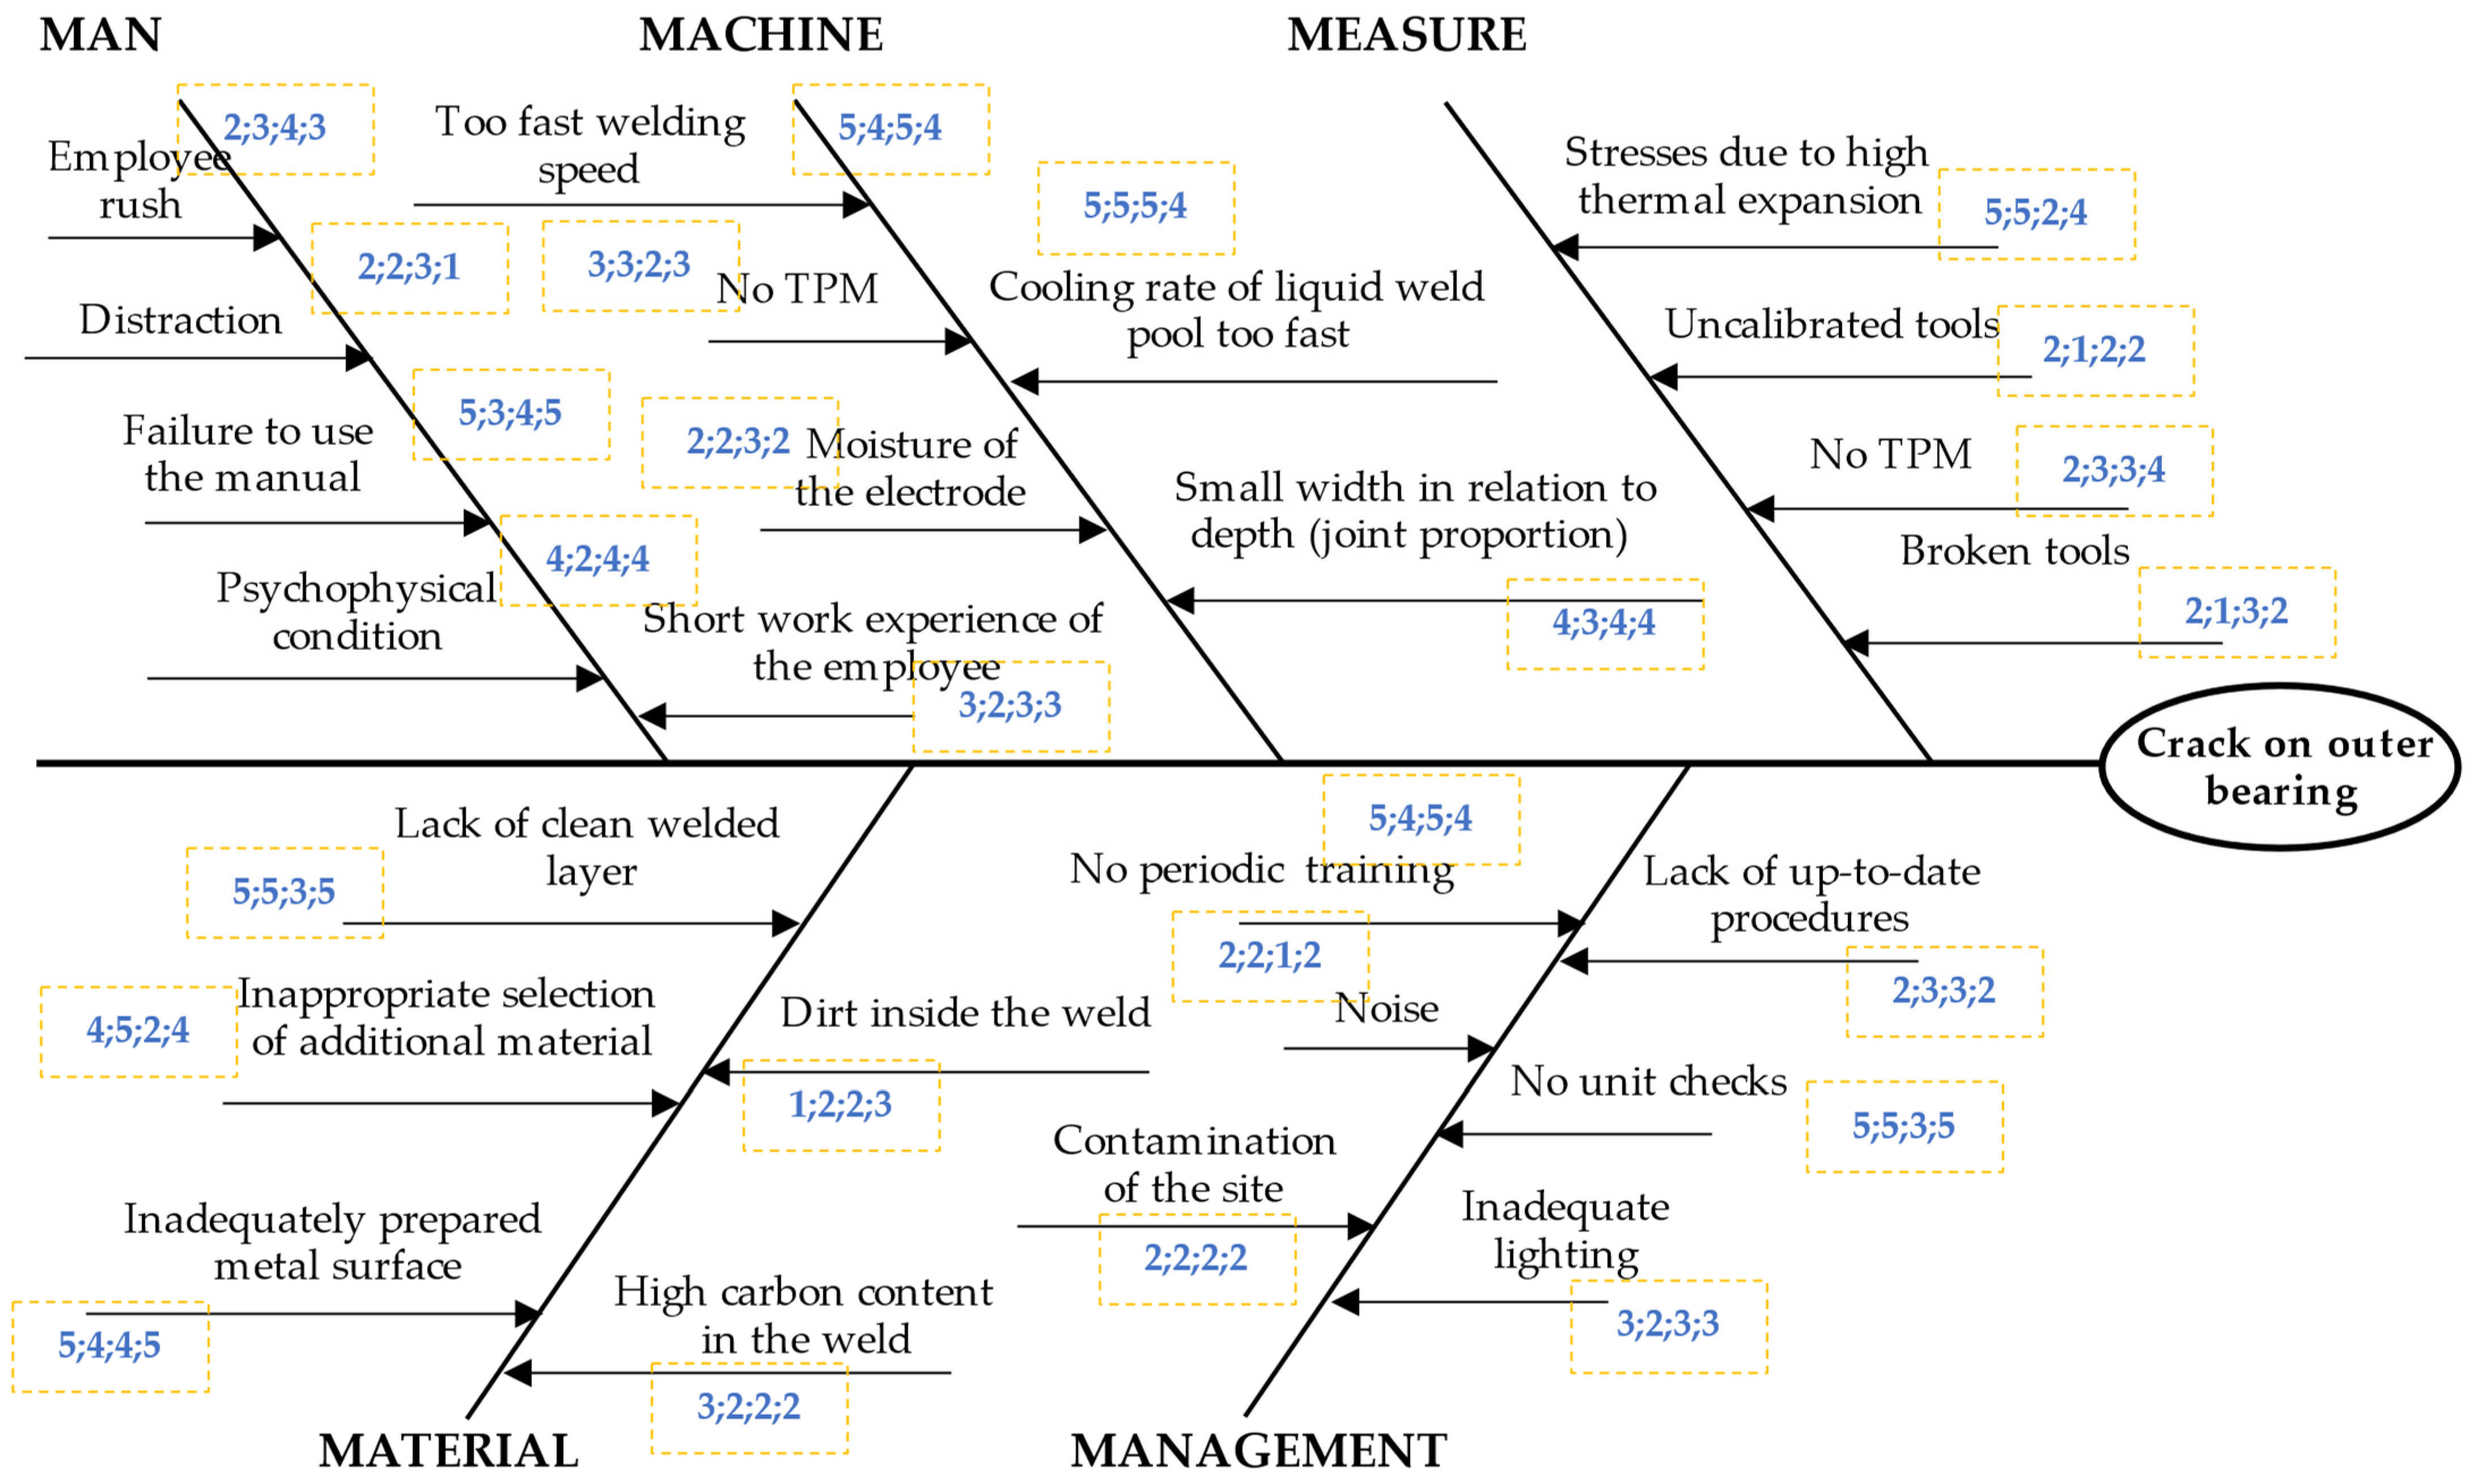
- Step 7.1. Importance of second-order causes
- Step 7.2. Analysis of weight assessments of second-order causes
- Step 7.2.1. Create the matrix of assessments
- Step 7.2.2. Normalization of assessment of weight of incompatibility causes
- Step 7.2.3. Calculate the relational Grey coefficient
- Step 7.2.4. Determining Grey Relational Assessments
- Step 7.3. Choice of main cause
- Stage 8. Creating a ranking of actions as part of stabilizing the quality of the product
3. Test of Model
- Stage 1. Determine the main incompatibility and purpose of the analysis
- Stage 2. Choice of the team of experts
- Stage 3. Determine the root cause
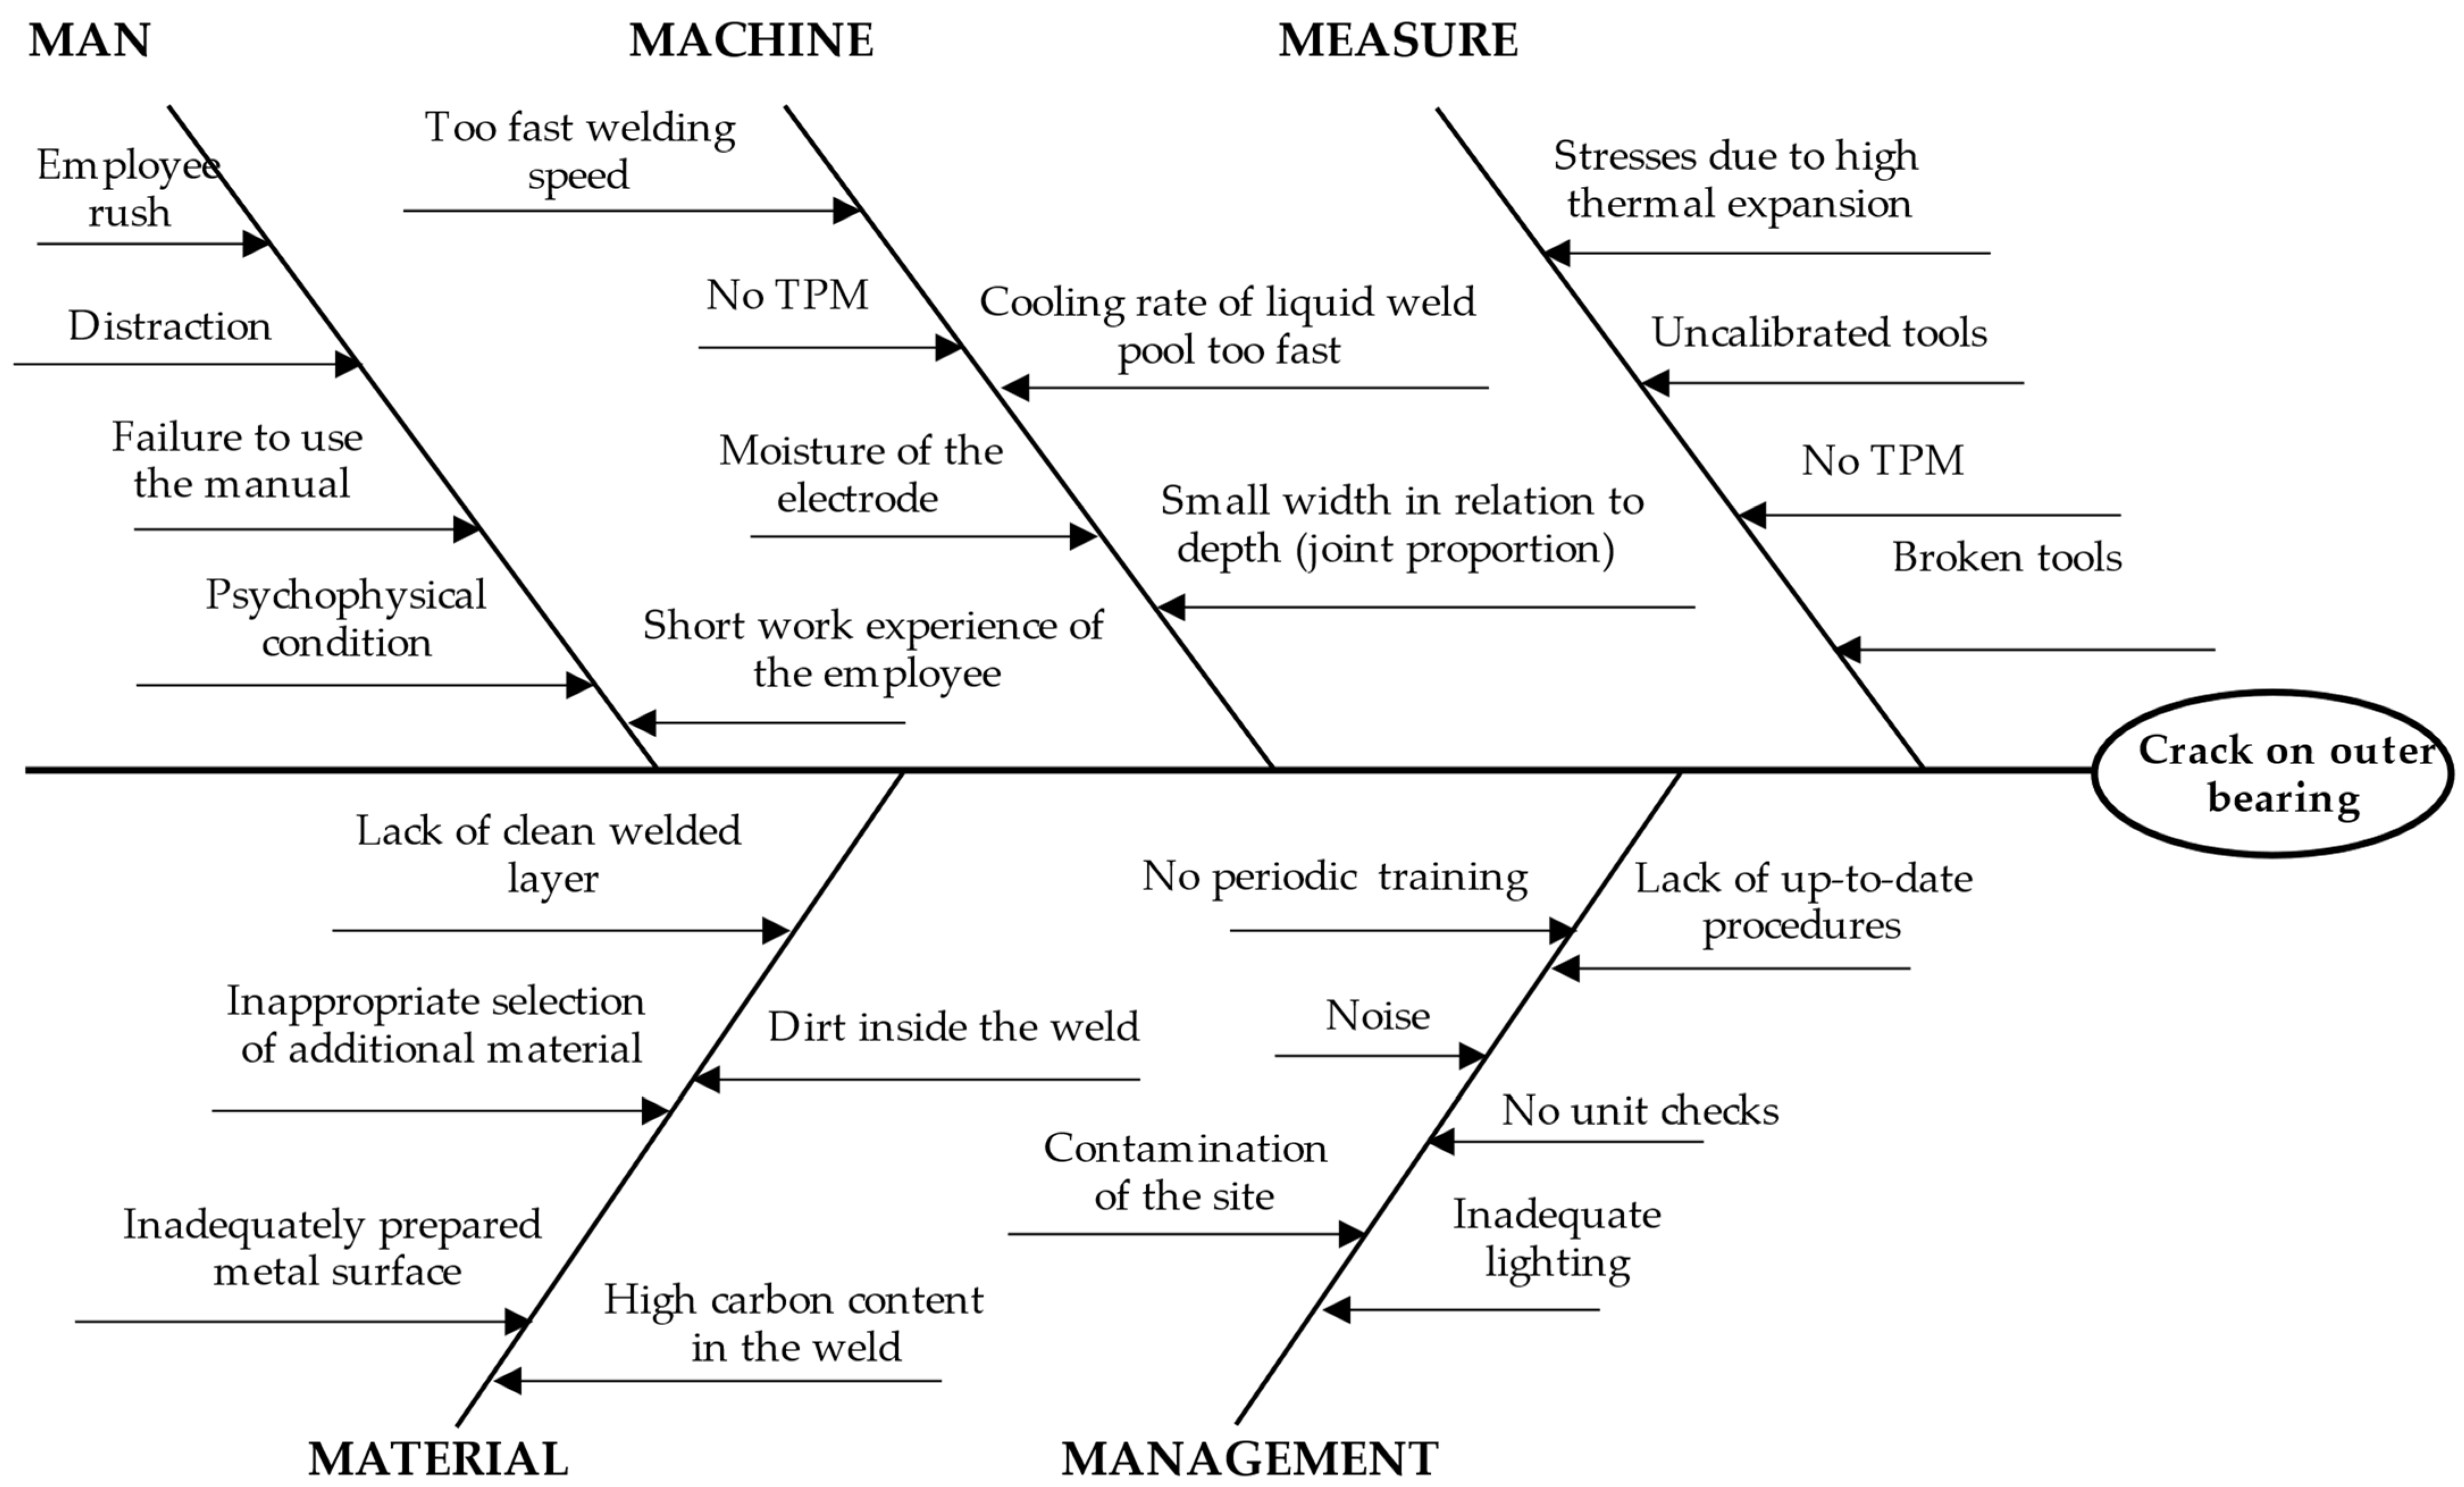
- Stage 4. Identify the potential causes
- Too fast welding speed;
- Flow of liquid weld pool too fast;
- Lack of clean welded layer;
- Small width in relation to depth (joint proportion);
- Stresses due to high thermal expansion;
- Inappropriate selection of material;
- Unprepared metal surface;
- High carbon content in the weld;
- Dirt inside the weld;
- Employee rush;
- No periodic training;
- No TMP (Total Productive Maintenance);
- Lack of up-to-date procedures;
- Distraction;
- Dirty tools;
- Lack of unit controls;
- Broken tools;
- Failure to use the manual;
- Moisture of the electrode;
- Short work experience of the employee;
- Inadequate lighting;
- Noise;
- Contamination of the site;
- Uncalibrated tools;
- Psychophysical condition of the worker (e.g., severe nervous tension, exhaustion, physical or mental malaise).
- Stage 5. Verify the potential causes
- Step 5.1. Reduction of unreal causes
- Step 5.2. Grouping potential causes
- Stage 6. Determine the second-order causes
- Stage 7. Identify the main causes
- Stage 8. Creating a ranking of actions as part of stabilizing the quality of the product
4. Discussion
5. Conclusions
Author Contributions
Funding
Institutional Review Board Statement
Informed Consent Statement
Data Availability Statement
Conflicts of Interest
References
- Lehner, P.; Hrabová, K. Relationship of Time-Dependent Parameters from Destructive and Non-Destructive Tests of Structural Concrete. Mathematics 2022, 10, 460. [Google Scholar] [CrossRef]
- Chokkalingram, B.; Raja, V.; Anburaj, J.; Immanual, R.; Dhineshkumar, M. Investigation of Shrinkage Defect in Castings by Quantitative Ishikawa Diagram. Arch. Foundry Eng. 2017, 17, 174–178. [Google Scholar] [CrossRef] [Green Version]
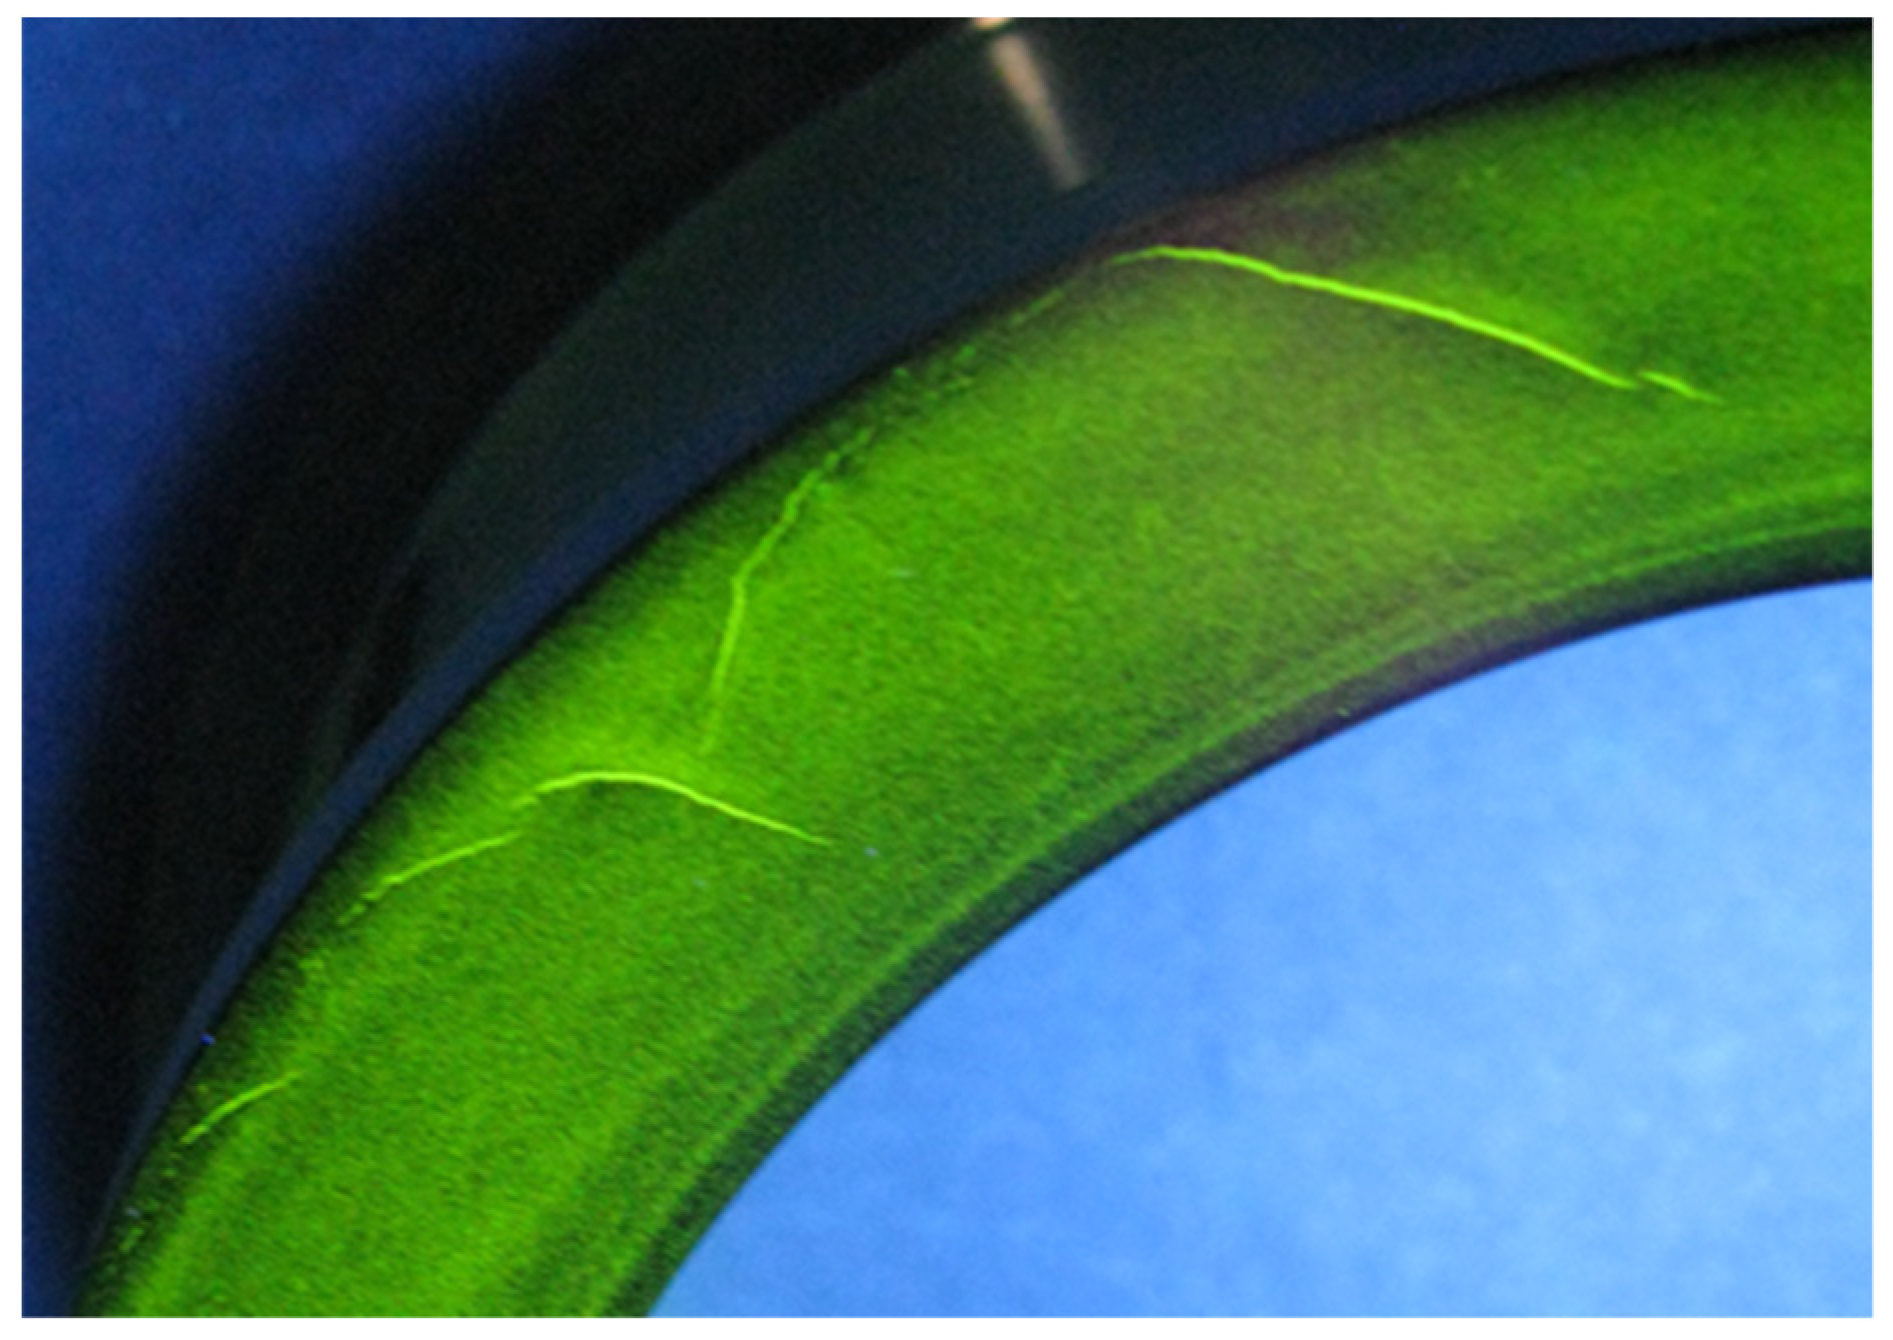
- Pacana, A.; Siwiec, D.; Bednarova, L. Analysis of the incompatibility of the product with fluorescent method. Metalurgija 2019, 58, 337–340. [Google Scholar]
- Midor, K. An analysis of the causes of product defects using quality management tools. Manag. Syst. Prod. Eng. 2014, 16, 162–167. [Google Scholar] [CrossRef]
- Siwiec, D.; Pacana, A. A Pro-Environmental Method of Sample Size Determination to Predict the Quality Level of Products Considering Current Customers’ Expectations. Sustainability 2021, 13, 5542. [Google Scholar] [CrossRef]
- Markulik, Š.; Petrík, J.; Šolc, M.; Blaško, P.; Palfy, P.; Sütőová, A.; Girmanová, L. Analysis of Fault Conditions in the Production of Prestressed Concrete Sleepers. Appl. Sci. 2022, 12, 928. [Google Scholar] [CrossRef]
- Pacana, A.; Bednarova, L.; Pacana, J.; Liberko, I.; Wozny, A.; Malindzak, D. Effect of selected factors of the production process of stretch film for its resistance to puncture. Przem. Chem. 2014, 12, 2263–2264. [Google Scholar]
- Midor, K.; Zarnovsky, J. Innovative use of quality management methods for product improvement. Manag. Syst. Prod. Eng. 2016, 24, 264–267. [Google Scholar] [CrossRef]
- Goel, P.; Kumar, R.; Banga, H.K.; Kaur, S.; Kumar, R.; Pimenov, D.Y.; Giasin, K. Deployment of Interpretive Structural Modeling in Barriers to Industry 4.0: A Case of Small and Medium Enterprises. J. Risk Financ. Manag. 2022, 15, 171. [Google Scholar] [CrossRef]
- Hofele, J.; Link, G.; Jelonnek, J. Reaction Kinetics and Process Model of the Polyacrylonitrile Fibers Stabilization Process Based on Dielectric Measurements. Materials 2022, 15, 1222. [Google Scholar] [CrossRef]
- Jonšta, P.; Jonšta, Z.; Brožová, S.; Ingaldi, M.; Pietraszek, J.; Klimecka-Tatar, D. The Effect of Rare Earth Metals Alloying on the Internal Quality of Industrially Produced Heavy Steel Forgings. Materials 2021, 14, 5160. [Google Scholar] [CrossRef] [PubMed]
- Pacana, A.; Siwiec, D. Universal Model to Support the Quality Improvement of Industrial Products. Materials 2021, 14, 7872. [Google Scholar] [CrossRef] [PubMed]
- Zimon, G.; Zimon, D. Quality Management Systems and Working Capital SMEs in GPO—A Case of Poland. Adm. Sci. 2020, 10, 76. [Google Scholar] [CrossRef]
- Pacana, A.; Siwiec, D. Model to Predict Quality of Photovoltaic Panels Considering Customers’ Expectations. Energies 2022, 15, 1101. [Google Scholar] [CrossRef]
- Pinho, T.; Zhiltsova, T.; Oliveira, M.; Costa, A. Computer-Aided Reengineering towards Plastic Part Failure Minimization. Materials 2021, 14, 6303. [Google Scholar] [CrossRef]
- Saroso, D.S. Decision Making Models for Quality Improvement. Int. J. Technol. 2012, 3, 169–181. [Google Scholar] [CrossRef]
- Shinde, D.D.; Ahirrao, S.; Prasad, R. Fishbone Diagram: Application to Identify the Root Causes of Student–Staff Problems in Technical Education. Wirel. Pers. Commun. 2018, 100, 653–664. [Google Scholar] [CrossRef]
- Rusiecki, A. The analysis of quality management tools used for improving the production process based on a chosen foundry. Qual. Prod. Improv. 2019, 2, 113–124. [Google Scholar] [CrossRef]
- Szczucka-Lasota, B.; Wolniak, R.; Fryc, M. The identification of incompatibility in the process of laser cutting of the semi-finding. Sil. Univ. Technol. Sci. Pap. Organ. Manag. 2017, 105, 429–438. [Google Scholar]
- Coccia, M. The Fishbone diagram to identify, systematize and analyze the sources of general purpose technologies. J. Soc. Adm. Sci. 2017, 4, 291–303. [Google Scholar] [CrossRef]
- Luca, L. A new model of Ishikawa diagram for quality assessment. IOP Conf. Ser. Mater. Sci. Eng. 2016, 161, 012099. [Google Scholar]
- Raman, R.; Basavaraj, Y. Quality Improvement of Capacitor through Fishbone and Pareto techniques. Int. J. Recent Technol. Eng. 2019, 8, 2248–2252. [Google Scholar] [CrossRef]
- Liu, T.T.; Duan, G.J. A quality improvement model for the development of complex products based on data mining and mechanism analysis. J. Chin. Inst. Eng. 2020, 43, 763–774. [Google Scholar] [CrossRef]
- Soares, J.C.; Tereso, A.P.; Sousa, S.D. A decision-making model for the rework of defective products. Int. J. Qual. Reliab. Manag. 2021, 38, 68–97. [Google Scholar] [CrossRef]
- Siwiec, D.; Pacana, A. Method of improve the level of product quality. Prod. Eng. Arch. 2021, 27, 1–7. [Google Scholar] [CrossRef]
- Siwiec, D.; Pacana, A. Model Supporting Development Decisions by Considering Qualitative–Environmental Aspects. Sustainability 2021, 13, 9067. [Google Scholar] [CrossRef]
- Siwiec, D.; Pacana, A. Identifying the source of the problem by using implemented the FAHP method in the selected quality management techniques. Prod. Eng. Arch. 2020, 26, 5–10. [Google Scholar] [CrossRef]
- Pavletic, D.; Sokovic, M.; Paliska, G. Practical Application of Quality Tools. Int. J. Qual. Res. 2008, 2, 197–205. [Google Scholar]
- Pacana, A.; Czerwinska, K.; Bednarova, L. Comprehensive improvement of the surface quality of the diesel engine piston. Metalurgija 2019, 58, 329–332. [Google Scholar]
- Lawlor, K.B.; Hornyak, M.J. Smart Goals: How The Application Of Smart Goals Can Contribute To Achievement Of Student Learning Outcomes. Dev. Bus. Simul. Exp. Learn. 2012, 39, 259–267. [Google Scholar]
- Kupraszewicz, W.; Zółtowski, B. The selection of the experts team to diagnose the condition of the machines. Diagn. Artyk. Główne 2002, 26, 94–100. [Google Scholar]
- Kohn, N.; Smith, S. Collaborative Fixation: Effexts of Others’ Ideas on Brainstorming. Appl. Cogn. Psychol. 2011, 25, 359–371. [Google Scholar] [CrossRef]
- Putman, V.; Paulus, P. Brainstorming, Brainstorming. Rules and Decision Making. J. Creat. Behav. 2009, 43, 29–40. [Google Scholar] [CrossRef]
- Ertuğrul, İ.; Öztaş, T.; Özçil, A.; Öztaş, G.Z. Grey Relational Analysis Approach In Academic Performance Comparison Of University: A Case Study Of Turkish Universities. Eur. Sci. J. 2016, 12, 128–139. [Google Scholar]
- Javed, S.A.; Khan, A.M.; Dong, W.; Raza, A.; Liu, S. Systems Evaluation through New Grey Relational Analysis Approach: An Application on Thermal Conductivity—Petrophysical Parameters’ Relationships. Processes 2019, 7, 348. [Google Scholar] [CrossRef] [Green Version]
- Liu, A.; Zhu, Q.; Ji, X.; Lu, H.; Tsai, S.B. Novel method for perceiving key requirements of customer collaboration low-carbon product design. Int. J. Environ. Res. Public Health 2018, 15, 1446. [Google Scholar] [CrossRef] [Green Version]
- Wang, F.; Li, H.; Dong, M. Capturing the key customer requirements for complex equipment design using Grey Relational Analysis. J. Grey Syst. 2015, 27, 51–70. [Google Scholar]
- Wang, T. A Novel Approach of Integrating Natural Language Processing Techniques with Fuzzy TOPSIS for Product Evaluation. Symmetry 2022, 14, 120. [Google Scholar] [CrossRef]
- Lu, H.; Zhao, Y.; Zhou, X.; Wei, Z. Selection of Agricultural Machinery Based on Improved CRITIC-Entropy Weight and GRA-TOPSIS Method. Processes 2022, 10, 266. [Google Scholar] [CrossRef]
- Fabis-Domagala, J.; Domagala, M.; Momeni, H. A Matrix FMEA Analysis of Variable Delivery Vane Pumps. Energies 2021, 14, 1741. [Google Scholar] [CrossRef]
- Sutrisno, A.; Hunawan, I.; Tangkuman, S. Modified Failure Mode and Effect Analysis (FMEA) Model for Accessing the Risk of Maintenance Waste. Procedia Manuf. 2015, 4, 23–29. [Google Scholar] [CrossRef] [Green Version]
- Rachwał, A.; Wolniak, R. The Influence Of Nonconformities On Welding Process Performance. Zesz. Nauk. Politech. Śląskiej Organ. I Zarządzanie 2018, 118, 491–501. [Google Scholar] [CrossRef]
- Rowiński, A. Dynamiczne obciążenia kadłubów silników turbinowych i ich zamocowań na płatowcach. Pr. Inst. Lotnictwa 2011, 211, 245–251. [Google Scholar]
- Four-Point Ball Bearings. Available online: https://www.nskeurope.pl/pl/nsk-innovative-products/contact-ball-bearings-4-points.html# (accessed on 2 February 2022).
- Greek Ascoloy (Alloy 418). Available online: https://www.neonickel.com/generate-alloy-pdf/?id=13027 (accessed on 2 February 2022).
- Ostasz, G.; Siwiec, D.; Pacana, A. Universal Model to Predict Expected Direction of Products Quality Improvement. Energies 2022, 15, 1751. [Google Scholar] [CrossRef]
- Wang, L.; Shi, H.B.; Yu, S.; Li, H.; Liu, L.; Bi, Z.M.; Fu, L.L. An application of enterprise systems in quality management of products. Inf. Technol. Manag. 2012, 13, 389–402. [Google Scholar] [CrossRef]
- Ostasz, G.; Czerwinska, K.; Pacana, A. Quality management of aluminum pistons with the use of quality control points. Manag. Syst. Prod. Eng. 2020, 28, 29–33. [Google Scholar] [CrossRef] [Green Version]
- Bilsel, R.U.; Lin, D.K.J. Ishikawa Cause and Effect Diagrams Using Capture Recapture Techniques. Qual. Technol. Quant. Manag. 2012, 9, 137–152. [Google Scholar] [CrossRef]
- Pacana, A.; Siwiec, D.; Bednárová, L. Method of Choice: A Fluorescent Penetrant Taking into Account Sustainability Criteria. Sustainability 2020, 12, 5854. [Google Scholar] [CrossRef]


| Mechanical and Physical Strengths | Value (21 °C) |
|---|---|
| Ultimate Tensile Strength (MPa) | 965 |
| 0.2% yield point (MPa) | 760 |
| Elongation (%) | 15 |
| Brinell hardness | 302–352 |
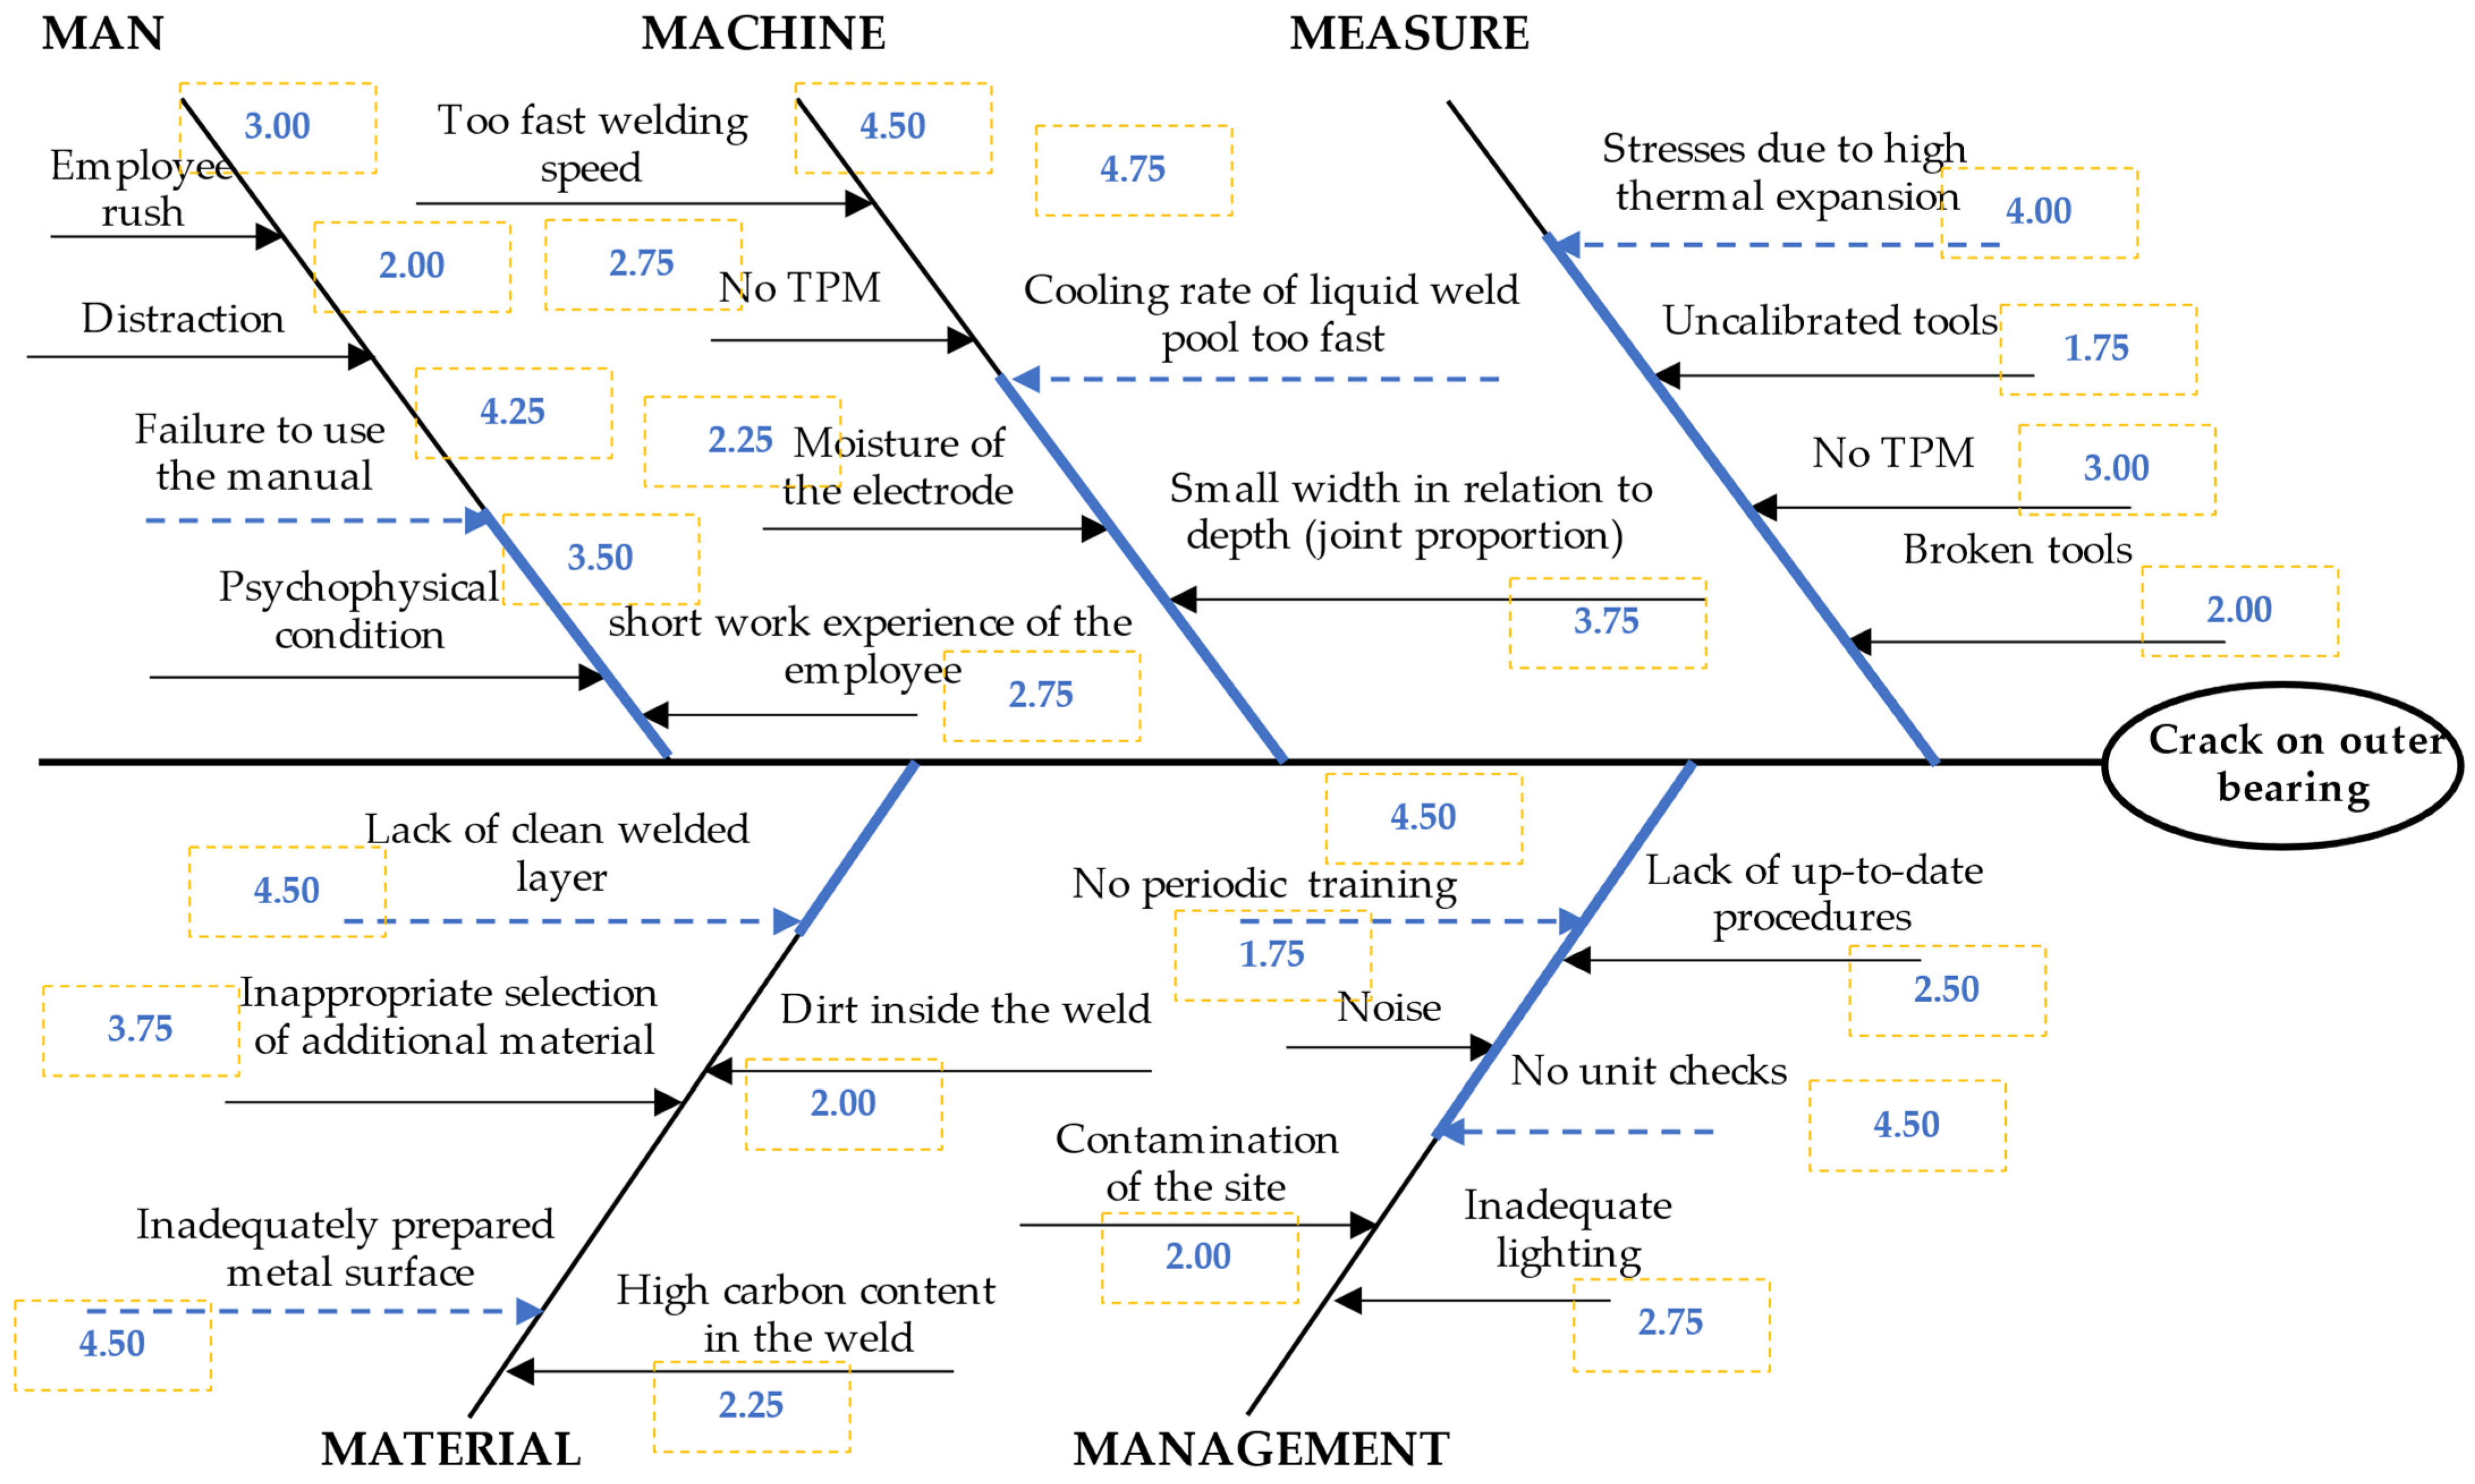
| Category 5M | No. | Potential Causes | Assessment of Importance | Average Weight |
|---|---|---|---|---|
| man | 1 | employee rush | 2;3;4;3 | 3.00 |
| 2 | dissociation | 2;2;3;1 | 2.00 | |
| 3 | not following the manual | 5;3;4;5 | 4.25 | |
| 4 | psychophysical state | 4;2;4;4 | 3.50 | |
| 5 | short work experience of the employee | 3;2;3;3 | 2.75 | |
| machine | 6 | too high cutting speed | 5;4;5;4 | 4.50 |
| 7 | no TPM | 3;3;2;3 | 2.75 | |
| 8 | electrode humidity | 2;2;3;2 | 2.25 | |
| 9 | too high cooling rate of the weld pool liquid | 5;5;5;4 | 4.75 | |
| 10 | small width in relation to the depth | 4;3;4;4 | 3.75 | |
| measure | 11 | stresses | 5;5;2;4 | 4.00 |
| 12 | uncalibrated tool | 2;1;2;2 | 1.75 | |
| 13 | no TPM | 2;3;3;4 | 3.00 | |
| 14 | damaged tools | 2;1;3;2 | 2.00 | |
| material | 15 | no cleaned top layer | 5;5;3;5 | 4.50 |
| 16 | inappropriate selection of additional material | 4;5;2;4 | 3.75 | |
| 17 | inadequately prepared metal surface | 5;4;4;5 | 4.50 | |
| 18 | debris inside the weld | 1;2;2;3 | 2.00 | |
| 19 | high carbon content in the weld | 3;2;2;2 | 2.25 | |
| management | 20 | no periodic training | 5;4;5;4 | 4.50 |
| 21 | noise | 2;2;1;2 | 1.75 | |
| 22 | environment pollution | 2;2;2;2 | 2.00 | |
| 23 | lack of up-to-date procedures | 2;3;3;2 | 2.50 | |
| 24 | no unit checks | 5;5;3;5 | 4.50 | |
| 25 | inadequate lighting | 3;2;3;3 | 2.75 |
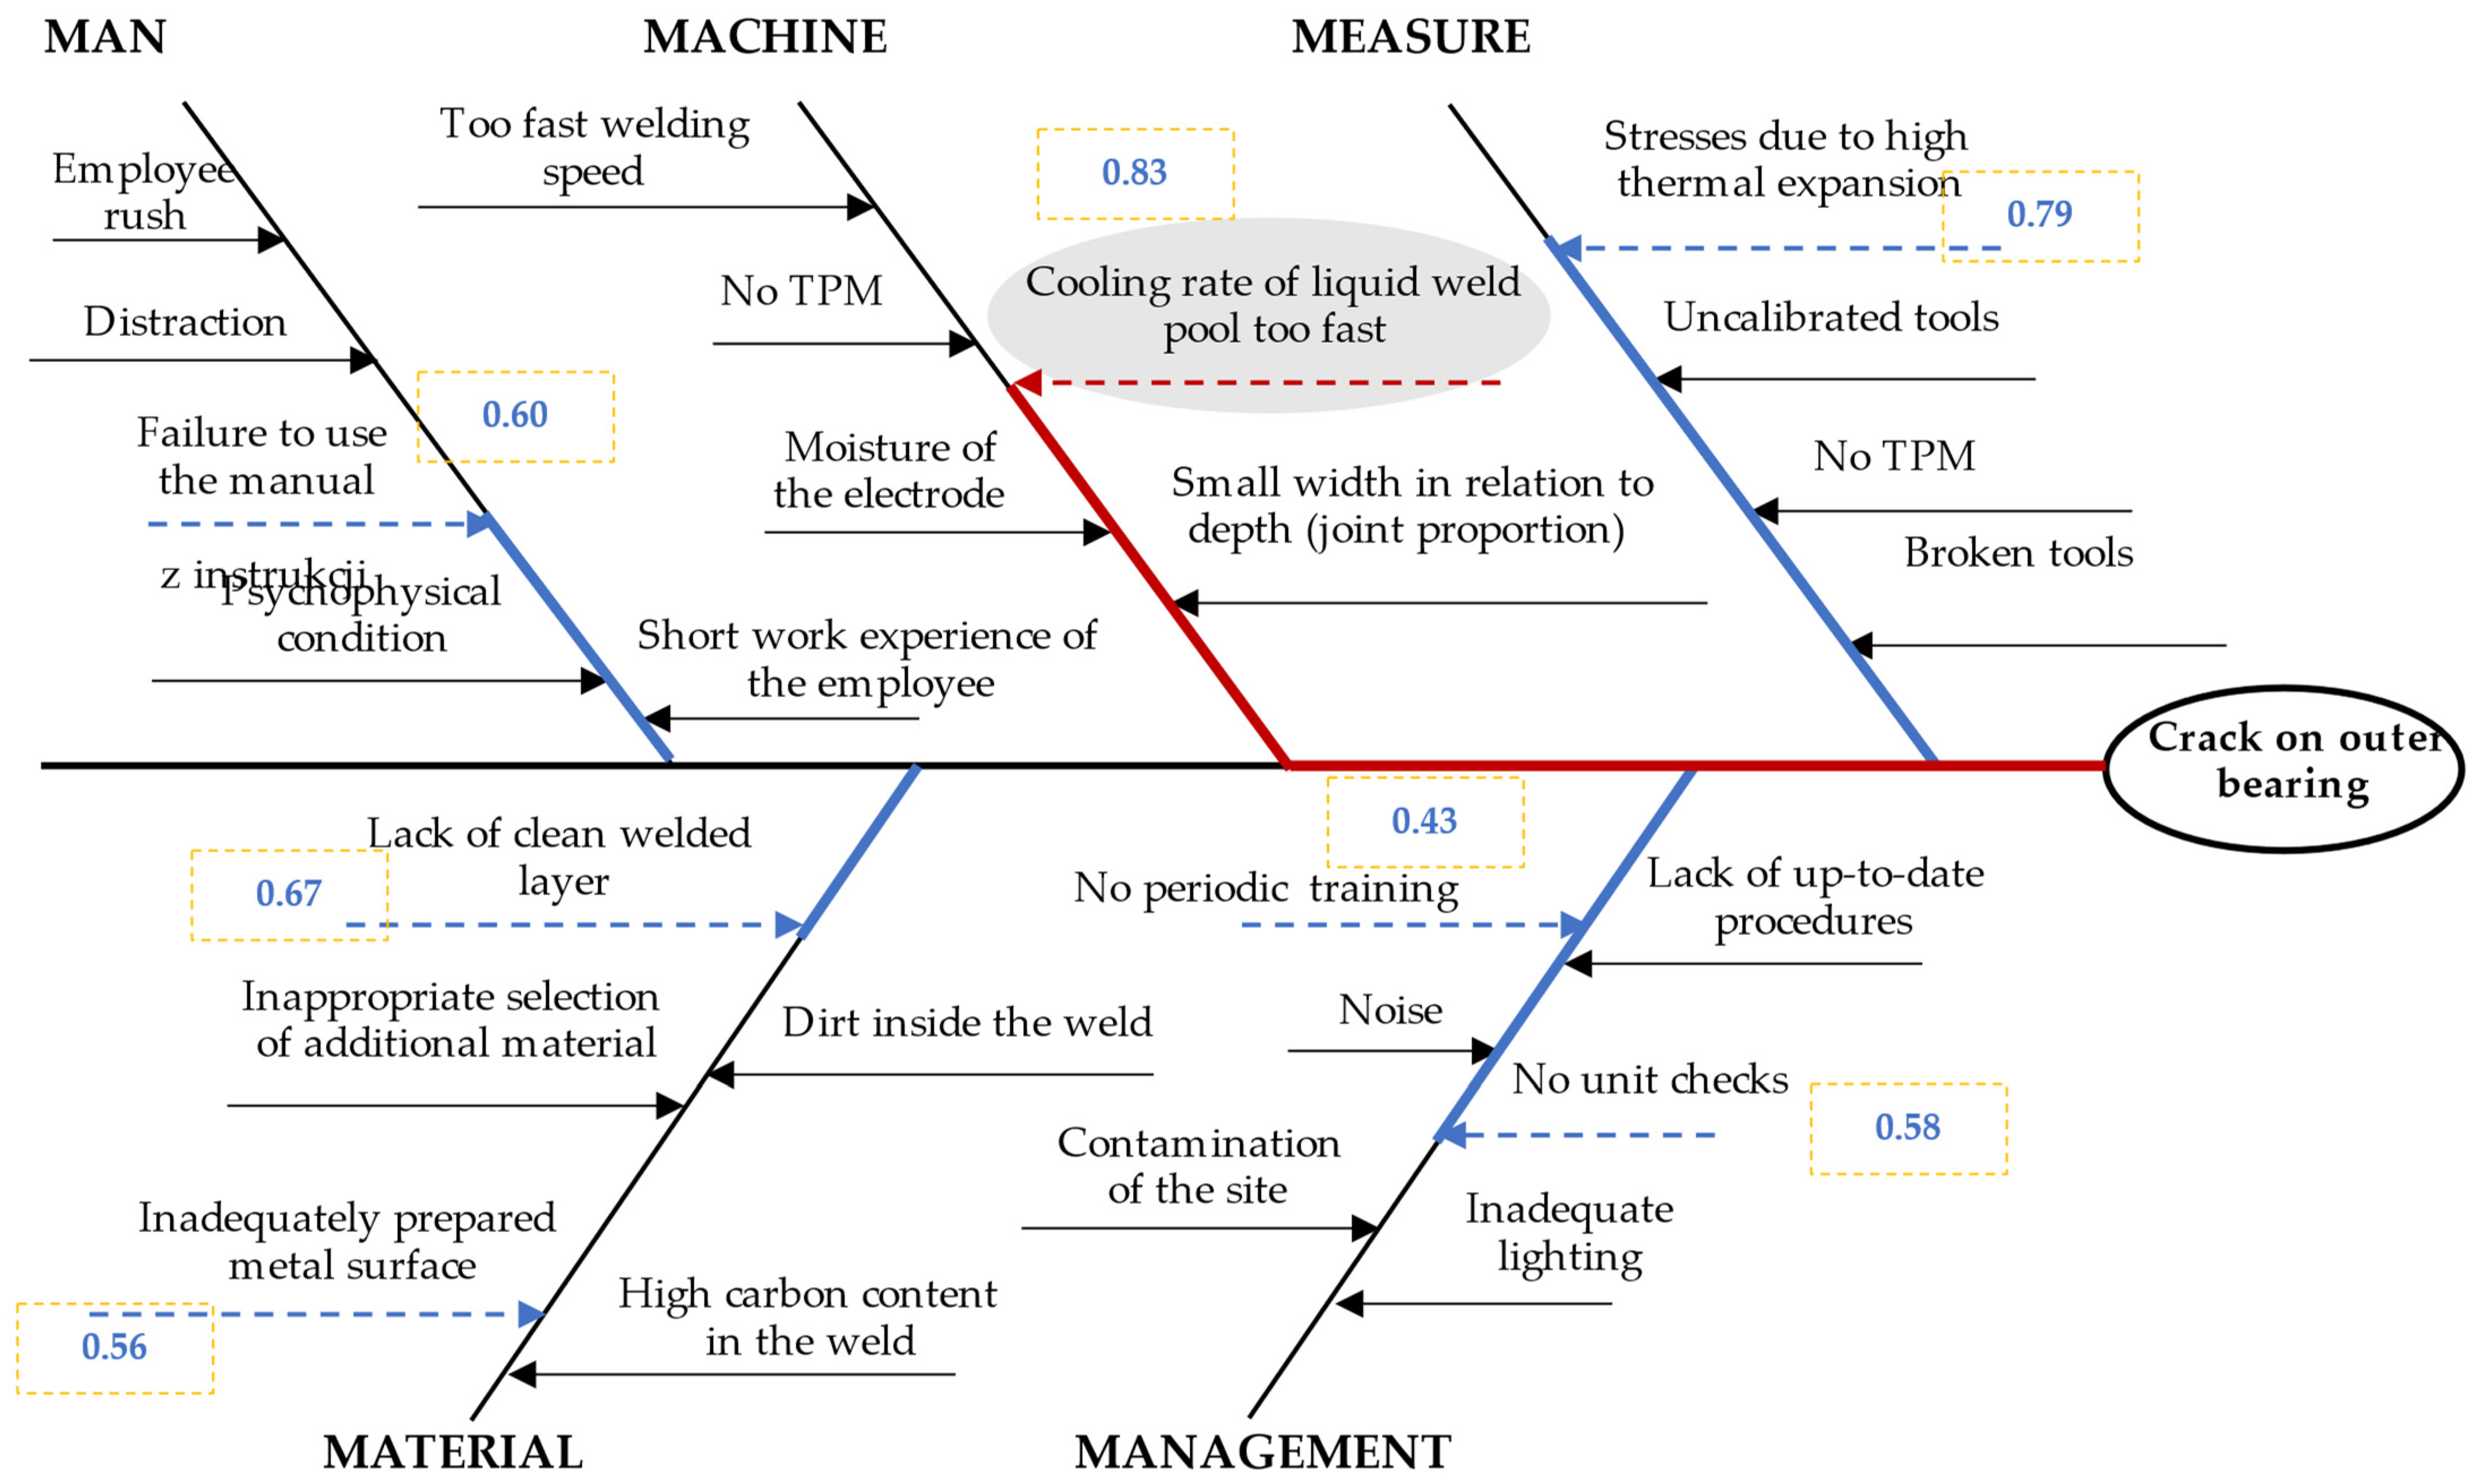
| Category 5M | No. | Potential Causes | Average Weight |
|---|---|---|---|
| Man | C3 | not following the manual | 3;5;3;2 |
| Machine | C9 | too high cooling rate of the liquid weld pool | 5;4;5;4 |
| Measure | C11 | stresses | 5;4;3;5 |
| Material | C15 | no cleaned top layer | 4;5;3;3 |
| Material | C17 | inadequately prepared metal surface | 2;4;4;3 |
| Management | C20 | no periodic training | 1;3;3;2 |
| Management | C24 | no unit checks | 2;3;5;2 |
| 5M | No. | Normalization | Grey Relational Coefficient | GRA | Ranking | Results | ||||||
|---|---|---|---|---|---|---|---|---|---|---|---|---|
| Man | C3 | 0.50 | 1.00 | 0.50 | 0.25 | 0.50 | 1.00 | 0.50 | 0.40 | 0.60 | 4 | |
| Machine | C9 | 1.00 | 0.75 | 1.00 | 0.75 | 1.00 | 0.67 | 1.00 | 0.67 | 0.83 | 1 | main cause |
| Measure | C11 | 1.00 | 0.75 | 0.50 | 1.00 | 1.00 | 0.67 | 0.50 | 1.00 | 0.79 | 2 | |
| Material | C15 | 0.75 | 1.00 | 0.50 | 0.50 | 0.67 | 1.00 | 0.50 | 0.50 | 0.67 | 3 | |
| Material | C17 | 0.25 | 0.75 | 0.75 | 0.50 | 0.40 | 0.67 | 0.67 | 0.50 | 0.56 | 6 | |
| Management | C20 | 0.00 | 0.50 | 0.50 | 0.25 | 0.33 | 0.50 | 0.50 | 0.40 | 0.43 | 7 | |
| Management | C24 | 0.25 | 0.50 | 1.00 | 0.25 | 0.40 | 0.50 | 1.00 | 0.40 | 0.58 | 5 | |
| 5M | No. | Second-Order Causes |
GRA | Ranking |
|---|---|---|---|---|
| Man | C3 | not following the manual | 0.60 | 4 |
| Machine | C9 | too high cooling rate of the liquid weld pool | 0.83 | 1 |
| Measure | C11 | stresses | 0.79 | 2 |
| Material | C15 | no cleaned top layer | 0.67 | 3 |
| Material | C17 | inadequately prepared metal surface | 0.56 | 6 |
| Management | C20 | no periodic training | 0.43 | 7 |
| Management | C24 | no unit checks | 0.58 | 5 |
Publisher’s Note: MDPI stays neutral with regard to jurisdictional claims in published maps and institutional affiliations. |
© 2022 by the authors. Licensee MDPI, Basel, Switzerland. This article is an open access article distributed under the terms and conditions of the Creative Commons Attribution (CC BY) license (https://creativecommons.org/licenses/by/4.0/).
Share and Cite
Siwiec, D.; Pacana, A. A New Model Supporting Stability Quality of Materials and Industrial Products. Materials 2022, 15, 4440. https://doi.org/10.3390/ma15134440
Siwiec D, Pacana A. A New Model Supporting Stability Quality of Materials and Industrial Products. Materials. 2022; 15(13):4440. https://doi.org/10.3390/ma15134440
Chicago/Turabian StyleSiwiec, Dominika, and Andrzej Pacana. 2022. "A New Model Supporting Stability Quality of Materials and Industrial Products" Materials 15, no. 13: 4440. https://doi.org/10.3390/ma15134440
APA StyleSiwiec, D., & Pacana, A. (2022). A New Model Supporting Stability Quality of Materials and Industrial Products. Materials, 15(13), 4440. https://doi.org/10.3390/ma15134440