
Increasing the Mechanical Strength and Corrosion Resistance of Aluminum Alloy 7075 via Hydrostatic Extrusion and Aging

 ,
,  ,
,  , and
, and
Abstract
:1. Introduction
2. Materials and Methods
3. Results
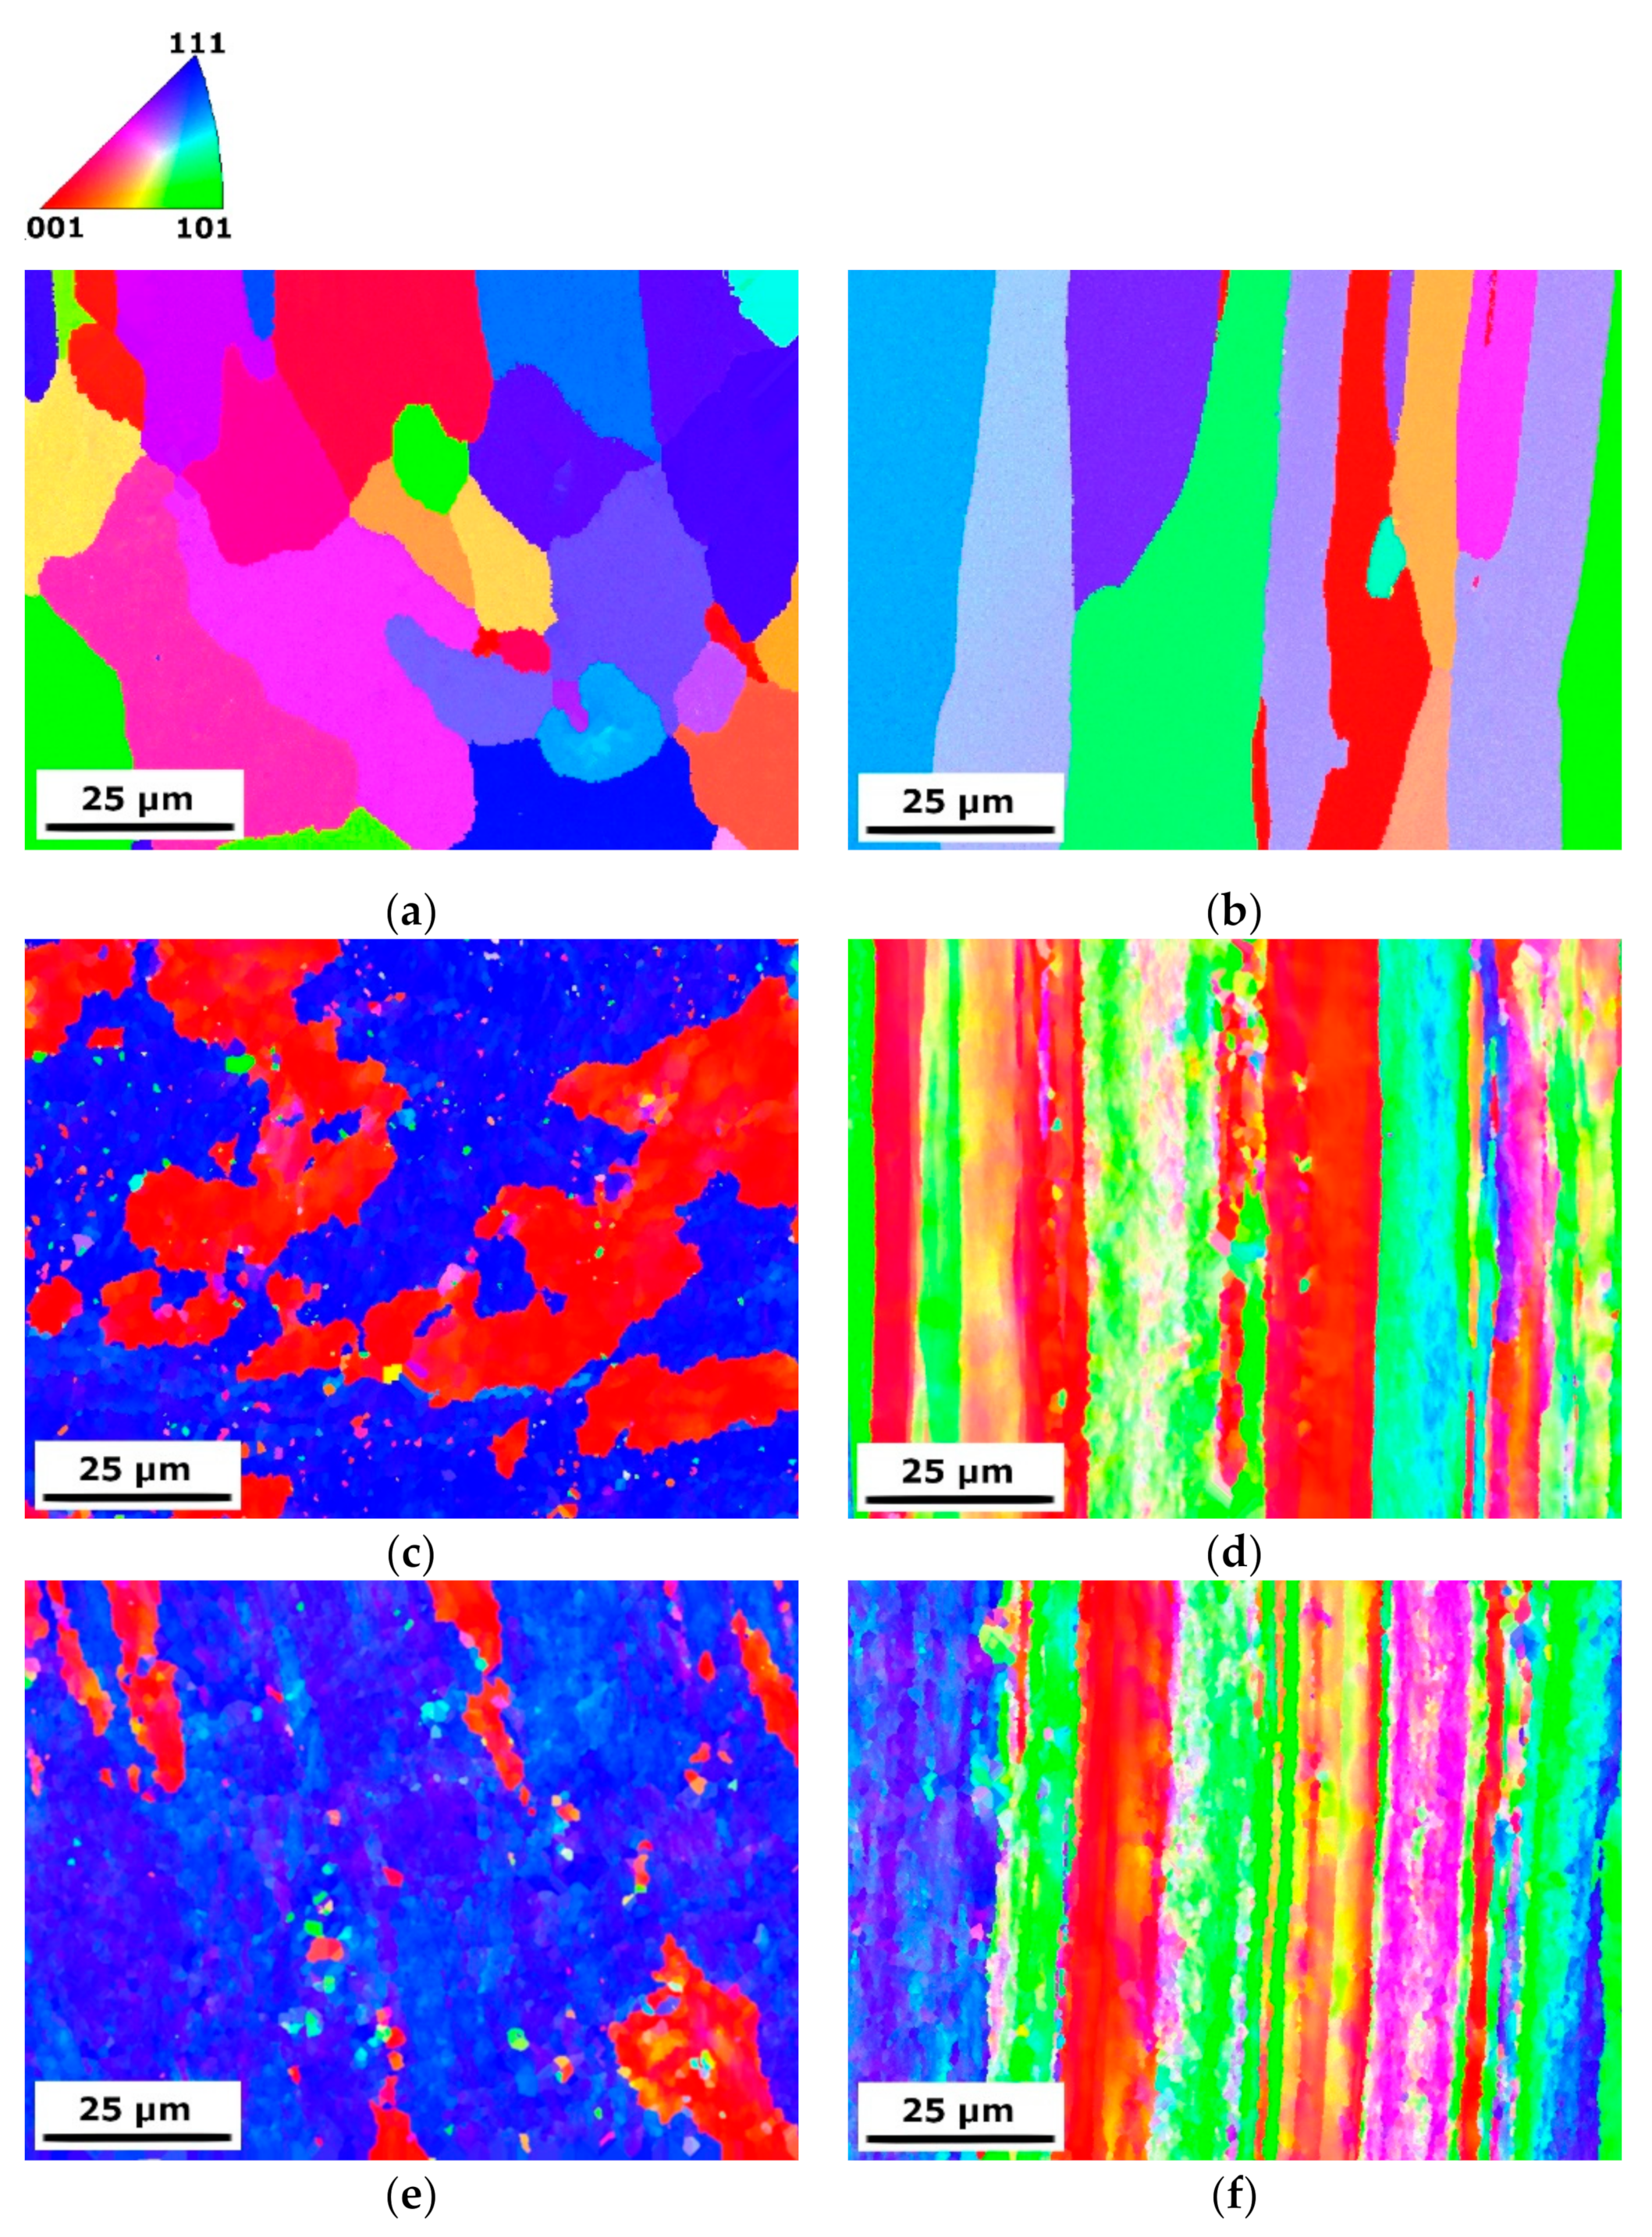
3.1. Microstructure Evolution
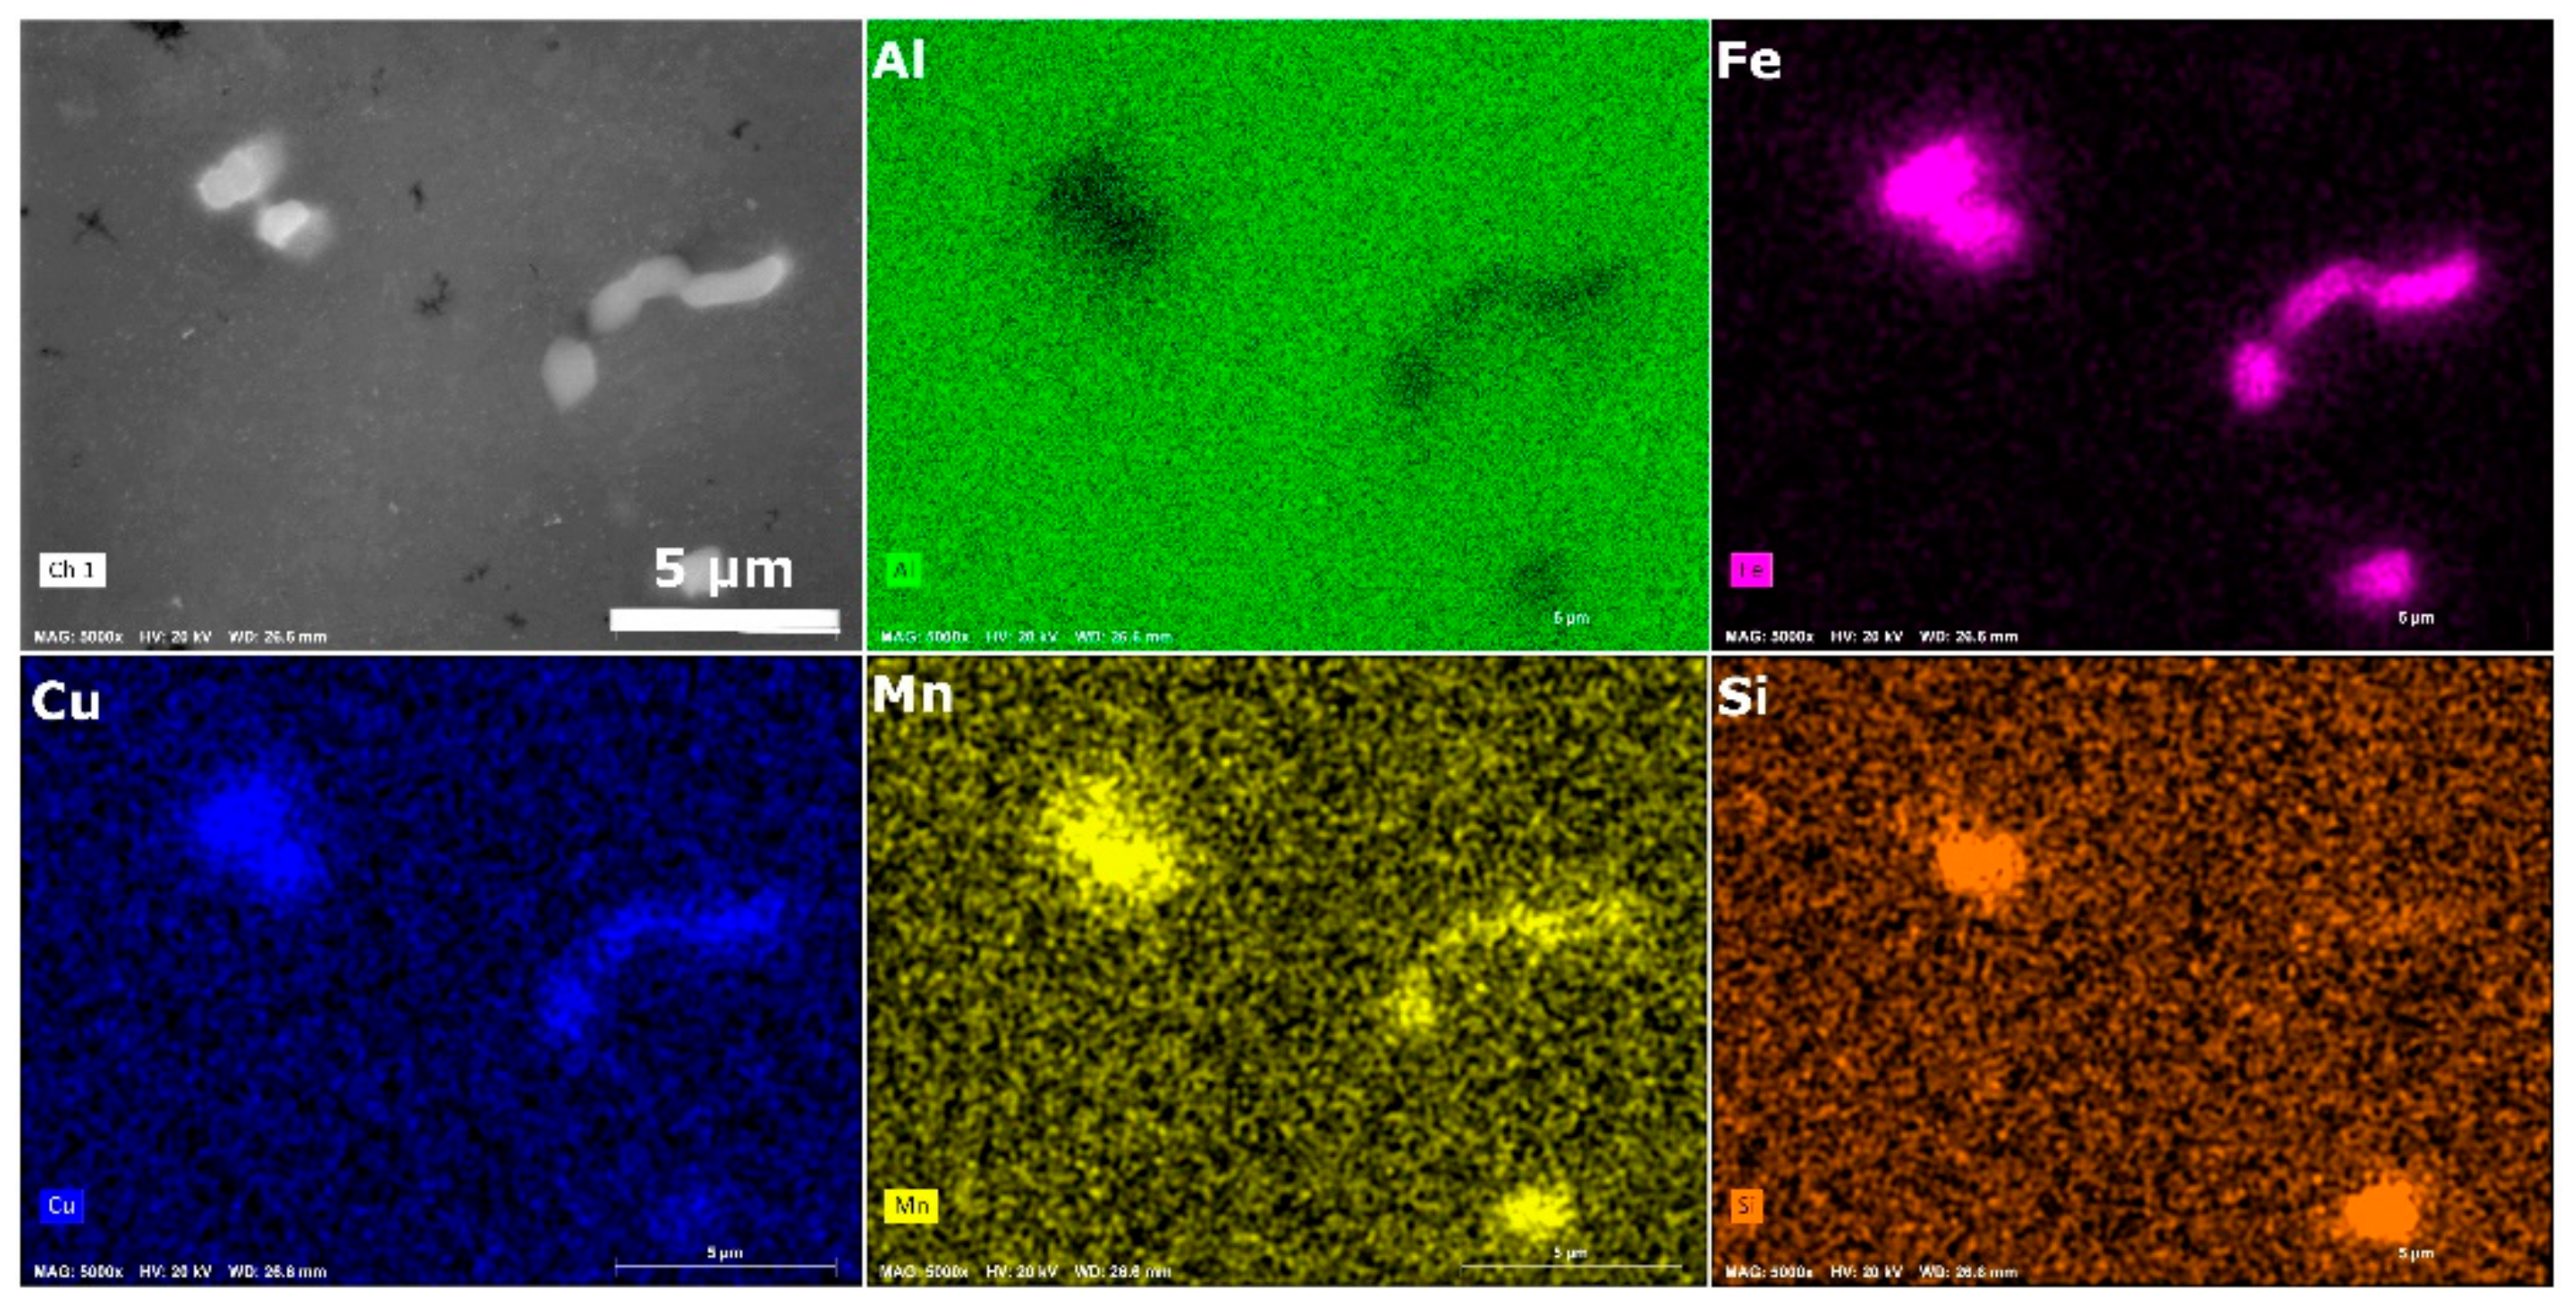
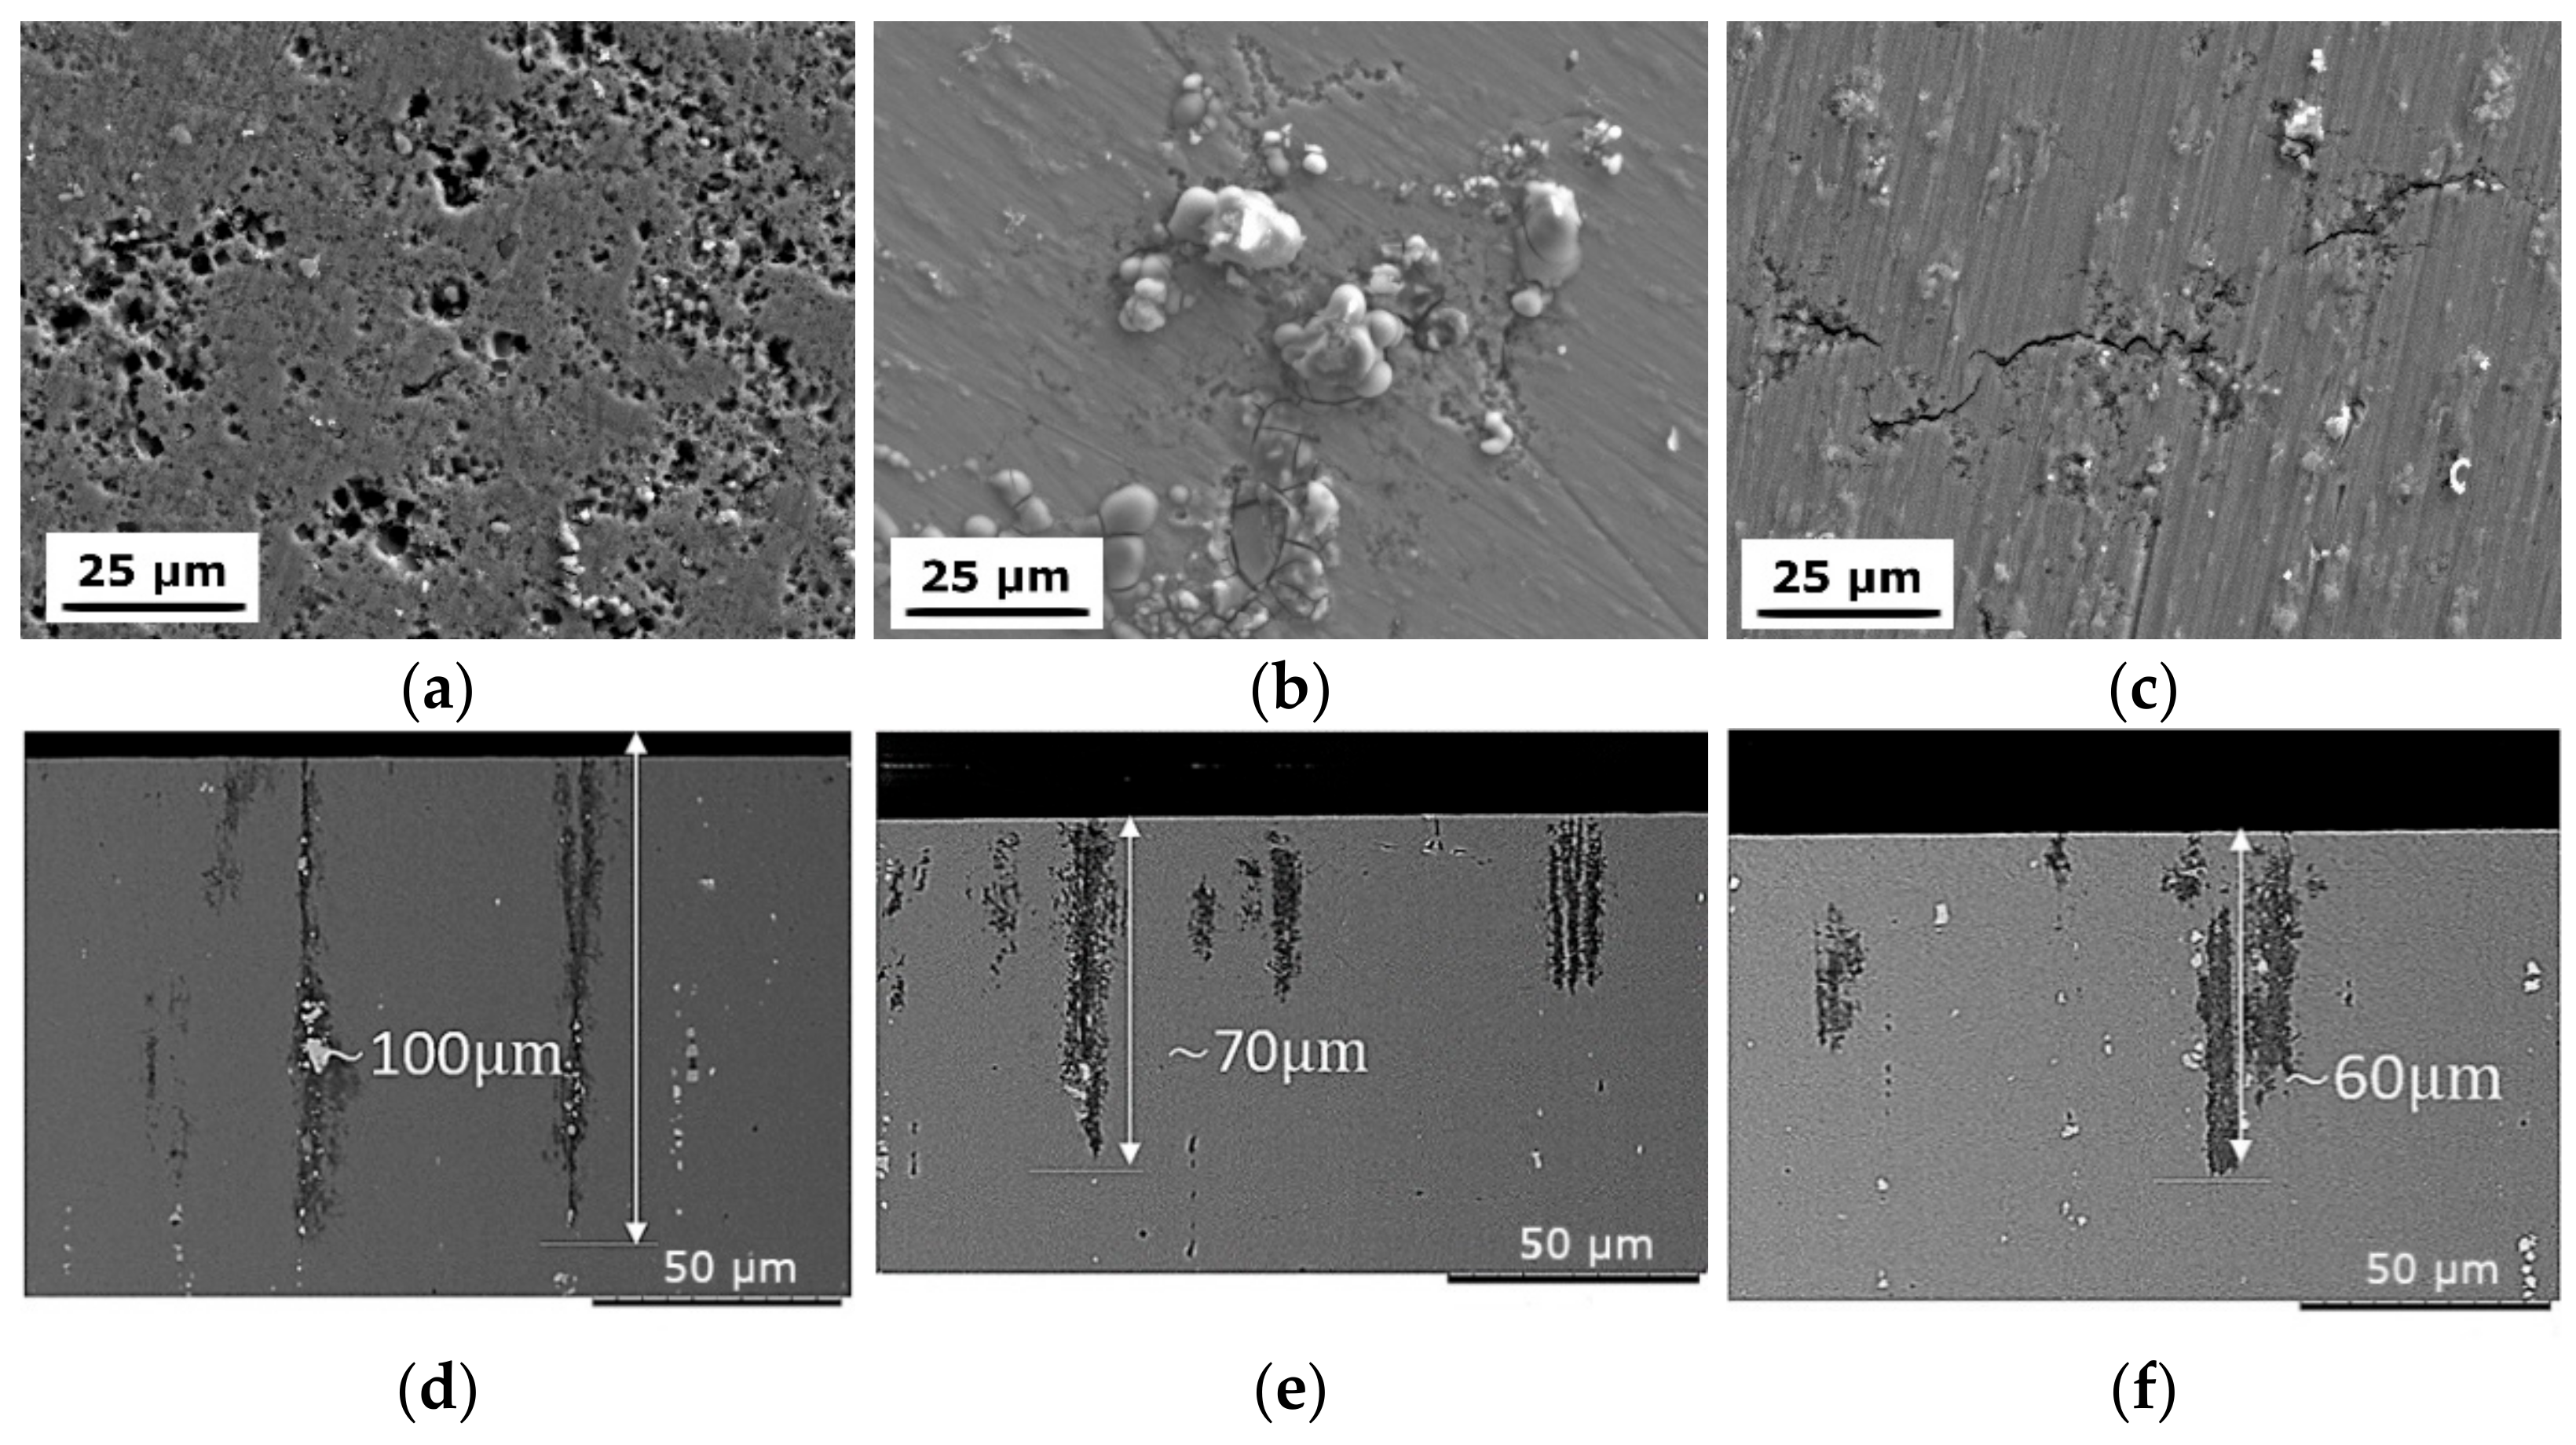
3.1.1. SEM
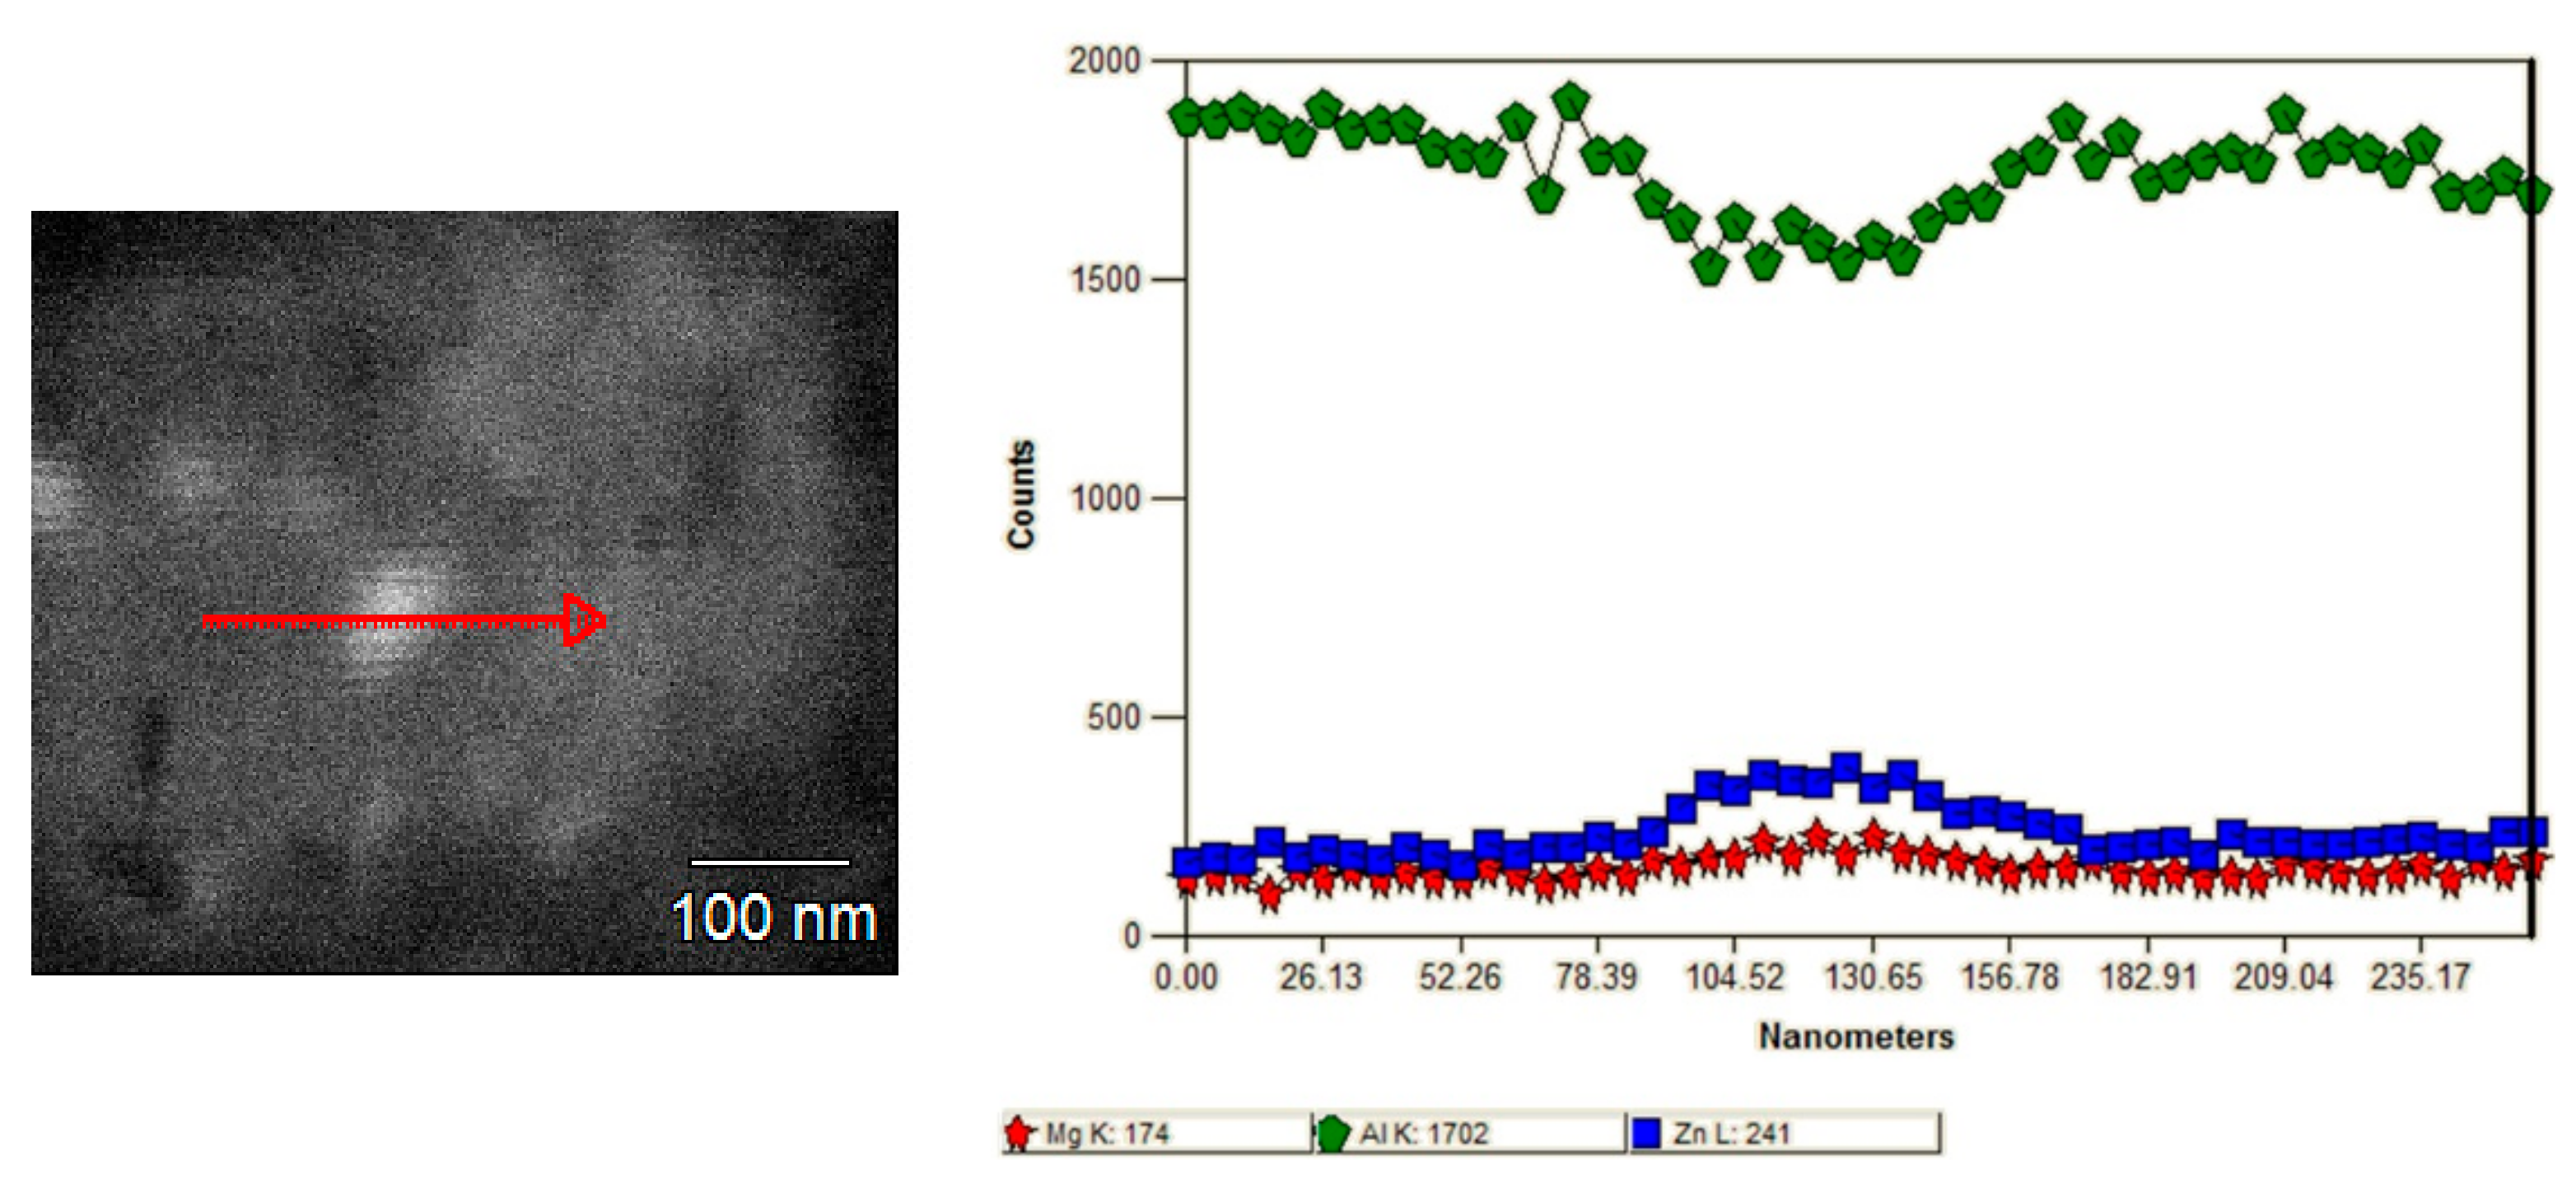
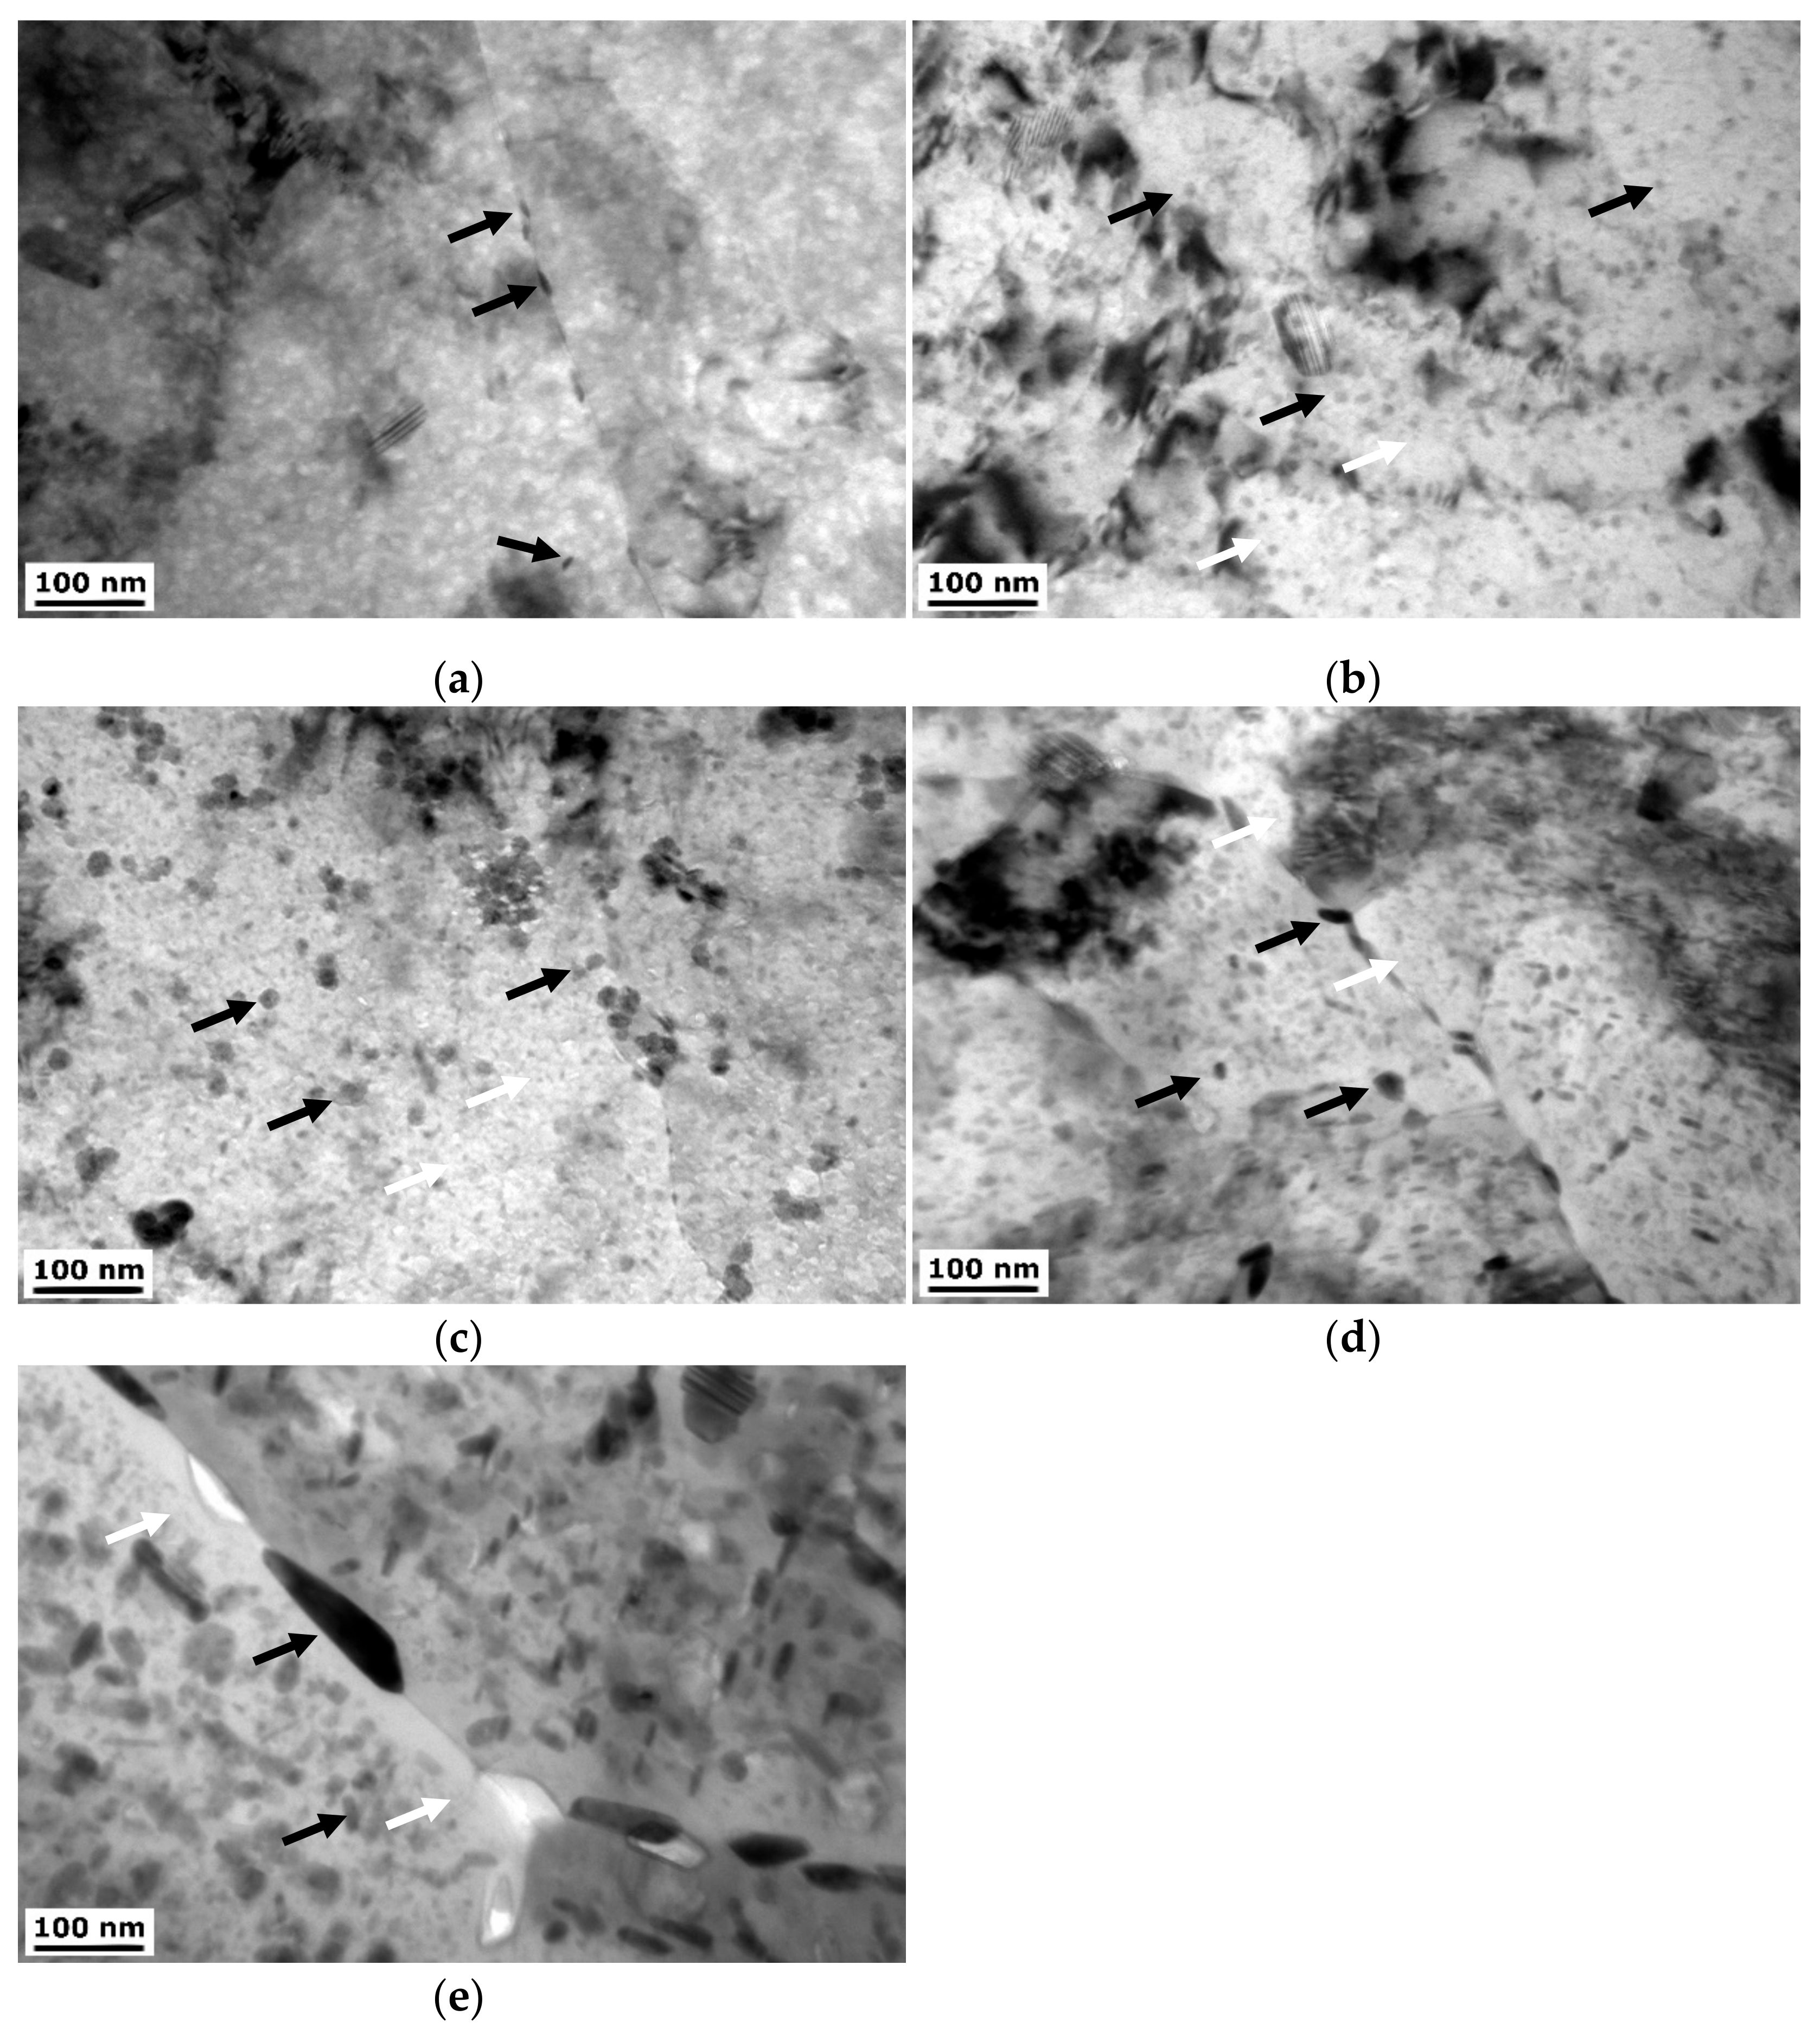
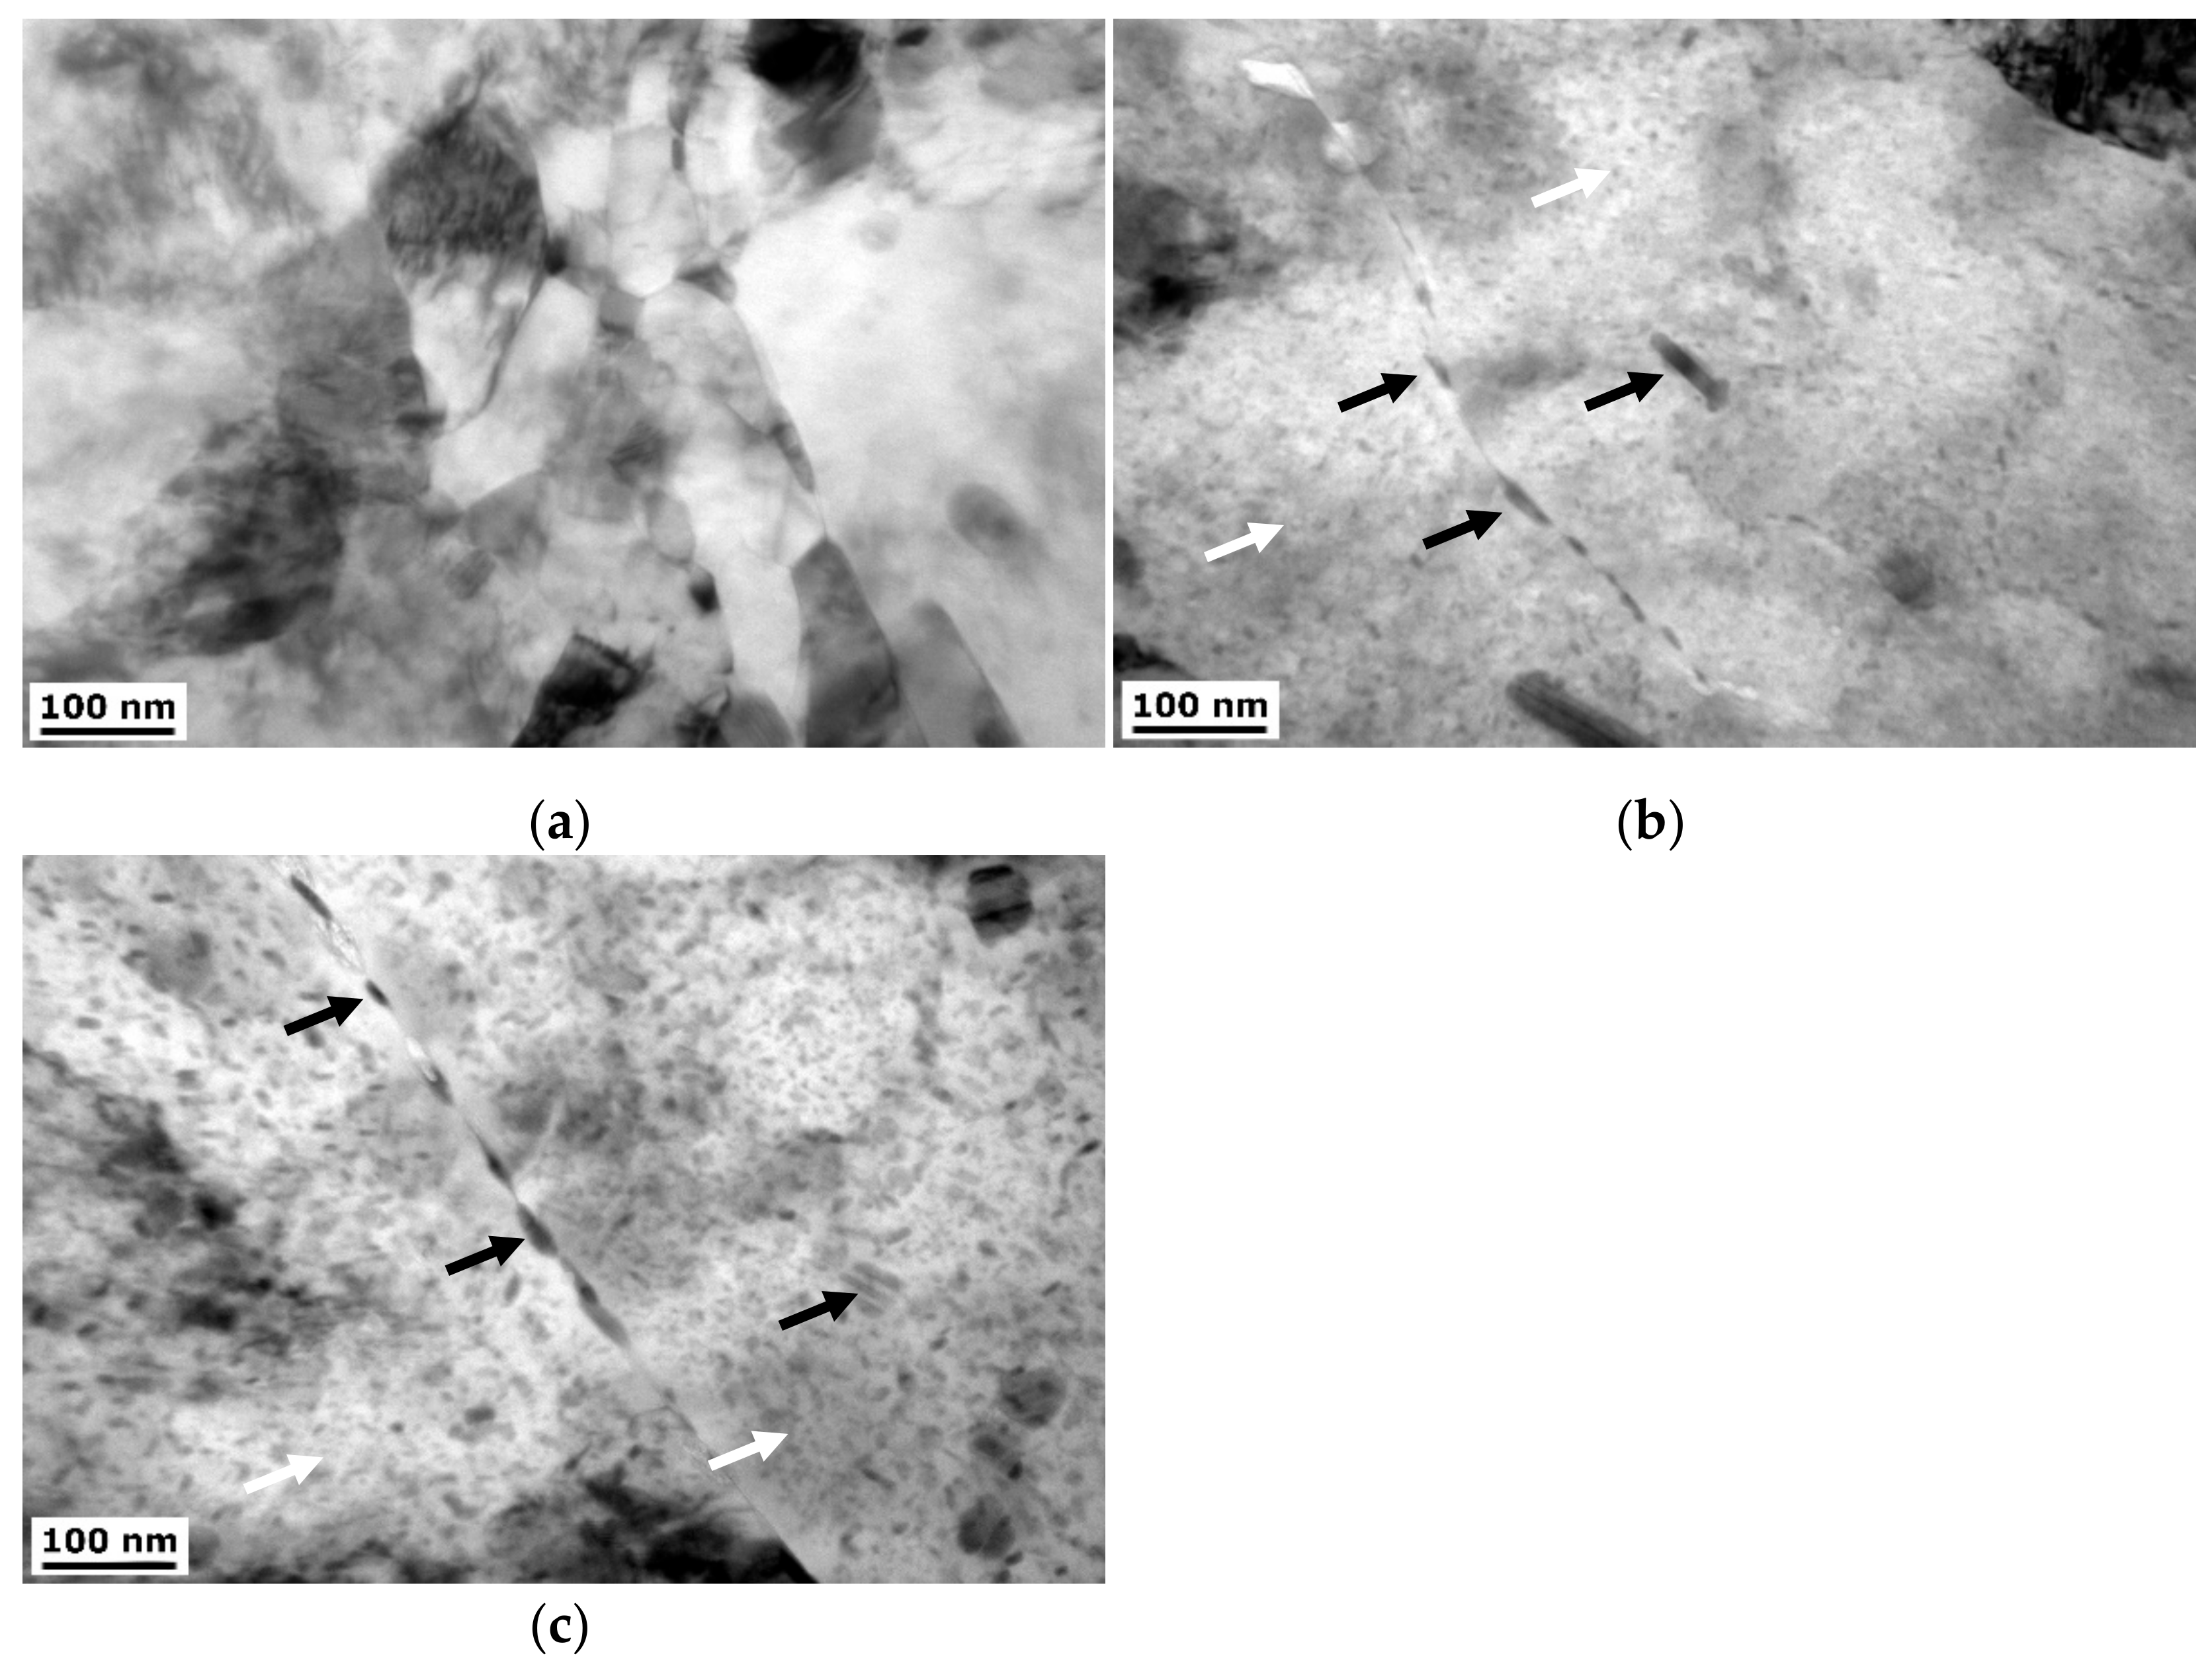
3.1.2. TEM
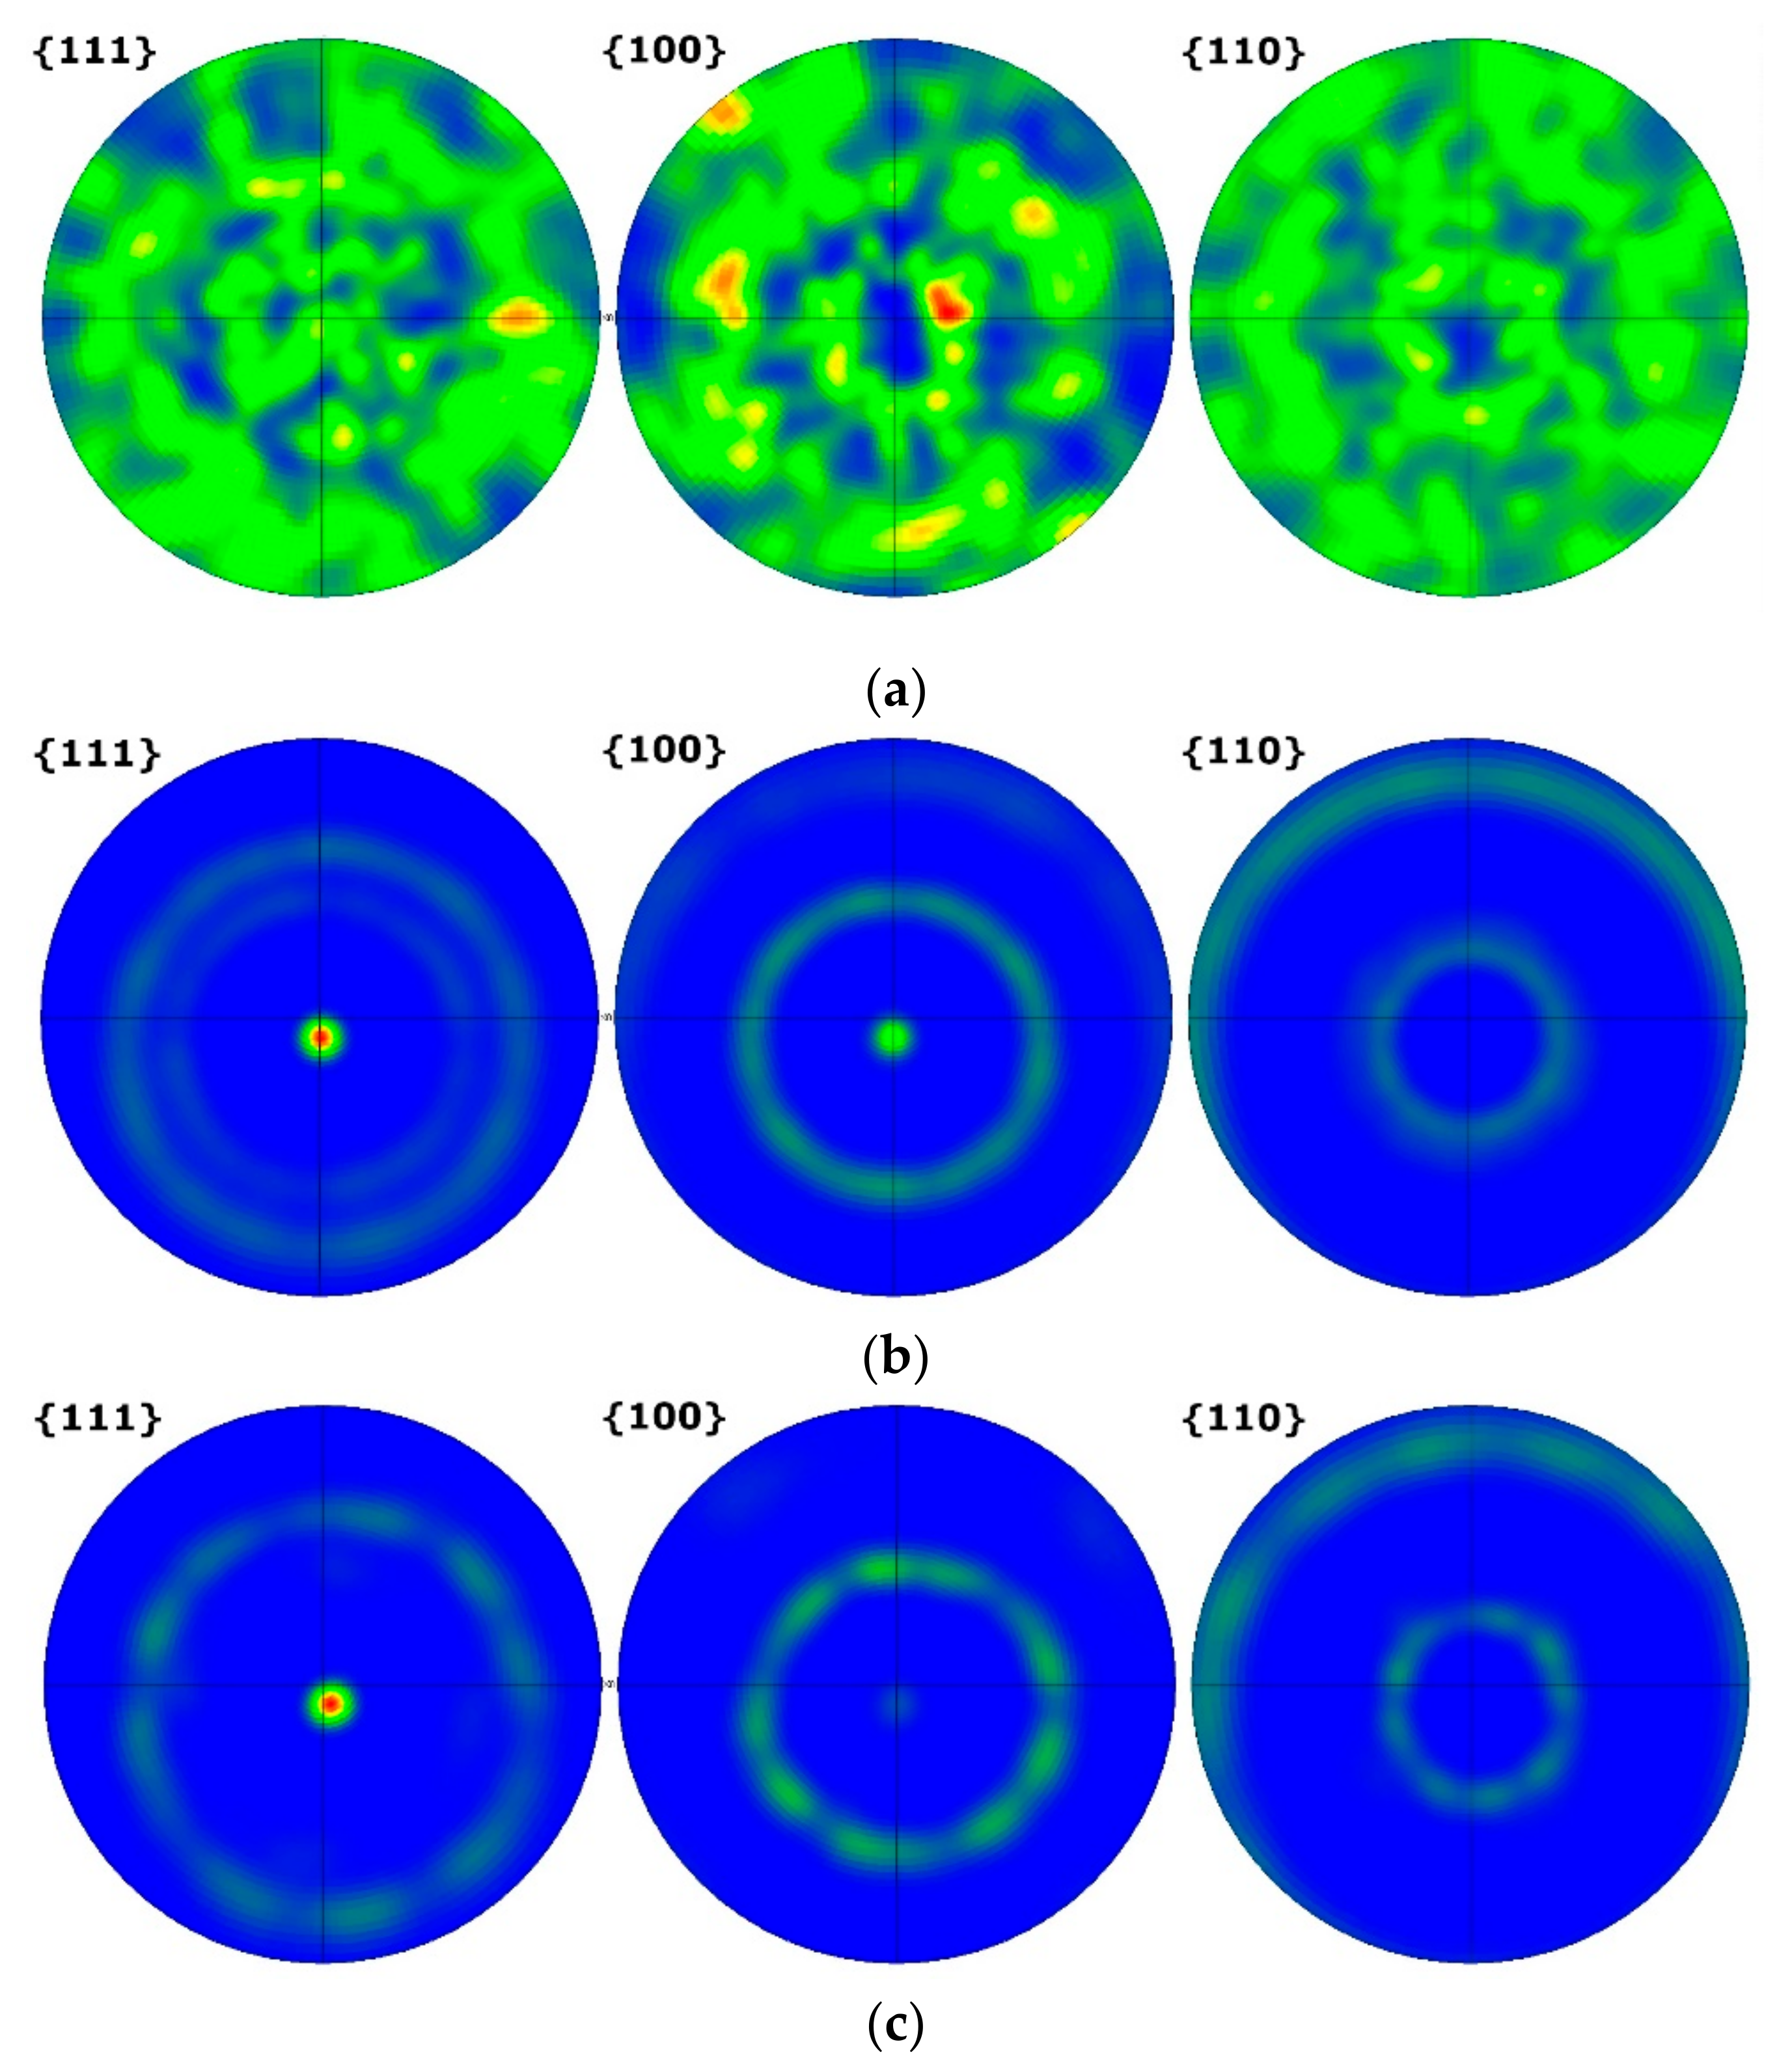
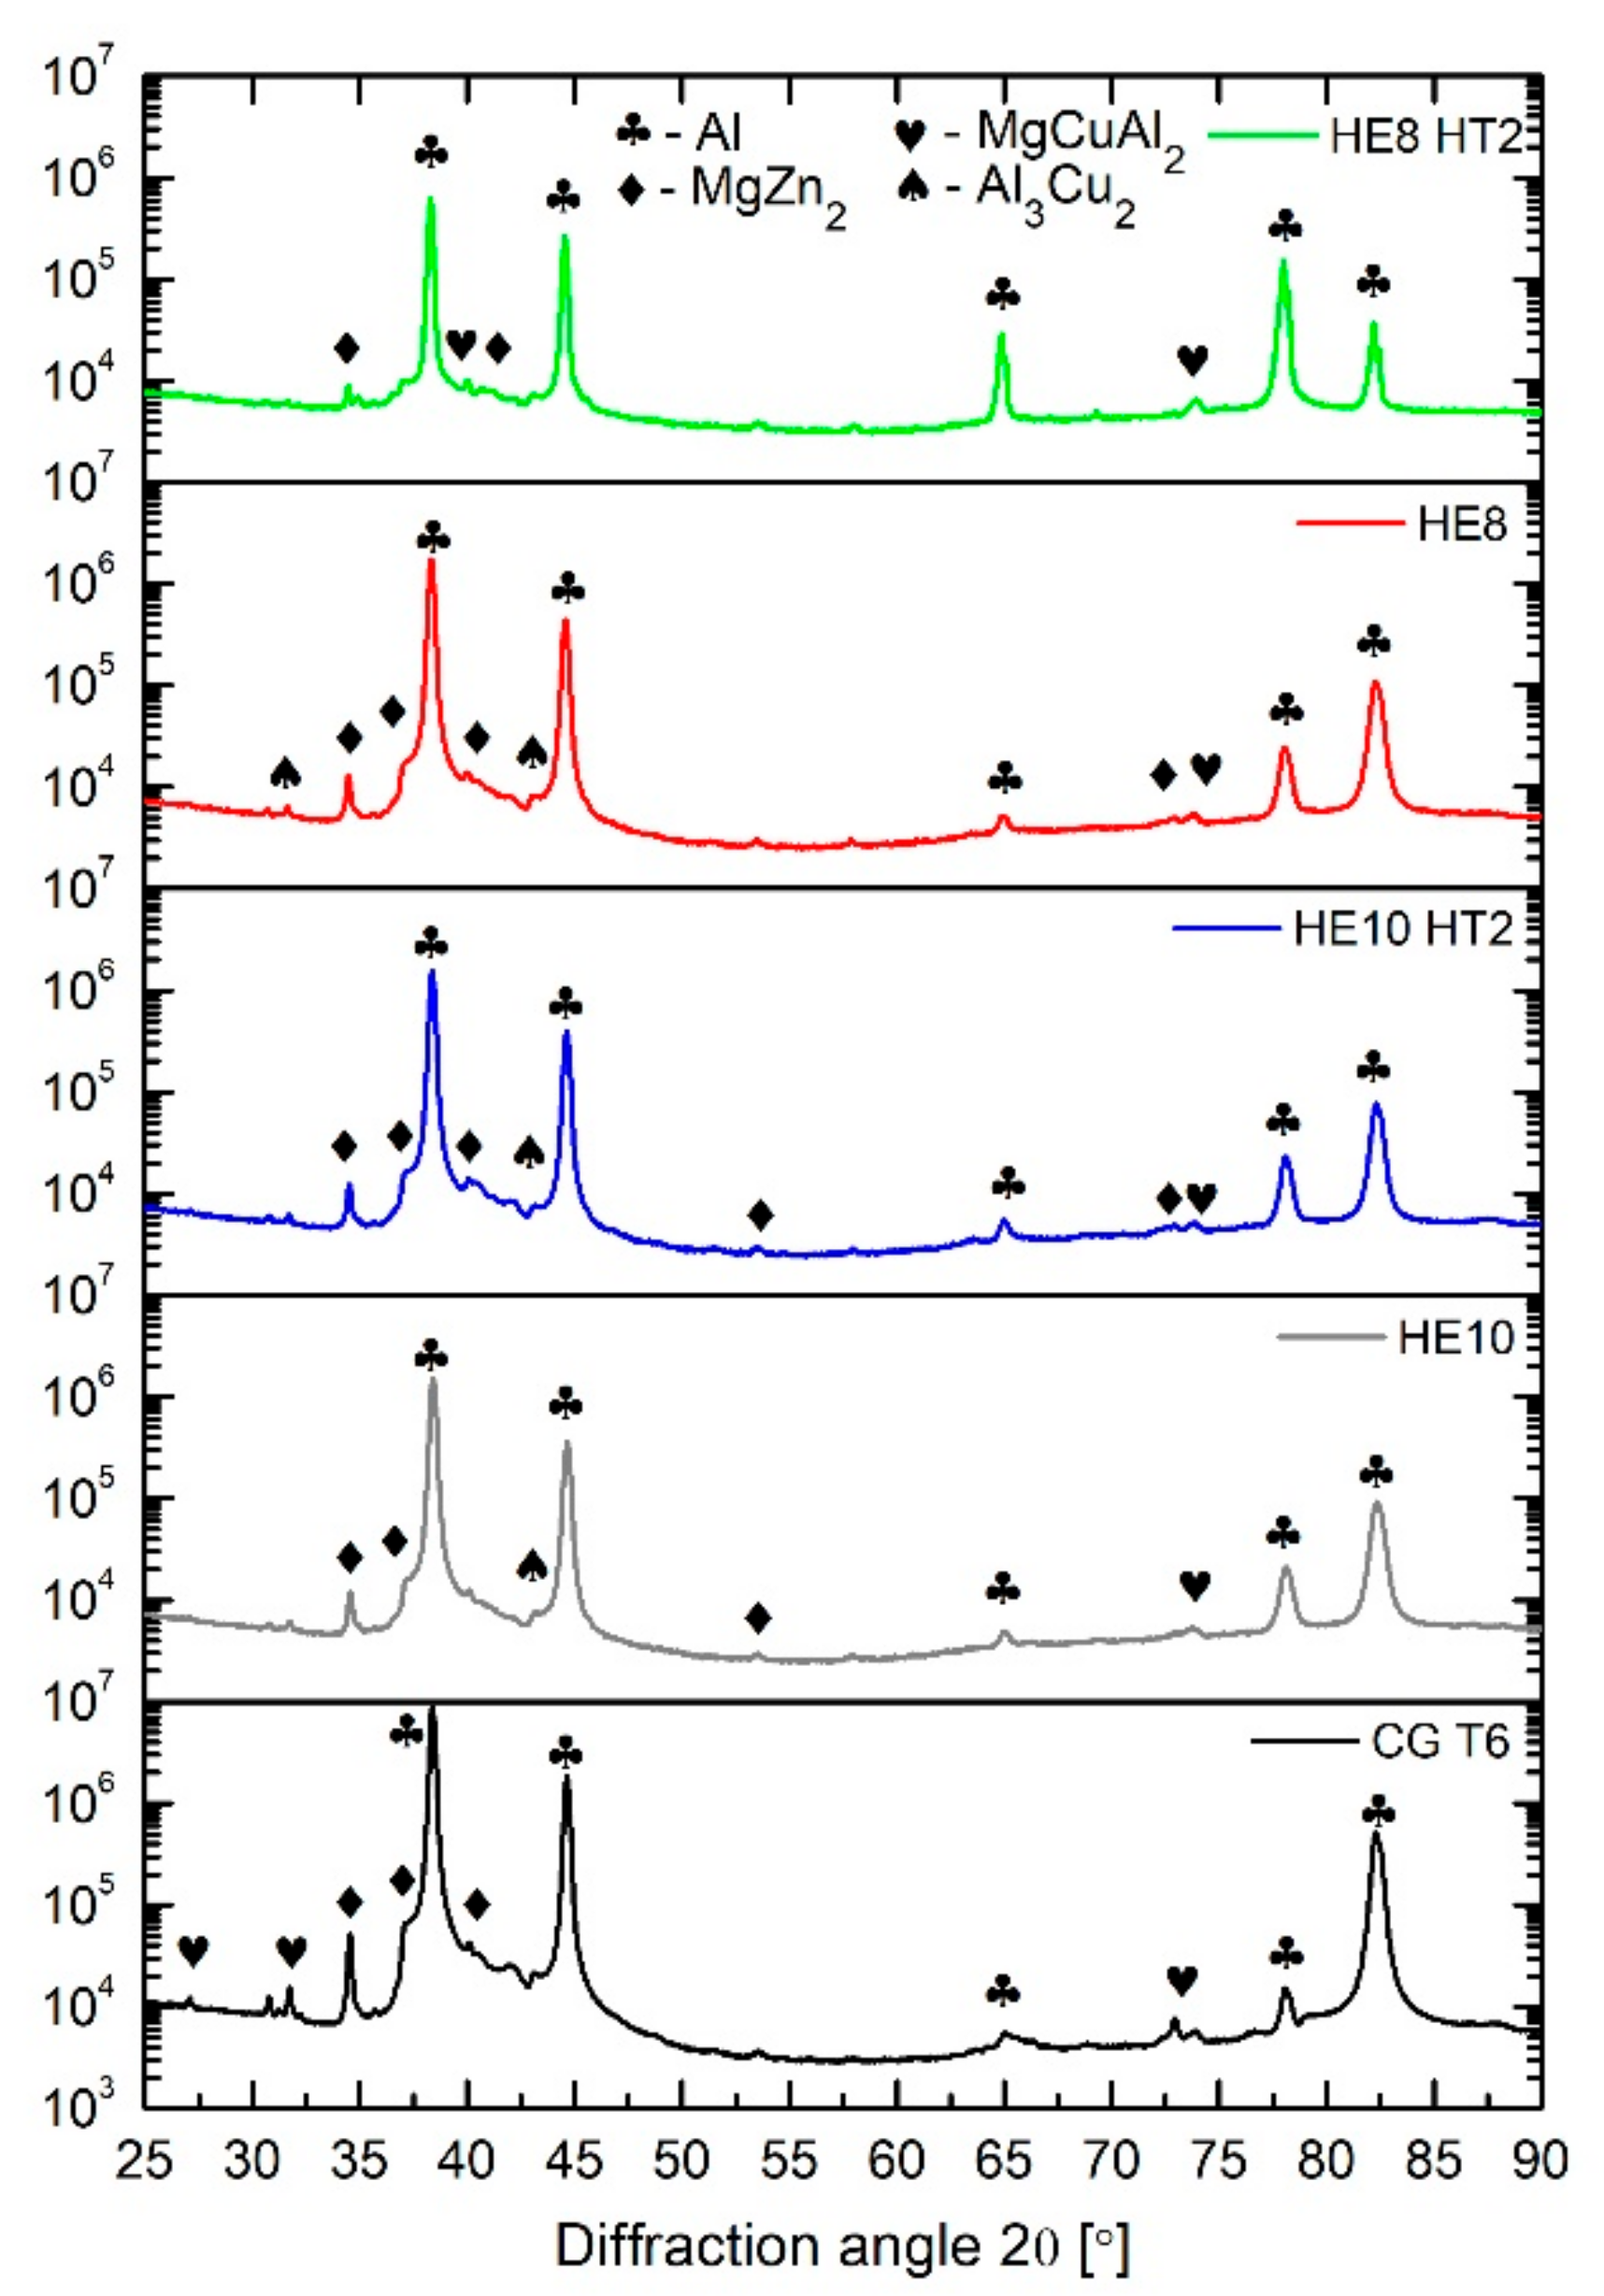
3.1.3. XRD
3.2. Mechanical Properties
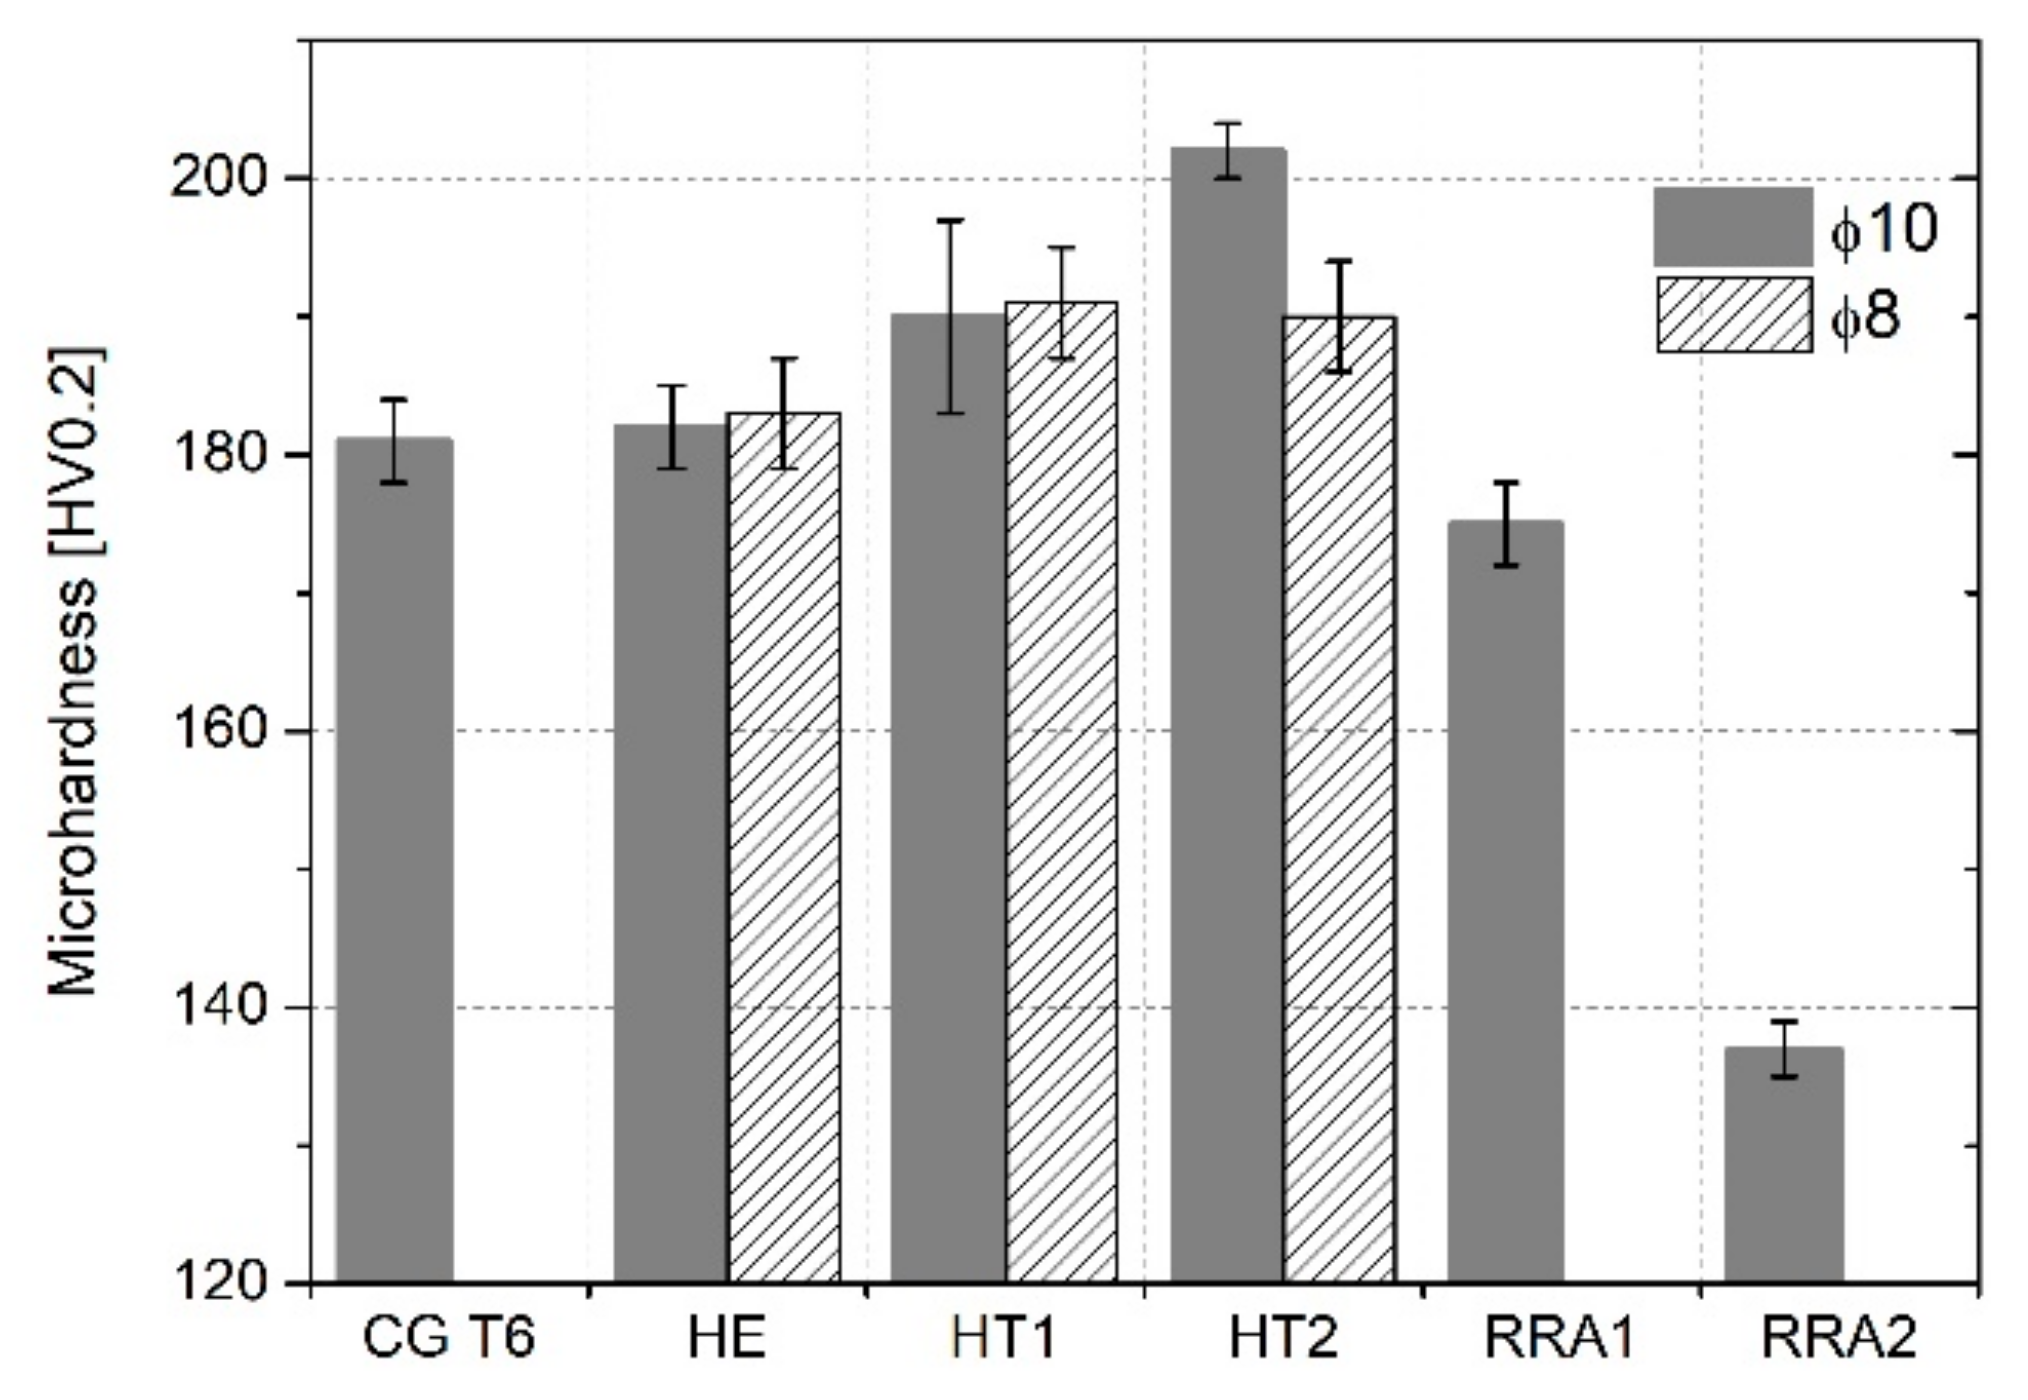
3.2.1. Microhardness Measurements
3.2.2. Tensile Tests
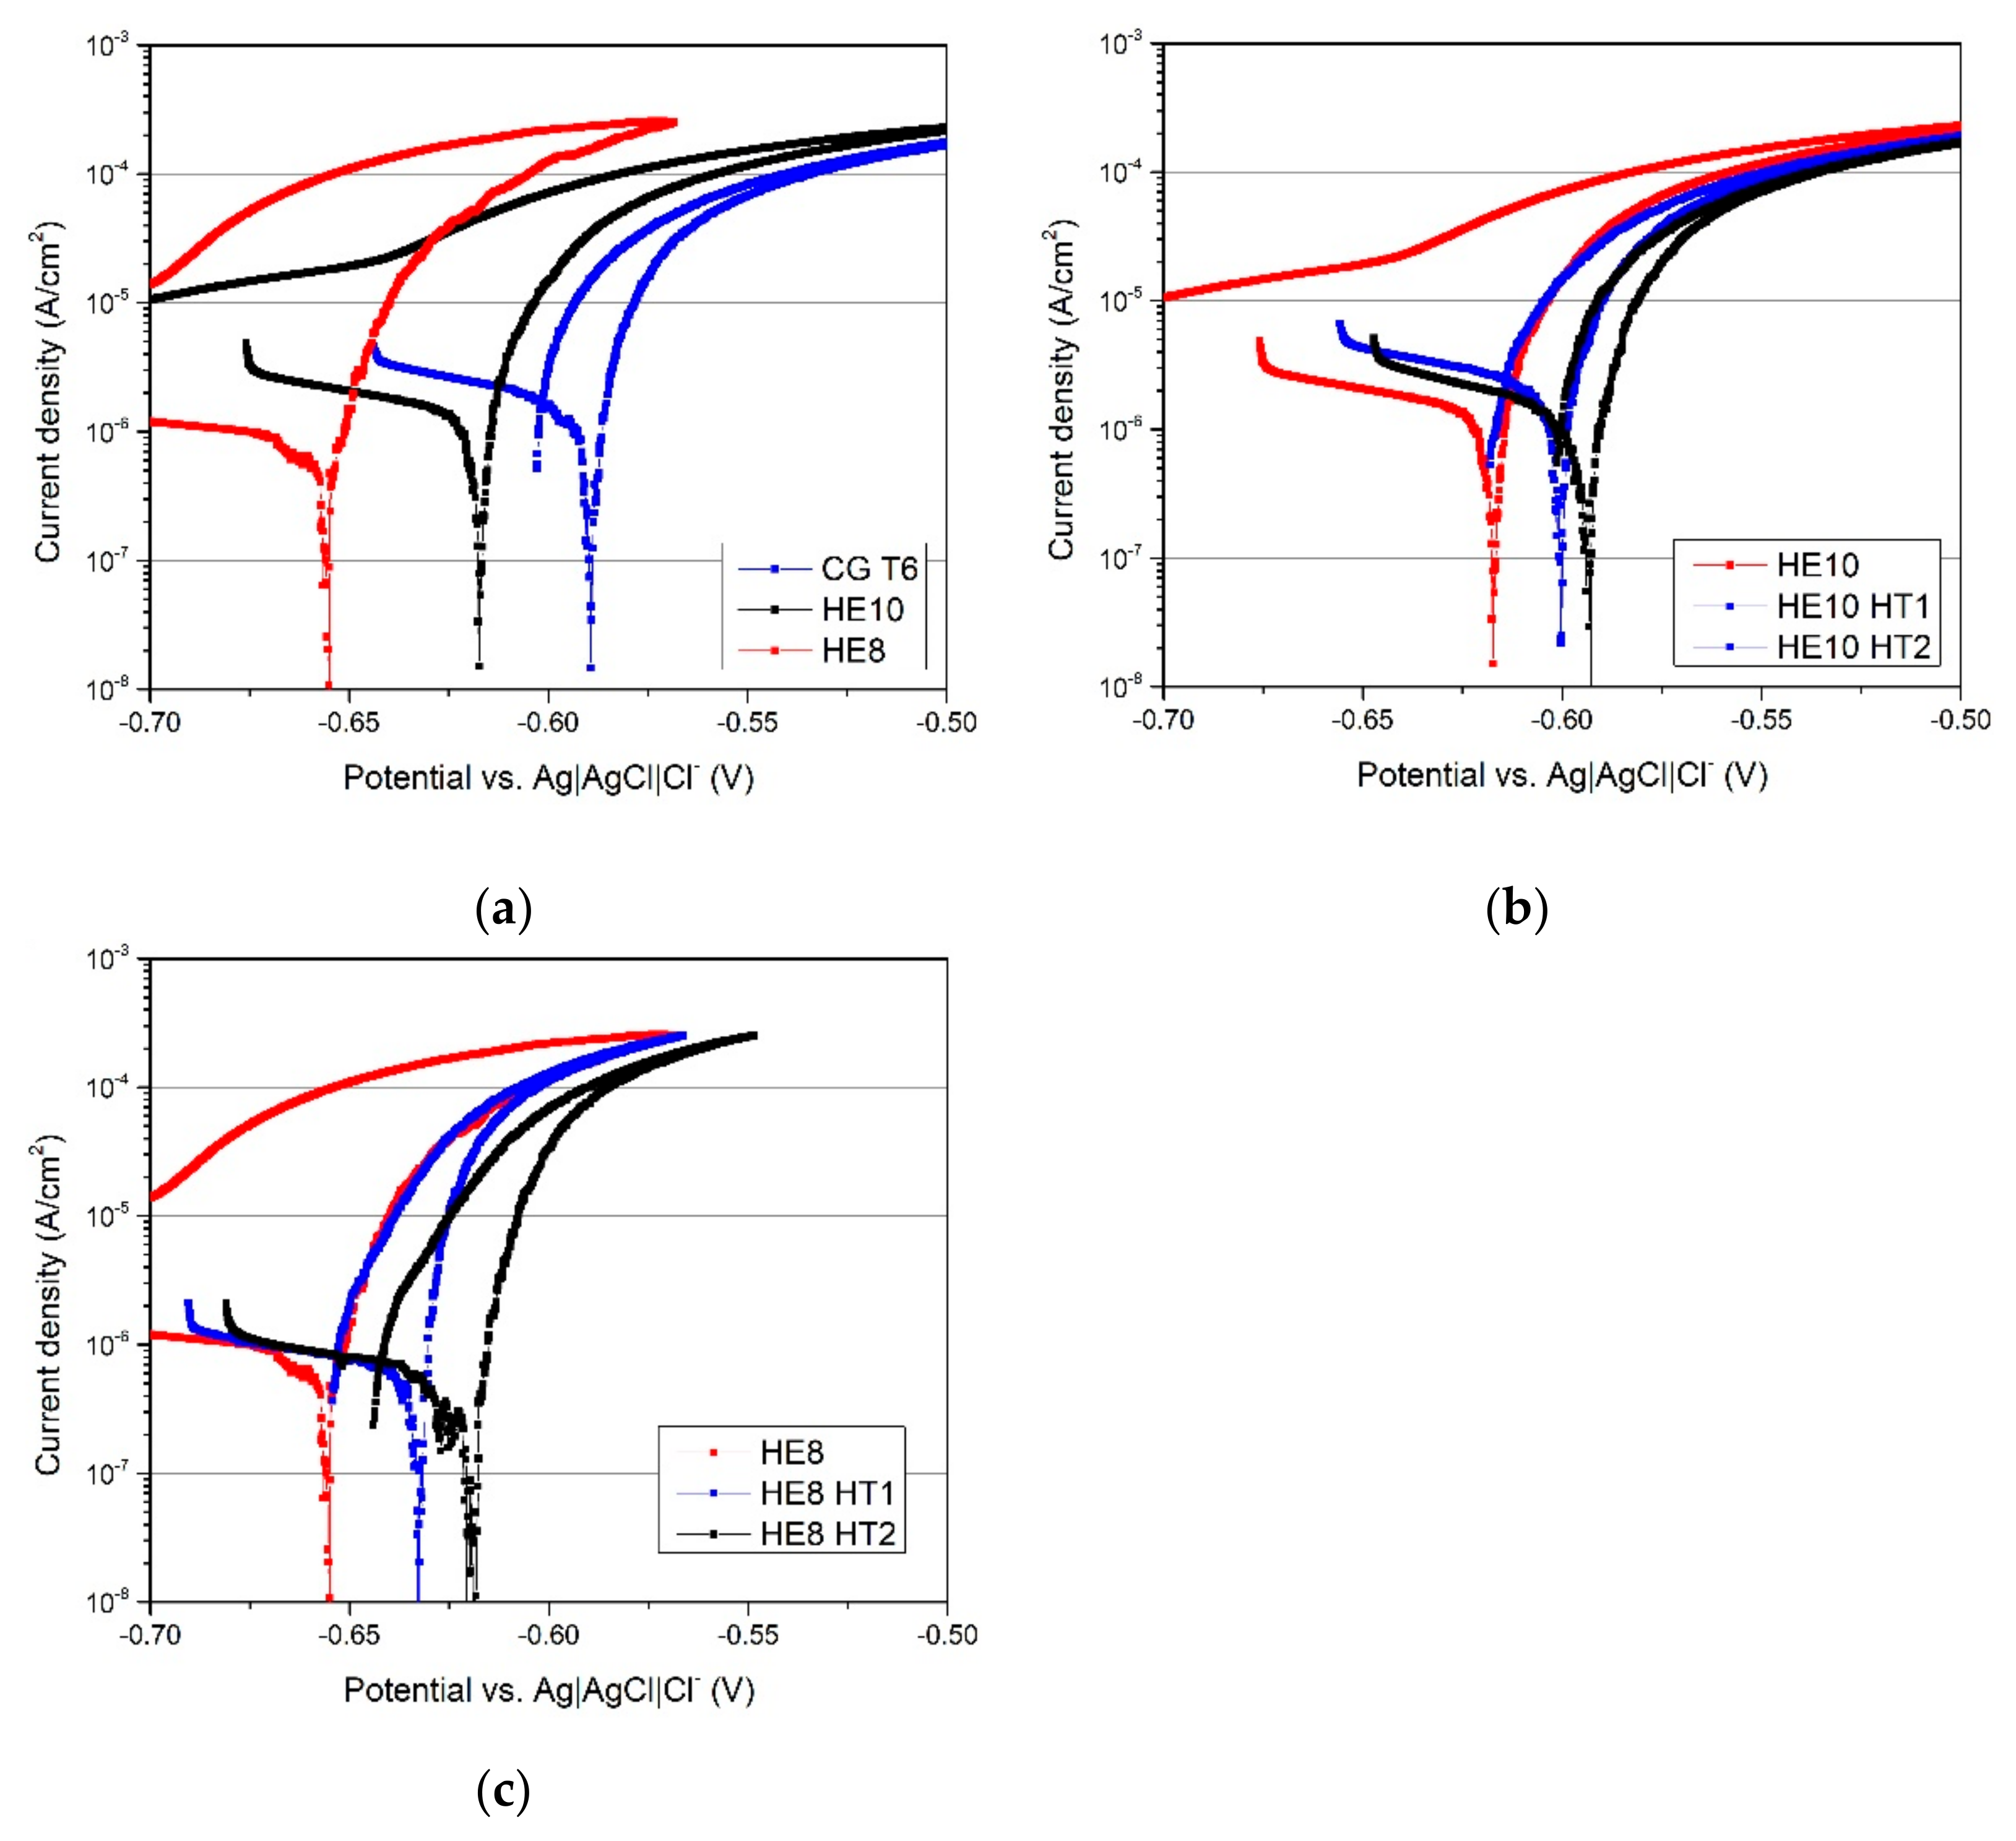
3.3. Electrochemical Properties
4. Discussion
4.1. The Influence of Microstructure Evolution on Mechanical Properties
4.2. The Evolution of Resistance to Corrosion
5. Conclusions
- The HE process caused substantial grain refinement; however, the applied strain values of ε = 1.41 and ε = 1.85 resulted in the majority of grain boundaries being LAGBs;
- The samples that underwent HE displayed different precipitation phenomena—the increased number of grain boundaries resulted in a higher number of boundary precipitates, which do not contribute to an increase in mechanical strength;
- HE with an aging process caused an increase in tensile strength in a range of 50–135 MPa in comparison to CG T6 sample. The highest value of 675 MPa was obtained for singe-stepped HE with natural aging;
- Due to the increase in applied strain during HE, a lower aging temperature was required to develop high mechanical strength;
- The samples which underwent HE showed lower susceptibility to localized corrosion in comparison to the CG T6 sample as a result of the grain refinement and higher fraction of LAGBs, which are resistant to corrosion attack.
Author Contributions
Funding
Institutional Review Board Statement
Informed Consent Statement
Data Availability Statement
Acknowledgments
Conflicts of Interest
References
- Polmear, I.J. Solute Partitioning to Enhance Mechanical Properties of Aged Aluminium Alloys; Woodhead Publishing Limited: Cambridge, UK, 2011. [Google Scholar] [CrossRef]
- Majchrowicz, K.; Pakiela, Z.; Giżyński, M.; Karny, M.; Kulczyk, M. High-cycle fatigue strength of ultrafine-grained 5483 Al-Mg alloy at low and elevated temperature in comparison to conventional coarse-grained Al alloys. Int. J. Fatigue 2018, 106, 81–91. [Google Scholar] [CrossRef]
- Klein, T.; Reiter, L.; Schnall, M. Wire-arc additive manufacturing of Al-Zn5.5-Mg-Cu (ML7075): Shifting paradigms of additive manufacture-ability. Mater. Lett. 2022, 313, 131841. [Google Scholar] [CrossRef]
- Klein, T.; Schnall, M.; Gomes, B.; Warczok, P.; Fleischhacker, D.; Morais, P.J. Wire-arc additive manufacturing of a novel high-performance Al-Zn-Mg-Cu alloy: Processing, characterization and feasibility demonstration. Addit. Manuf. 2021, 37, 101663. [Google Scholar] [CrossRef]
- Kairy, S.K.; Turk, S.; Birbilis, N.; Shekhter, A. The role of microstructure and microchemistry on intergranular corrosion of aluminium alloy AA7085-T7452. Corros. Sci. 2018, 143, 414–427. [Google Scholar] [CrossRef]
- Wawer, K.; Lewandowska, M.; Kurzydłowski, K.J. Improvement of mechanical properties of a nanoaluminium alloy by precipitate strengthening. Arch. Met. Mater. 2012, 57, 877–881. [Google Scholar] [CrossRef] [Green Version]
- Valiev, R.Z.; Islamgaliev, R.K.; Alexandrov, I. Bulk nanostructured materials from severe plastic deformation. Prog. Mater. Sci. 2000, 45, 103–189. [Google Scholar] [CrossRef]
- Sabbaghianrad, S.; Langdon, T.G. A critical evaluation of the processing of an aluminum 7075 alloy using a combination of ECAP and HPT. Mater. Sci. Eng. A 2014, 596, 52–58. [Google Scholar] [CrossRef]
- Darban, H.; Mohammadi, B.; Djavanroodi, F. Effect of equal channel angular pressing on fracture toughness of Al-7075. Eng. Fail. Anal. 2016, 65, 1–10. [Google Scholar] [CrossRef]
- Murashkin, M.Y.; Sabirov, I.; Sauvage, X.; Valiev, R.Z. Nanostructured Al and Cu alloys with superior strength and electrical conductivity. J. Mater. Sci. 2016, 51, 33–49. [Google Scholar] [CrossRef]
- Ralston, K.D.; Birbilis, N. Effect of Grain Size on Corrosion: A Review. Corrosion 2010, 66, 075005-13. [Google Scholar] [CrossRef]
- Ralston, K.D.; Fabijanic, D.; Birbilis, N. Effect of grain size on corrosion of high purity aluminium. Electrochim. Acta 2011, 56, 1729–1736. [Google Scholar] [CrossRef]
- Orłowska, M.; Ura-Bińczyk, E.; Olejnik, L.; Lewandowska, M. The effect of grain size and grain boundary misorientation on the corrosion resistance of commercially pure aluminium. Corros. Sci. 2019, 148, 57–70. [Google Scholar] [CrossRef]
- Aida, T.; Matsuki, K.; Horita, Z.; Langdon, T.G. Estimating the equivalent strain in equal-channel angular pressing. Scr. Mater. 2001, 44, 575–579. [Google Scholar] [CrossRef]
- Lewandowska, M.; Kurzydlowski, K.J. Recent development in grain refinement by hydrostatic extrusion. J. Mater. Sci. 2008, 43, 7299–7306. [Google Scholar] [CrossRef]
- Topolski, K.; Pachla, W.; Garbacz, H. Progress in hydrostatic extrusion of titanium. J. Mater. Sci. 2013, 48, 4543–4548. [Google Scholar] [CrossRef] [Green Version]
- Przybysz, S.; Kulczyk, M.; Pachla, W.; Skiba, J.; Wróblewska, M.; Mizera, J.; Moszczynska, D. Anisotropy of mechanical and structural properties in aa 6060 aluminum alloy following hydrostatic extrusion process. Bull. Pol. Acad. Sci. Tech. Sci. 2019, 67, 709–717. [Google Scholar] [CrossRef]
- Lewandowska, M.; Wawer, K.; Kozikowski, P.; Ohnuma, M.; Kurzydlowski, K.J. Precipitation in a Nanograined 7475 Aluminium Alloy-Processing, Properties and Nanoanalysis. Adv. Eng. Mater. 2014, 16, 482–485. [Google Scholar] [CrossRef]
- Ura-Bińczyk, E. Improvement of Pitting-Corrosion Resistance of Ultrafine-Grained 7475 Al Alloy by Aging. Materials 2022, 15, 360. [Google Scholar] [CrossRef]
- Orłowska, M.; Ura-Bińczyk, E.; Śnieżek, L.; Skudniewski, P.; Kulczyk, M.; Adamczyk-Cieślak, B.; Majchrowicz, K. The Influence of Heat Treatment on the Mechanical Properties and Corrosion Resistance of the Ultrafine-Grained AA7075 Obtained by Hydrostatic Extrusion. Materials 2022, 15, 4343. [Google Scholar] [CrossRef]
- Brynk, T.; Molak, R.M.; Janiszewska, M.; Pakiela, Z. Digital Image Correlation measurements as a tool of composites deformation description. Comput. Mater. Sci. 2012, 64, 157–161. [Google Scholar] [CrossRef]
- Molak, R.M.; Paradowski, K.; Brynk, T.; Ciupinski, L.; Pakiela, Z.; Kurzydlowski, K.J. Measurement of mechanical properties in a 316L stainless steel welded joint. Int. J. Press. Vessel. Pip. 2009, 86, 43–47. [Google Scholar] [CrossRef]
- Birbilis, N.; Buchheit, R.G. Electrochemical Characteristics of Intermetallic Phases in Aluminum Alloys. J. Electrochem. Soc. 2005, 152, B140–B151. [Google Scholar] [CrossRef] [Green Version]
- Li, G.; Liang, Y.; Chen, F.; Han, Y.; Sun, L. Evolution of Microstructure and Mechanical Properties in a Single-Stage Aged 7075 Aluminum Alloy Pulse Variable Polarity Plasma Arc Welded Joint. Metals 2019, 9, 428. [Google Scholar] [CrossRef] [Green Version]
- Liu, W.; Man, Q.; Li, J.; Liu, L.; Zhang, W.; Wang, Z.; Pan, H. Microstructural evolution and vibration fatigue properties of 7075-T651 aluminum alloy treated by nitrogen ion implantation. Vacuum 2022, 199, 110931. [Google Scholar] [CrossRef]
- Sun, Q.; Yang, M.; Jiang, Y.; Lei, L.; Zhang, Y. Achieving excellent corrosion resistance properties of 7075 Al alloy via ultrasonic surface rolling treatment. J. Alloys Compd. 2022, 911, 165009. [Google Scholar] [CrossRef]
- Huo, W.; Sun, T.; Hou, L.; Zhang, W.; Zhang, Y.; Zhang, J. Effect of heating rate during solution treatment on microstructure, mechanical property and corrosion resistance of high-strength AA 7075 alloy. Mater. Charact. 2020, 167, 110535. [Google Scholar] [CrossRef]
- Xu, Y.; Zhuang, X.; Zhang, W.; Li, Q.; Zhao, Z. Mechanical behaviors and microstructure characteristics of W-tempered and peak-aged 7075 alloy sheets under low frequency vibration–assisted tension. Mater. Sci. Eng. A 2022, 833, 142338. [Google Scholar] [CrossRef]
- Du, Z.; Deng, Z.; Xiao, A.; Cui, X.; Yu, H.; Feng, Z. Effect of the aging process on the micro-structure & properties of 7075 aluminum alloy using electromagnetic bulging. J. Manuf. Process. 2021, 70, 15–23. [Google Scholar] [CrossRef]
- Ma, J.; Wang, Q.; Zhang, T.; Cao, H.; Yang, Y.; Zhang, Z. Effect of natural aging time on tensile and fatigue anisotropy of extruded 7075 Al alloy. J. Mater. Res. Technol. 2022, 18, 4683–4697. [Google Scholar] [CrossRef]
- Brunner, J.G.; May, J.; Höppel, H.W.; Göken, M.; Virtanen, S. Localized corrosion of ultrafine-grained Al–Mg model alloys. Electrochim. Acta 2010, 55, 1966–1970. [Google Scholar] [CrossRef]
- Prangnell, P.B.; Bowen, J.R.; Apps, P.J. Ultra-fine grain structures in aluminium alloys by severe deformation processing. Mater. Sci. Eng. A 2004, 375–377, 178–185. [Google Scholar] [CrossRef]
- Lewandowska, M. Mechanism of Grain Refinement in Aluminium in the Process of Hydrostatic Extrusion. Solid State Phenom. 2006, 114, 109–116. [Google Scholar] [CrossRef]
- Hall, E.O. The Deformation and Ageing of Mild Steel: III Discussion of Results. Proc. Phys. Soc. Sect. B 1951, 64, 747–753. [Google Scholar] [CrossRef]
- Petch, N.J. The Cleavage Strength of Polycrystals. J. Iron Steel Inst. 1953, 174, 25–28. [Google Scholar]
- Hansen, N. Hall–Petch relation and boundary strengthening. Scr. Mater. 2004, 51, 801–806. [Google Scholar] [CrossRef]
- Bazarnik, P.; Huang, Y.; Lewandowska, M.; Langdon, T.G. Structural impact on the Hall–Petch relationship in an Al–5Mg alloy processed by high-pressure torsion. Mater. Sci. Eng. A 2015, 626, 9–15. [Google Scholar] [CrossRef] [Green Version]
- Ma, K.; Wen, H.; Hu, T.; Topping, T.D.; Isheim, D.; Seidman, D.N.; Lavernia, E.J.; Schoenung, J.M. Mechanical behavior and strengthening mechanisms in ultrafine grain precipitation-strengthened aluminum alloy. Acta Mater. 2014, 62, 141–155. [Google Scholar] [CrossRef]
- Karaaslan, A.; Kaya, I.; Atapek, H. Effect of aging temperature and of retrogression treatment time on the microstructure and mechanical properties of alloy AA 7075. Met. Sci. Heat Treat. 2007, 49, 443–447. [Google Scholar] [CrossRef]
- Luiggi, N.J.; Valera, V. Kinetic study of an AA7075 alloy under RRA heat treatment. J. Therm. Anal. Calorim. 2017, 130, 1885–1902. [Google Scholar] [CrossRef]
- Özer, G.; Karaaslan, A. Effect of RRA heat treatment on corrosion and mechanical properties of AA7075. Mater. Corros. 2019, 70, 2064–2072. [Google Scholar] [CrossRef]
- Chrominski, W.; Lewandowska, M. Precipitation phenomena in ultrafine grained Al–Mg–Si alloy with heterogeneous microstructure. Acta Mater. 2016, 103, 547–557. [Google Scholar] [CrossRef]
- Song, D.; Ma, A.B.; Jiang, J.H.; Lin, P.H.; Shi, J. Improving corrosion resistance of pure Al through ECAP. Corros. Eng. Sci. Technol. 2011, 46, 505–512. [Google Scholar] [CrossRef]
- Andreatta, F.; Terryn, H.; de Wit, J.H.W. Corrosion behaviour of different tempers of AA7075 aluminium alloy. Electrochim. Acta 2004, 49, 2851–2862. [Google Scholar] [CrossRef]
- Kumar, S.; Kumar, A.; Vanitha, C. Corrosion behaviour of Al 7075/TiC composites processed through friction stir processing. Mater. Today Proc. 2019, 15, 21–29. [Google Scholar] [CrossRef]
- Zhang, C.; Huang, G.; Liu, Q. Research on local corrosion behavior of thermo-mechanically affected zone in dissimilar AA2024/7075 friction stir welds. Intermetallics 2021, 130, 107081. [Google Scholar] [CrossRef]
- Tian, W.; Li, S.; Wang, B.; Liu, J.; Yu, M. Pitting corrosion of naturally aged AA 7075 aluminum alloys with bimodal grain size. Corros. Sci. 2016, 113, 1–16. [Google Scholar] [CrossRef]
- Kumar, P.V.; Reddy, G.M.; Rao, K.S. Microstructure, mechanical and corrosion behavior of high strength AA7075 aluminium alloy friction stir welds–Effect of post weld heat treatment. Def. Technol. 2015, 11, 362–369. [Google Scholar] [CrossRef] [Green Version]
- Buchheit, R.G. A Compilation of Corrosion Potentials Reported for Intermetallic Phases in Aluminum Alloys. J. Electrochem. Soc. 1995, 142, 3994–3996. [Google Scholar] [CrossRef]
- Davenport, A.J.; Yuan, Y.; Ambat, R.; Connolly, B.J.; Strangwood, M.; Afseth, A.; Scamans, G.M. Intergranular Corrosion and Stress Corrosion Cracking of Sensitised AA5182. Mater. Sci. Forum 2006, 519–521, 641–646. [Google Scholar] [CrossRef]
- Cao, C.; Zhang, D.; Wang, X.; Ma, Q.; Zhuang, L.; Zhang, J. Effects of Cu addition on the precipitation hardening response and intergranular corrosion of Al-5.2Mg-2.0Zn (wt.%) alloy. Mater. Charact. 2016, 122, 177–182. [Google Scholar] [CrossRef]
- Sabelkin, V.; Perel, V.Y.; Misak, H.E.; Hunt, E.M.; Mall, S. Investigation into crack initiation from corrosion pit in 7075-T6 under ambient laboratory and saltwater environments. Eng. Fract. Mech. 2015, 134, 111–123. [Google Scholar] [CrossRef]


| Element | Zn | Mg | Cu | Cr | Ti | Si | Fe | Mn | Al |
|---|---|---|---|---|---|---|---|---|---|
| Content (wt. %) | 5.70 | 2.40 | 1.50 | 0.19 | 0.04 | 0.09 | 0.23 | 0.06 | balanced |
| Naturally Aged/180 Days | 100 °C/24 h | 120 °C/24 h (T6) | RRA 120 °C/24 h + 200 °C/40 min + 120 °C/24 h | RRA 120 °C/24 h + 240 °C/40 min + 120 °C/24 h | |
|---|---|---|---|---|---|
| ϕ10 CG | - | - | CG T6 | - | - |
| ϕ10 UFG | HE10 | HE10 HT1 | HE10 HT2 | HE10 RRA1 | HE10 RRA2 |
| ϕ8 UFG | HE8 | HE8 HT1 | HE8 HT2 | - | - |
| Sample | YS [MPa] | UTS [MPa] | Eb [%] |
|---|---|---|---|
| CG T6 | 463 ± 4 | 539 ± 3 | 16.9 ± 1.4 |
| HE10 | 582 ± 2 | 674 ± 2 | 11.0 ± 0.2 |
| HE10 HT1 | 603 ± 11 | 652 ± 8 | 8.8 ± 0.5 |
| HE10 HT2 | 608 ± 22 | 639 ± 19 | 9.3 ± 0.2 |
| HE8 | 552 ± 33 | 608 ± 53 | 4.7 ± 2.8 |
| HE8 HT1 | 588 ± 24 | 625 ± 18 | 7.5 ± 1.9 |
| HE8 HT2 | 563 ± 16 | 590 ± 11 | 5.4 ± 1.1 |
| Sample | Ecorr [mV] | icorr [µA/cm2] | Environment | Ref. |
|---|---|---|---|---|
| CG T6 | −585 | 1.5 | Present study | |
| HE10 | −612 | 1.0 | ||
| HE10 HT1 | −597 | 1.2 | ||
| HE10 HT2 | −590 | 0.9 | 0.1 M NaCl | |
| HE8 | −654 | 0.7 | ||
| HE8 HT1 | −630 | 0.6 | ||
| HE8 HT2 | −618 | 0.6 | ||
| AA7075 with different tempers | −800 to −770 | - | 3.5% NaCl | [44] |
| AA7075 | −815 | 4.01 | 3.5% NaCl | [45] |
| −853 | 4.3 | 1 M NaCl | ||
| −945 | 6.76 | 2 M NaCl | ||
| −1038 | 9.58 | 3 M NaCl | ||
| AA7075 CG | −1165 | 76.2 | 3.5% NaCl | [26] |
| AA7075 after rolling | −1162 to −1088 | 5.4 to 55.9 | ||
| AA7075 | −704 | 71.5 | 3.5% NaCl | [46] |
| AA7075 | −553 to −497 | 0.1 to o.5 | 0.001 M NaCl | [47] |
| AA7075 welds | −1350 to −750 | - | 3.5% NaCl | [48] |
Publisher’s Note: MDPI stays neutral with regard to jurisdictional claims in published maps and institutional affiliations. |
© 2022 by the authors. Licensee MDPI, Basel, Switzerland. This article is an open access article distributed under the terms and conditions of the Creative Commons Attribution (CC BY) license (https://creativecommons.org/licenses/by/4.0/).
Share and Cite
Orłowska, M.; Ura-Bińczyk, E.; Śnieżek, L.; Skudniewski, P.; Kulczyk, M.; Adamczyk-Cieślak, B.; Mizera, J. Increasing the Mechanical Strength and Corrosion Resistance of Aluminum Alloy 7075 via Hydrostatic Extrusion and Aging. Materials 2022, 15, 4577. https://doi.org/10.3390/ma15134577
Orłowska M, Ura-Bińczyk E, Śnieżek L, Skudniewski P, Kulczyk M, Adamczyk-Cieślak B, Mizera J. Increasing the Mechanical Strength and Corrosion Resistance of Aluminum Alloy 7075 via Hydrostatic Extrusion and Aging. Materials. 2022; 15(13):4577. https://doi.org/10.3390/ma15134577
Chicago/Turabian StyleOrłowska, Marta, Ewa Ura-Bińczyk, Lucjan Śnieżek, Paweł Skudniewski, Mariusz Kulczyk, Bogusława Adamczyk-Cieślak, and Jarosław Mizera. 2022. "Increasing the Mechanical Strength and Corrosion Resistance of Aluminum Alloy 7075 via Hydrostatic Extrusion and Aging" Materials 15, no. 13: 4577. https://doi.org/10.3390/ma15134577
APA StyleOrłowska, M., Ura-Bińczyk, E., Śnieżek, L., Skudniewski, P., Kulczyk, M., Adamczyk-Cieślak, B., & Mizera, J. (2022). Increasing the Mechanical Strength and Corrosion Resistance of Aluminum Alloy 7075 via Hydrostatic Extrusion and Aging. Materials, 15(13), 4577. https://doi.org/10.3390/ma15134577