
Photocatalytic Hydrogen Evolution from Artificial Seawater Splitting over Amorphous Carbon Nitride: Optimization and Process Parameters Study via Response Surface Modeling


Abstract
:1. Introduction
2. Materials and Methods
2.1. Materials
2.2. Photocatalysts Synthesis
2.3. Samples Characterisation
2.4. Electrochemical Measurements
2.5. Preparation of Artificial Seawater and Photocatalytic H2 Evolution Measurements
2.6. Experimental Design and Analytical Methods
3. Results and Discussion
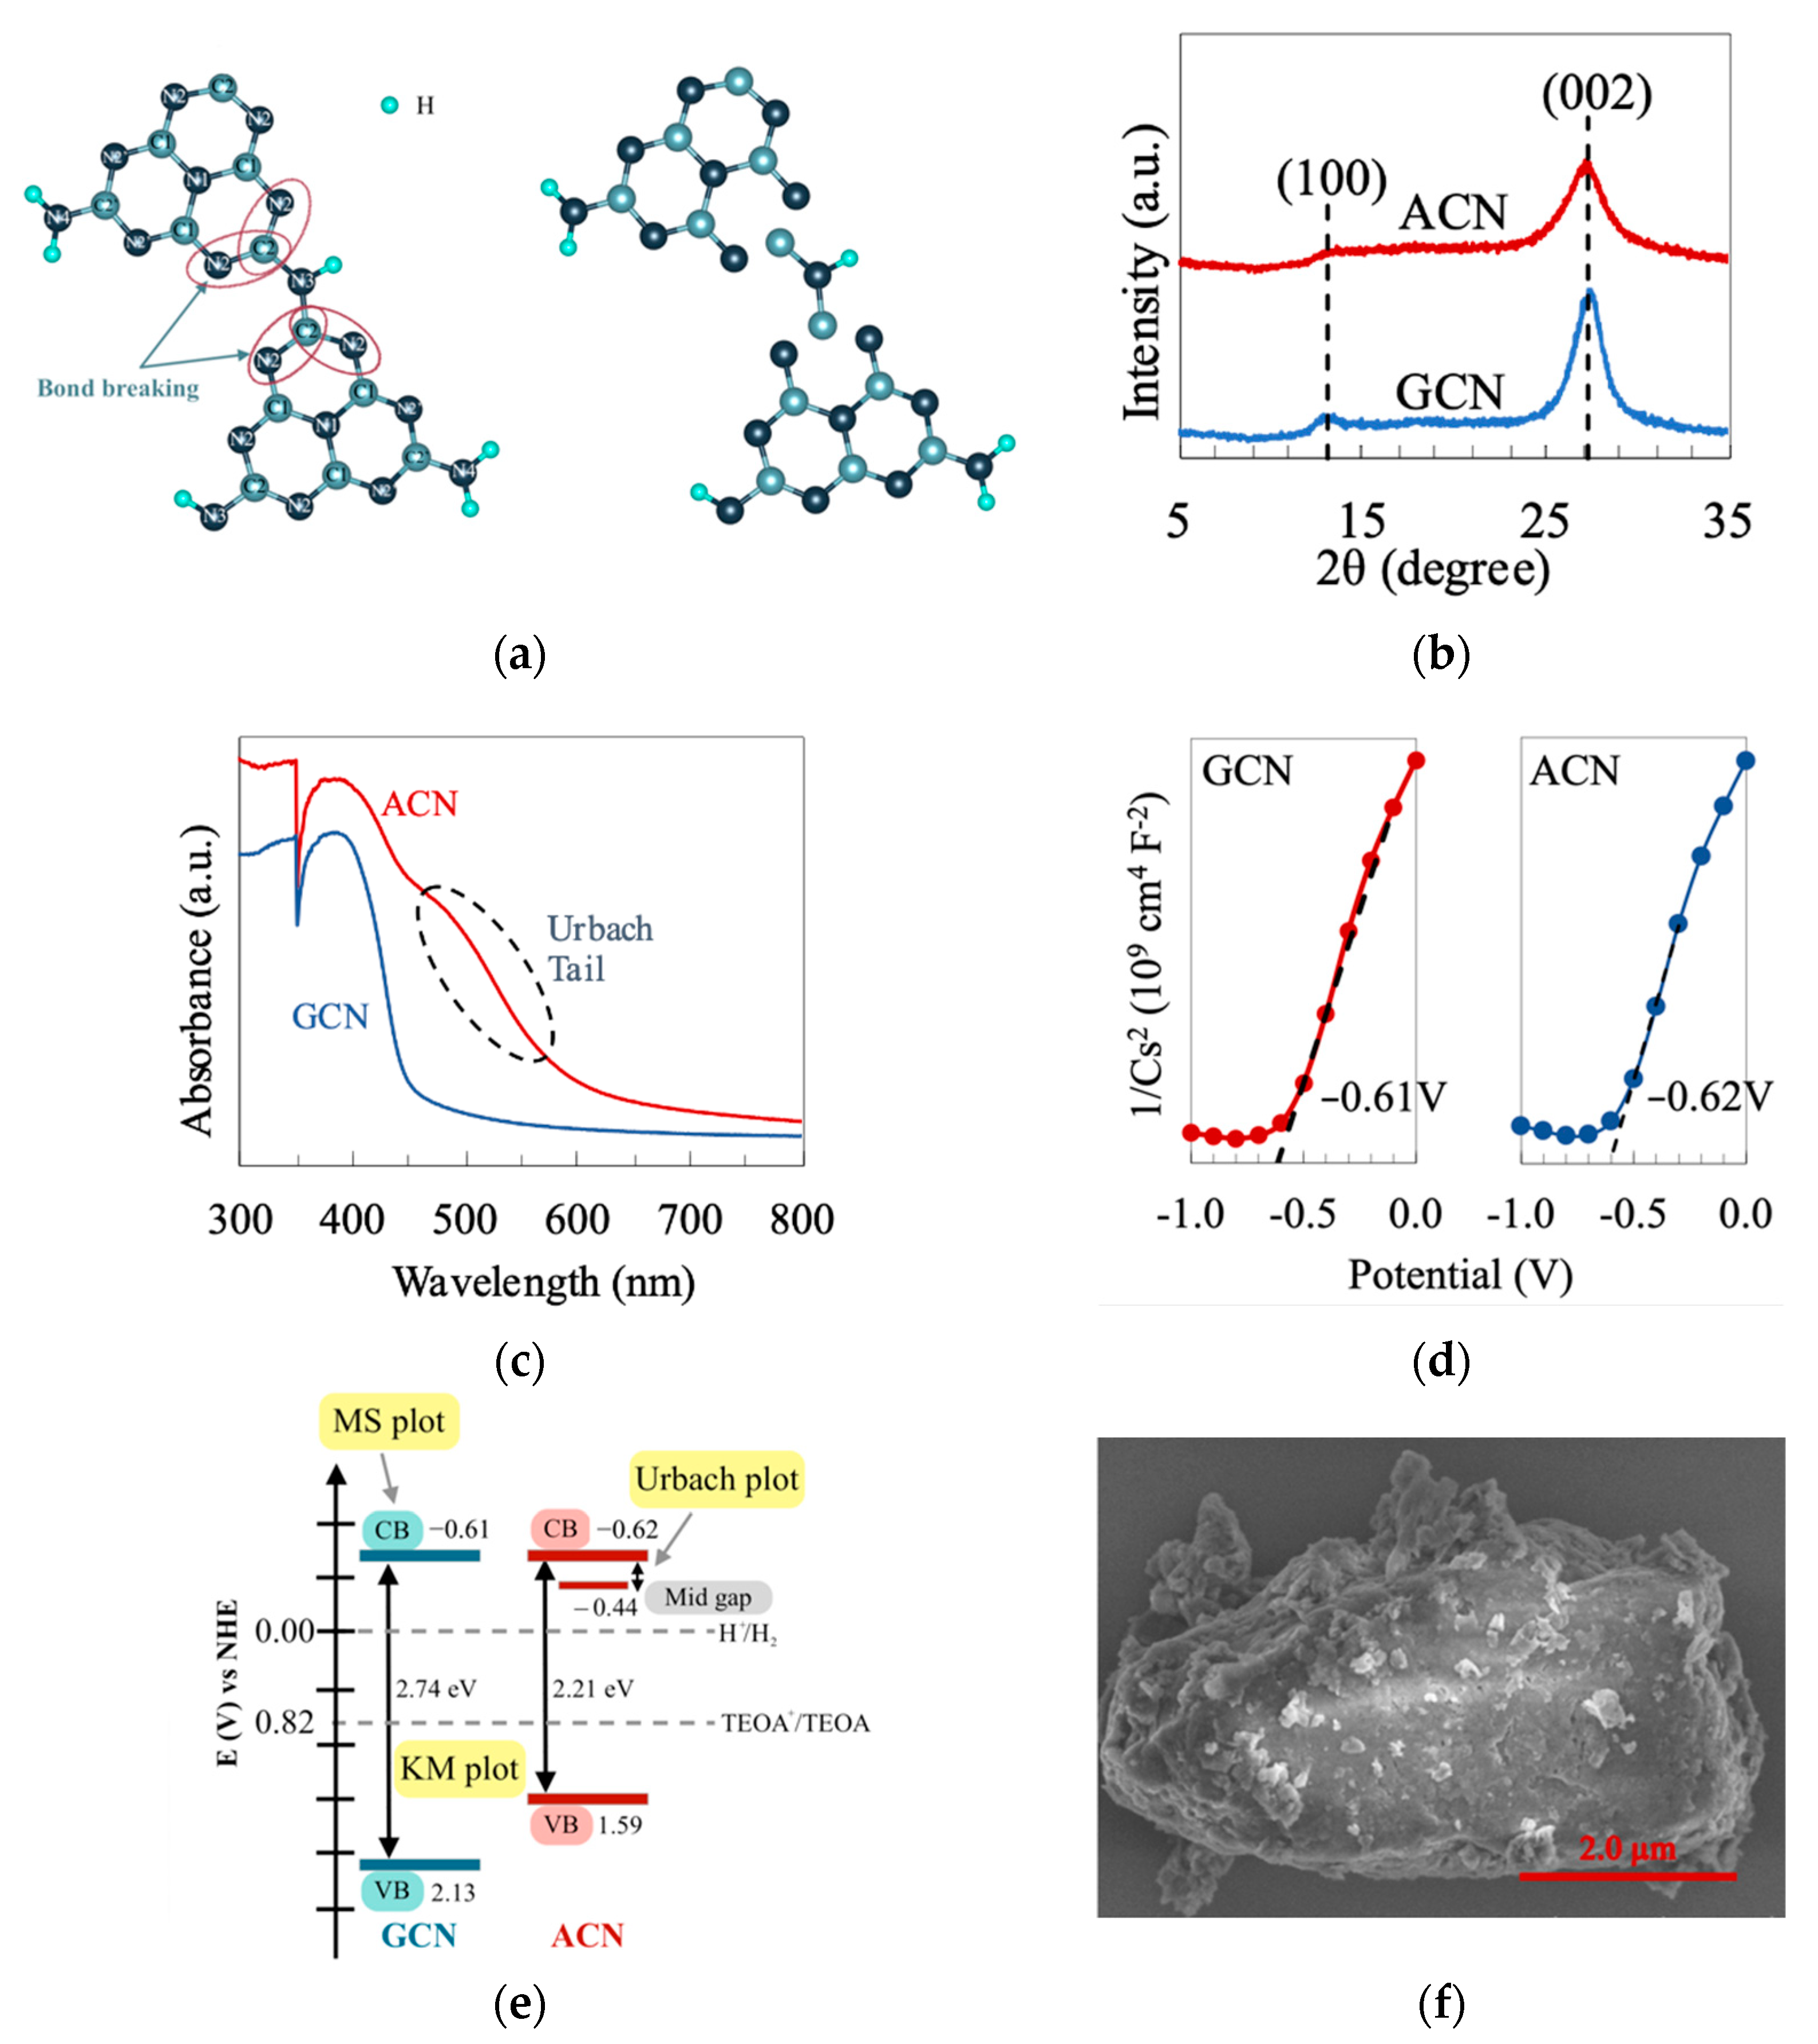
3.1. Structural and Optical Properties of Amorphous Carbon Nitride
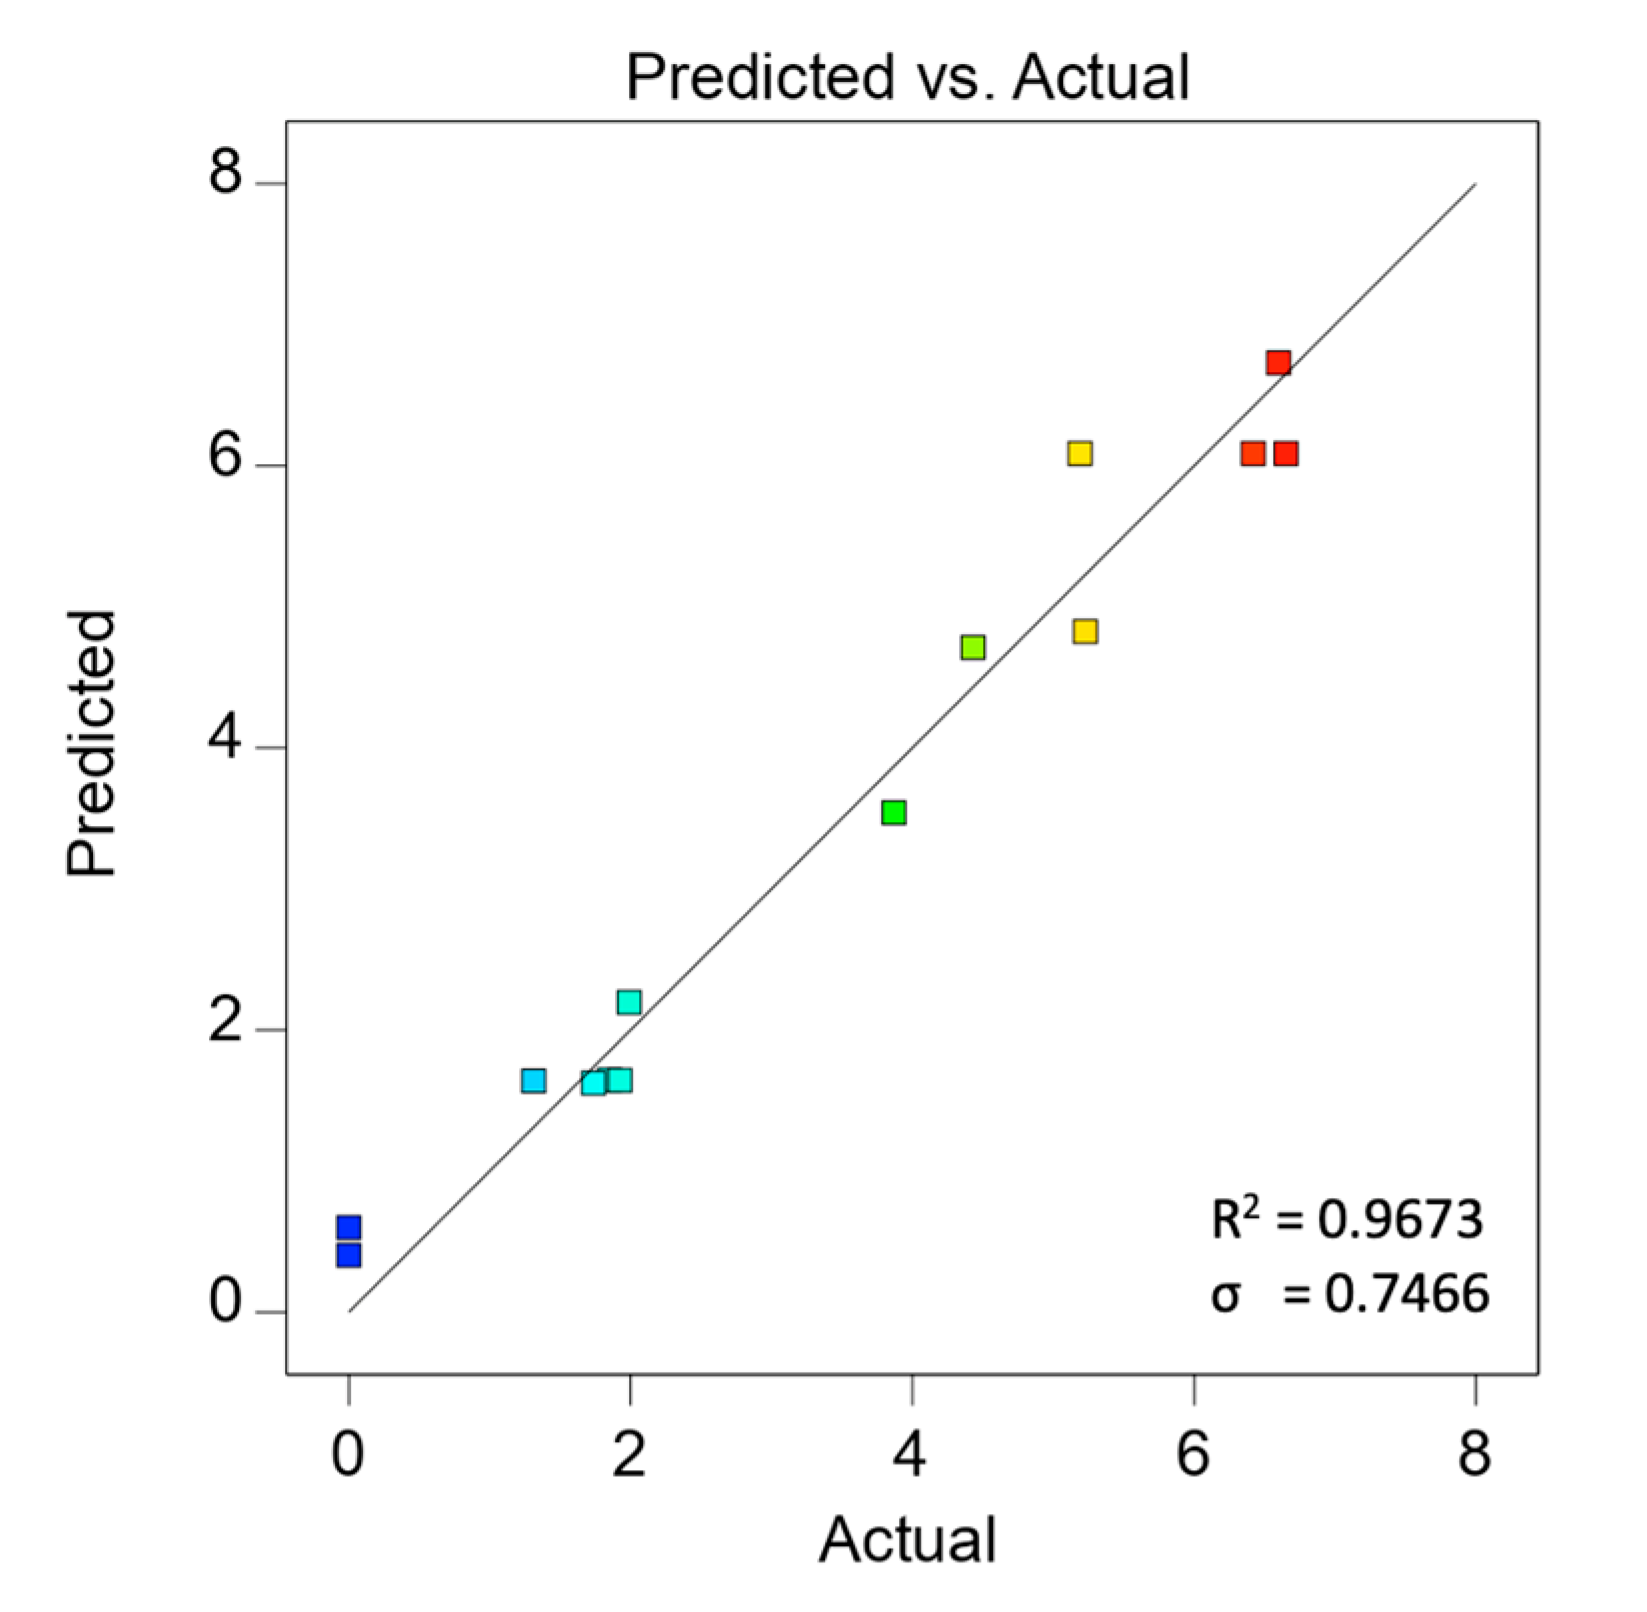
3.2. Modeling Fitting and Validation
3.3. Terms in Model Equation
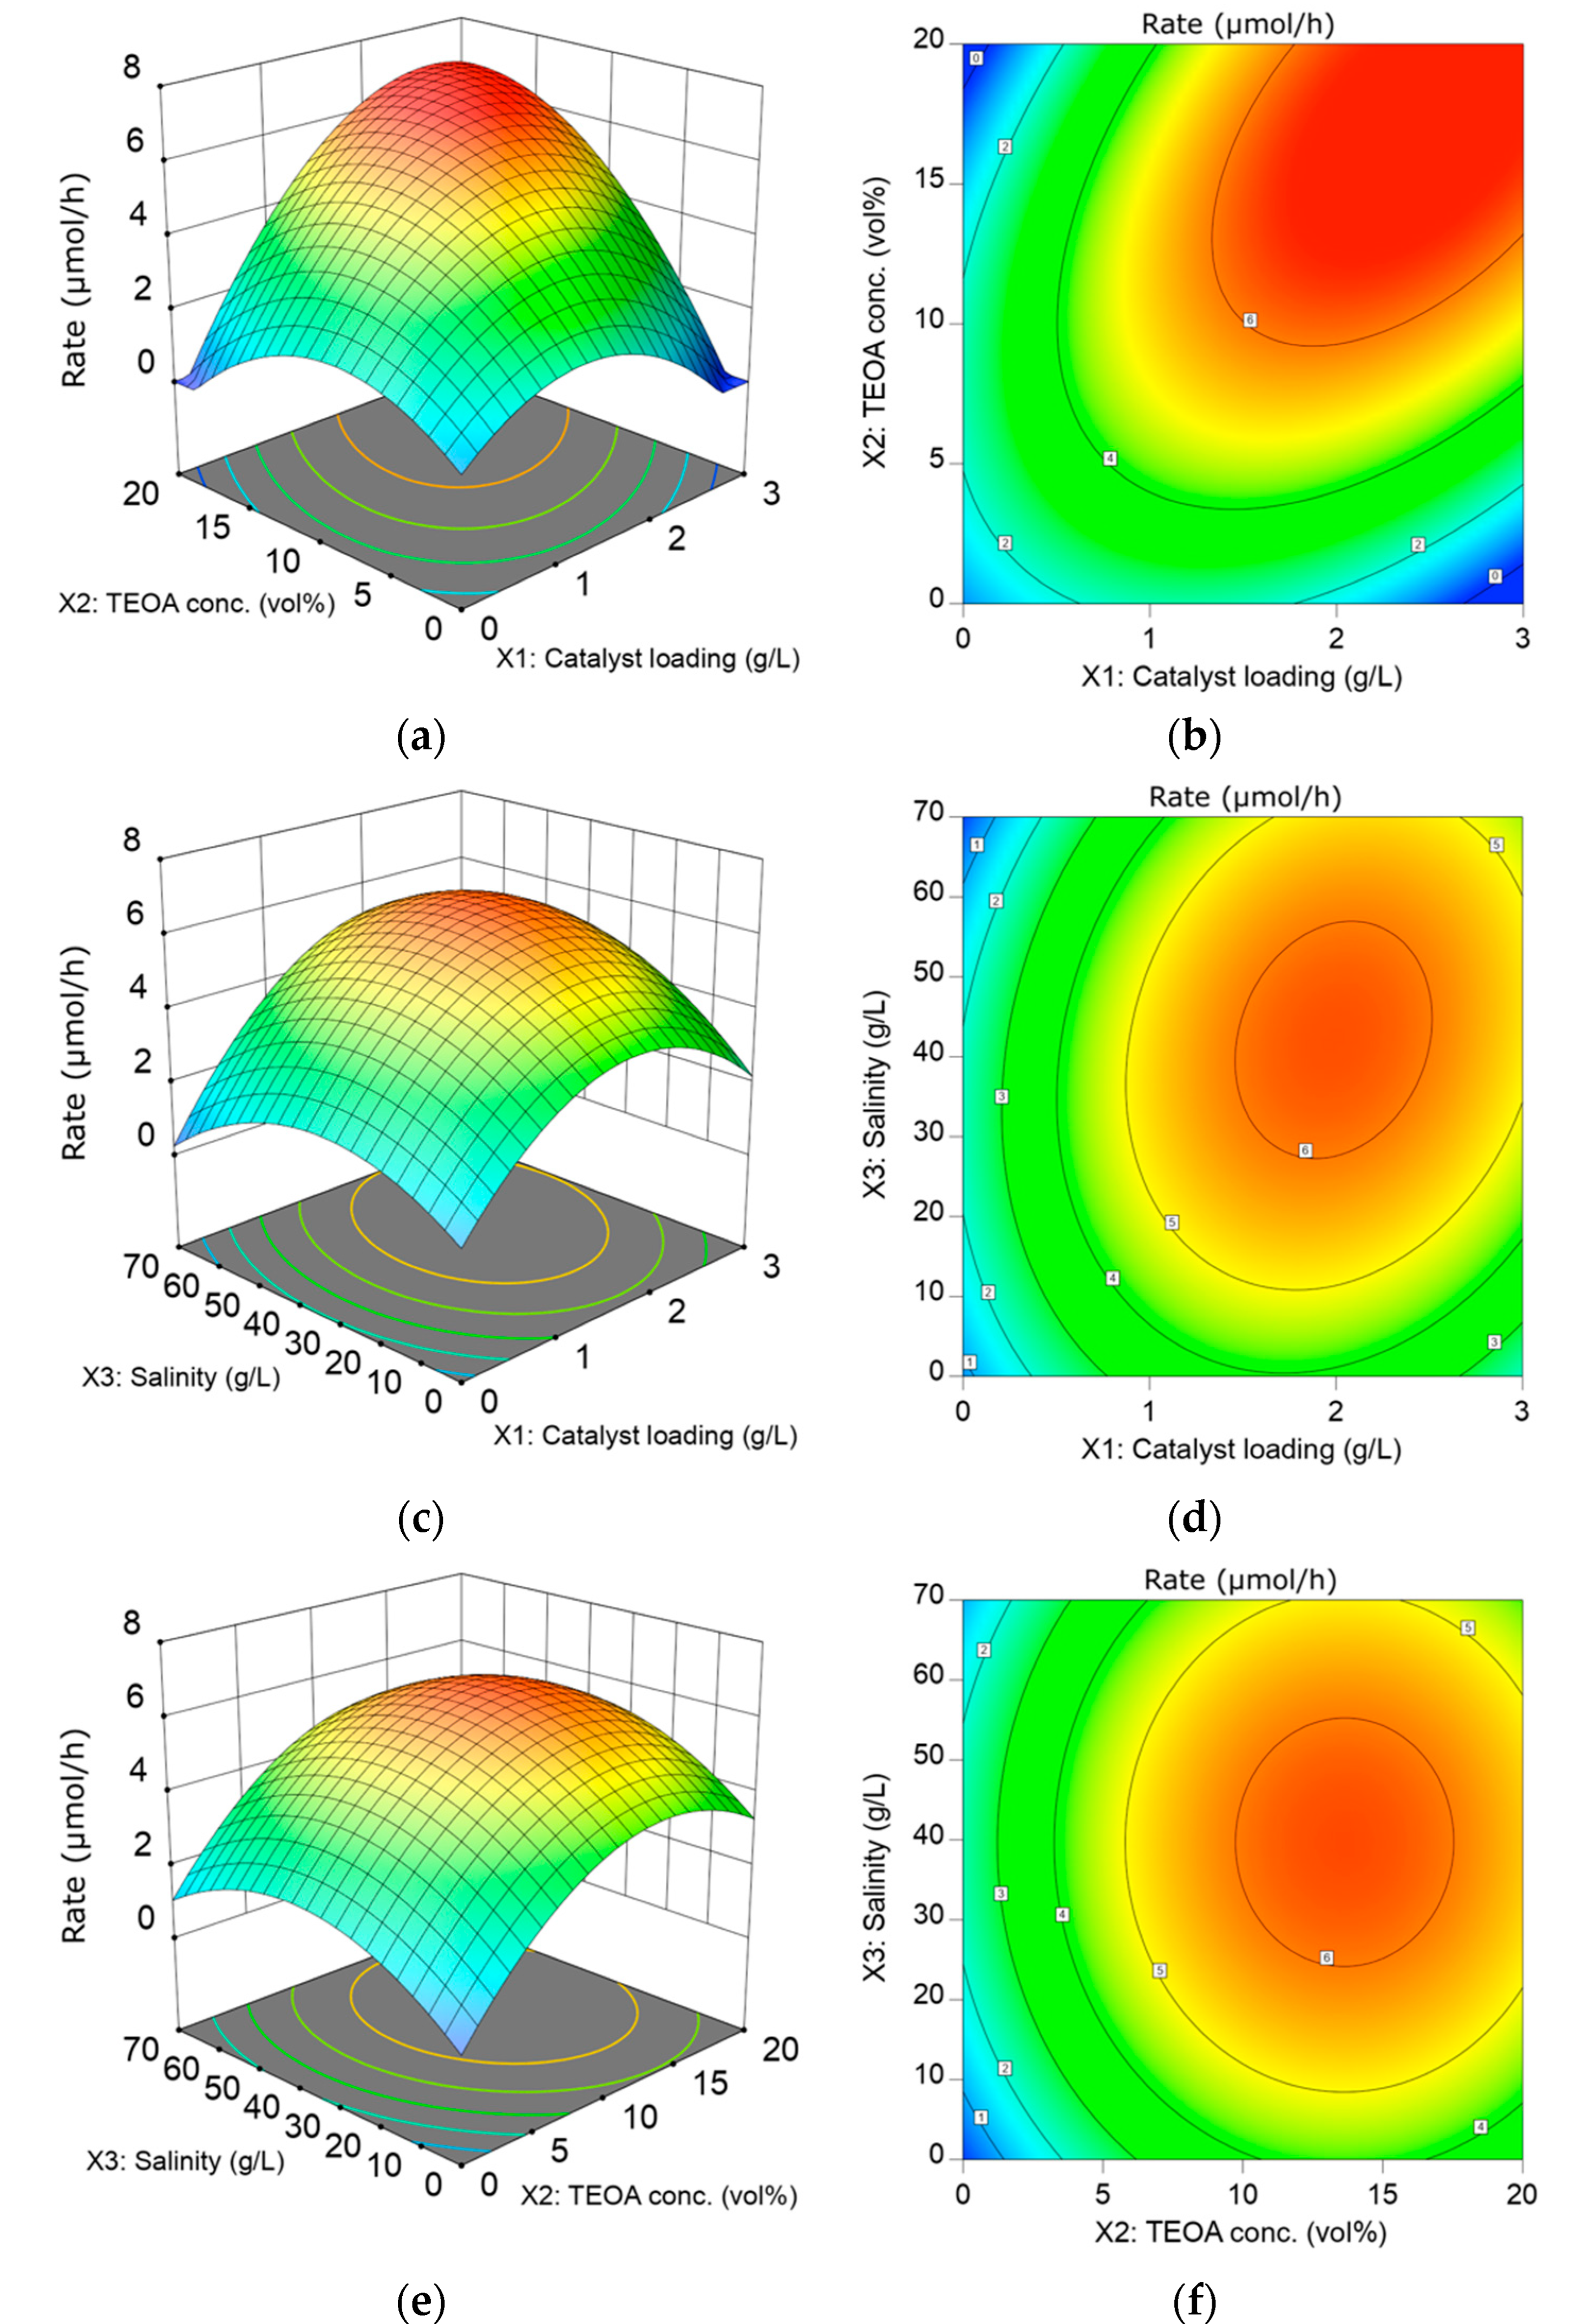
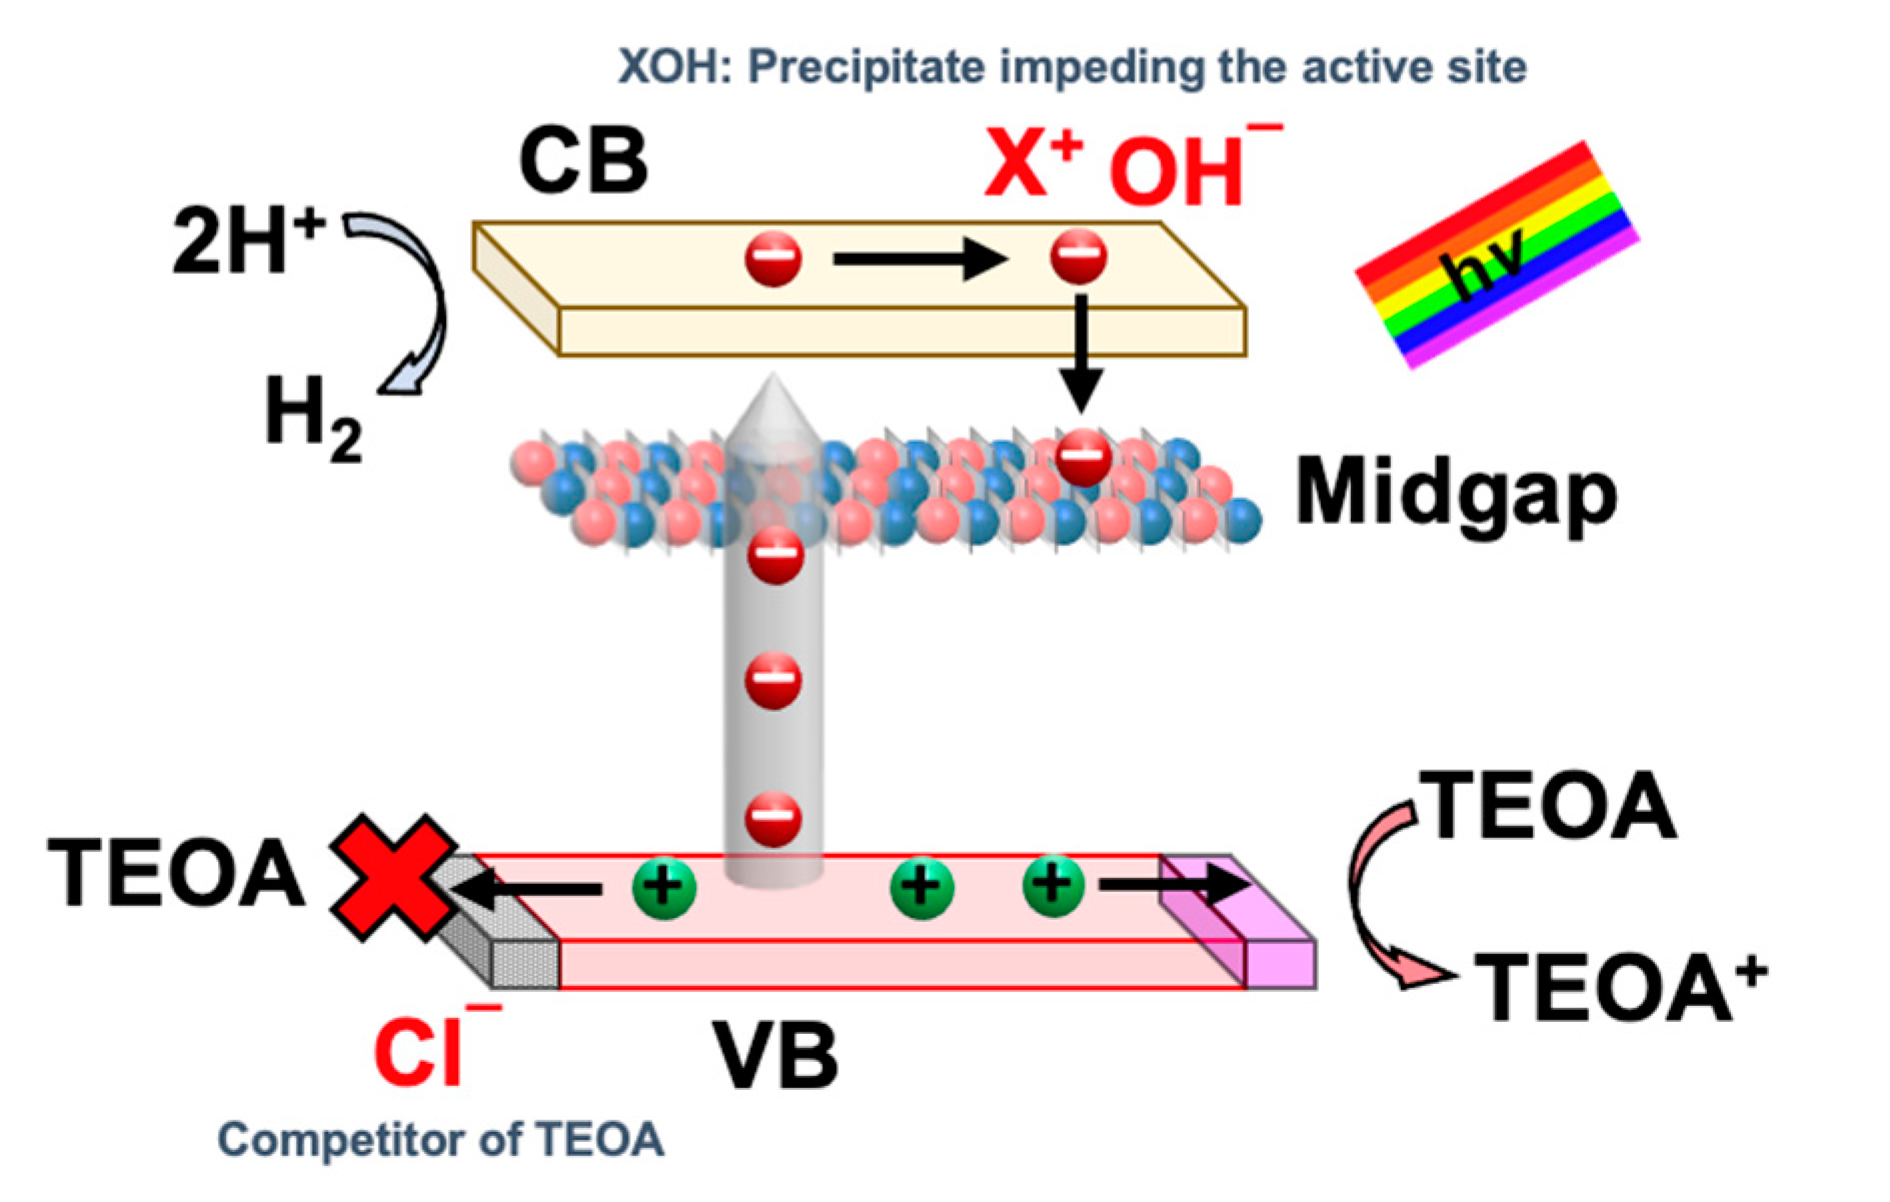
3.4. Effect of Factors towards HER from Seawater Splitting
3.5. Optimization and the Stability of ACN in HER from Seawater Splitting
4. Conclusions
Supplementary Materials
Author Contributions
Funding
Institutional Review Board Statement
Informed Consent Statement
Data Availability Statement
Conflicts of Interest
References
- Møller, K.T.; Jensen, T.R.; Akiba, E.; Li, H. Hydrogen—A Sustainable Energy Carrier. Prog. Nat. Sci. Mater. Int. 2017, 27, 34–40. [Google Scholar] [CrossRef]
- Yang, S.; Gong, Y.; Zhang, J.; Zhan, L.; Ma, L.; Fang, Z.; Vajtai, R.; Wang, X.; Ajayan, P.M. Exfoliated Graphitic Carbon Nitride Nanosheets as Efficient Catalysts for Hydrogen Evolution Under Visible Light. Adv. Mater. 2013, 25, 2452–2456. [Google Scholar] [CrossRef] [PubMed]
- Sprick, R.S.; Bonillo, B.; Clowes, R.; Guiglion, P.; Brownbill, N.J.; Slater, B.J.; Blanc, F.; Zwijnenburg, M.A.; Adams, D.J.; Cooper, A.I. Visible-Light-Driven Hydrogen Evolution Using Planarized Conjugated Polymer Photocatalysts. Angew. Chem. Int. Ed. 2016, 55, 1792–1796. [Google Scholar] [CrossRef] [Green Version]
- Mohamed, H.H. Chapter 5—Green Processes and Sustainable Materials for Renewable Energy Production via Water Splitting. In Sustainable Materials and Green Processing for Energy Conversion; Cheong, K.Y., Apblett, A., Eds.; Elsevier: Amsterdam, The Netherlands, 2022; pp. 169–212. ISBN 978-0-12-822838-8. [Google Scholar]
- Zhang, Y.; Wang, Y.; Di, M.; Zhou, B.; Xu, W.; Wu, N.; Wu, Y.; Du, Y.; Zhong, W. Synergy of Dopants and Defects in Ultrathin 2D Carbon Nitride Sheets to Significantly Boost the Photocatalytic Hydrogen Evolution. Chem. Eng. J. 2020, 385, 123938. [Google Scholar] [CrossRef]
- Wang, Y.; Wang, H.; Chen, F.; Cao, F.; Zhao, X.; Meng, S.; Cui, Y. Facile Synthesis of Oxygen Doped Carbon Nitride Hollow Microsphere for Photocatalysis. Appl. Catal. B 2017, 206, 417–425. [Google Scholar] [CrossRef]
- Ng, B.-J.; Putri, L.K.; Kong, X.Y.; Pasbakhsh, P.; Chai, S.-P. Overall Pure Water Splitting Using One-Dimensional P-Doped Twinned Zn0.5Cd0.5S1−x Nanorods via Synergetic Combination of Long-Range Ordered Homojunctions and Interstitial S Vacancies with Prolonged Carrier Lifetime. Appl. Catal. B 2020, 262, 118309. [Google Scholar] [CrossRef]
- Chew, Y.-H.; Tang, J.-Y.; Tan, L.-J.; Choi, B.W.J.; Tan, L.-L.; Chai, S.-P. Engineering Surface Oxygen Defects on Tungsten Oxide to Boost Photocatalytic Oxygen Evolution from Water Splitting. Chem. Commun. 2019, 55, 6265–6268. [Google Scholar] [CrossRef]
- Chew, Y.-H.; Ng, B.-J.; Kong, X.Y.; Putri, L.K.; Tang, J.-Y.; Tan, L.-L.; Chai, S.-P. Interfacial Engineering of a Zinc Blende/Wurtzite Homojunction Photocatalyst through Hybridization with a Cobalt Phosphide Co-Catalyst for Enhanced Visible-Light-Driven Photocatalytic H2 Evolution. Sustain. Energy Fuels 2020, 4, 1822–1827. [Google Scholar] [CrossRef]
- Chew, Y.-H.; Ng, B.-J.; Tang, J.-Y.; Tan, L.-L.; Chai, S.-P. A Synergistic Combination of P-Doped Zn0.5Cd0.5S and CoP for Dual-Stage Electron Trapping and Its Application in Seawater Splitting. Sol. RRL 2021, 2100016, 1–9. [Google Scholar] [CrossRef]
- Fiorenza, R.; Balsamo, S.A.; Condorelli, M.; D’Urso, L.; Compagnini, G.; Scirè, S. Solar Photocatalytic H2 Production over CeO2-Based Catalysts: Influence of Chemical and Structural Modifications. Catal. Today 2021, 380, 187–198. [Google Scholar] [CrossRef]
- Ng, K.H.; Lai, S.Y.; Cheng, C.K.; Cheng, Y.W.; Chong, C.C. Photocatalytic Water Splitting for Solving Energy Crisis: Myth, Fact or Busted? Chem. Eng. J. 2021, 417, 128847. [Google Scholar] [CrossRef]
- Gleick, P.H. Pacific Institute for Studies in Development, Environment, and Security Stockholm Environment Institute. In Water in Crisis: A Guide to the World’s Fresh Water Resources; Oxford University Press: New York, NY, USA; Oxford, UK, 1993; ISBN1 0-19-507627-3. ISBN2 0-19-507628-1. [Google Scholar]
- Li, D.; Liu, S. Seawater Quality Detection. In Water Quality Monitoring and Management; Li, D., Liu, S., Eds.; Academic Press: Cambridge, MA, USA, 2019; pp. 233–249. ISBN 978-0-12-811330-1. [Google Scholar]
- Gao, M.; Connor, P.K.N.; Ho, G.W. Plasmonic Photothermic Directed Broadband Sunlight Harnessing for Seawater Catalysis and Desalination. Energy Environ. Sci. 2016, 9, 3151–3160. [Google Scholar] [CrossRef] [Green Version]
- Li, Y.; He, F.; Peng, S.; Gao, D.; Lu, G.; Li, S. Effects of Electrolyte NaCl on Photocatalytic Hydrogen Evolution in the Presence of Electron Donors over Pt/TiO2. J. Mol. Catal. A Chem. 2011, 341, 71–76. [Google Scholar] [CrossRef]
- Fukuzumi, S.; Lee, Y.M.; Nam, W. Fuel Production from Seawater and Fuel Cells Using Seawater. ChemSusChem 2017, 10, 4264–4276. [Google Scholar] [CrossRef] [PubMed] [Green Version]
- Yang, T.-C.; Chang, F.-C.; Wang, H.P.; Wei, Y.-L.; Jou, C.-J. Photocatalytic Splitting of Seawater Effected by (Ni-ZnO)@C Nanoreactors. Mar. Pollut. Bull. 2014, 85, 696–699. [Google Scholar] [CrossRef] [PubMed]
- Simamora, A.-J.; Hsiung, T.-L.; Chang, F.-C.; Yang, T.-C.; Liao, C.-Y.; Wang, H.P. Photocatalytic Splitting of Seawater and Degradation of Methylene Blue on CuO/Nano TiO2. Int. J. Hydrogen Energy 2012, 37, 13855–13858. [Google Scholar] [CrossRef]
- Yang, X.; Hu, Z.; Yin, Q.; Shu, C.; Jiang, X.-F.; Zhang, J.; Wang, X.; Jiang, J.-X.; Huang, F.; Cao, Y. Water-Soluble Conjugated Molecule for Solar-Driven Hydrogen Evolution from Salt Water. Adv. Funct. Mater. 2019, 29, 1–9. [Google Scholar] [CrossRef]
- Zhu, C.; Liu, C.; Fu, Y.; Gao, J.; Huang, H.; Liu, Y.; Kang, Z. Construction of CDs/CdS Photocatalysts for Stable and Efficient Hydrogen Production in Water and Seawater. Appl. Catal. B 2019, 242, 178–185. [Google Scholar] [CrossRef]
- Ng, B.-J.; Musyaffa, M.K.; Er, C.-C.; Packiam, K.A.R.; Lee, W.P.C.; Tan, L.-L.; Lee, H.W.; Ooi, C.W.; Chai, S.-P. Proton-Functionalized Graphitic Carbon Nitride for Efficient Metal-Free Destruction of Escherichia Coli under Low-Power Light Irradiation. Chem. Eur. J. 2021, 27, 3085–3090. [Google Scholar] [CrossRef] [PubMed]
- Putri, L.K.; Ng, B.-J.; Ong, W.-J.; Lee, H.W.; Chang, W.S.; Chai, S.-P. Engineering Nanoscale P-n Junction: Via the Synergetic Dual-Doping of p-Type Boron-Doped Graphene Hybridized with n-Type Oxygen-Doped Carbon Nitride for Enhanced Photocatalytic Hydrogen Evolution. J. Mater. Chem. A 2018, 6, 3181–3194. [Google Scholar] [CrossRef]
- Chee, M.K.T.; Er, C.-C.; Tang, J.-Y.; Tan, L.-L.; Chang, W.S.; Chai, S.-P. Tuning the Electronic Band Structure of Graphitic Carbon Nitride by Breaking Intramolecular Bonds: A Simple and Effective Approach for Enhanced Photocatalytic Hydrogen Production. Appl. Surf. Sci 2020, 529, 146600. [Google Scholar] [CrossRef]
- Putri, L.K.; Ng, B.-J.; Er, C.-C.; Ong, W.-J.; Chang, W.S.; Mohamed, A.R.; Chai, S.-P. Insights on the Impact of Doping Levels in Oxygen-Doped GC3N4 and Its Effects on Photocatalytic Activity. Appl. Surf. Sci 2020, 504, 144427. [Google Scholar] [CrossRef]
- Scherrer, P.; Debye, P. Determination of the Size and Internal Structure of Colloidal Particles Using X-Rays. Nachr. Ges. Wiss. Göttingen Math. Klasse 1918, 2, 98–100. [Google Scholar]
- Ng, B.-J.; Putri, L.K.; Kong, X.Y.; Pasbakhsh, P.; Chai, S.-P. Z-Scheme Photocatalyst Sheets with P-Doped Twinned Zn0.5Cd0.5S1-x and Bi4NbO8Cl Connected by Carbon Electron Mediator for Overall Water Splitting under Ambient Condition. Chem. Eng. J. 2021, 404, 127030. [Google Scholar] [CrossRef]
- Zhang, J.; Hu, W.; Cao, S.; Piao, L. Recent Progress for Hydrogen Production by Photocatalytic Natural or Simulated Seawater Splitting. Nano Res. 2020, 13, 2313–2322. [Google Scholar] [CrossRef]
- Speltini, A.; Scalabrini, A.; Maraschi, F.; Sturini, M.; Pisanu, A.; Malavasi, L.; Profumo, A. Improved Photocatalytic H2 Production Assisted by Aqueous Glucose Biomass by Oxidized G-C3N4. Int. J. Hydrogen Energy 2018, 43, 14925–14933. [Google Scholar] [CrossRef]
- Wang, H.; Wu, Y.; Feng, M.; Tu, W.; Xiao, T.; Xiong, T.; Ang, H.; Yuan, X.; Chew, J.W. Visible-Light-Driven Removal of Tetracycline Antibiotics and Reclamation of Hydrogen Energy from Natural Water Matrices and Wastewater by Polymeric Carbon Nitride Foam. Water Res. 2018, 144, 215–225. [Google Scholar] [CrossRef]
- Xu, C.; Wu, S.; Xiong, G.; Guo, X.; Yang, H.; Yan, J.; Cen, K.; Bo, Z.; Ostrikov, K. (Ken) Nanoconfined Fusion of G-C3N4 within Edge-Rich Vertically Oriented Graphene Hierarchical Networks for High-Performance Photocatalytic Hydrogen Evolution Utilizing Superhydrophillic and Superaerophobic Responses in Seawater. Appl. Catal. B 2021, 280, 119461. [Google Scholar] [CrossRef]

| Factors | Coded and Actual Values | |||
|---|---|---|---|---|
| −1 | 0 | +1 | ||
| X1 | Catalyst loading (g/L) | 0.25 | 1.625 | 3 |
| X2 | TEOA concentration (vol%) | 0.625 | 10 | 20 |
| X3 | Salinity (g/L) | 0 | 33.33 | 66.67 |
| Source | Sequential p-Value | Lack of Fit p-Value | M | L | Predicted R2 | Adjusted R2 | Score 1 | Score 2 |
|---|---|---|---|---|---|---|---|---|
| Linear | 0.1805 | 0.3327 | 0.2770 | 1 | −0.0777 | 0.1688 | −0.0215 | 0.0468 |
| 2FI | 0.3135 | 0.3402 | 0.1595 | 1 | 0.0675 | 0.2494 | 0.0108 | 0.0398 |
| Quadratic | 0.0032 | 0.8103 | 1 | 1 | 0.6753 | 0.9083 | 0.6753 | 0.9083 |
| Cubic | - | 1 | 0 | 1 | - | - | - | - |
| Run | Factors | Response | ||||||
|---|---|---|---|---|---|---|---|---|
| Catalyst Loading, X1 (g/L) | TEOA Conc., X2 (vol%) | Salinity, X3 (g/L) | HER Rate, Y (µmol/h) | |||||
| Coded | Actual | Coded | Actual | Coded | Actual | Experimental | Predicted | |
| 1 | −1 | 0.25 | −1 | 0.625 | 0 | 33.33 | 1.74 | 1.62 |
| 2 | 0 | 1.625 | −1 | 0.625 | +1 | 66.67 | 1.31 | 1.64 |
| 3 | 0 | 1.625 | −1 | 0.625 | −1 | 0.00 | negligible | 0.40 |
| 4 | +1 | 3 | 0 | 10 | −1 | 0.00 | 1.99 | 2.20 |
| 5 | 0 | 1.625 | +1 | 20 | −1 | 0.00 | 3.87 | 3.54 |
| 6 | 0 | 1.625 | 0 | 10 | 0 | 33.33 | 5.19 | 6.09 |
| 7 | +1 | 3 | 0 | 10 | +1 | 66.67 | 4.43 | 4.71 |
| 8 | +1 | 3 | +1 | 20 | 0 | 33.34 | 6.60 | 6.73 |
| 9 | 0 | 1.625 | 0 | 10 | 0 | 33.34 | 6.42 | 6.09 |
| 10 | 0 | 1.625 | +1 | 20 | +1 | 66.67 | 5.23 | 4.82 |
| 11 | +1 | 3 | −1 | 0.625 | 0 | 33.33 | negligible | 0 |
| 12 | −1 | 0.25 | 0 | 10 | +1 | 66.67 | 1.85 | 1.65 |
| 13 | 0 | 1.625 | 0 | 10 | 0 | 33.33 | 6.65 | 6.09 |
| 14 | −1 | 0.25 | 0 | 10 | −1 | 0.00 | 1.93 | 1.64 |
| 15 | −1 | 0.25 | +1 | 20 | 0 | 33.33 | negligible | 0.60 |
| Source | Sum of Squares | DoF | Mean Square | F-Value | p-Value |
|---|---|---|---|---|---|
| Model | 82.37 | 9 | 9.15 | 16.42 | 0.0033 |
| X1—Catalyst loading | 6.54 | 1 | 6.54 | 11.74 | 0.0187 |
| X2—TEOA conc. | 23.12 | 1 | 23.12 | 41.48 | 0.0013 |
| X3—Salinity | 3.17 | 1 | 3.17 | 5.68 | 0.0628 |
| X1X2 | 17.51 | 1 | 17.51 | 31.42 | 0.0025 |
| X1X3 | 1.58 | 1 | 1.58 | 2.83 | 0.1532 |
| X2X3 | 0.0006 | 1 | 0.0006 | 0.0011 | 0.9750 |
| X12 | 15.19 | 1 | 15.19 | 27.25 | 0.0034 |
| X22 | 15.15 | 1 | 15.15 | 27.18 | 0.0034 |
| X32 | 8.42 | 1 | 8.42 | 15.1 | 0.0116 |
| Residual | 2.79 | 5 | 0.5575 | ||
| Lack of Fit | 1.72 | 4 | 0.4294 | 0.4015 | 0.8103 |
| Pure Error | 1.07 | 1 | 1.07 | ||
| Cor Total | 85.15 | 14 |
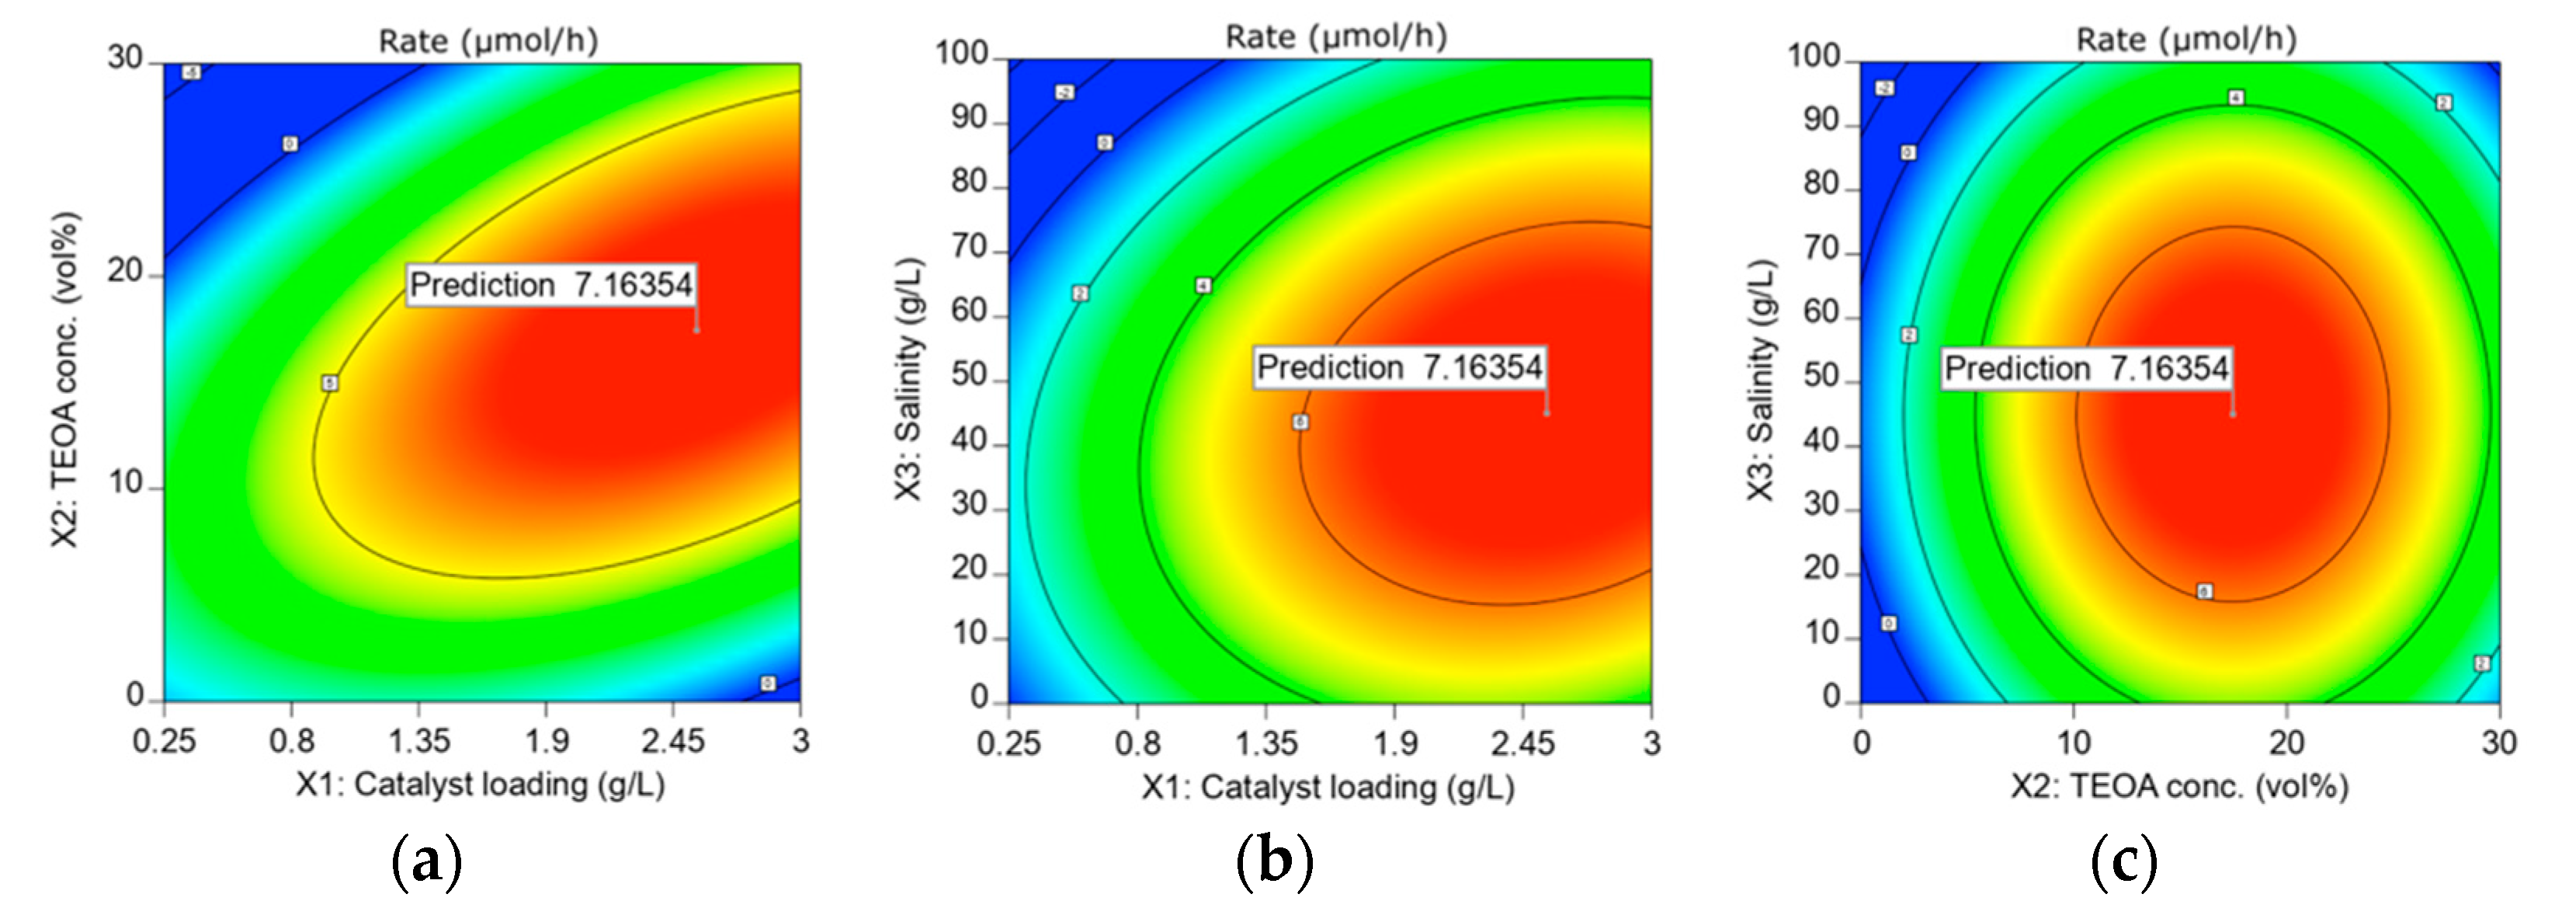
| Lower Boundary | Upper Boundary | Optimum | ||
|---|---|---|---|---|
| Catalyst loading, X1 | 0.25 | 3 | 2.55 | g/L |
| TEOA concentration, X2 | 0 | 30 | 17.46 | vol% |
| Salinity, X3 | 0 | 100 | 45.06 | g/L |
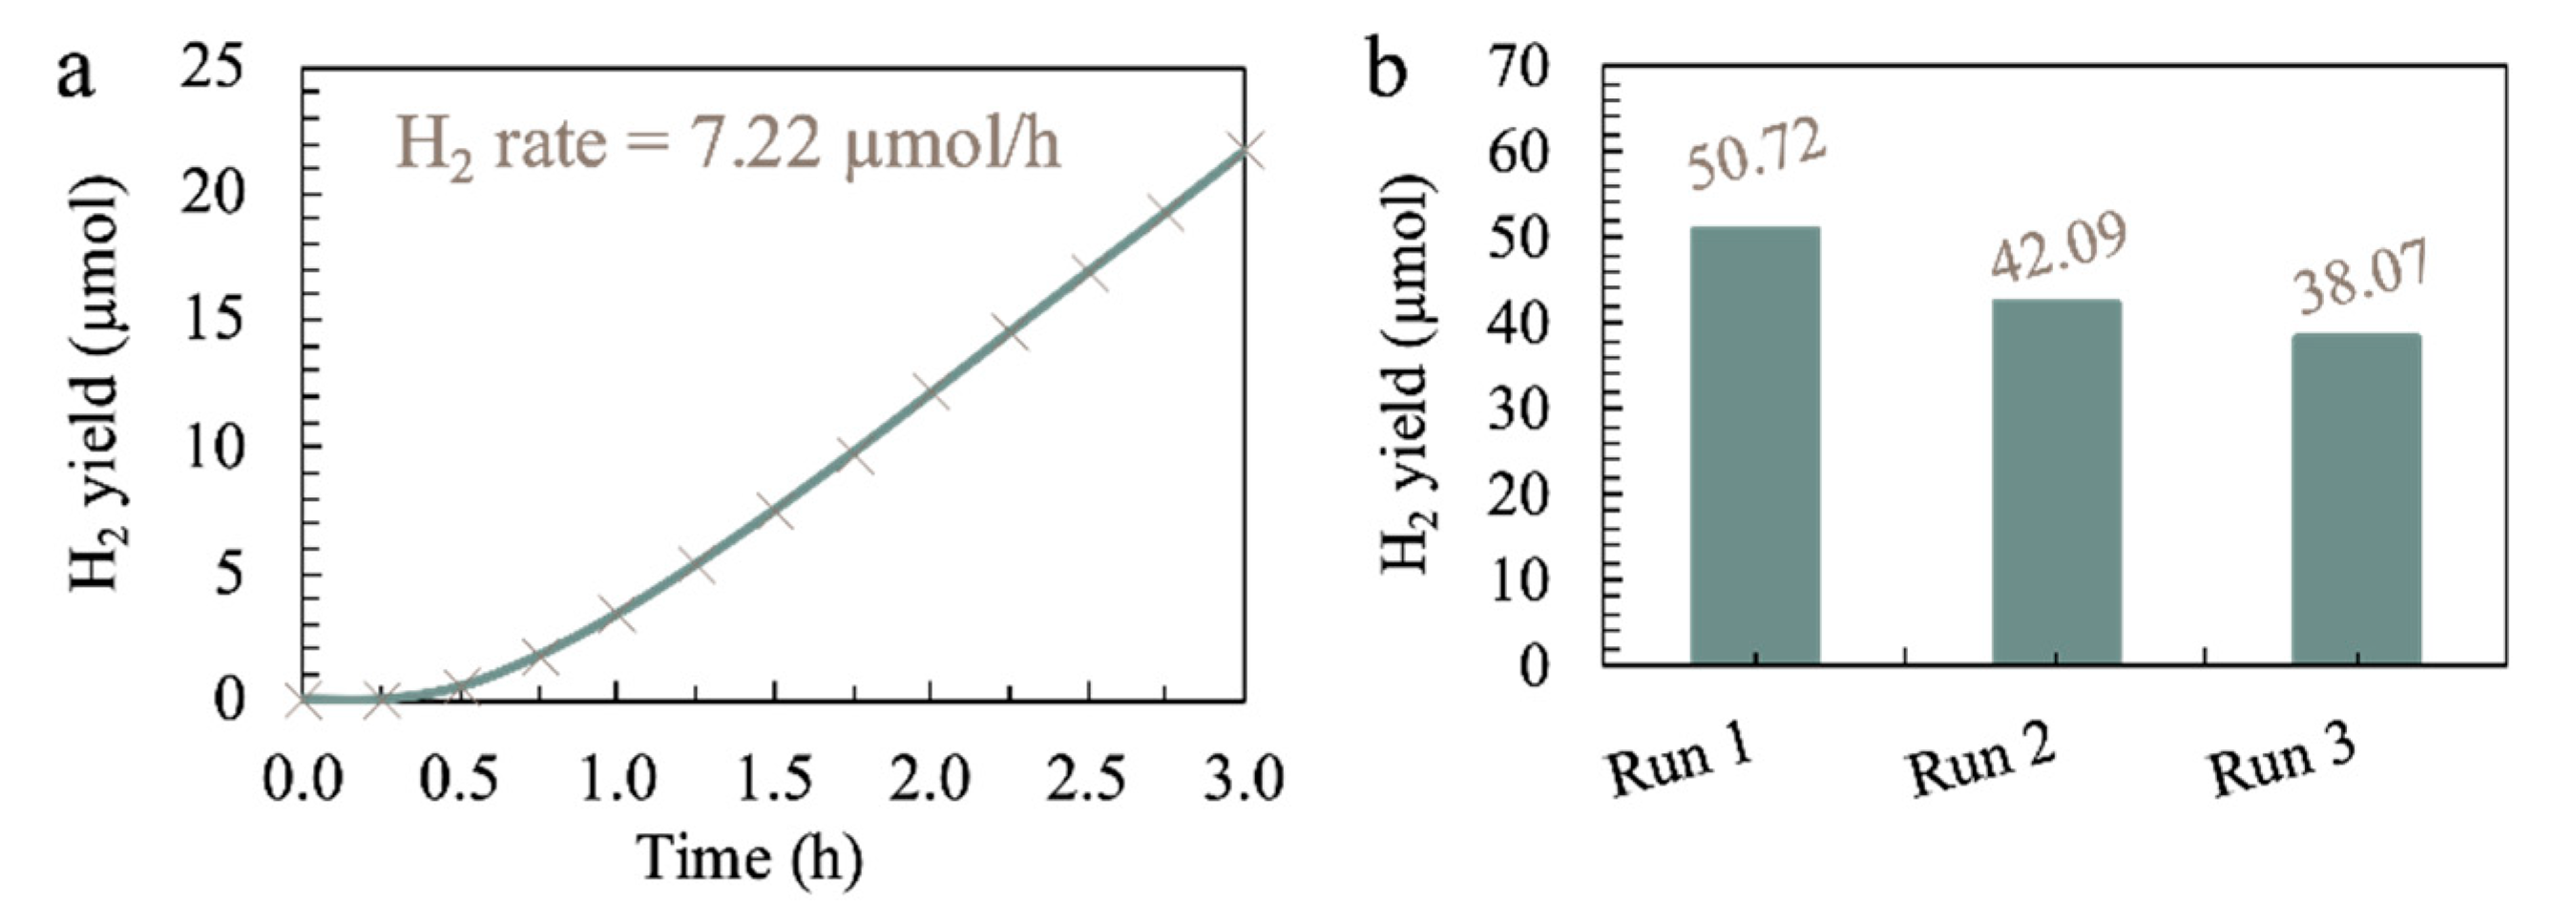
| HER Rate, Y | 7.16 | µmol/h |
Publisher’s Note: MDPI stays neutral with regard to jurisdictional claims in published maps and institutional affiliations. |
© 2022 by the authors. Licensee MDPI, Basel, Switzerland. This article is an open access article distributed under the terms and conditions of the Creative Commons Attribution (CC BY) license (https://creativecommons.org/licenses/by/4.0/).
Share and Cite
Chee, M.K.T.; Ng, B.-J.; Chew, Y.-H.; Chang, W.S.; Chai, S.-P. Photocatalytic Hydrogen Evolution from Artificial Seawater Splitting over Amorphous Carbon Nitride: Optimization and Process Parameters Study via Response Surface Modeling. Materials 2022, 15, 4894. https://doi.org/10.3390/ma15144894
Chee MKT, Ng B-J, Chew Y-H, Chang WS, Chai S-P. Photocatalytic Hydrogen Evolution from Artificial Seawater Splitting over Amorphous Carbon Nitride: Optimization and Process Parameters Study via Response Surface Modeling. Materials. 2022; 15(14):4894. https://doi.org/10.3390/ma15144894
Chicago/Turabian StyleChee, Michell K. T., Boon-Junn Ng, Yi-Hao Chew, Wei Sea Chang, and Siang-Piao Chai. 2022. "Photocatalytic Hydrogen Evolution from Artificial Seawater Splitting over Amorphous Carbon Nitride: Optimization and Process Parameters Study via Response Surface Modeling" Materials 15, no. 14: 4894. https://doi.org/10.3390/ma15144894
APA StyleChee, M. K. T., Ng, B.-J., Chew, Y.-H., Chang, W. S., & Chai, S.-P. (2022). Photocatalytic Hydrogen Evolution from Artificial Seawater Splitting over Amorphous Carbon Nitride: Optimization and Process Parameters Study via Response Surface Modeling. Materials, 15(14), 4894. https://doi.org/10.3390/ma15144894