
Numerical Study on Hydrodynamic Characteristics and Electrochemical Performance of Alkaline Water Electrolyzer by Micro-Nano Surface Electrode


Abstract
:1. Introduction
2. Model
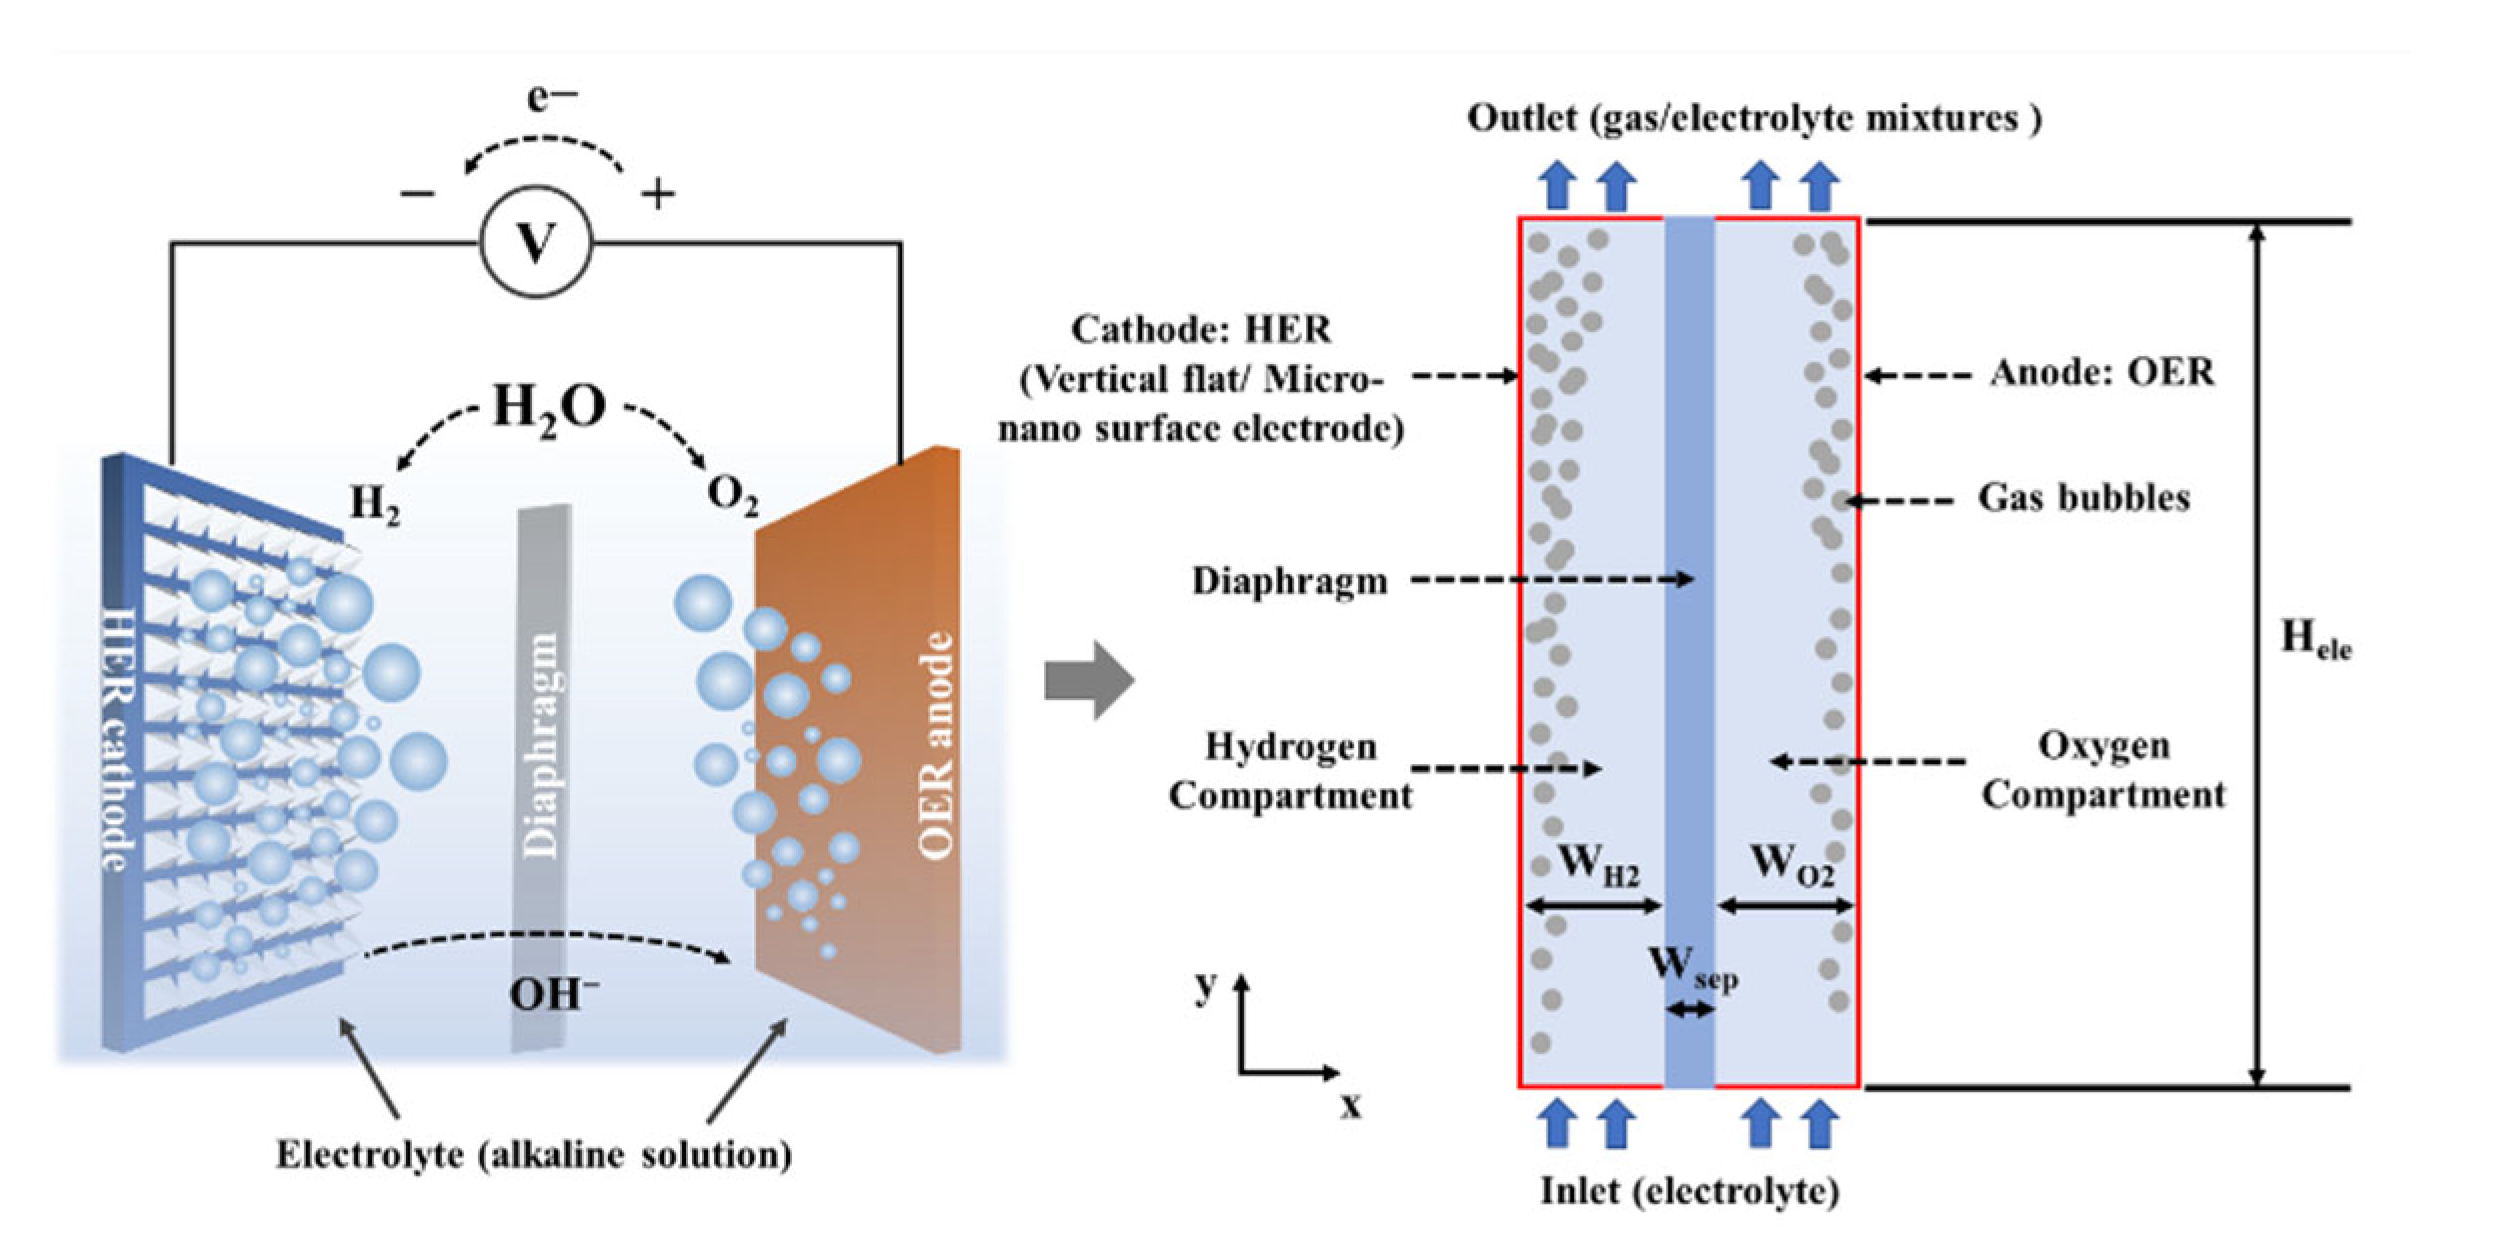
2.1. Physical Model
2.2. Numerical Model
- The fluids in both phases are Newtonian, viscous, and incompressible;
- The physical properties remain constant;
- The two phases share the same pressure field;
- The electrolyte is considered distributed uniformly due to the distribution of the ions has little effect on the result;
- The flow is considered isothermal. Thus, heat exchange and energy equation are not considered;
- The influence of surface tension is negligible;
- No bubble coalescence or break-up occurs, and the bubble diameter can be considered constant at a given current density;
- The bubble–bubble interaction is considered by introducing the turbulent dispersion force;
- Since alkaline electrolysis is a complex physical problem involving two-phase flow and the construction of micro-nano surface electrodes is complicated, all issues are simplified to 2D and steady-state simulation.
2.2.1. Secondary Current Distribution Model
2.2.2. CFD Model
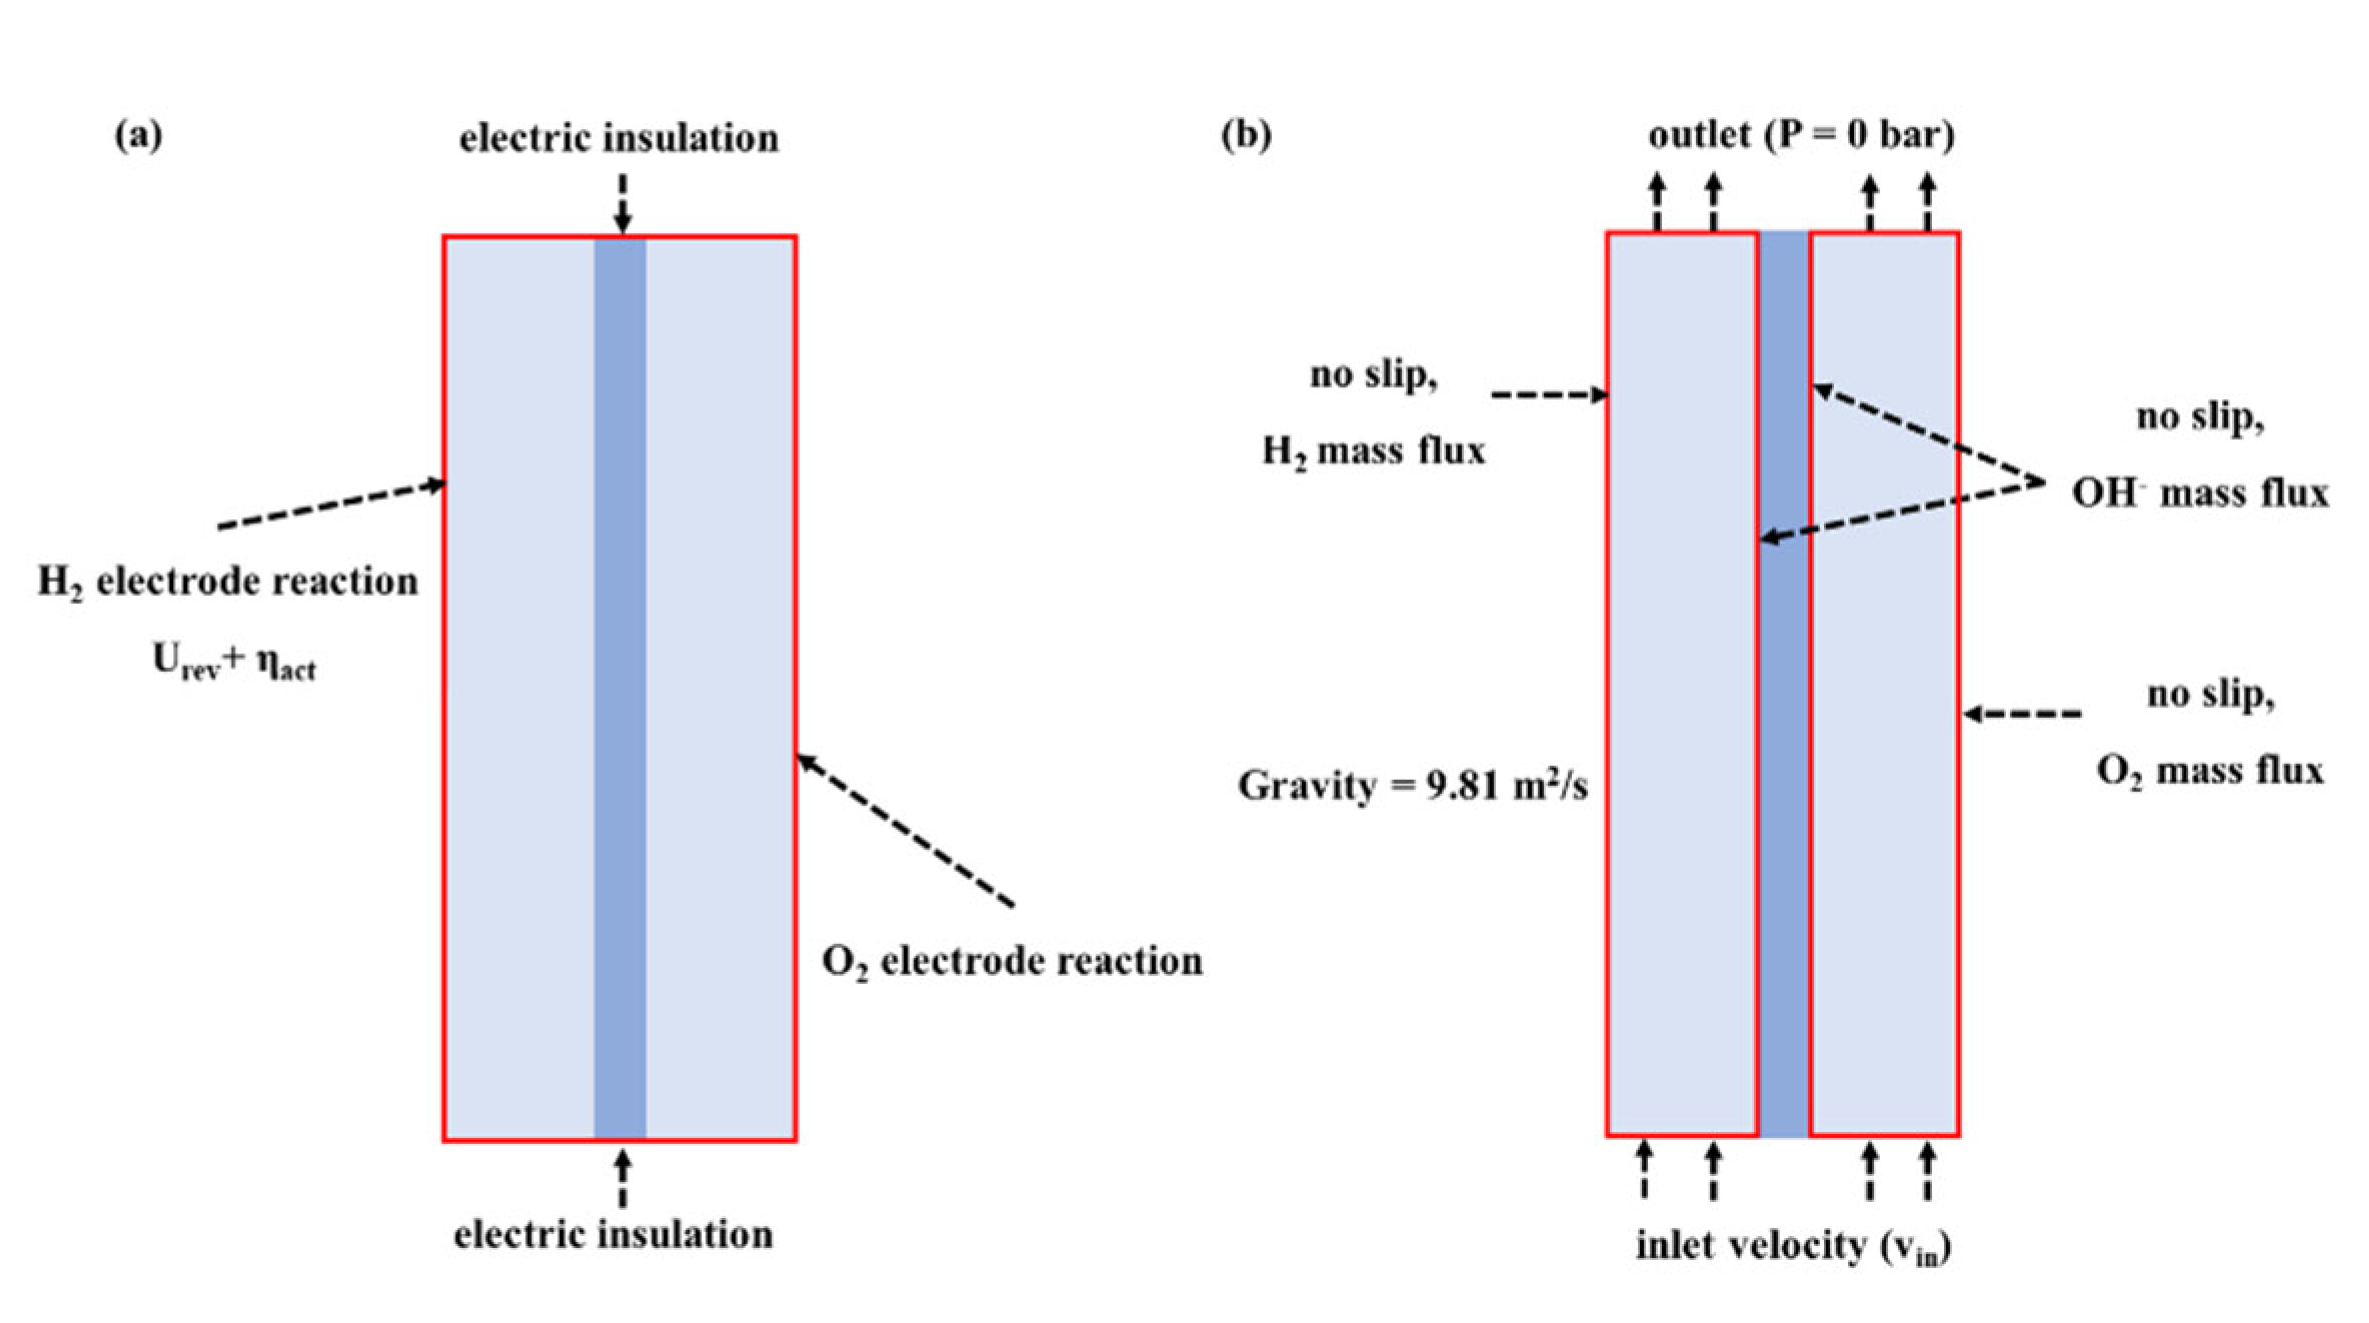
2.2.3. Initial Values and Boundary Conditions
2.3. Grid Study and Validation
3. Results
3.1. Vertical Flat Electrode
3.2. Micro-Nano Surface Electrode
3.2.1. Polarization Curve
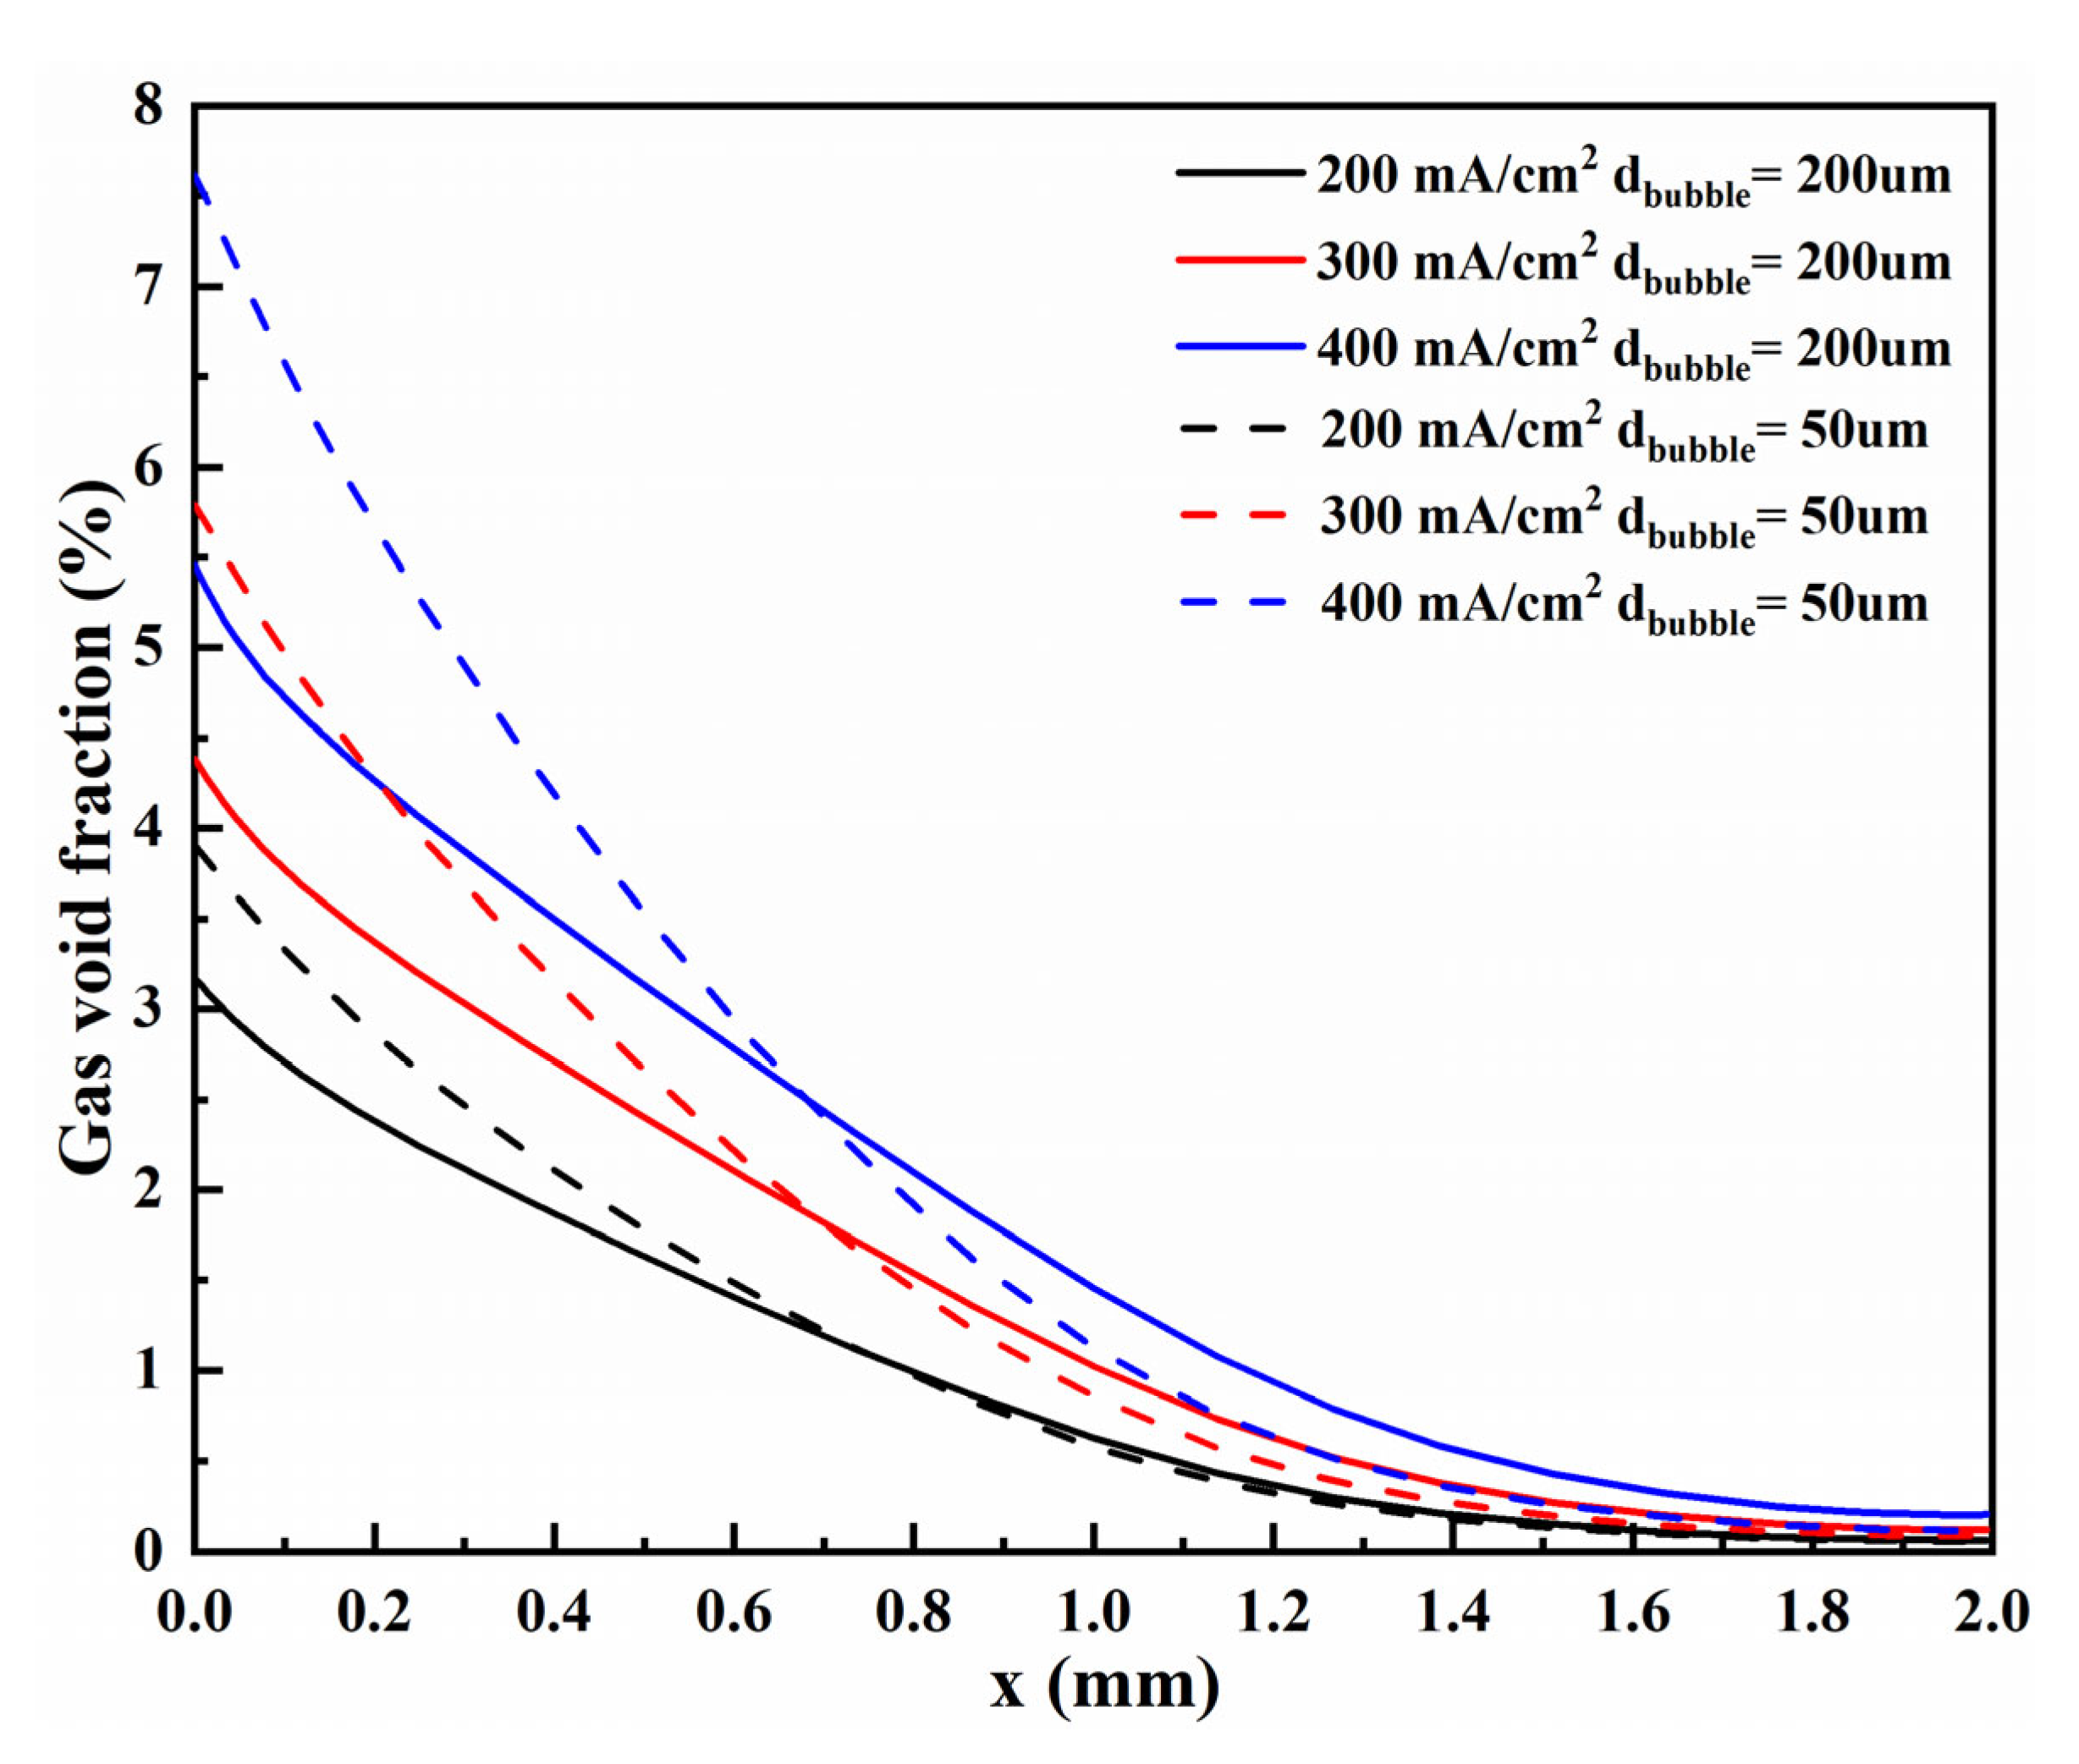
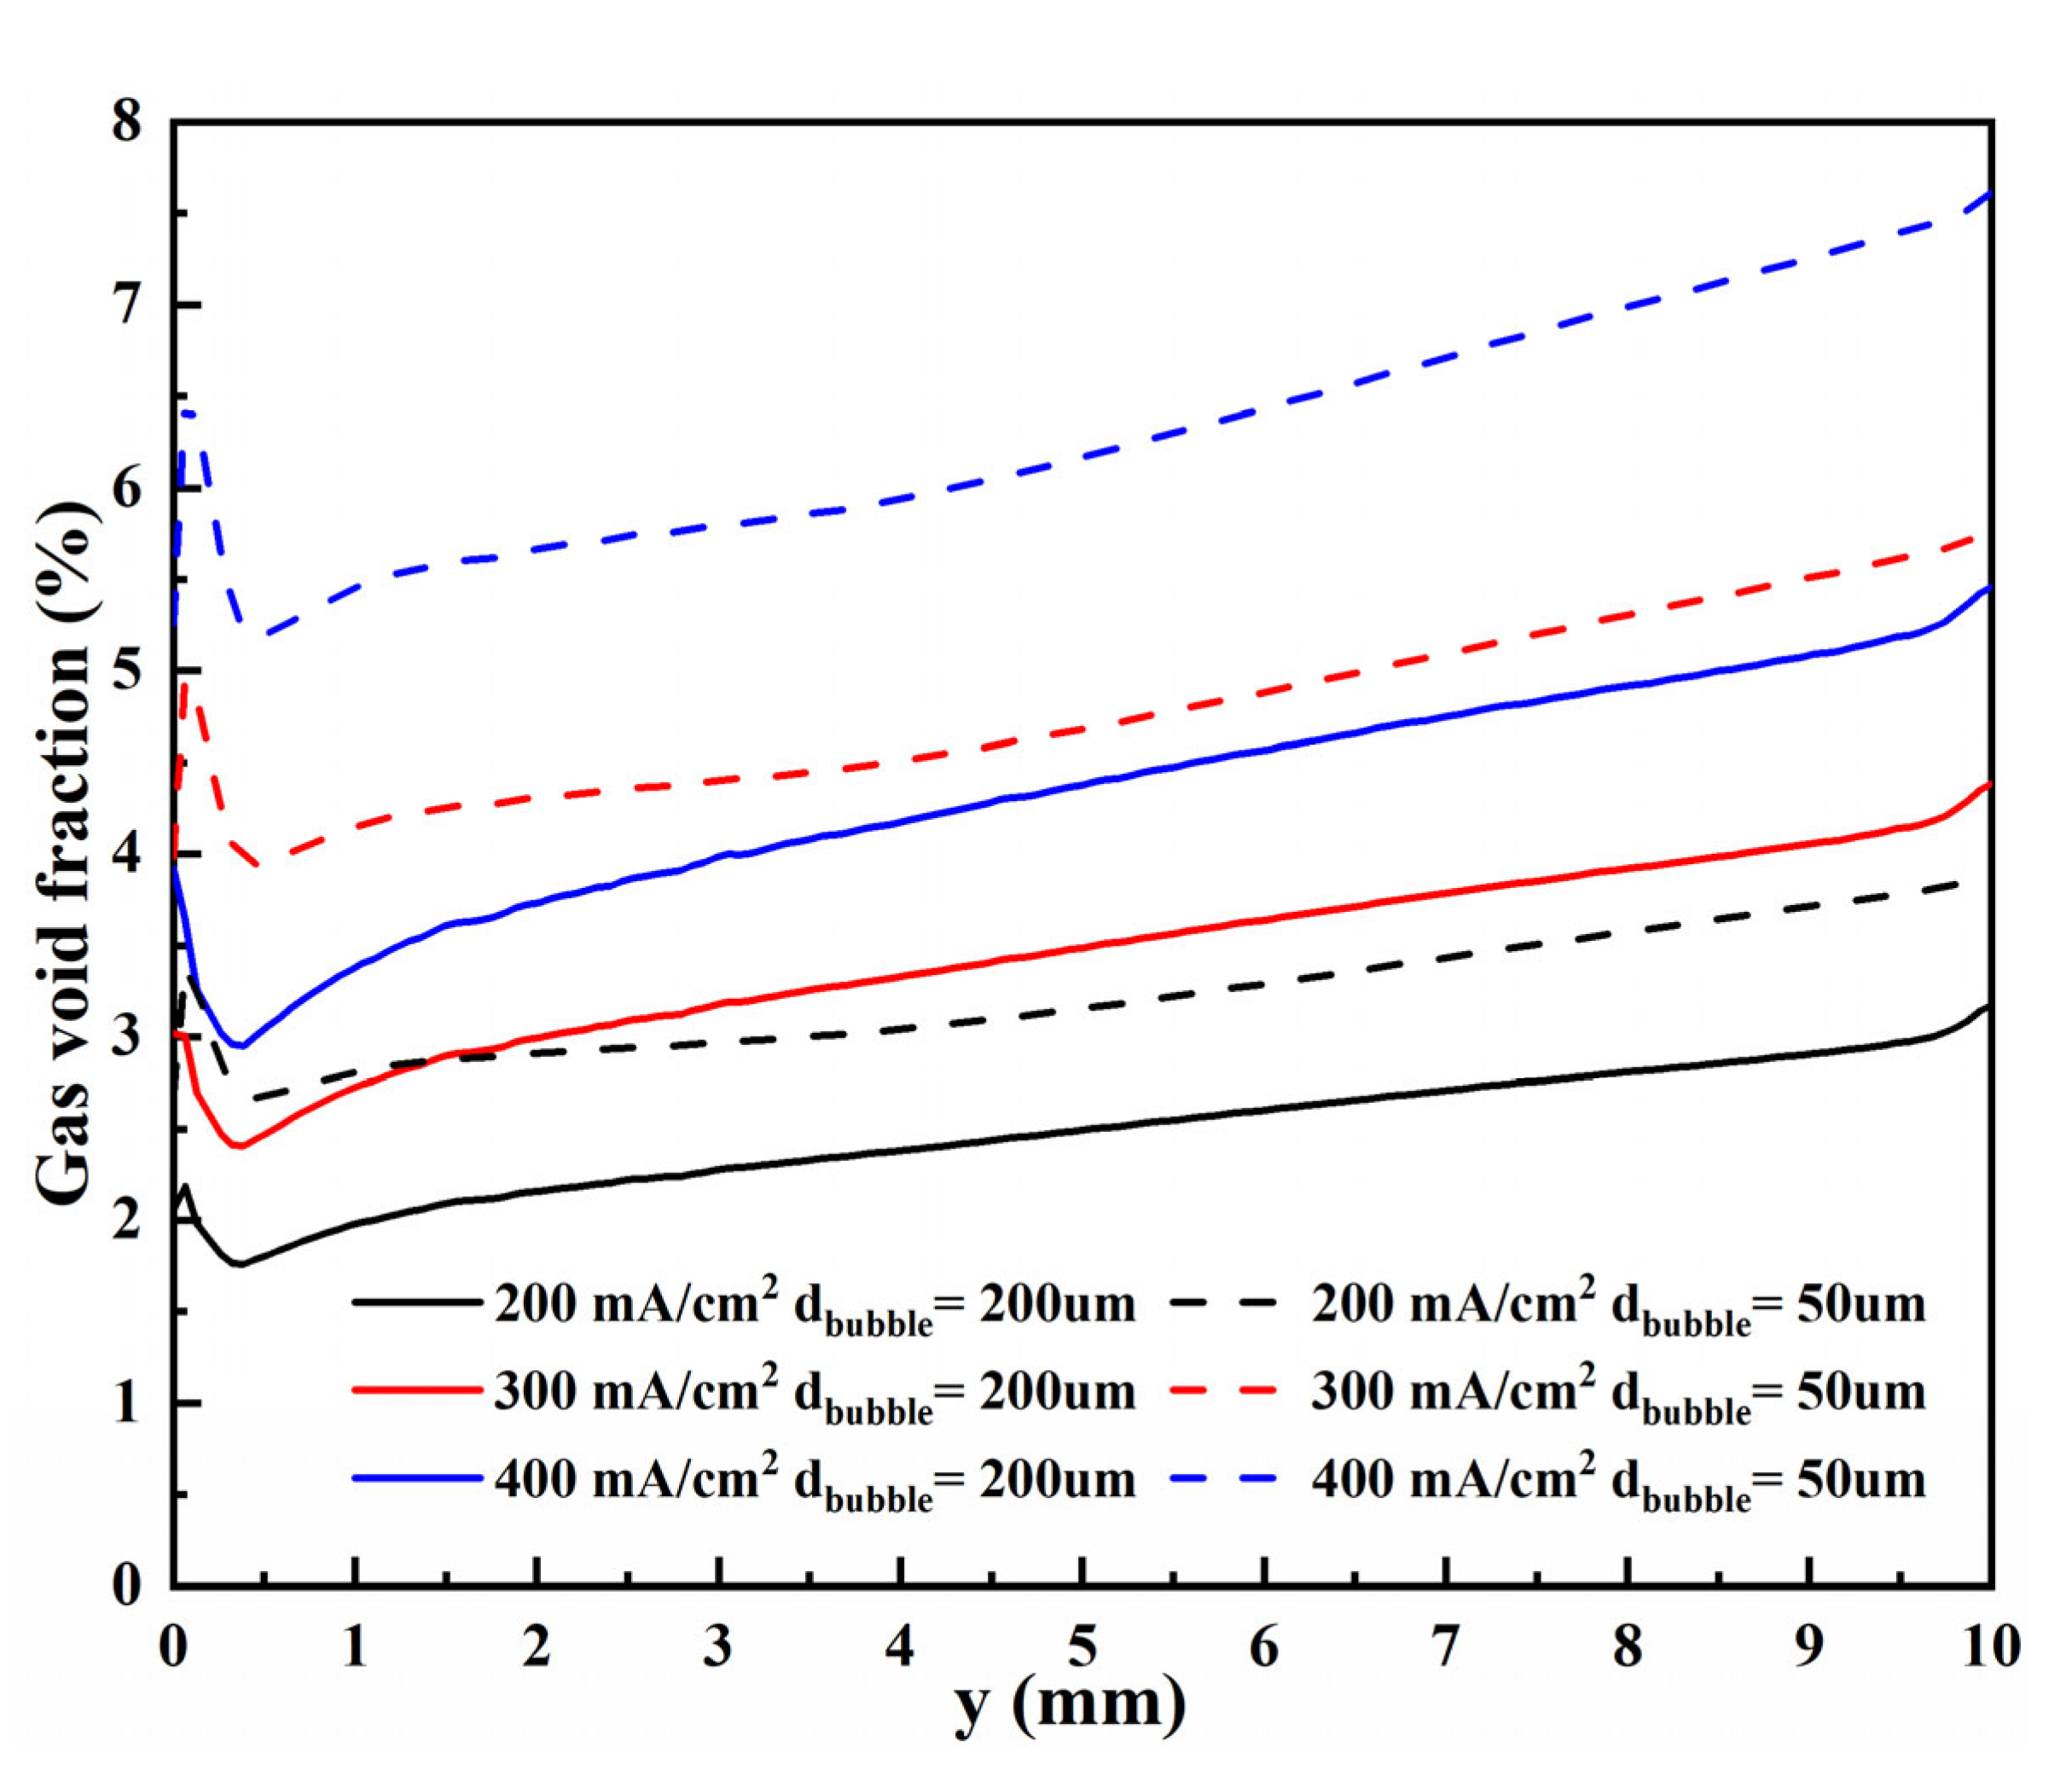
3.2.2. Void Fraction
4. Conclusions
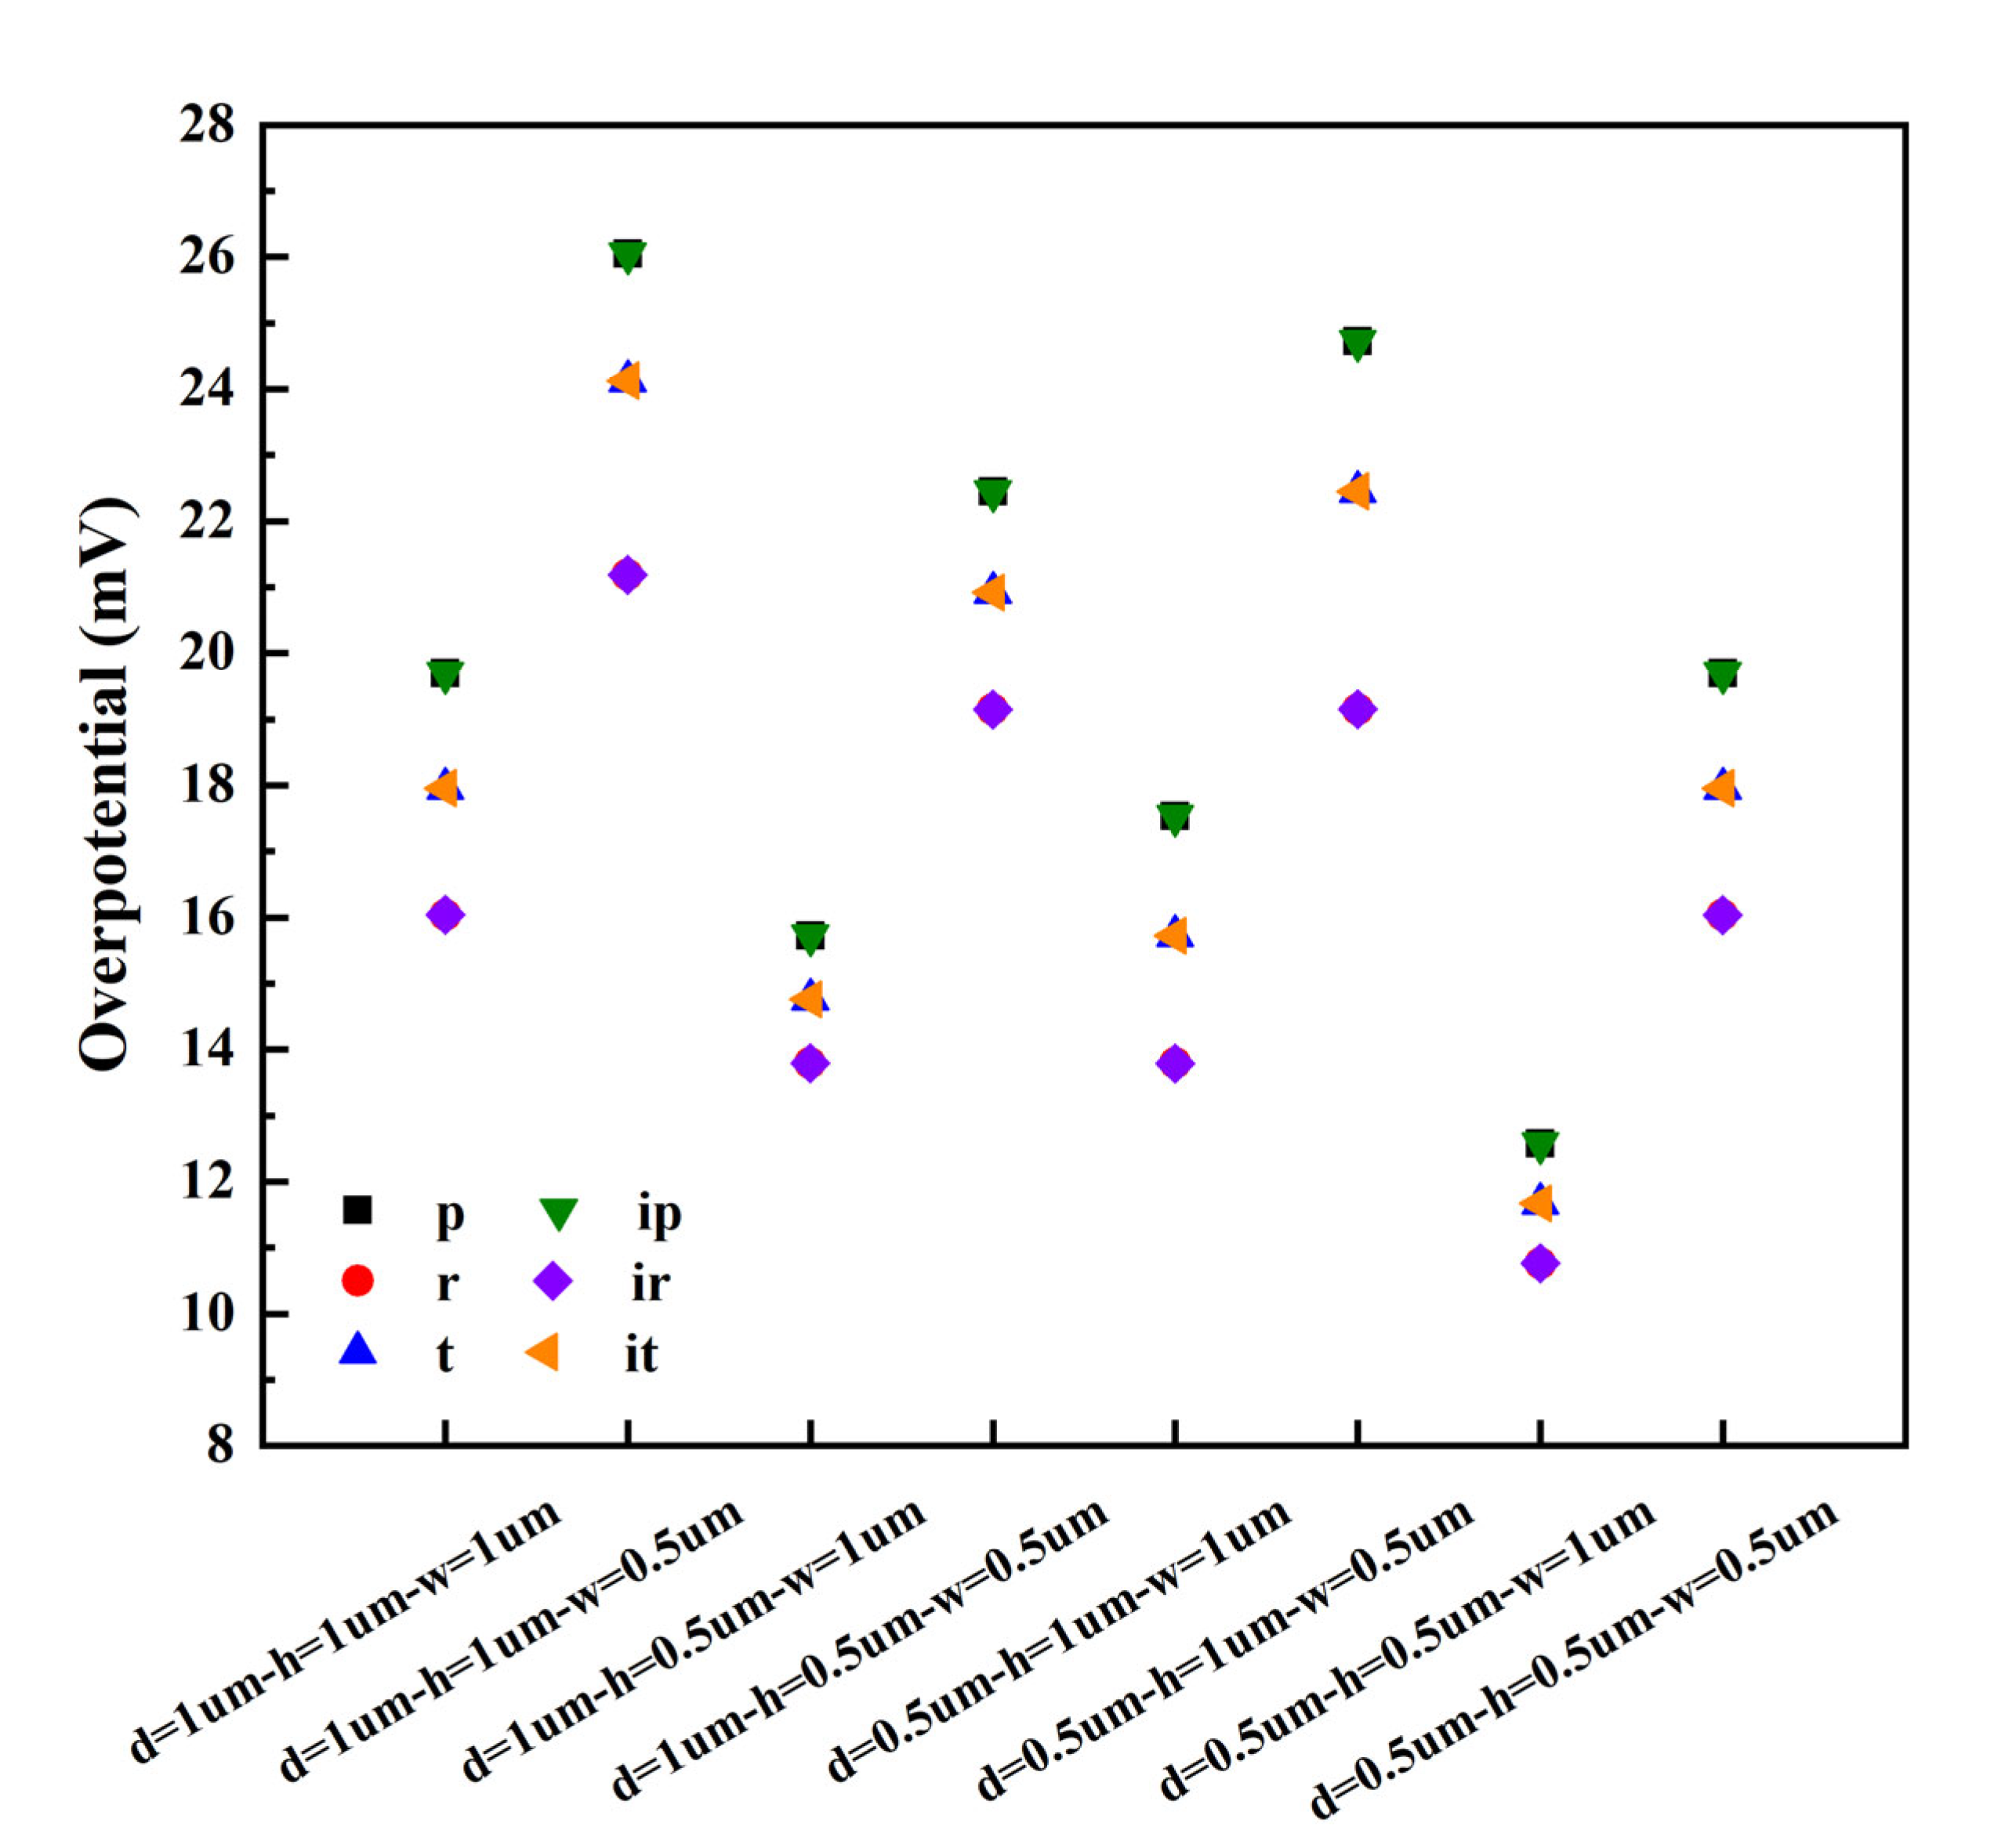
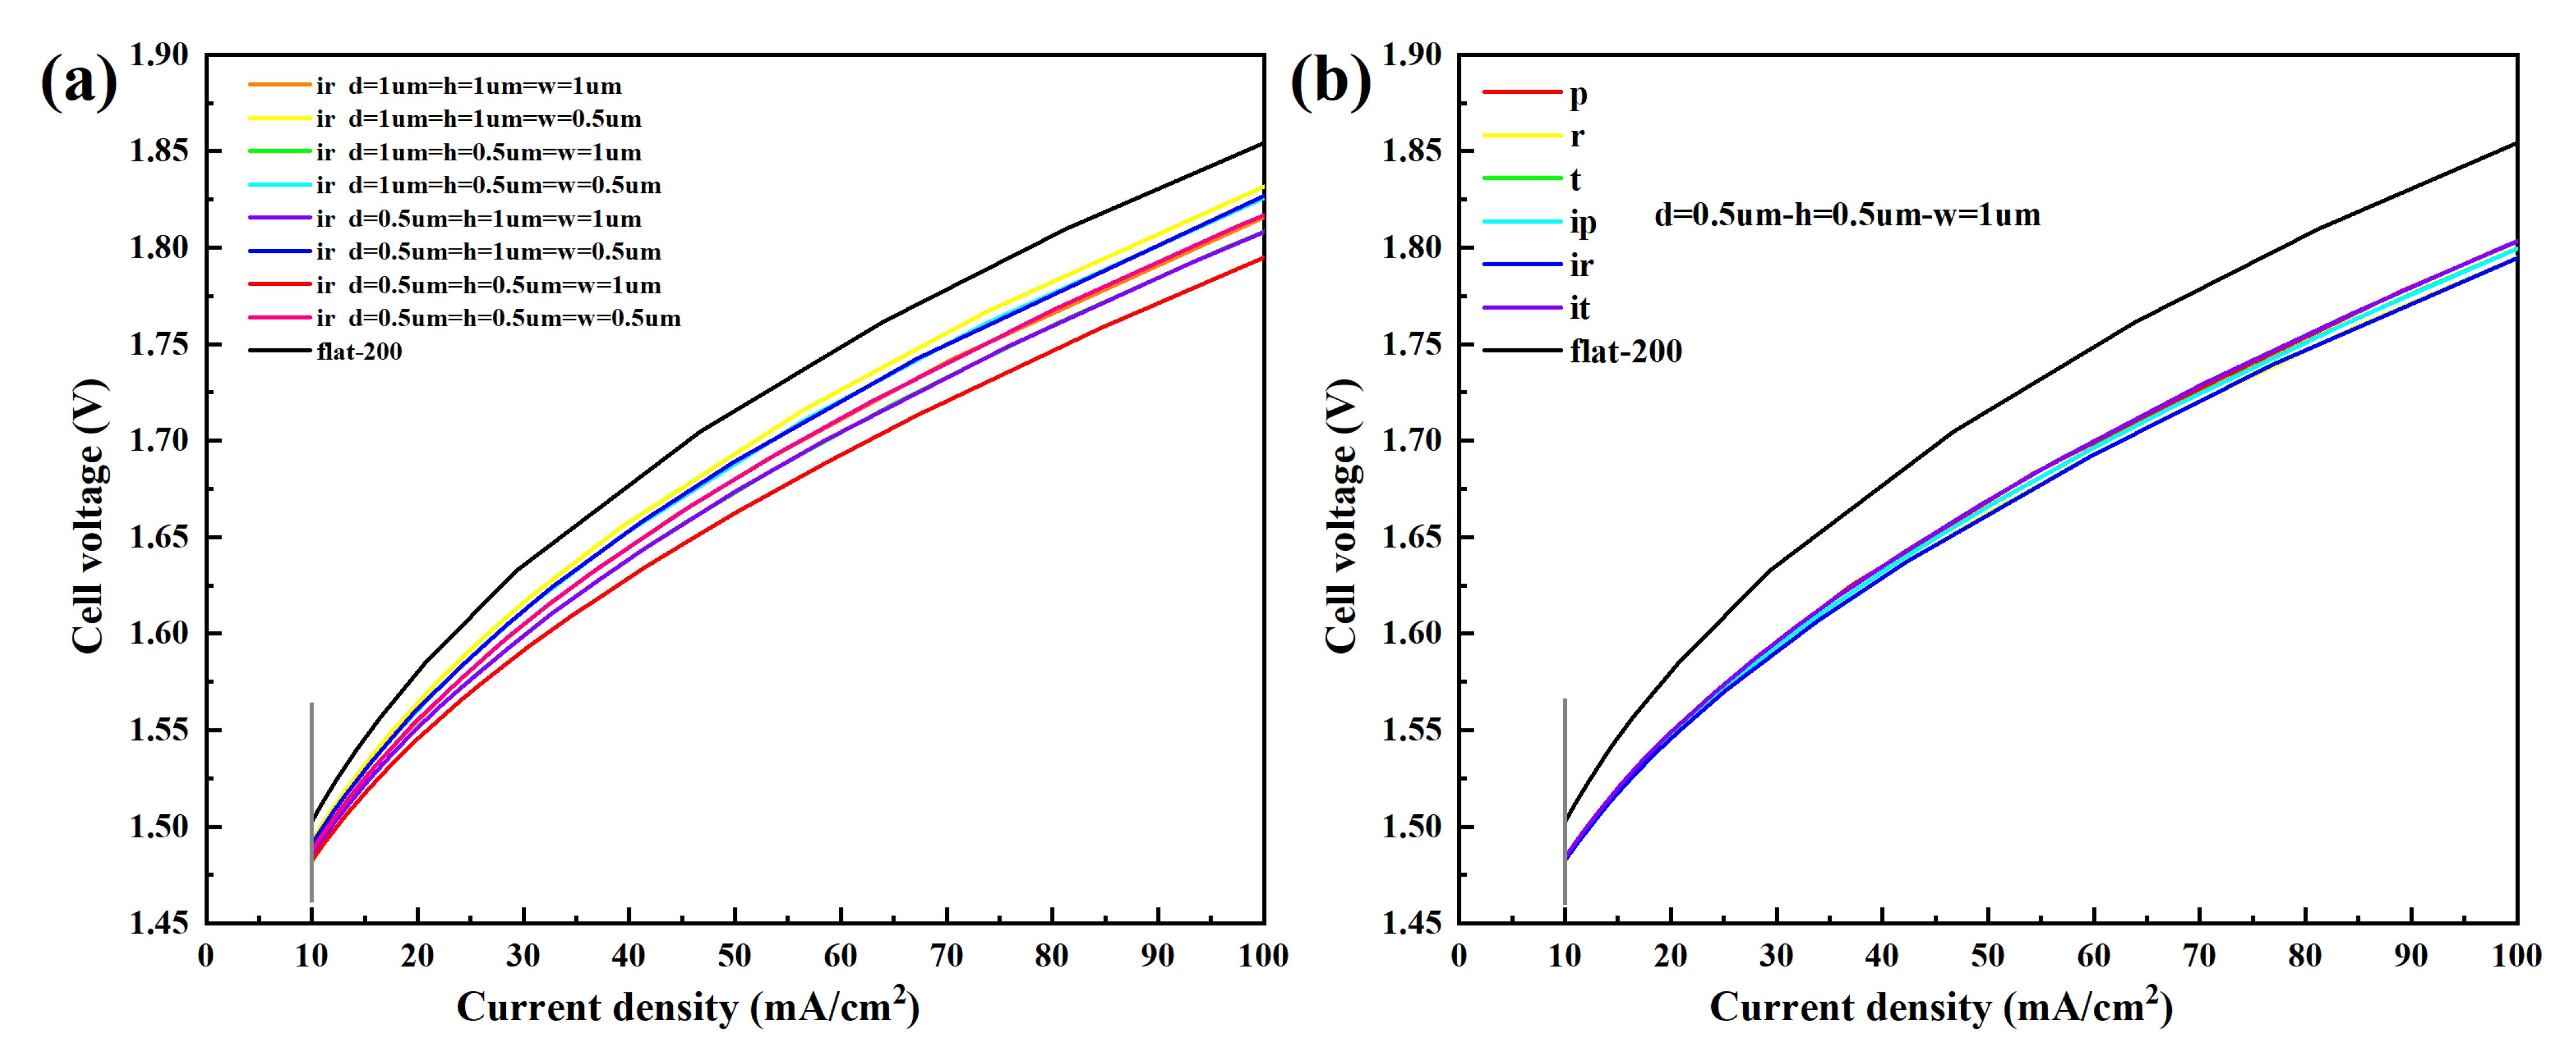
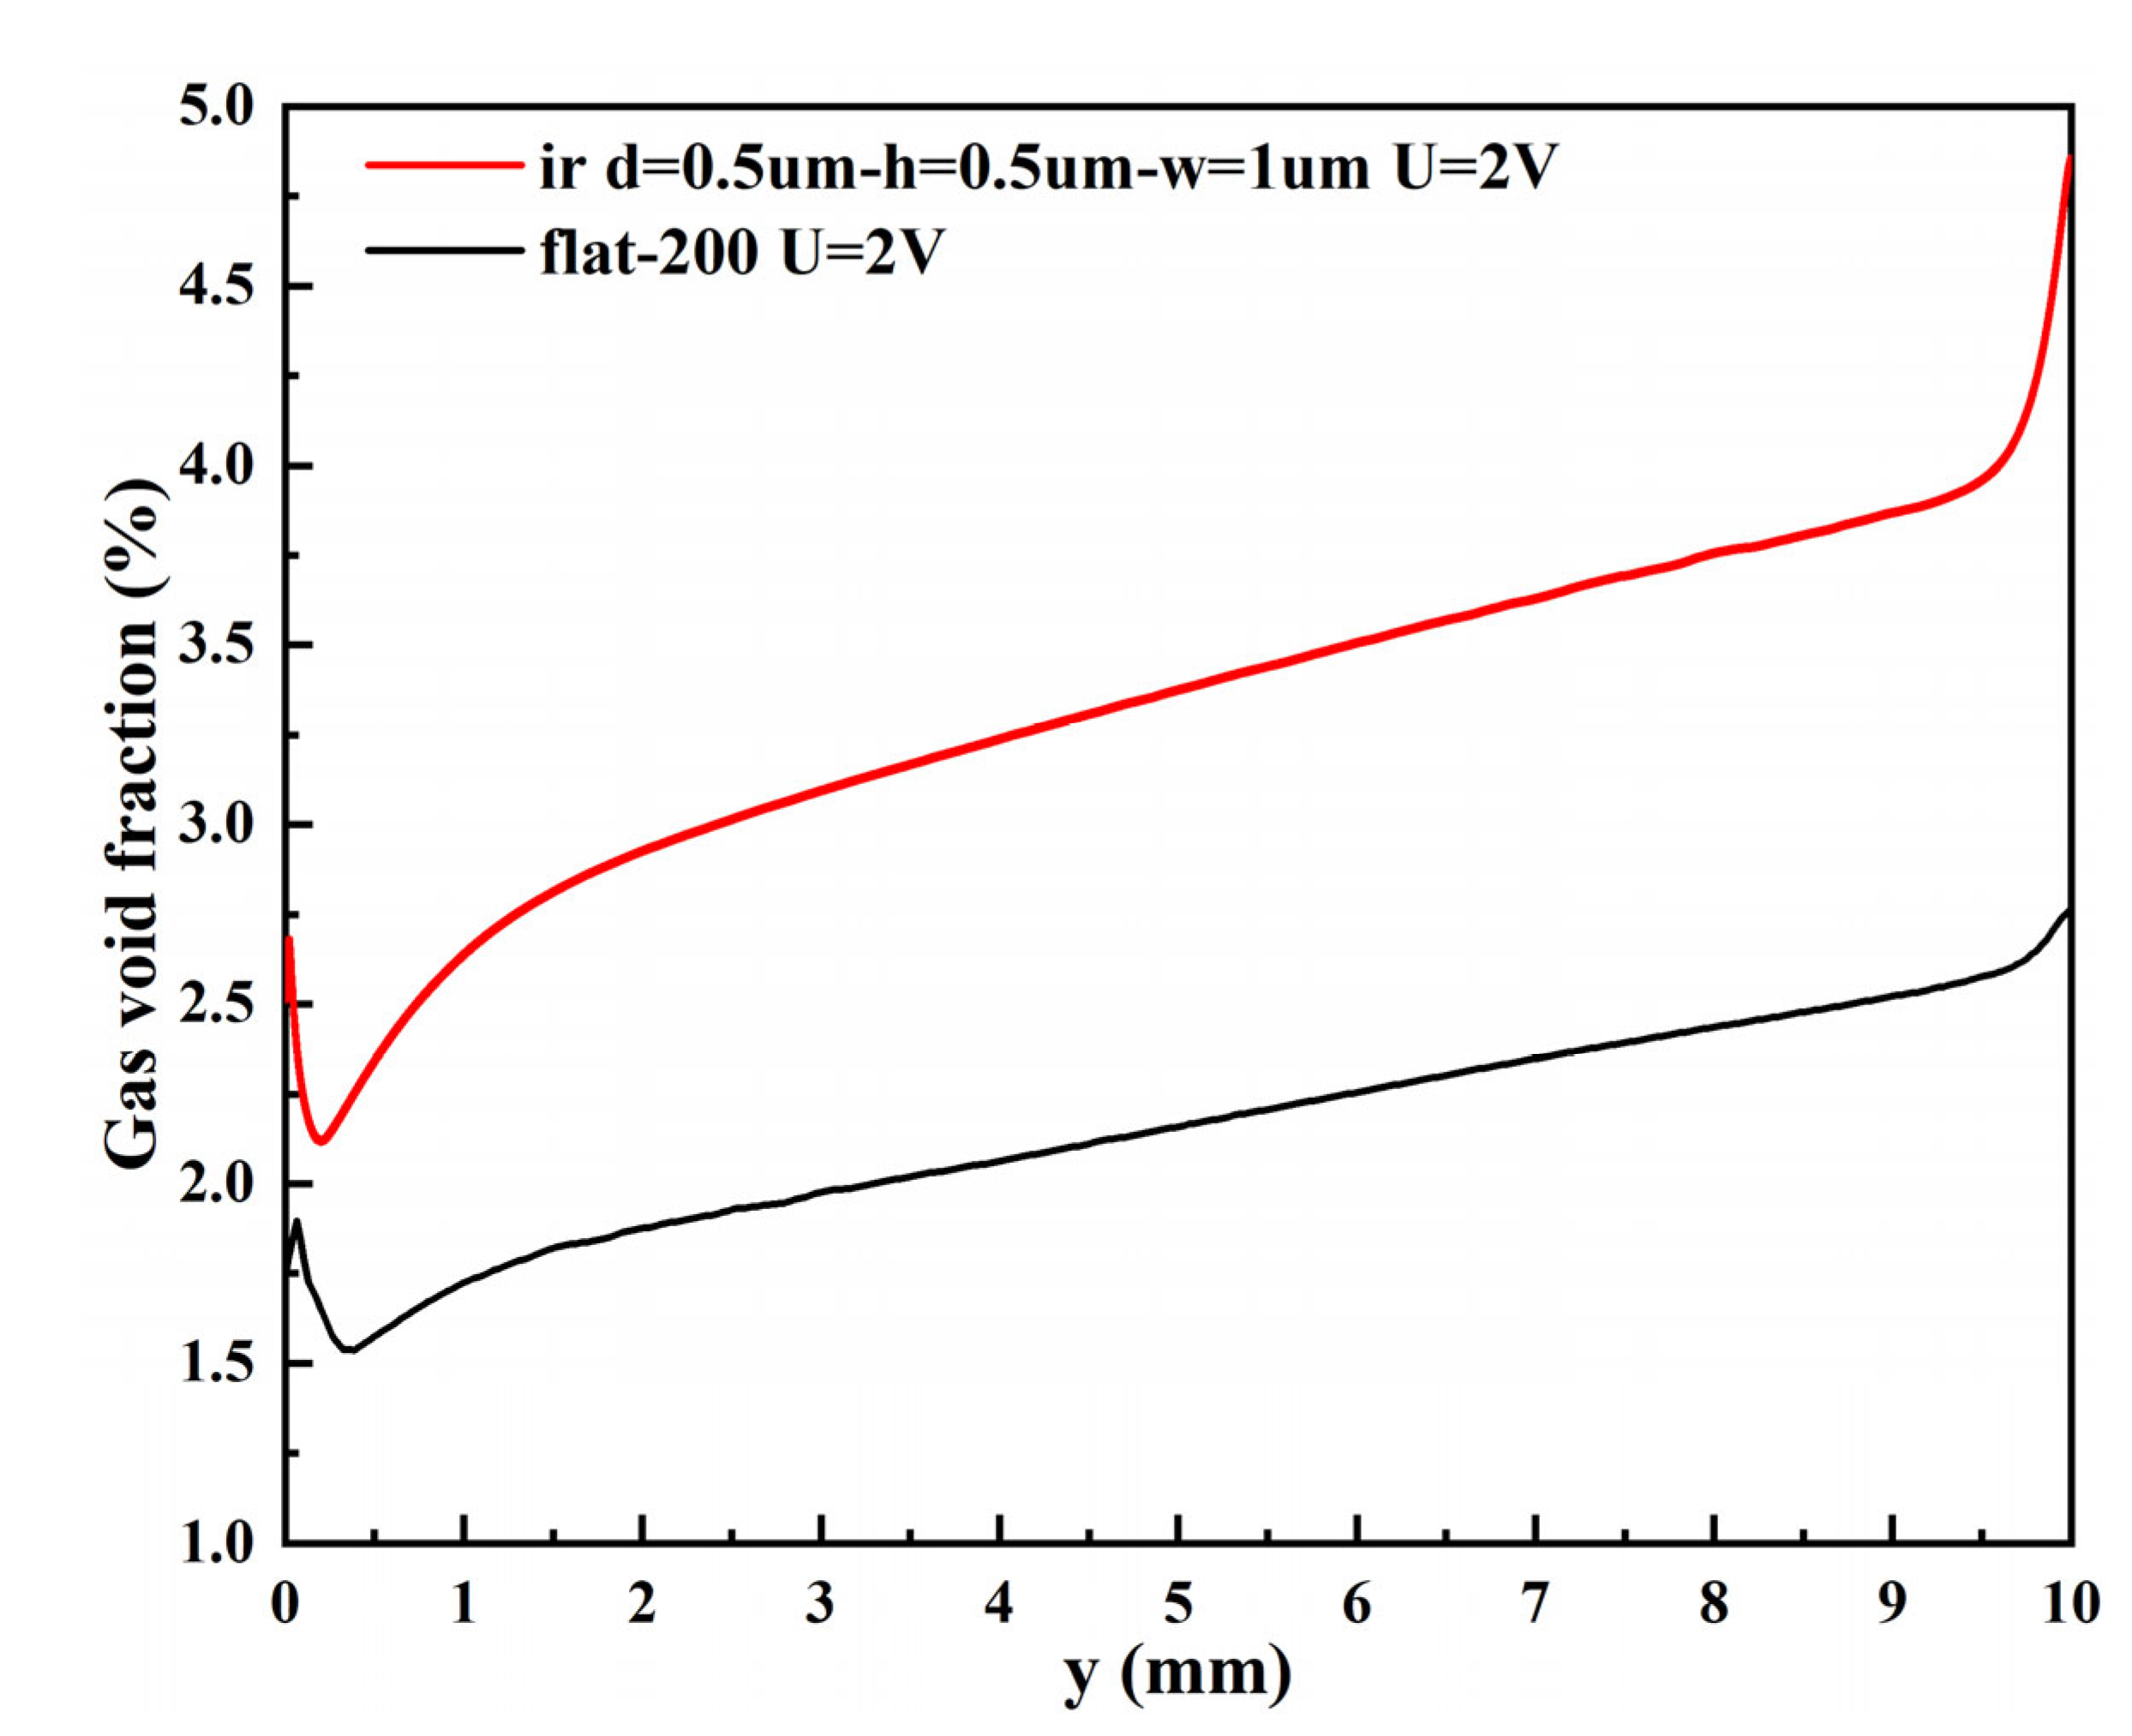
- The micro-nano surface electrode can significantly reduce the cell voltage and cathode overpotential and increase the gas void fraction. Among the six structures and graphic parameters set in this paper, when the distance, height, and width of each structure are 0.5 µm, 0.5 µm, and 1 µm, respectively, the cell voltage and cathode overpotential are the lowest, and the void fraction is the highest, and rectangle/inverted rectangle has the best effect, followed by trapezoid/inverted trapezoid.
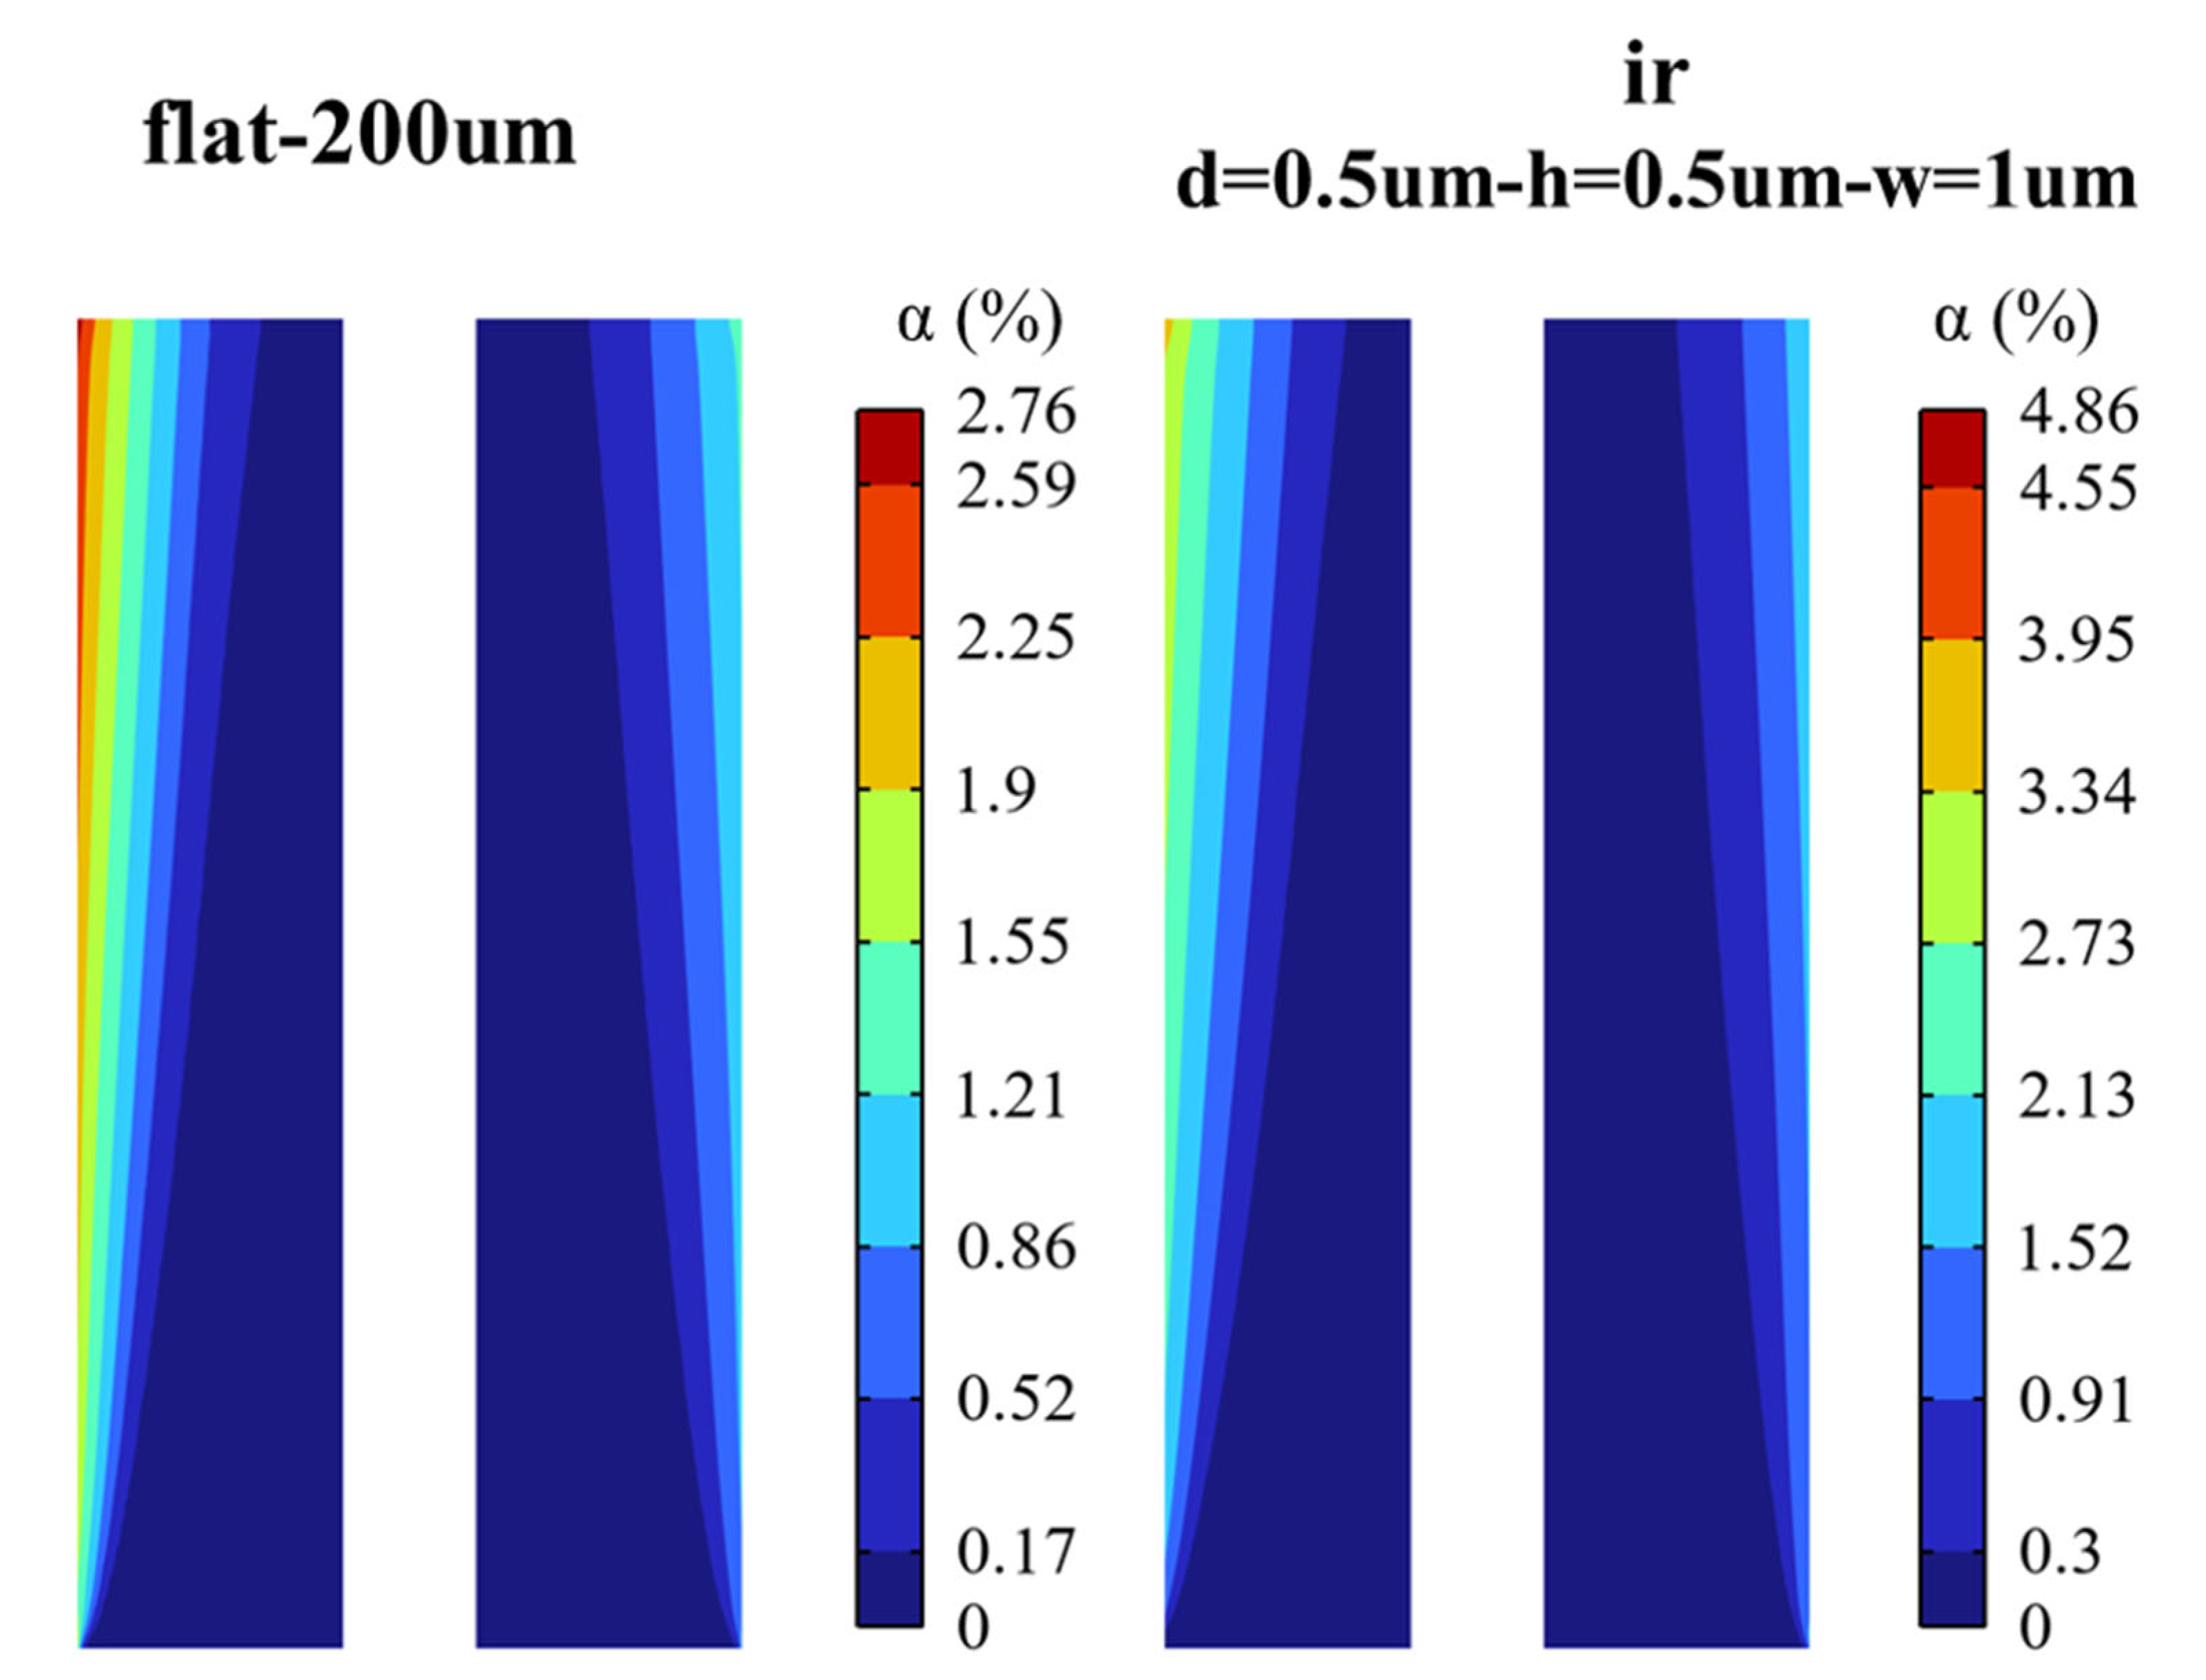
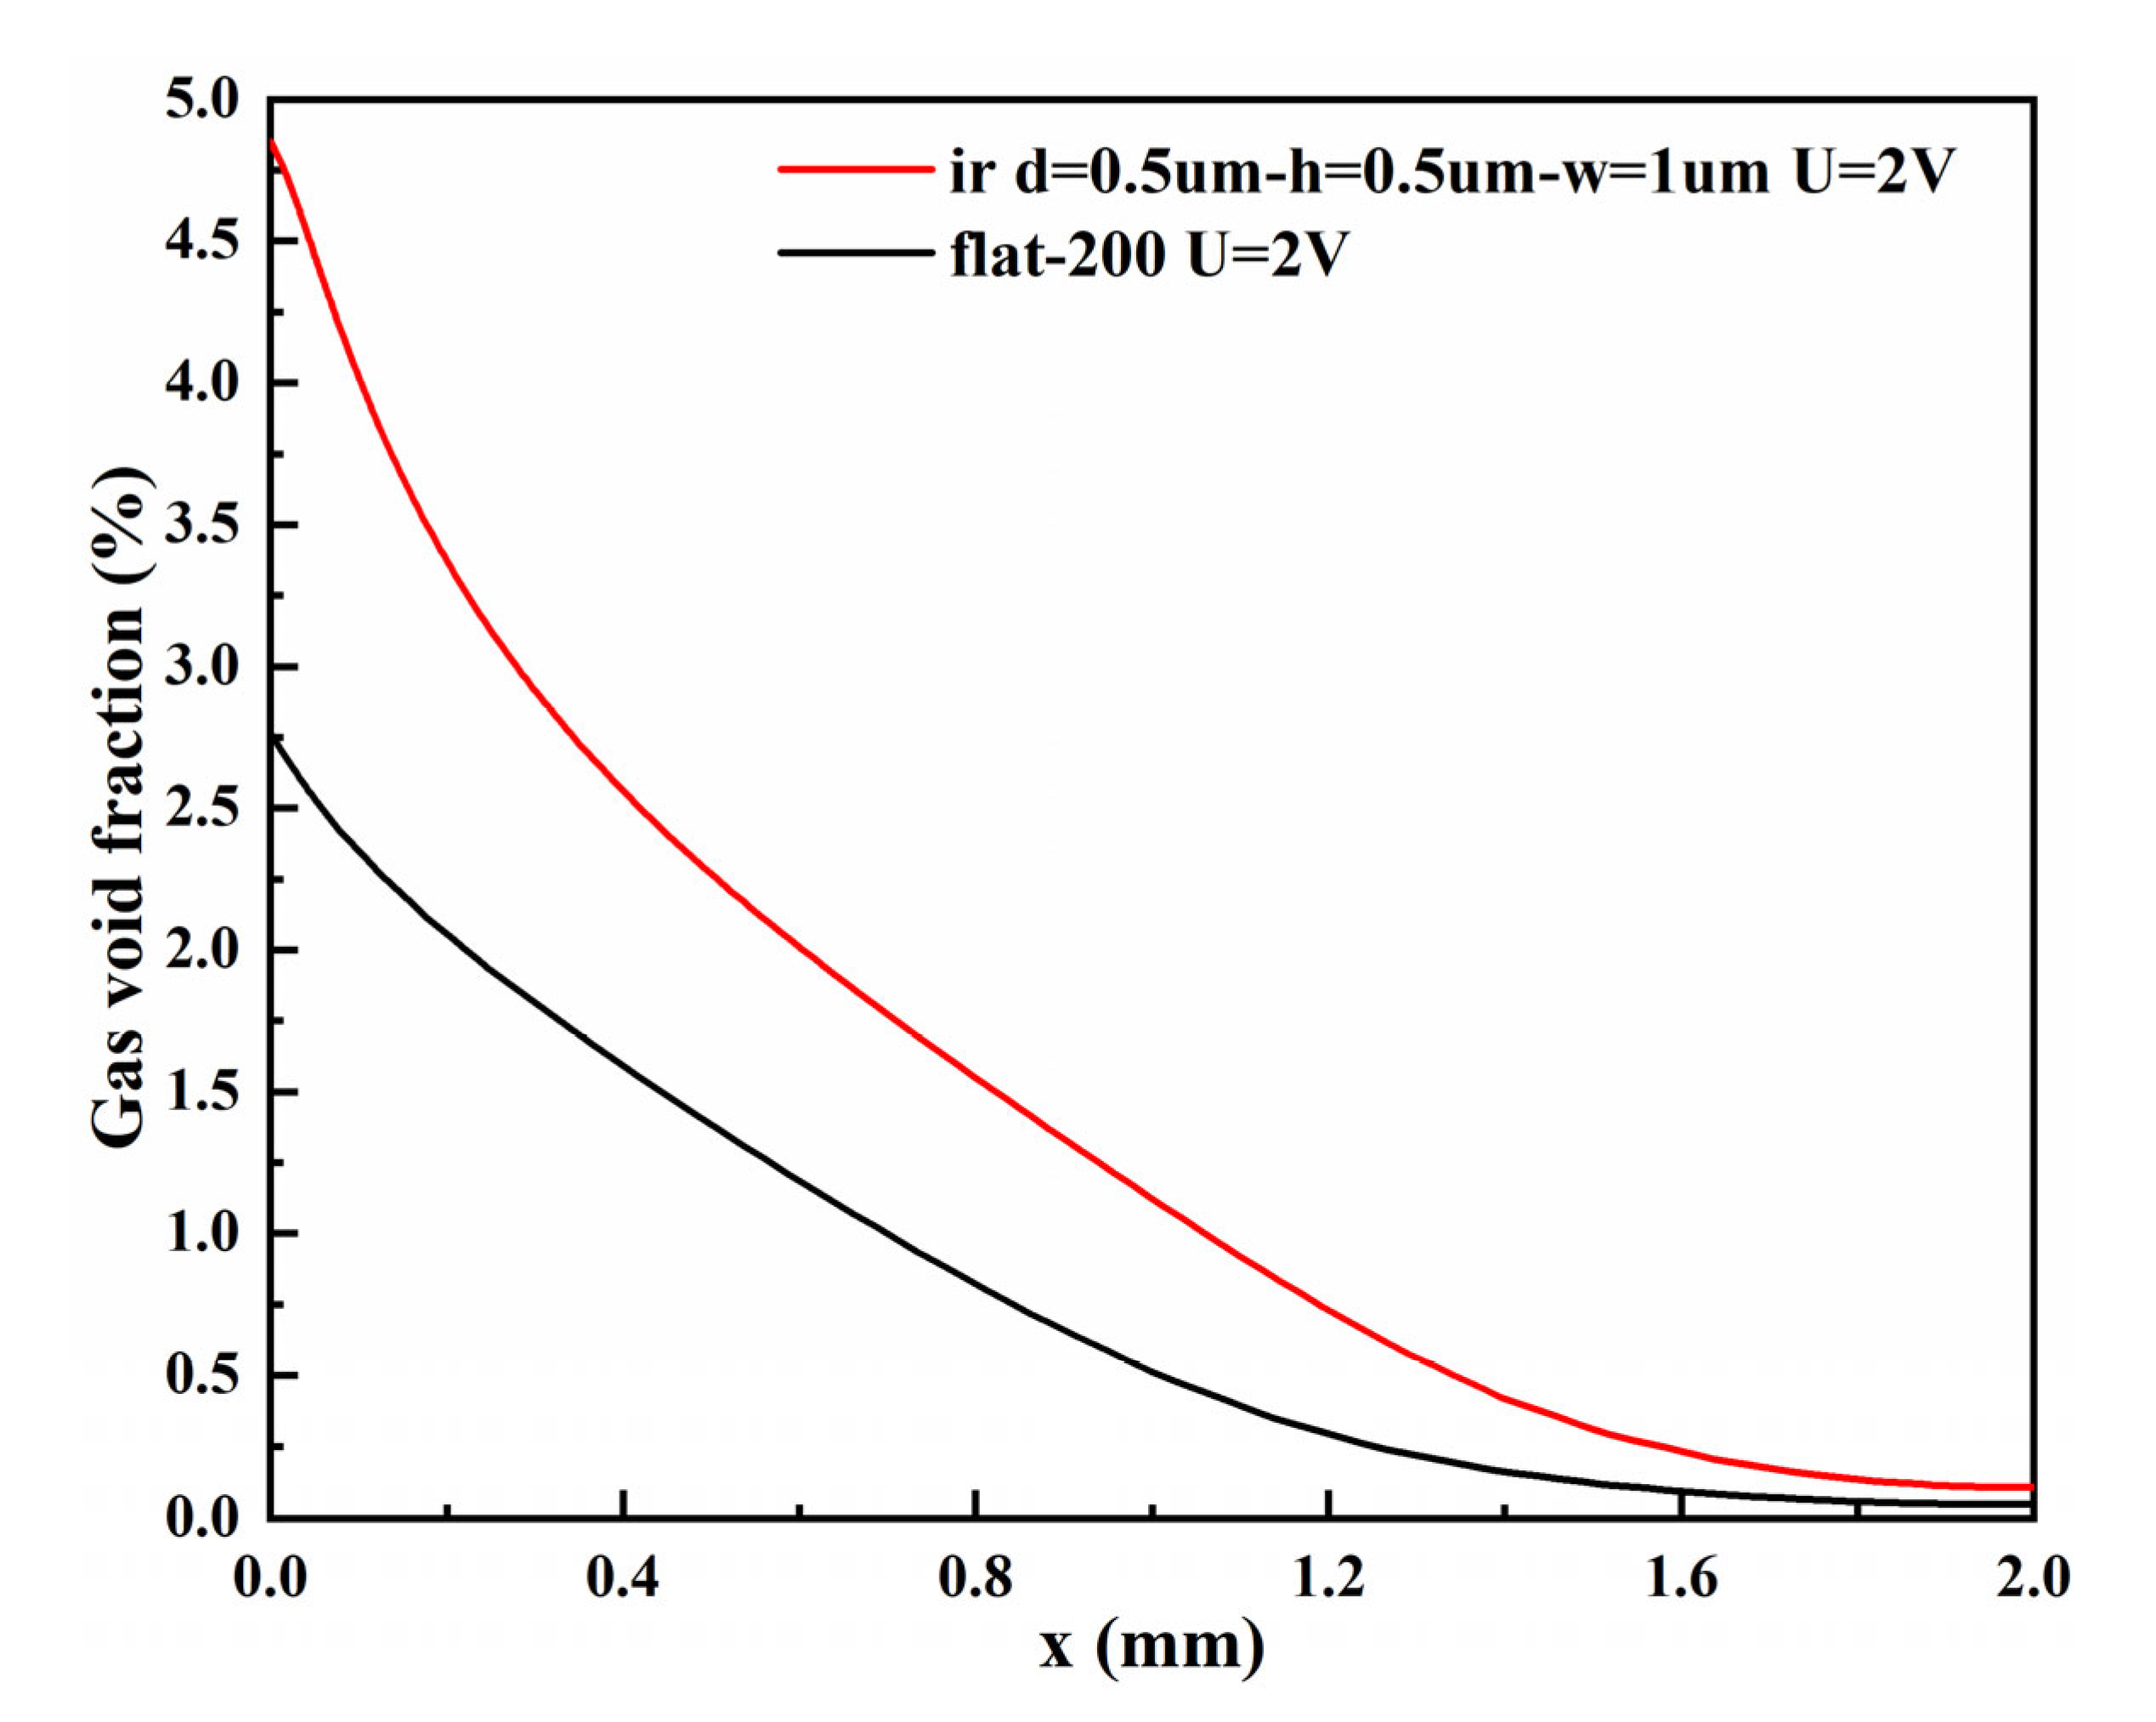
- The bubble layers produced by the micro-nano surface and vertical flat electrode are parabolic distributed. However, compared with the vertical flat electrode, the void fraction produced by the micro-nano surface electrode is higher, and the bubble layer is thicker at any voltage.
- The total length of micro-nano structural units affects the cell voltage, cathode overpotential, and void fraction. With the increase in the total length of micro-nano structural units, the catalytic area increases, the cell voltage and overpotential decrease, and the void fraction increases. Taking rectangular structural units with a distance, height, and width of 0.5 µm, 0.5 µm, and 1 µm, respectively, as an example, the total length of the corresponding micro-nano surface electrode is three times that of the vertical flat electrode. However, compared with the vertical flat electrode, the cathode overpotential decreases by 65.31% and the void fraction increases by 54.53%.
Supplementary Materials
Author Contributions
Funding
Institutional Review Board Statement
Informed Consent Statement
Data Availability Statement
Conflicts of Interest
Nomenclature
| , , | constants in turbulence model, (-) | cathodic charge transfer coefficient, (-) | |
| drag coefficient, (-) | α | void fraction, (-) | |
| bubble diameter, (m) | turbulent viscosity, (Pa s) | ||
| F | Faraday constant, (C mol−1) | µ | viscosity, (Pa s) |
| Fk | volume force, (N m−3) | ρ | density, (kg m−3) |
| g | gravitational acceleration, (m s−2) | η | overpotential, (V) |
| j | current density, (A m−2) | σ | electrolyte conductivity, (S m−1) |
| j0 | exchange current density, (A m−2) | ε | turbulent dissipation rate, (m2 s−3) |
| k | turbulent kinetic energy, (m2 s−2) | φ | electrical potential, (V) |
| Mg | molar mass of the gas (kg mol−1) | τ | stress tensor, (N m−2) |
| n | number of transferred electrons, (-) | Subscripts | |
| p | pressure, (Pa) | l | liquid phase |
| R | universal gas constant, (J mol−1 K−1) | g | gas phase |
| Re | Reynolds number, (-) | Abbreviations | |
| u | velocity, (m s−1) | AWE | alkaline water electrolyzer |
| T | temperature, (°C) | KOH | potassium hydroxide |
| x, y | spatial coordinates, (m) | HER | hydrogen evolution reaction |
| Greek symbols | OER | oxygen evolution reaction | |
| anodic charge transfer coefficient, (-) | CFD | computational fluid dynamics | |
References
- Luo, Y.; Zhang, Z.; Chhowalla, M.; Liu, B. Recent advances in design of electrocatalysts for high-current-density water splitting. Adv. Mater. 2022, 34, 2108133. [Google Scholar] [CrossRef] [PubMed]
- Darband, G.B.; Aliofkhazraei, M.; Shanmugam, S. Recent advances in methods and technologies for enhancing bubble detachment during electrochemical water splitting. Renew. Sustain. Energy Rev. 2019, 114, 109300. [Google Scholar] [CrossRef]
- Wang, J.; Xu, F.; Jin, H.; Chen, Y.; Wang, Y. Non-noble metal-based carbon composites in hydrogen evolution reaction: Fundamentals to applications. Adv. Mater. 2017, 29, 1605838. [Google Scholar] [CrossRef] [PubMed]
- Mei, B.; Barnoon, P.; Toghraie, D.; Su, C.-H.; Nguyen, H.C.; Khan, A. Energy, exergy, environmental and economic analyzes (4E) and multi-objective optimization of a PEM fuel cell equipped with coolant channels. Renew. Sustain. Energy Rev. 2022, 157, 112021. [Google Scholar] [CrossRef]
- Burton, N.A.; Padilla, R.V.; Rose, A.; Habibullah, H. Increasing the efficiency of hydrogen production from solar powered water electrolysis. Renew. Sustain. Energy Rev. 2021, 135, 110255. [Google Scholar] [CrossRef]
- Jia, Y.; Zeng, M.; Barnoon, P.; Toghraie, D. CFD simulation of time-dependent oxygen production in a manifold electrolyzer using a two-phase model. Int. Commun. Heat Mass Transf. 2021, 126, 105446. [Google Scholar] [CrossRef]
- Zhang, H.; Maijenburg, A.W.; Li, X.; Schweizer, S.L.; Wehrspohn, R.B. Bifunctional heterostructured transition metal phosphides for efficient electrochemical water splitting. Adv. Funct. Mater. 2020, 30, 2003261. [Google Scholar] [CrossRef]
- Morales-Guio, C.G.; Stern, L.A.; Hu, X. Nanostructured hydrotreating catalysts for electrochemical hydrogen evolution. Chem. Soc. Rev. 2014, 43, 6555–6569. [Google Scholar] [CrossRef] [Green Version]
- Darband, G.B.; Aliofkhazraei, M.; Hyun, S.; Rouhaghdam, A.S.; Shanmugam, S. Electrodeposited Ni-Co-P hierarchical nanostructure as a cost-effective and durable electrocatalyst with superior activity for bifunctional water splitting. J. Power Sources 2019, 429, 156–167. [Google Scholar] [CrossRef]
- Barati Darband, G.; Aliofkhazraei, M.; Sabour Rouhaghdam, A. Three-dimensional porous Ni-CNT composite nanocones as high performance electrocatalysts for hydrogen evolution reaction. J. Electroanal. Chem. 2018, 829, 194–207. [Google Scholar] [CrossRef]
- Brown, D.E.; Mahmood, M.N.; Turner, A.K.; Hall, S.M.; Fogarty, P.O. Low overvoltage electrocatalysts for hydrogen evolving electrodes. Int. J. Hydrogen Energy 1982, 7, 405–410. [Google Scholar] [CrossRef]
- Zhang, W.; Jia, Q.; Liang, H.; Cui, L.; Wei, D.; Liu, J. Iron doped Ni3S2 nanorods directly grown on FeNi3 foam as an efficient bifunctional catalyst for overall water splitting. Chem. Eng. J. 2020, 396, 125315. [Google Scholar] [CrossRef]
- Wang, Y.; Qian, G.; Xu, Q.; Zhang, H.; Shen, F.; Luo, L.; Yin, S. Industrially promising IrNi-FeNi3 hybrid nanosheets for overall water splitting catalysis at large current density. Appl. Catal. B Environ. 2021, 286, 119881. [Google Scholar] [CrossRef]
- Angulo, A.; van der Linde, P.; Gardeniers, H.; Modestino, M.; Fernández Rivas, D. Influence of bubbles on the energy conversion efficiency of electrochemical reactors. Joule 2020, 4, 555–579. [Google Scholar] [CrossRef] [Green Version]
- Rodríguez, J.; Amores, E. CFD modeling and experimental validation of an alkaline water electrolysis cell for hydrogen production. Processes 2020, 8, 1634. [Google Scholar] [CrossRef]
- Zarghamia, A.; Deena, N.G.; Vreman, A.W. CFD modeling of multiphase flow in an alkaline water electrolyzer. Chem. Eng. Sci. 2020, 227, 115926. [Google Scholar] [CrossRef]
- Liu, L.; Cai, W.; Chen, Y.; Wang, Y. Fluid dynamics and mass transfer study of electrochemical oxidation by CFD prediction and experimental validation. Ind. Eng. Chem. Res. 2018, 57, 6493–6504. [Google Scholar] [CrossRef]
- Stewart, K.; Lair, L.; De La Torre, B.; Phan, N.L.; Das, R.; Gonzalez, D.; Lo, R.C.; Yang, Y. Modeling and optimization of an alkaline water electrolysis for hydrogen production. In Proceedings of the 2021 IEEE Green Energy and Smart Systems Conference (IGESSC), Long Beach, CA, USA, 1–2 November 2021; pp. 1–6. [Google Scholar]
- Wosiak, G.; Silva, J.D.; Sena, S.S.; Carneiro-Neto, E.B.; Lopes, M.C.; Pereira, E. Investigation of the influence of the void fraction on the energy consumption of a vertical electrolyser under natural convection. J. Environ. Chem. Eng. 2022, 10, 107577. [Google Scholar] [CrossRef]
- Wosiak, G.; da Silva, J.; Sena, S.S.; de Andrade, R.N.; Pereira, E. CFD simulation and experimental comparison of bubble-induced convection during electrochemical water splitting. Chem. Eng. J. 2022, 433, 133194. [Google Scholar] [CrossRef]
- Pu, Z.; Liu, T.; Amiinu, I.S.; Cheng, R.; Wang, P.; Zhang, C.; Ji, P.; Hu, W.; Liu, J.; Mu, S. Transition-metal phosphides: Activity origin, energy-related electrocatalysis applications, and synthetic strategies. Adv. Funct. Mater. 2020, 30, 2004009. [Google Scholar] [CrossRef]
- Cao, J.; Zhou, J.; Zhang, Y.; Wang, Y.; Liu, X. Dominating role of aligned MoS2/Ni3S2 nanoarrays supported on three-dimensional Ni Foam with hydrophilic interface for highly enhanced hydrogen evolution reaction. ACS Appl. Mater. Interfaces 2018, 10, 1752–1760. [Google Scholar] [CrossRef]
- Liu, C.; Gong, T.; Zhang, J.; Zheng, X.; Mao, J.; Liu, H.; Li, Y.; Hao, Q. Engineering Ni2P-NiSe2 heterostructure interface for highly efficient alkaline hydrogen evolution. Appl. Catal. B Environ. 2020, 262, 118245. [Google Scholar] [CrossRef]
- Zhang, G.; Feng, Y.-S.; Lu, W.-T.; He, D.; Wang, C.-Y.; Li, Y.-K.; Wang, X.-Y.; Cao, F.-F. Enhanced catalysis of electrochemical overall water splitting in alkaline media by Fe doping in Ni3S2 nanosheet Arrays. ACS Catal. 2018, 8, 5431–5441. [Google Scholar] [CrossRef]
- Qu, S.; Huang, J.; Yu, J.; Chen, G.; Hu, W.; Yin, M.; Zhang, R.; Chu, S.; Li, C. Ni3S2 nanosheet flowers decorated with CdS quantum dots as a highly active electrocatalysis electrode for synergistic water splitting. ACS Appl. Mater. Interfaces 2017, 9, 29660–29668. [Google Scholar] [CrossRef] [PubMed]
- Huang, H.; Yan, M.; Yang, C.; He, H.; Jiang, Q.; Yang, L.; Lu, Z.; Sun, Z.; Xu, X.; Bando, Y.; et al. Graphene nanoarchitectonics: Recent advances in graphene-based electrocatalysts for hydrogen evolution reaction. Adv. Mater. 2019, 31, e1903415. [Google Scholar] [CrossRef] [PubMed]
- Xia, Y.; Zhang, Z.; Gao, M.; Zheng, Y.; Chen, L.; Si, Y.; Mei, S. Enhancement in photoelectric performance of dye-sensitized solar cells with inverted pyramid structures based on nanoimprint lithography. AIP Adv. 2021, 11, 075103. [Google Scholar] [CrossRef]
- Amores, E.; Ruiz, J.R.; Rodríguez, C.M.; Escribano, P.G. Study of an alkaline electrolyzer powered by renewable energy. In Proceedings of the COMSOL Conference, Stuttgart, Germany, 26–28 October 2011; COMSOL AB: Burlington, VT, USA, 2011. [Google Scholar]
- Alkaline Electrolyzer. Available online: https://cn.comsol.com/model/download/981821/models.fce.alkaline_electrolyzer.pdf (accessed on 14 December 2021).
- Hreiz, R.; Abdelouahed, L.; Fünfschilling, D.; Lapicque, F. Electrogenerated bubbles induced convection in narrow vertical cells: A review. Chem. Eng. Res. Des. 2015, 100, 268–281. [Google Scholar] [CrossRef]
- Hreiz, R.; Abdelouahed, L.; Fünfschilling, D.; Lapicque, F. Electrogenerated bubbles induced convection in narrow vertical cells: PIV measurements and Euler–Lagrange CFD simulation. Chem. Eng. Sci. 2015, 134, 138–152. [Google Scholar] [CrossRef]
- Rivera, F.F.; Pérez, T.; Castañeda, L.F.; Nava, J.L. Mathematical modeling and simulation of electrochemical reactors: A critical review. Chem. Eng. Sci. 2021, 239, 116622. [Google Scholar] [CrossRef]
- Le Bideau, D.; Mandin, P.; Benbouzid, M.; Kim, M.; Sellier, M.; Ganci, F.; Inguanta, R. Eulerian two-fluid model of alkaline water electrolysis for hydrogen production. Energies 2020, 13, 3394. [Google Scholar] [CrossRef]
- El-Askary, W.A.; Sakr, I.M.; Ibrahim, K.A.; Balabel, A. Hydrodynamics characteristics of hydrogen evolution process through electrolysis: Numerical and experimental studies. Energy 2015, 90, 722–737. [Google Scholar] [CrossRef]
- Liu, C.L.; Sun, Z.; Lu, G.M.; Yu, J.G. Hydrodynamic characteristics of the two-phase flow field at gas-evolving electrodes: Numerical and experimental studies. R. Soc. Open Sci. 2018, 5, 171255. [Google Scholar] [CrossRef] [PubMed] [Green Version]
- Boissonneau, P.; Byrne, P. An experimental investigation of bubble-induced free convection in a small electrochemical cell. J. Appl. Electrochem. 2000, 30, 767–775. [Google Scholar] [CrossRef]
- Aldas, K.; Pehlivanoglu, N.; Mat, M. Numerical and experimental investigation of two-phase flow in an electrochemical cell. Int. J. Hydrogen Energy 2008, 33, 3668–3675. [Google Scholar] [CrossRef]
- Le Bideau, D.; Mandin, P.; Benbouzid, M.; Kim, M.; Sellier, M. Review of necessary thermophysical properties and their sensivities with temperature and electrolyte mass fractions for alkaline water electrolysis multiphysics modelling. Int. J. Hydrogen Energy 2019, 44, 4553–4569. [Google Scholar] [CrossRef]
- Mandin, P.; Hamburger, J.; Bessou, S.; Picard, G. Modelling and calculation of the current density distribution evolution at vertical gas-evolving electrodes. Electrochim. Acta 2005, 51, 1140–1156. [Google Scholar] [CrossRef]
- Electrochemistry Module User’s Guide; COMSOL Multiphysics® v6.0; COMSOL AB: Stockholm, Sweden, 2021.
- Pfaffe, M. Which Current Distribution Interface Do I Use? Available online: https://www.comsol.com/blogs/current-distribution-interface-use/?setlang=1 (accessed on 10 February 2014).
- Dickinson, E. Theory of Current Distribution. Available online: https://www.comsol.com/blogs/theory-current-distribution/?setlang=1 (accessed on 7 February 2014).
- Mat, M.; Aldas, K. Application of a two-phase flow model for natural convection in an electrochemical cell. Int. J. Hydrogen Energy 2005, 30, 411–420. [Google Scholar] [CrossRef]
- CFD Module User’s Guide; COMSOL Multiphysics® v6.0; COMSOL AB: Stockholm, Sweden, 2020.
- Le Bideau, D.; Chocron, O.; Mandin, P.; Kiener, P.; Benbouzid, M.; Sellier, M.; Kim, M.; Ganci, F.; Inguanta, R. Evolutionary design optimization of an alkaline water electrolysis cell for hydrogen production. Appl. Sci. 2020, 10, 8425. [Google Scholar] [CrossRef]
- Marfaing, O.; Guingo, M.; Laviéville, J.; Bois, G.; Méchitoua, N.; Mérigoux, N.; Mimouni, S. An analytical relation for the void fraction distribution in a fully developed bubbly flow in a vertical pipe. Chem. Eng. Sci. 2016, 152, 579–585. [Google Scholar] [CrossRef] [Green Version]
- Li, Y.; Zhang, H.; Xu, T.; Lu, Z.; Wu, X.; Wan, P.; Sun, X.; Jiang, L. Under-water superaerophobic pine-shaped Pt nanoarray electrode for ultrahigh-performance hydrogen evolution. Adv. Funct. Mater. 2015, 25, 1737–1744. [Google Scholar] [CrossRef]
- Lu, Z.; Zhu, W.; Yu, X.; Zhang, H.; Li, Y.; Sun, X.; Wang, X.; Wang, H.; Wang, J.; Luo, J.; et al. Ultrahigh hydrogen evolution performance of under-water “superaerophobic” MoS(2) nanostructured electrodes. Adv. Mater. 2014, 26, 2683–2687. [Google Scholar] [CrossRef] [PubMed]


| Symbol | Value | Unit | Description |
|---|---|---|---|
| R | 8.314 | J mol−1 K−1 | Universal gas constant |
| F | 96,485.3 | C mol−1 | Faraday constant |
| WH2 | 2 | mm | Hydrogen compartment width |
| Wsep | 1 | mm | Diaphragm width |
| WO2 | 2 | mm | Oxygen compartment width |
| Helec | 1 | cm | Electrode height |
| Wr | 0.5, 1 | µm | Structure width |
| Hr | 0.5, 1 | µm | Structure height |
| Dr | 0.5, 1 | µm | Structure distance |
| dbubble | 50, 200 | µm | Bubble diameter |
| T | 70 | °C | Operating temperature |
| p | 1 | atm | Pressure |
| i0H2 | 100 | A m−2 | Exchange current density, hydrogen oxidation |
| i0O2 | 1 | A m−2 | Exchange current density, oxygen reduction |
| MH2O | 18 | g mol−1 | Water molar mass |
| MH2 | 2 | g mol−1 | Hydrogen molar mass |
| MO2 | 32 | g mol−1 | Oxygen molar mass |
| MOH | 17 | g mol−1 | Hydroxide molar mass |
| cKOH | 3 | M | Electrolyte concentration |
| vin | 0.2 | m s−1 | Average inlet velocity |
| Graphic Parameters (µm) | Overpotential (mV) | ||||||||
|---|---|---|---|---|---|---|---|---|---|
| Distance | Height | Width | p | r | t | ip | ir | it | flat-200 |
| - | - | - | - | - | - | - | - | 31.02 | |
| 1 | 1 | 1 | 19.70 | 16.04 | 17.96 | 19.70 | 16.04 | 17.96 | - |
| 1 | 1 | 0.5 | 26.05 | 21.19 | 24.13 | 26.05 | 21.19 | 24.13 | - |
| 1 | 0.5 | 1 | 15.72 | 13.79 | 14.76 | 15.72 | 13.79 | 14.76 | - |
| 1 | 0.5 | 0.5 | 22.45 | 19.15 | 20.92 | 22.453 | 19.15 | 20.92 | - |
| 0.5 | 1 | 1 | 17.54 | 13.79 | 15.72 | 17.54 | 13.79 | 15.72 | - |
| 0.5 | 1 | 0.5 | 24.72 | 19.15 | 22.45 | 24.72 | 19.15 | 22.45 | - |
| 0.5 | 0.5 | 1 | 12.58 | 10.76 | 11.67 | 12.58 | 10.76 | 11.67 | - |
| 0.5 | 0.5 | 0.5 | 19.70 | 16.04 | 17.96 | 19.70 | 16.04 | 17.96 | - |
| Graphic Parameters (µm) | Total Length of Micro-Nano Structure Units (mm) | Overpotential (mV) | ||||||||
|---|---|---|---|---|---|---|---|---|---|---|
| Distance | Height | Width | p/ip | r/ir | t/it | flat-200 | p | r | t | flat-200 |
| - | - | - | - | - | - | 10 | - | - | 31.02 | |
| 1 | 1 | 1 | 16.18 | 20.00 | 17.81 | - | 19.70 | 16.04 | 17.96 | - |
| 1 | 1 | 0.5 | 12.07 | 15.00 | 13.09 | - | 26.05 | 21.19 | 24.13 | - |
| 1 | 0.5 | 1 | 20.41 | 23.33 | 21.77 | - | 15.72 | 13.79 | 14.76 | - |
| 1 | 0.5 | 0.5 | 14.12 | 16.67 | 15.21 | - | 22.453 | 19.15 | 20.92 | - |
| 0.5 | 1 | 1 | 18.24 | 23.33 | 20.41 | - | 17.54 | 13.79 | 15.72 | - |
| 0.5 | 1 | 0.5 | 12.76 | 16.67 | 14.12 | - | 24.72 | 19.15 | 22.45 | - |
| 0.5 | 0.5 | 1 | 25.62 | 30.00 | 27.66 | - | 12.58 | 10.76 | 11.67 | - |
| 0.5 | 0.5 | 0.5 | 16.18 | 20.00 | 17.81 | - | 19.70 | 16.04 | 17.96 | - |
| Graphic Parameters (µm) | Average Void Fraction (%) | ||||||||
|---|---|---|---|---|---|---|---|---|---|
| Distance | Height | Width | p | r | t | ip | ir | it | flat-200 |
| - | - | - | - | - | - | - | - | - | 2.15 |
| 1 | 1 | 1 | 3.00 | 3.11 | 3.06 | 3.02 | 3.12 | 3.06 | - |
| 1 | 1 | 0.5 | 2.84 | 2.97 | 2.90 | 2.85 | 2.96 | 2.90 | - |
| 1 | 0.5 | 1 | 3.12 | 3.20 | 3.16 | 3.12 | 3.19 | 3.14 | - |
| 1 | 0.5 | 0.5 | 2.93 | 3.02 | 2.97 | 2.94 | 3.01 | 2.97 | - |
| 0.5 | 1 | 1 | 3.06 | 3.19 | 3.13 | 3.08 | 3.20 | 3.13 | - |
| 0.5 | 1 | 0.5 | 2.88 | 3.00 | 2.94 | 2.88 | 3.02 | 2.93 | - |
| 0.5 | 0.5 | 1 | 3.24 | 3.32 | 3.29 | 3.26 | 3.33 | 3.29 | - |
| 0.5 | 0.5 | 0.5 | 3.00 | 3.12 | 3.06 | 3.02 | 3.12 | 3.06 | - |
Publisher’s Note: MDPI stays neutral with regard to jurisdictional claims in published maps and institutional affiliations. |
© 2022 by the authors. Licensee MDPI, Basel, Switzerland. This article is an open access article distributed under the terms and conditions of the Creative Commons Attribution (CC BY) license (https://creativecommons.org/licenses/by/4.0/).
Share and Cite
Xia, Y.; Gao, M.; Yu, J.; Si, Y.; Chen, L.; Mei, S. Numerical Study on Hydrodynamic Characteristics and Electrochemical Performance of Alkaline Water Electrolyzer by Micro-Nano Surface Electrode. Materials 2022, 15, 4927. https://doi.org/10.3390/ma15144927
Xia Y, Gao M, Yu J, Si Y, Chen L, Mei S. Numerical Study on Hydrodynamic Characteristics and Electrochemical Performance of Alkaline Water Electrolyzer by Micro-Nano Surface Electrode. Materials. 2022; 15(14):4927. https://doi.org/10.3390/ma15144927
Chicago/Turabian StyleXia, Ye, Mengyu Gao, Jincheng Yu, Yang Si, Laijun Chen, and Shengwei Mei. 2022. "Numerical Study on Hydrodynamic Characteristics and Electrochemical Performance of Alkaline Water Electrolyzer by Micro-Nano Surface Electrode" Materials 15, no. 14: 4927. https://doi.org/10.3390/ma15144927
APA StyleXia, Y., Gao, M., Yu, J., Si, Y., Chen, L., & Mei, S. (2022). Numerical Study on Hydrodynamic Characteristics and Electrochemical Performance of Alkaline Water Electrolyzer by Micro-Nano Surface Electrode. Materials, 15(14), 4927. https://doi.org/10.3390/ma15144927