Abstract
Capacity degradation and voltage fade of Li2MnO3 during cycling are the limiting factors for its practical use as a high-capacity lithium-ion battery cathode. Here, the simulated amorphisation and recrystallisation (A + R) technique is used, for generating nanoporous Li2MnO3 models of different lattice sizes (73 Å and 75 Å), under molecular dynamics (MD) simulations. Charging was carried out by removing oxygen and lithium ions, with oxygen charge compensated for, to restrain the release of oxygen, resulting in Li2−xMnO3−x composites. Detailed analysis of these composites reveals that the models crystallised into multiple grains, with grain boundaries increasing with decreasing Li/O content, and the complex internal microstructures depicted a wealth of defects, leading to the evolution of distorted cubic spinel LiMn2O4, Li2MnO3, and LiMnO2 polymorphs. The X-ray diffraction (XRD) patterns for the simulated systems revealed peak broadening in comparison with calculated XRD, also, the emergence of peak 2Θ ~ 18–25° and peak 2Θ ~ 29° were associated with the spinel phase. Lithium ions diffuse better on the nanoporous 73 Å structures than on the nanoporous 75 Å structures. Particularly, the Li1.00MnO2.00 shows a high diffusion coefficient value, compared to all concentrations. This study shed insights on the structural behaviour of Li2MnO3 cathodes during the charging mechanism, involving the concurrent removal of lithium and oxygen.
Keywords:
Li2MnO3; amorphisation; recrystallisation; nanoporous; charging; energy storage; lithium-ion battery 1. Introduction
Li-ion batteries, with high energy density, are highly desired for the realisation of electric vehicles and hybrid vehicles in the automotive sectors [1,2]. Owing to its high capacity of 459 mA·g−1, Li2MnO3 has been considered the most promising cathode material for next-generation lithium ion batteries (LIB) [3,4]. However, activation is required before operation in its crystalline form, and this results in low charge efficiency [5]. Contrarily, in its nanocrystalline form, Li2MnO3 is instinctively active due to the presence of manganese defects, which are absent in the bulk crystalline form; these defects act as a scaffold, thus maintaining the structural integrity during the cycling process [6]. Despite its high capacity, Li2MnO3 suffers from voltage fade, irreversible capacity loss, and poor rate capability, which hinder its practical use. These poor cycling behaviours are due to irreversible oxygen loss and phase transformation, resulting from the migration of manganese ions into the lithium layers [2,7,8]. The irreversible oxygen loss is considered the crucial element behind the inadequate performance of this material [2,8]. Furthermore, oxygen released during cycling can result in gas formation, thus, put the battery at risk of expansion and performance degradation [9]. Another feature that significantly contributes to these degradations is the deformation and cracking of the electrode during cycling, resulting from stress generated due to volume expansion during cycling [10,11].
To realise structural and electrochemical improvement of the Li2MnO3 electrode, various strategies have been considered [5,12,13]. One strategy is to form a composite with the spinel LiMn2O4 [14]. The layered-spinel composite, formed by mechanical milling, displayed an initial discharge capacity of approximately 400 mA·g−1, which was substantially retained during the cycling process [13]. The presence of the spinel phase in the composite help restricts the emission of oxygen from the Li2MnO3, and the layered component plays a significant role in storing excess lithium [12]. Cation doping has been used to stabilize the crystal structure of Li2MnO3 and, also, reduce voltage decay [12]. Xiang et al. investigated the effect of Al doping on the Mn site of the Li2MnO3, prepared via the sol-gel method, and their results revealed that Al doping restricted structural evolution during the first charge and, also increased the rate capacity and cycling stability [15].
Another approach that has gained significant interest is the introduction of oxygen vacancies by the thermal reduction in Li2MnO3 [16]. Low-temperature reduction in Li2MnO3 nanobelts resulted in a wealth of structural defects, including oxygen vacancies and stacking faults, which contributed to the discharge capacity and lithium diffusion enhancement [5]. Furthermore, nanosizing of Li2MnO3 has been considered, due to the advantage in particle size reduction enabling large surface exposure and a shortened diffusion path, thus, facilitating effective activation of the electrode material that might reduce voltage loss and promote Li-ion migration during cycling [6,7]. Lim et al. reported that Li2MnO3 nanoparticles, prepared by oxidation reaction, exhibited excellent electrochemical properties, compared to the Li2MnO3 bulk samples [17]. Accordingly, the nanoparticles delivered a high capacity of 302 mA·g−1 above 4.5 V and a discharge capacity of 236 mA·g−1, during the first charge–discharge cycle. Despite the efforts made, there are a lot of uncertainties regarding the structural and electrochemical behaviour of the layered Li2MnO3, during the cycling process [18].
In this work, the amorphisation and recrystallisation technique is used in carrying out the simulated synthesis of nanosized porous Li2MnO3 structures, in a quest to investigate their electrochemical behaviour and structural characterisation, during the charging process. The amorphisation and recrystallisation process requires one to generate an amorphous configuration, which is, then allowed to nucleate and recrystallise under material-specific conditions. This strategy is responsible for the spontaneous growth of crystals, exhibiting microstructural features observed experimentally, such as grain boundaries, point defects, and dislocations [19]. The second aspect of significant interest is the simulated charging process, involving the systematic removal of oxygen, together with lithium. This is mainly due to the lattice oxygen loss reported previously, which results in the migration of Mn into Li layers that contributes to structural degradation during the cycling of Li2MnO3 [5]. Since the charge compensation in Li2MnO3 is maintained by the oxidation of oxygen, during which manganese ions remain in the Mn4+ state [20,21], the charging of the generated structures will be carried out by extracting both lithium and oxygen ions, to mitigate the initial capacity loss [7]. Finally, the diffusion coefficients will be evaluated as an electrochemical performance factor that will help diagnose the severity of oxygen loss, during the cycling process of the Li2MnO3 cathode material.
2. Materials and Methods
In this section, we concisely discuss the methods used for generating the Li2MnO3 atomistic models. Accordingly, the potential models that were employed in describing the interactions of the Li+, Mn4+, and O2− ions, the amorphisation and recrystallisation technique, and the simulation codes responsible for the molecular dynamics simulations will, also, be discussed.
2.1. Potential Model and Simulation Codes
The molecular dynamics simulations presented here are based on the Born model of ionic solids, where the components in Li2MnO3 interact, via short-range and long-range coupled coulombic interactions. The potential parameters, used for describing the Li2MnO3 interactions, were obtained from Sayle et al. [6] and are capable of reproducing the lattice parameters of pyrolusite and ramsdellite polymorphs of MnO2, to within 3% and 4%, respectively [6]. The DL_POLY code [22] was used to perform all the molecular dynamics simulations, and the fundamental input files (CONFIG, FIELD, CONTROL) were generated via the METADISE [23] code.
2.2. Generation of the Li2MnO3 Atomistic Models
The initial step was to generate an amorphous configuration, which then acted as a ‘building block’ for the desired nanoporous models. Accordingly, a nanosphere with a desired radius was cleaved from the Li2MnO3 parent bulk. To maintain the stoichiometry of the system, lithium and oxygen ions were, randomly, extracted from the outer surface of the sphere, to facilitate charge neutrality. The cleaved nanoparticle consisted of 32,148 atoms, i.e., 10,716 Li+ ions, 5358 Mn4+ ions, and 16,074 O2− ions. The nanoparticle (9.73 nm) was then placed at the centre of a simulation cell, with dimensions sufficiently high (in all directions) to prohibit neighbouring nanoparticles from, first, attracting one another and, then, agglomerating upon contact. An amorphous configuration was achieved by heating the spherical system to 1850 K [6], within the NVE (constant number of atoms, constant volume, and constant energy) ensemble, as this temperature was sufficient to overcome the forces of attraction within the Li2MnO3 system.
The amorphous nanoparticle cell size was reduced, in all three dimensions (3D), to enable the nanoparticles to agglomerate in all three spatial directions, to facilitate the formation of nanoporous structures of different cell sizes (7.30 and 7.50 nm), as previously attained for MnO2 and LiMn2O4 electrodes [11,19,24]. These were carried out for 6 ns, with time steps set to 0.001 ps and Ewald precision of 5, while the Nosé–Hoover thermostat was used to maintain the 1850 K temperature and 50 Gpa under the NPT (constant number of atoms, constant pressure and constant temperature) ensemble. These conditions were sufficient to assist with the inter-nanocrystal attraction for ultimate agglomeration, within the time scale accessible to the MD simulations.
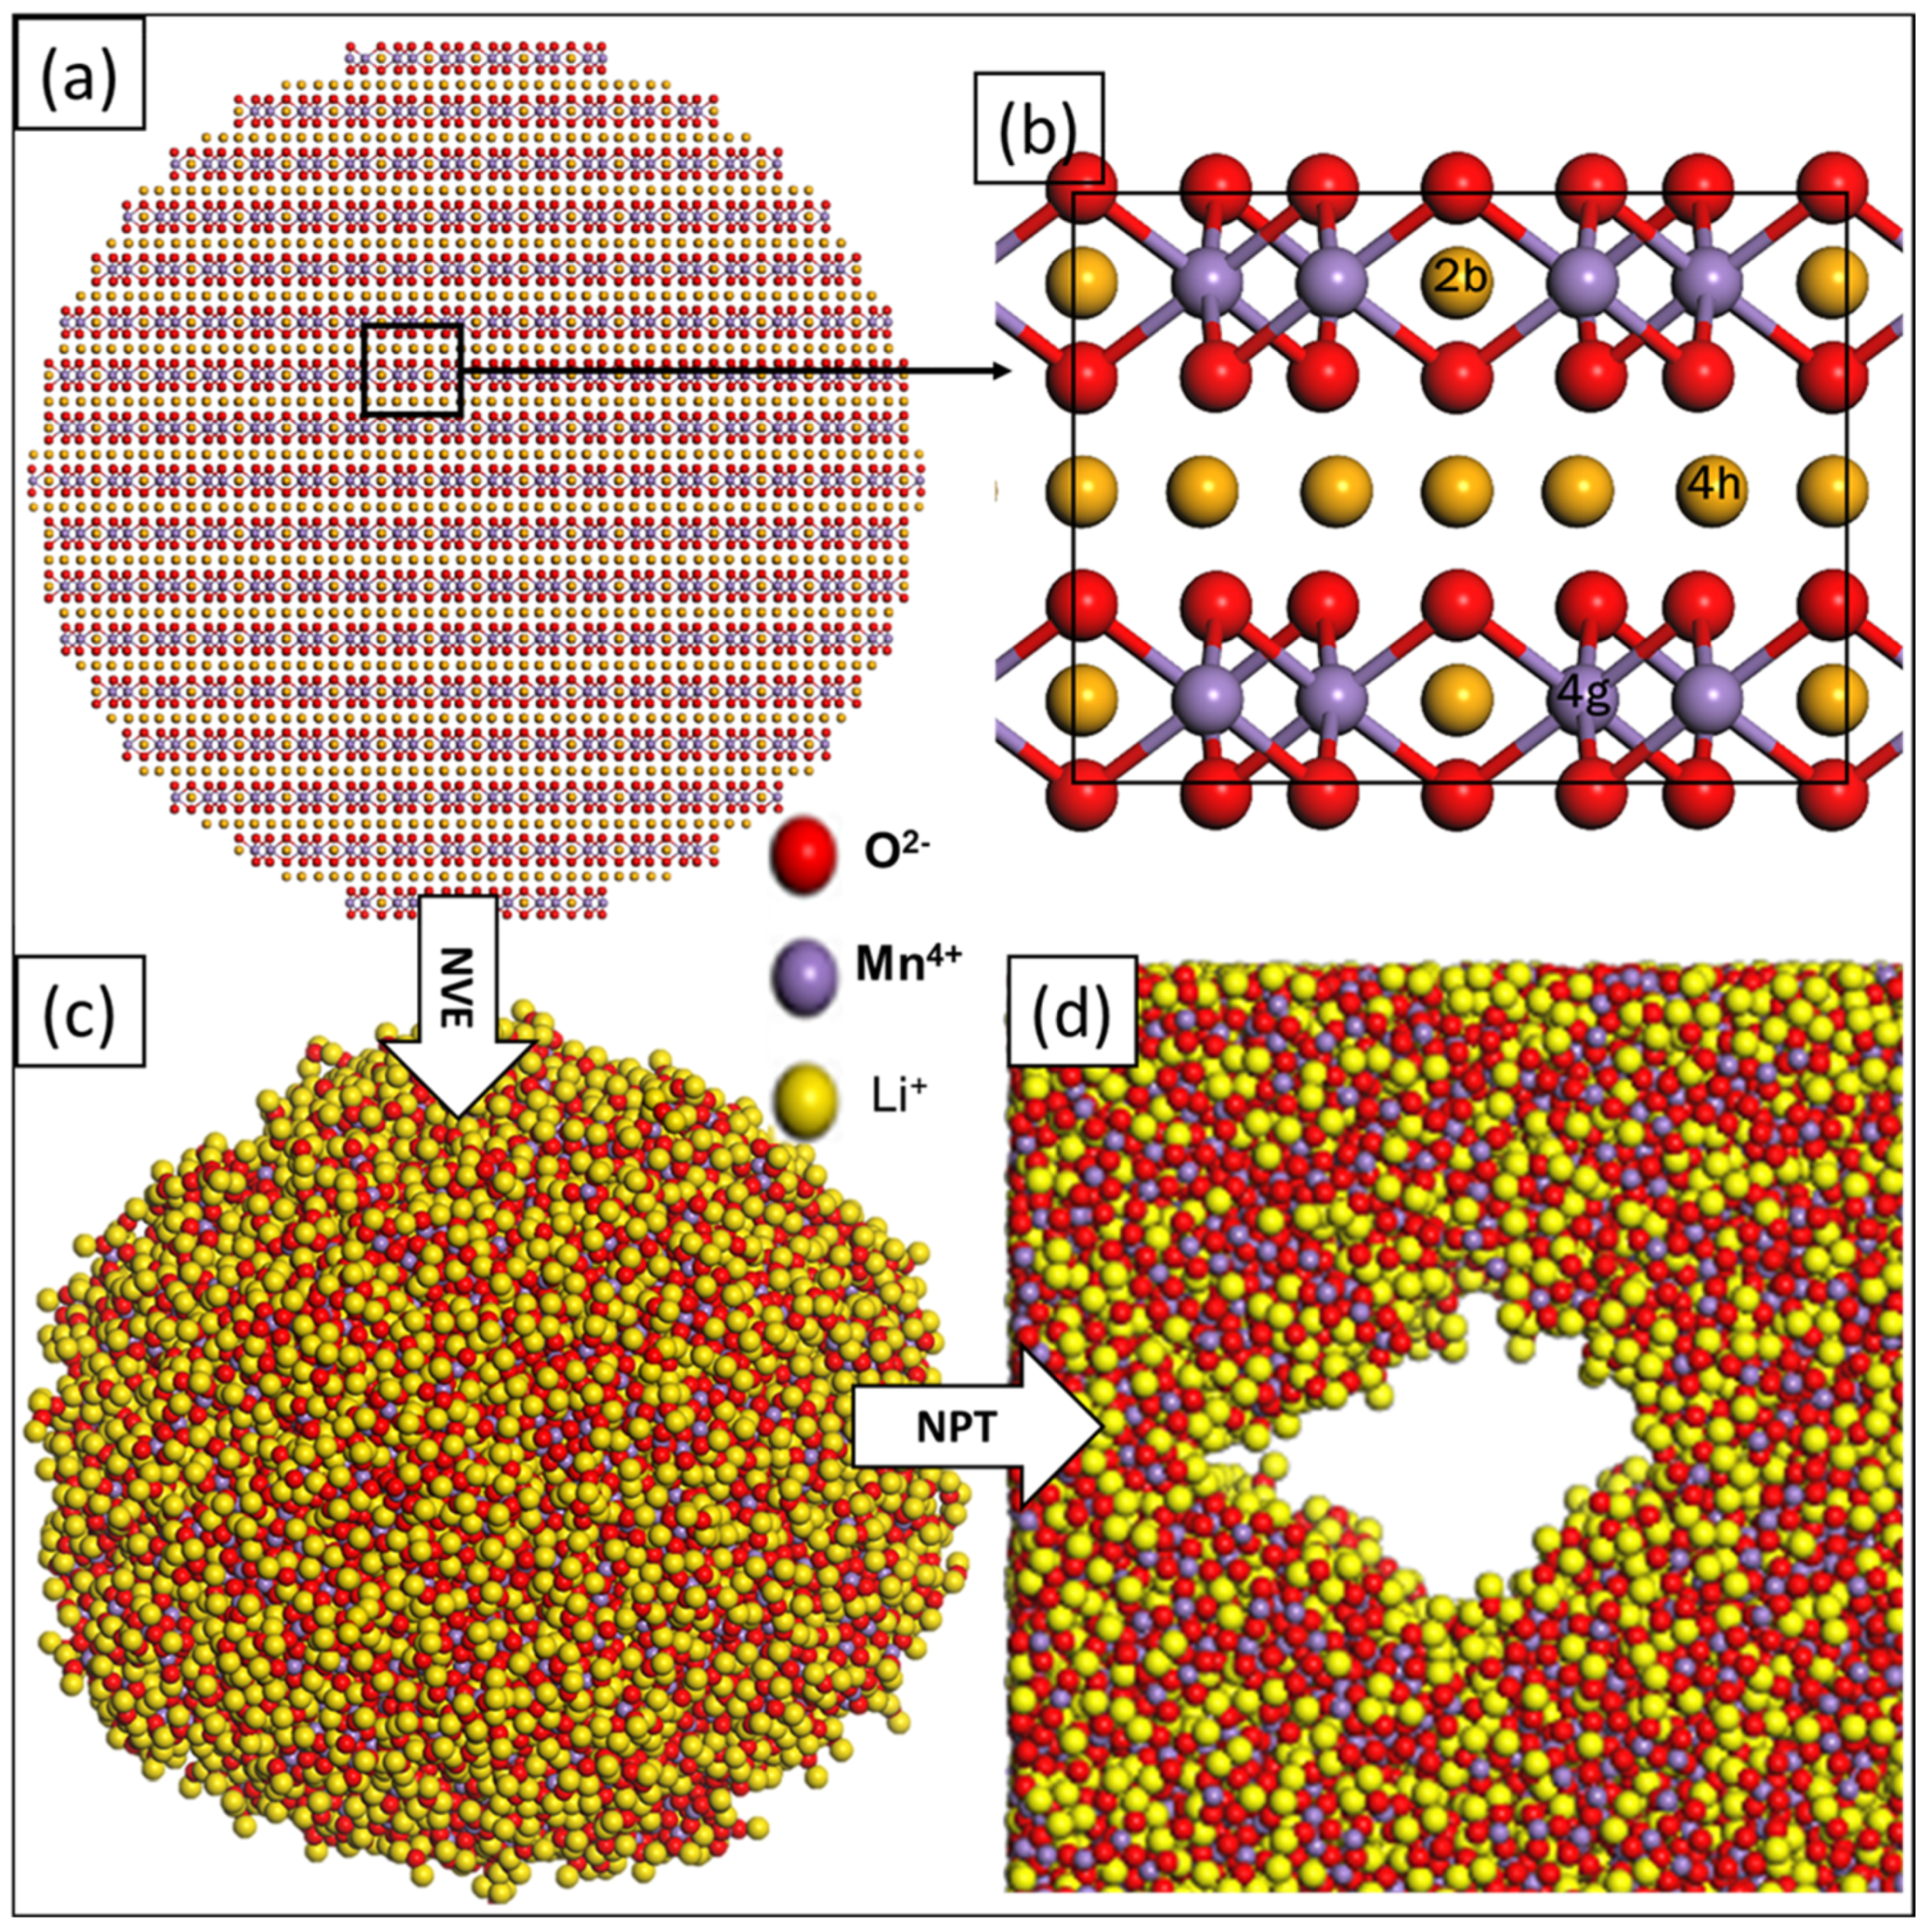
To recrystallise the models, molecular dynamics (MD) simulations were performed at 1850 K for 6 ns, using the NVT (constant number of atoms, constant volume, and constant temperature) ensemble. In an attempt to achieve low-energy models, the systems were allowed to cool, systematically, by gradually decreasing the temperature from 1850 K to 5 K. A schematic illustration of the Li2MnO3 synthesis procedure is presented in Figure 1 indicating (a) the spherical Li2MnO3 with 32,148 atoms cleaved from the parent bulk; a portion is magnified in (b), revealing the atomic arrangement conforming to a monoclinic structure with C2/m symmetry, while (c) is the amorphous precursor used as the building blocks for (d), nanoporous architectures.
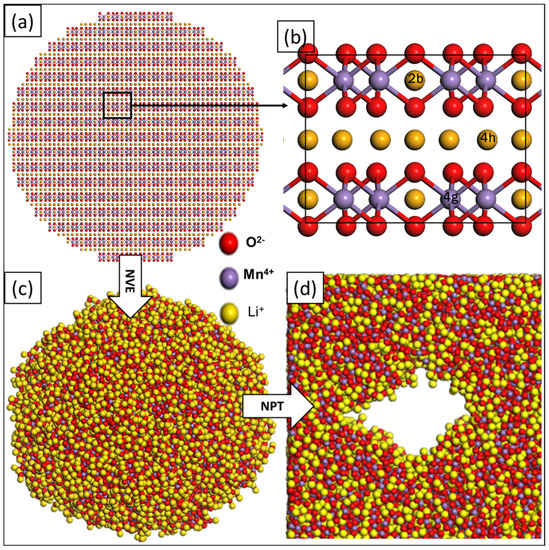
Figure 1.
Schematic diagrams representing (a) the spherical layered Li2MnO3, (b) magnified portion of (a) revealing the atomic arrangement of Li, Mn, and O, (c) amorphous nanosphere Li2MnO3, and (d) amorphous nanoporous Li2MnO3 configurations.
In order to mimic the charging process, the simulated synthesis of Li2−xMnO3−x (x = 0.25, 0.50, 0.75 and 1.0) systems was carried out, by, systematically, removing the same concentration of lithium and oxygen ions, simultaneously, from the outer surface of the amorphous nanoparticle and compensating the oxygen charge. This facilitated four systems with different lithium and oxygen contents, i.e., Li1.75MnO2.75, Li1.50MnO2.50, Li1.25MnO2.25, and Li1.00MnO2.00.
3. Results and Discussions
3.1. Radial Distribution Functions (RDFs)
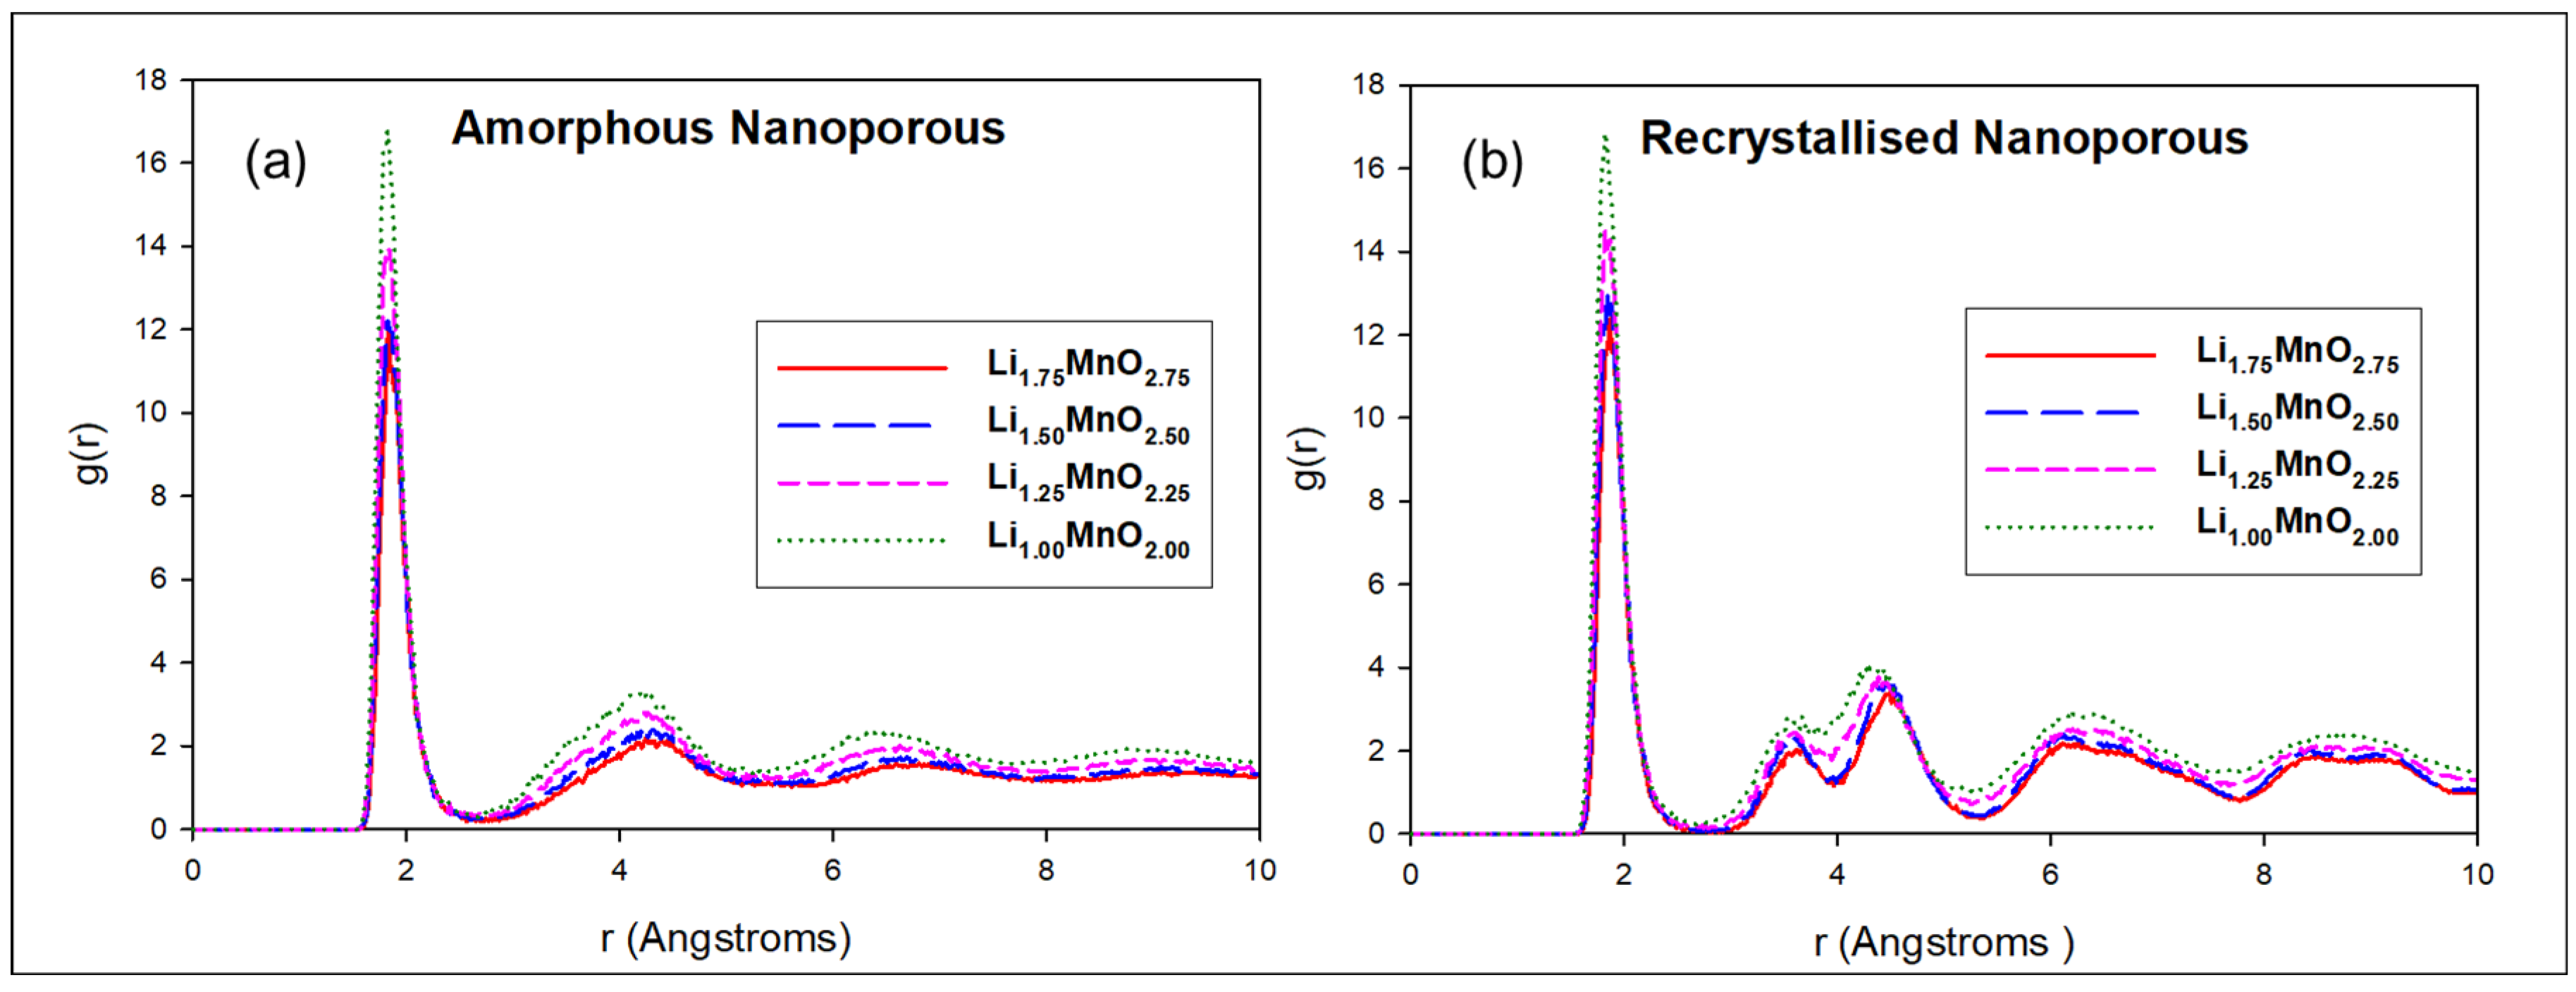
The RDFs associated with the Mn–O interactions were plotted to confirm the amorphisation and recrystallisation of the generated nanoporous Li2−xMnO3−x structures, as their Li and O content was varied. Figure 2a illustrates the amorphous plots for the Li1.75MnO2.75 (red), Li1.50MnO2.50 (blue), Li1.25MnO2.25 (pink), and Li1.00MnO2.00 (green) structures, revealing a sharp peak at 1.9 Å corresponding to the Mn–O bond length, which is comparative to the 1.92 Å in the literature [25]. The peaks beyond 5 Å are broader, with minimal possibility of locating the nearest neighbouring atom within the radial distance, thus confirming that the structures were amorphised.
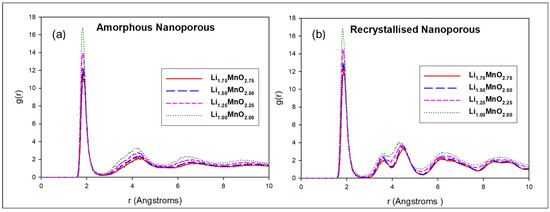
Figure 2.
Mn–O pair distribution for the nanoporous 75 Å, before (a) and after (b) recrystallisation, where Li1.75MnO2.75, Li1.50MnO2.50, Li1.25MnO2.25, and Li1.00MnO2.00 concentrations are illustrated by red, blue, pink, and green, respectively.
In Figure 2b, the recrystallised plots for the Li1.75MnO2.75 (red), Li1.50MnO2.50 (blue), Li1.25MnO2.25 (pink), and Li1.00MnO2.00 (green) structures show an increased number of sharp peaks, due to strong bonds and a high probability of locating the nearest neighbouring atom, within the radial distance. It can be deduced from the graphs that the Li1.00MnO2.00 structure is highly crystalline, since it recorded the highest g (r) value, compared to the other structures. The presence of multiple sharp peaks confirms that the models are in their crystalline form.
3.2. Structural Analysis
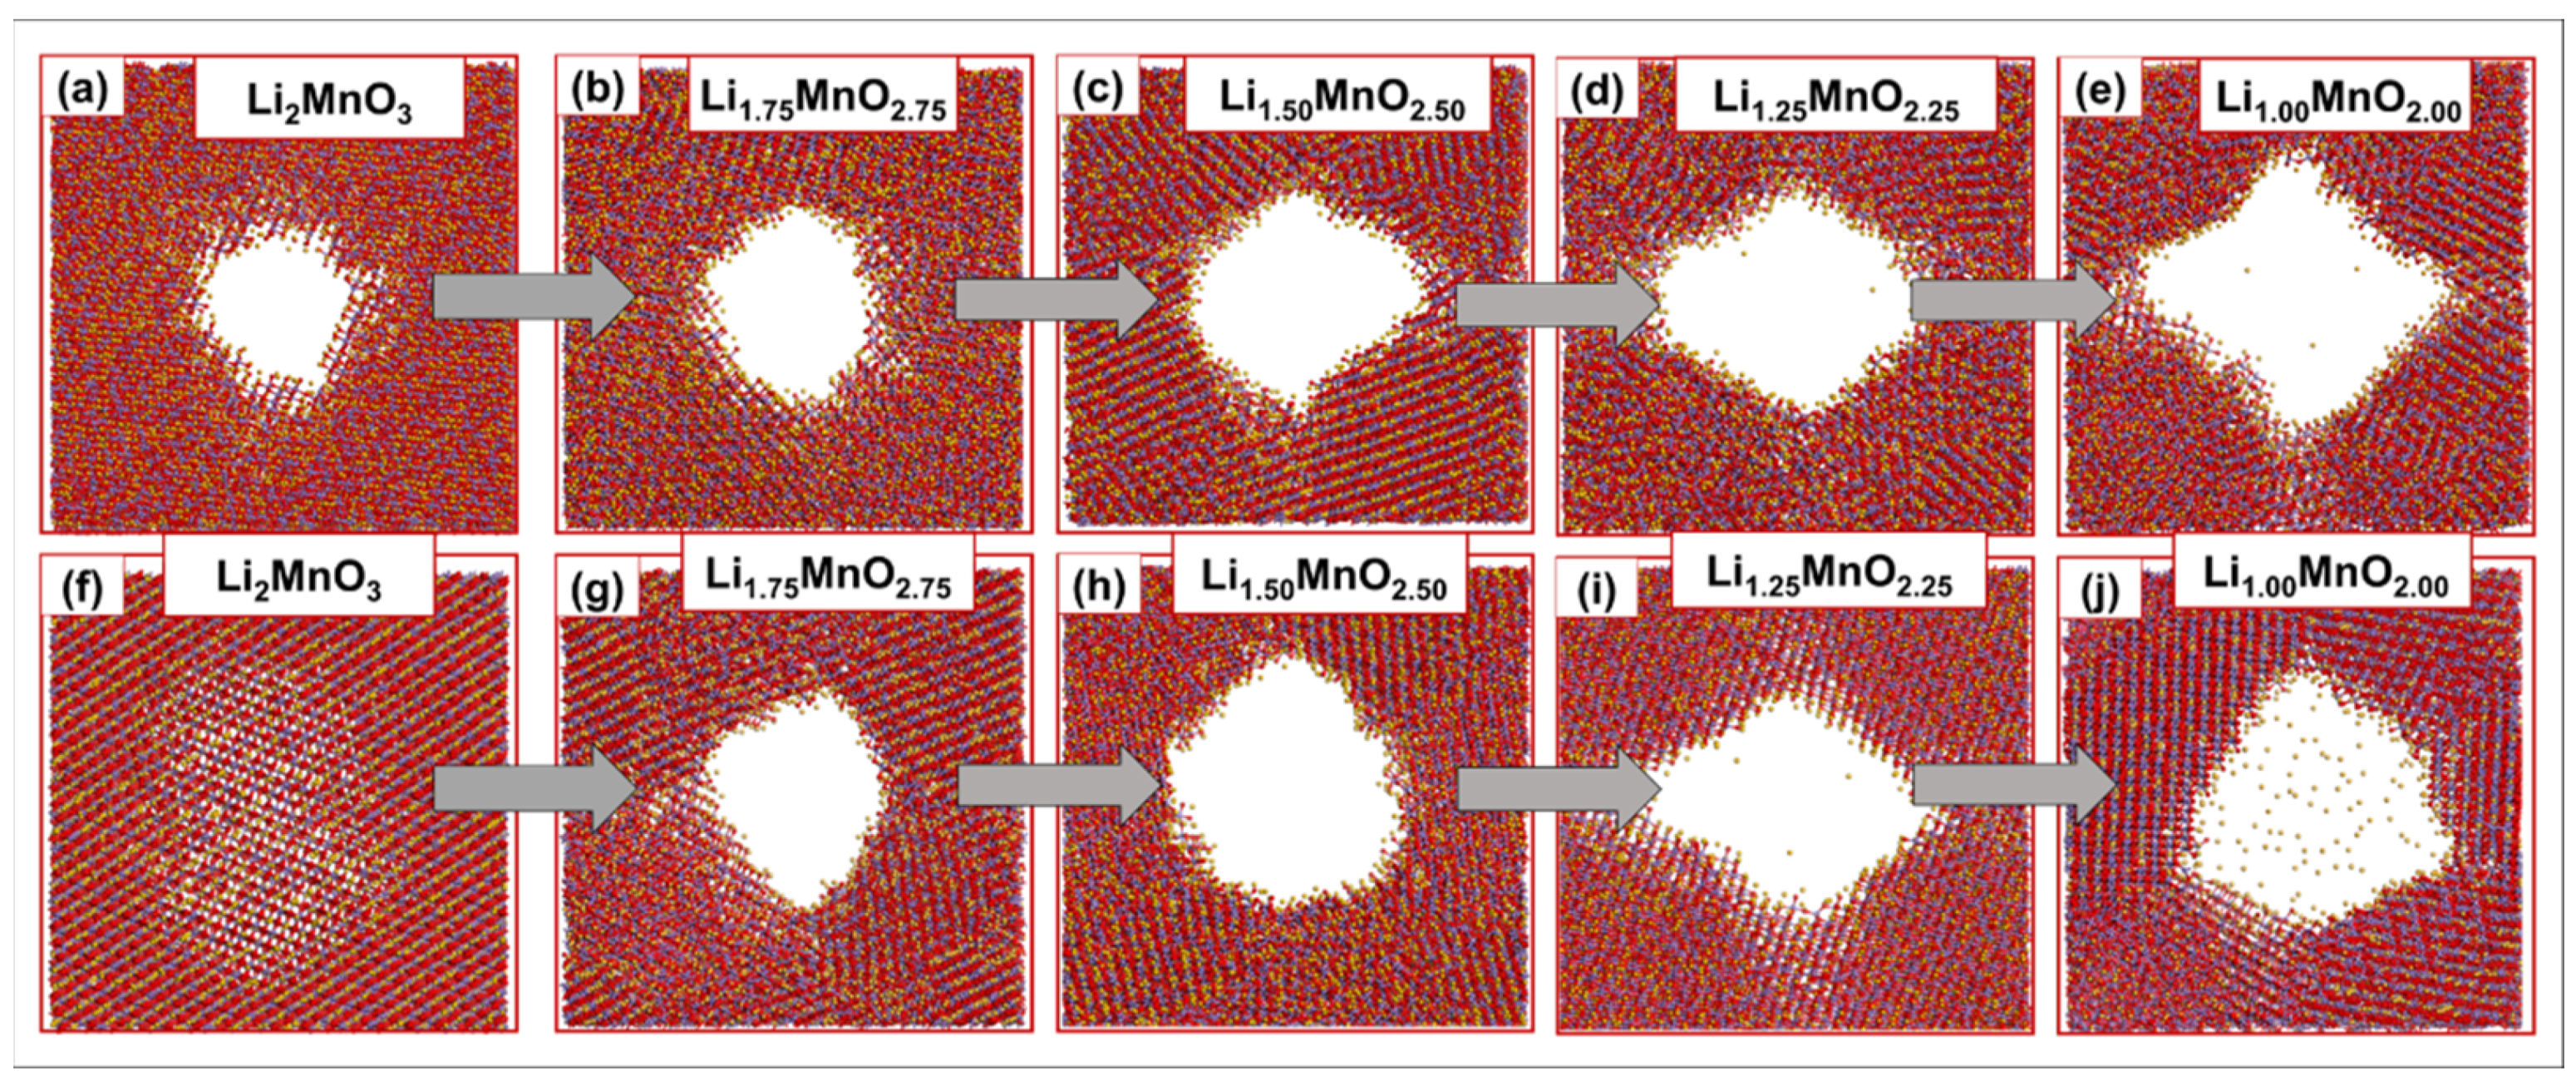
Figure 3 illustrates molecular graphics for the recrystallised nanoporous 75 Å (a–e) and nanoporous 73 Å (f–j) Li2−xMnO3−x models, with different Li/O content. The observable patterns, within the simulated models, are an indication of their crystallinity. As the Li/O content was varied, the pore size gradually increased, along with the grain boundaries, for the nanoporous 75 Å (a–e). Moreover, the pristine Li2MnO3 pore depicted in (f) closes on one side upon crystallisation, opening up as the Li/O content decreased for the nanoporous 73 Å. Moreover, at the same lattice size, there are considerable lithium ions located within the LiMnO2 pore, shown in (j), which shows that the removal of Li/O affects the pore size of the generated Li2−xMnO3−x models.

Figure 3.
Molecular graphics of the crystallised Li2−xMnO3−x (a–e) nanoporous 75 Å and (f–j) nanoporous 73 Å, with different Li/O concentrations.
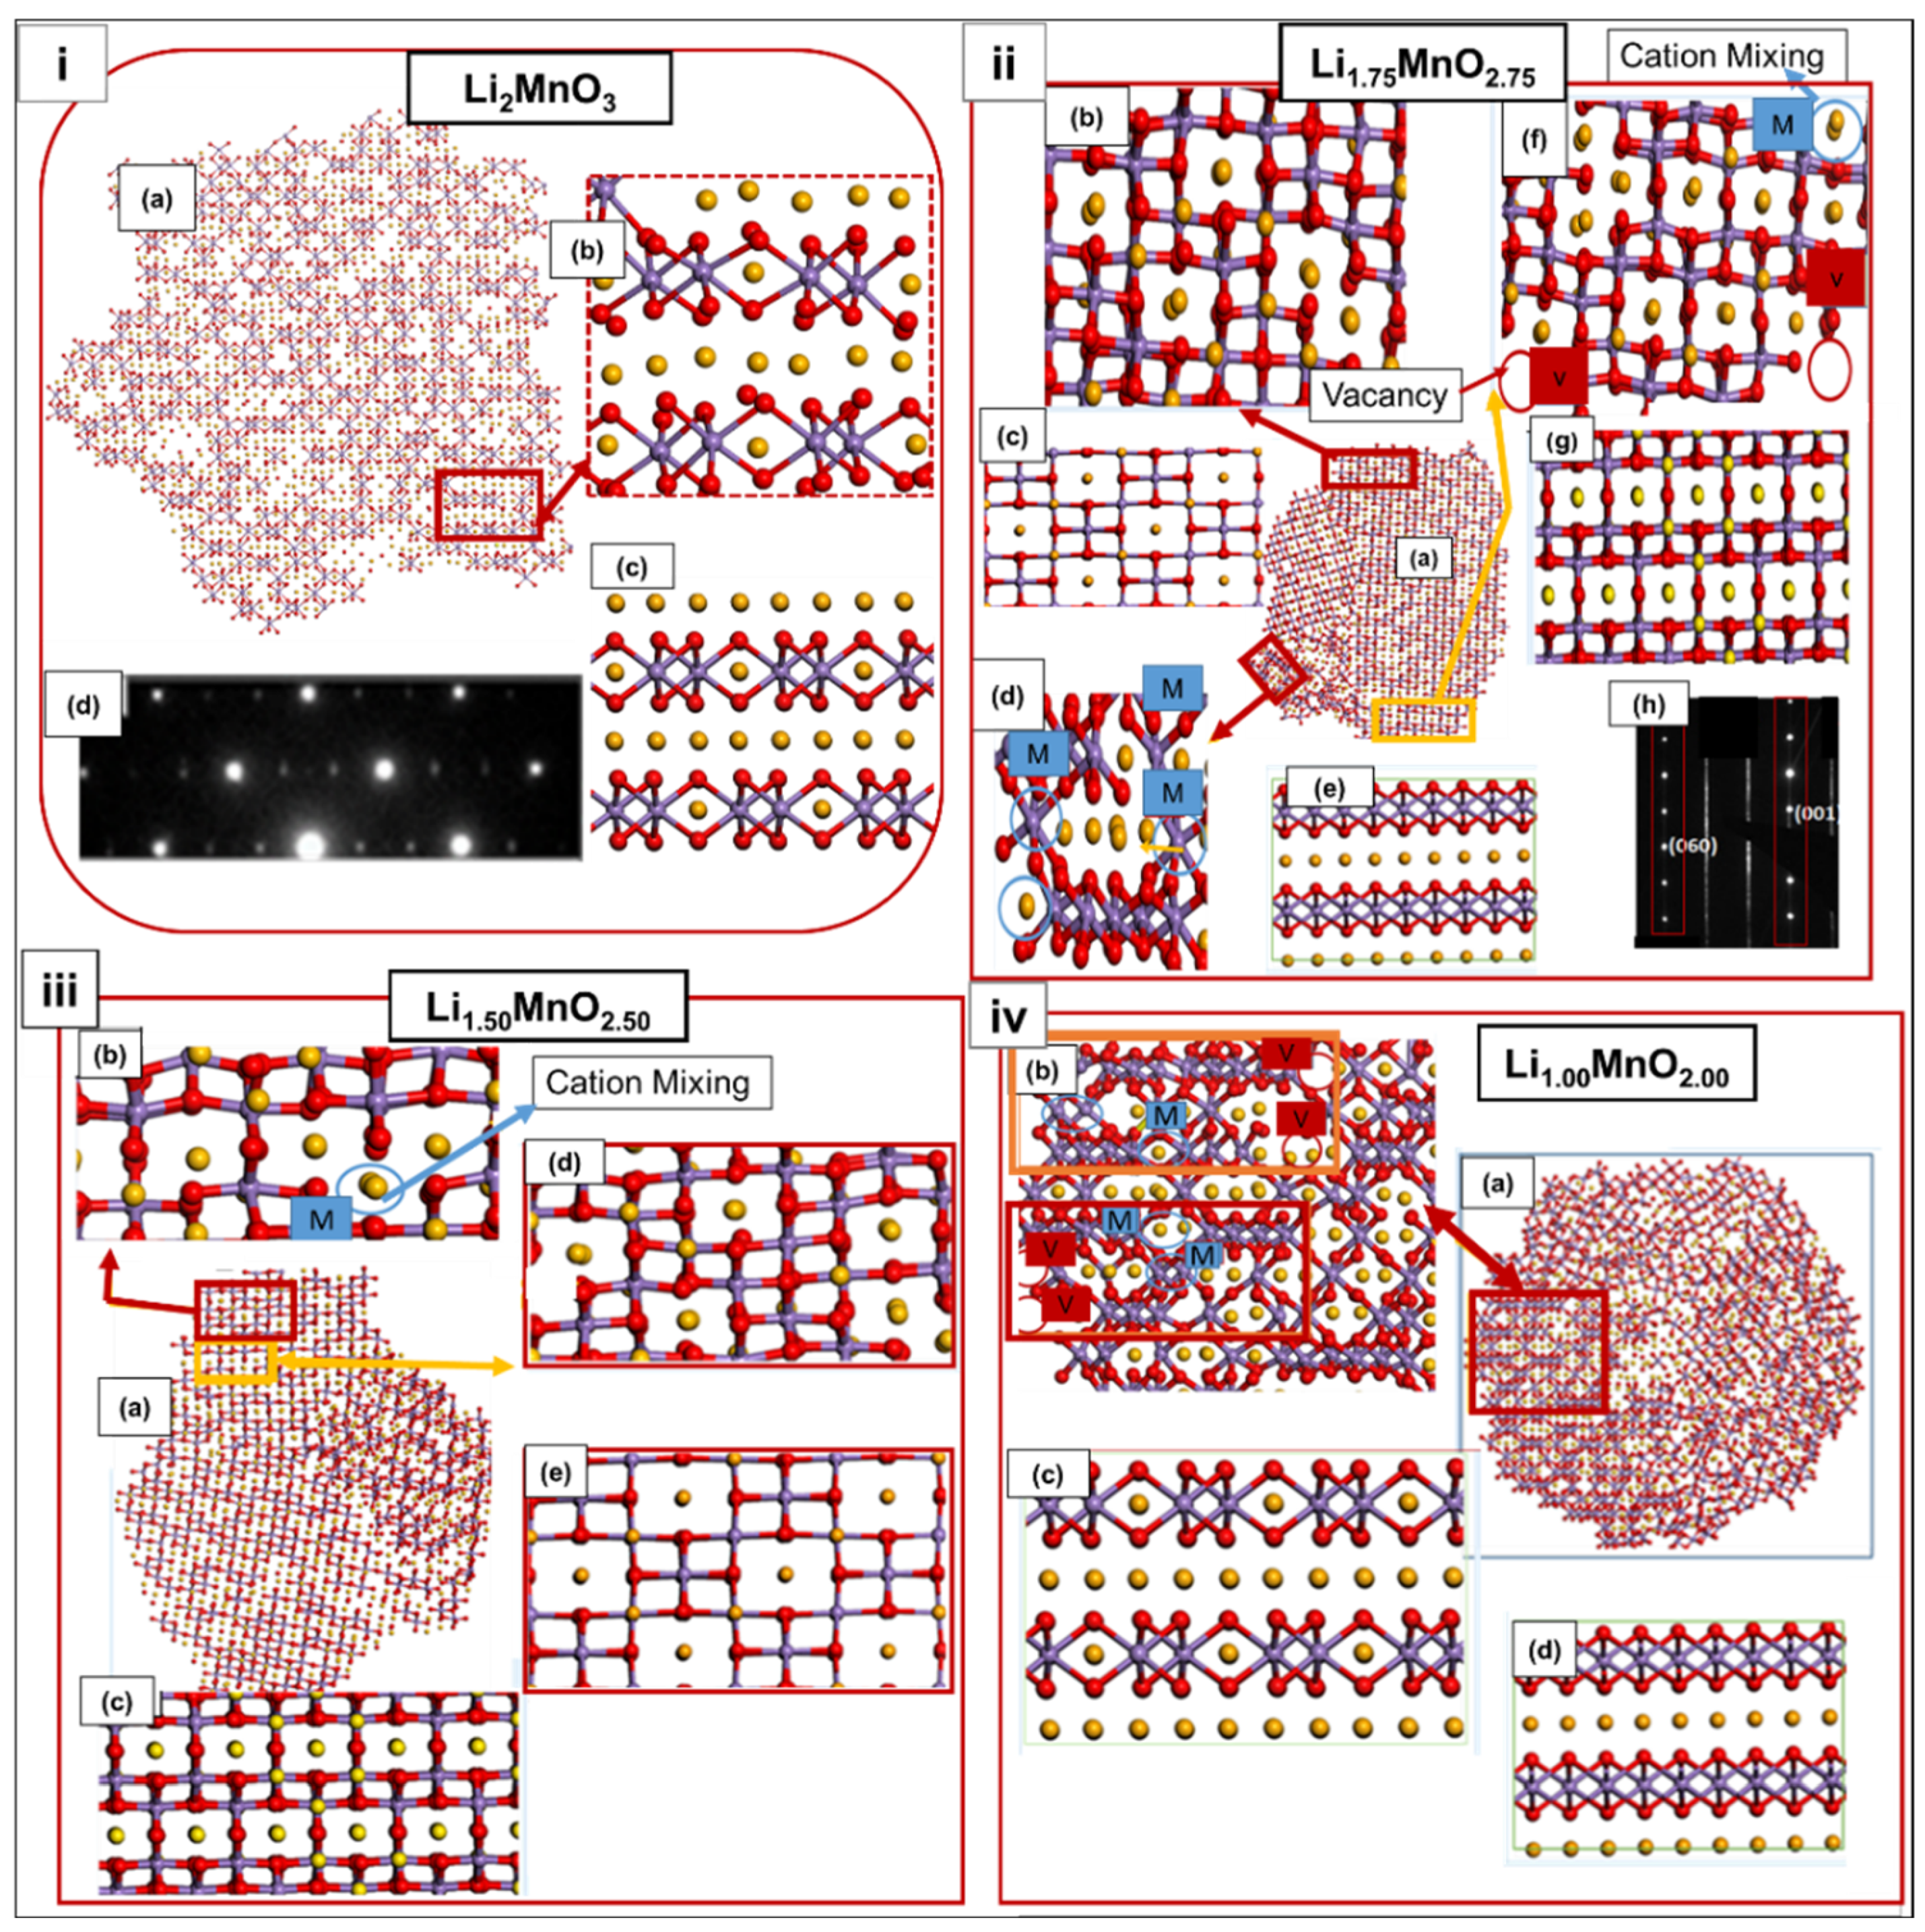
To explore the crystallographic features that evolved during the charging of the nanoporous structures, the structures were cut through into segments, to better view their atomic arrangement. Figure 4 illustrates the cut-through nanoporous 75, with Figure 4(ia) pristine Li2MnO3 showing cation mixing, as indicated on the magnified portion (b); the structure compares well with the Li2MnO3 perfect model in (c) and, also, with the experimental Li2MnO3 selected area electron diffraction (SAED) [5], depicted in (d). In Figure 4(iia), the cut-through Li1.75MnO1.75 has evolved into three disoriented phases, the spinel LiMn2O4 phase, magnified in (b) and compared with the spinel LiMn2O4 perfect model in (c); the LiMnO2 phase magnified in (d) accompanied by cation mixing and vacancies, compared with the LiMnO2 perfect model in (e); the Li2MnO3 phase magnified in (f) also, showing cation mixing and vacancies compared with the Li2MnO3 perfect model in (g) and Li2MnO3 SAED [26] in (h). Figure 4(iiia) depicts a cut-through Li1.50MnO2.50, comprising the layered Li2MnO3 phase indicated in (b), comparable to the Li2MnO3 perfect model in (c) and also, the spinel LiMn2O4 phase, comparable to (e), the LiMn2O4 perfect model. In Figure 4(iva), the cut-through Li1.00MnO2.00, also, reveals the coexistence of the layered Li2MnO3 and LiMnO2 phases magnified in (b), which are, also, comparable to their perfect models depicted in (c) Li2MnO3 and (d) LiMnO2.
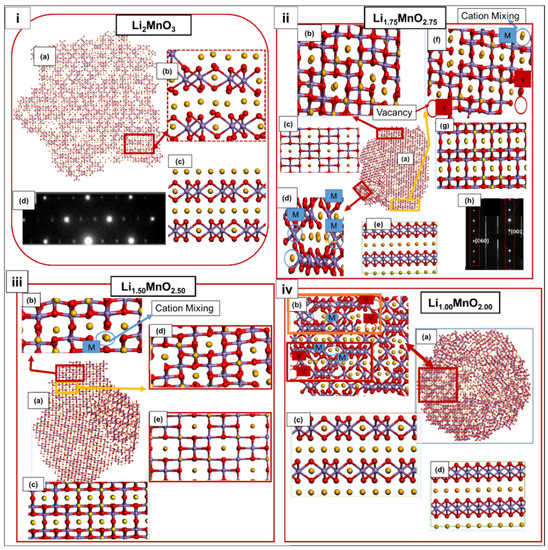
Figure 4.
[i] (a) Cut-through Li2MnO3, (b) magnified portion from (a) depicting the Li2MnO3 component, (c) Li2MnO3 perfect model and (d) Li2MnO3 SAED experimental patterns reproduced with permission from Ref. [5]. 2017. Advanced Materials Interfaces. [ii] (a) Cut-through Li1.75MnO2.75, (b) magnified segment from (a) illustrating the distorted spinel LiMn2O4 phase, (c) LiMn2O4 perfect model, (d) magnified portion from (a) showing the distorted LiMnO2 component, comparable with (e) the LiMnO2 perfect model, (f) magnified portion from (a) revealing the Li2MnO3 component, (g) perfect Li2MnO3 model, and (h) Li2MnO3 SAED reproduced with permission from Ref. [26]. 2015. Nano Energy. [iii] (a) Cut-through Li1.50 MnO2.50, revealing (b) Li2MnO3 component, (c) Li2MnO3 perfect model, (d) magnified portion from (a) showing the LiMn2O4 component, comparable with (e) the LiMn2O4 perfect model. [iv] (a) Cut-through Li1.00MnO2.00 depicting (b) magnified portion of (a) revealing the coexistence of the layered Li2MnO3 and LiMnO2 components, comparable with (c) the Li2MnO3 perfect model and (d) LiMn2O4 perfect model.
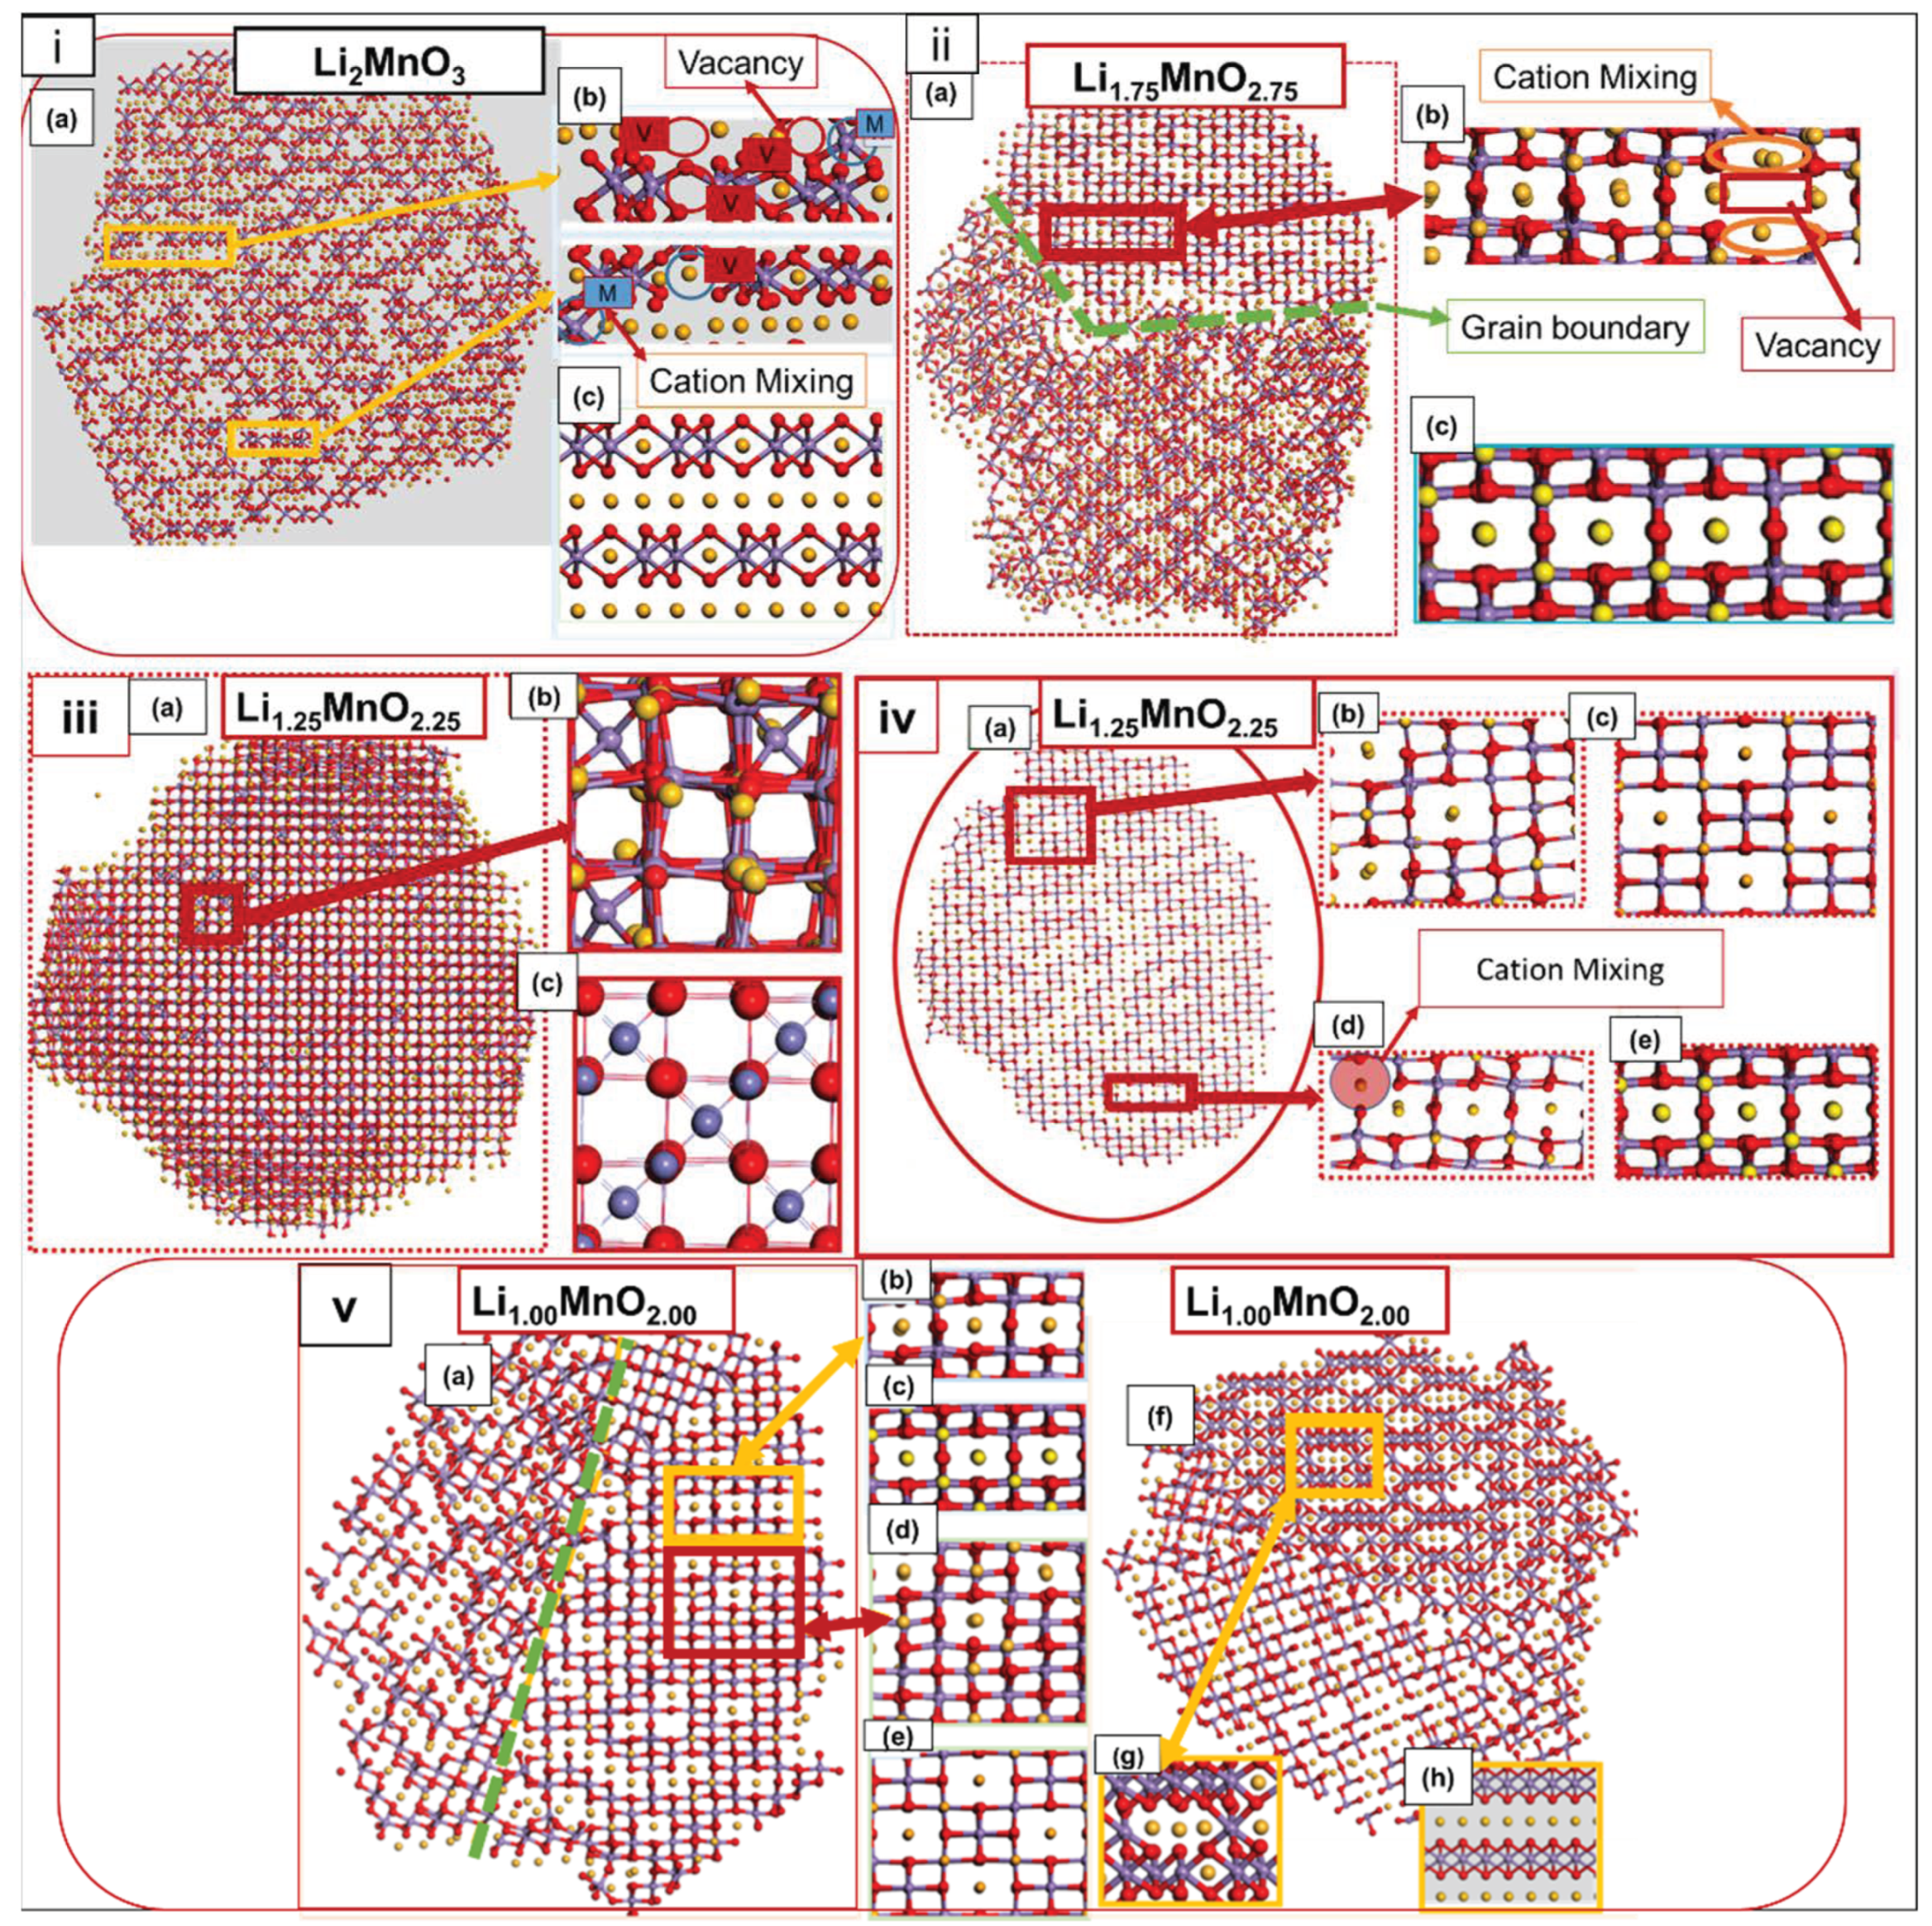
Figure 5 represents the nanoporous 73 Å microstructures, respectively. A cut-through Li2MnO3 is depicted in Figure 5(ia), while a magnified portion (b) reveals cation mixing (blue circle) and vacancies (red circle), within the layers of Li2MnO3, (c) is the Li2MnO3 perfect model. Similarly, the Li1.75MnO2.75 cut through, presented in Figure 5ii, reveals (a) the distorted Li2MnO3, along with the grain boundaries specified by the green dotted line. Figure 5iii indicates (a) the Li1.25MnO2.25 snapshot, magnified in (b) to better view the occupancy of Mn ions in the tetrahedral sites arranged, correspondingly, as in (c) the spinel Mn3O4 perfect model. Moreover, in Figure 5iv, the cut-through Li1.25MnO2.25 is displayed in (a) and magnified in (b), to show the cubic-spinel phase LiMn2O4, comparable with (c) the LiMn2O4 perfect model, while another magnified portion (d) reveals the layered Li2MnO3, showing Li-ion substituting for the Mn ion (red circle), comparable with (e) the Li2MnO3 perfect model. The Li1.00MnO2.00 microstructural features are depicted in Figure 5iv, with (a,f) illustrating the cut-through Li1.00MnO2.00 layers, viewed in a different orientation for better analysis. The magnified portions (b) indicate the presence of the Li2MnO3 phase, comparable to (c) the Li2MnO3 perfect model, while (d) shows the presence of LiMn2O4, comparable to (e) the perfect LiMn2O4, and (g) depicts the presence of the LiMnO2 phase, which is, also, comparable to (h) the LiMnO2 perfect model. Our results reveal that the pristine models of Li2MnO3 recrystallised into single crystals with a distorted rocksalt structure, similar to that of the nanoparticle simulated in a previous study [6]. As the Li/O content was decreased, the structures crystallised into multiple grains along with stacking faults and vacancies, thus leading to Mn ions migrating to the Li layers.
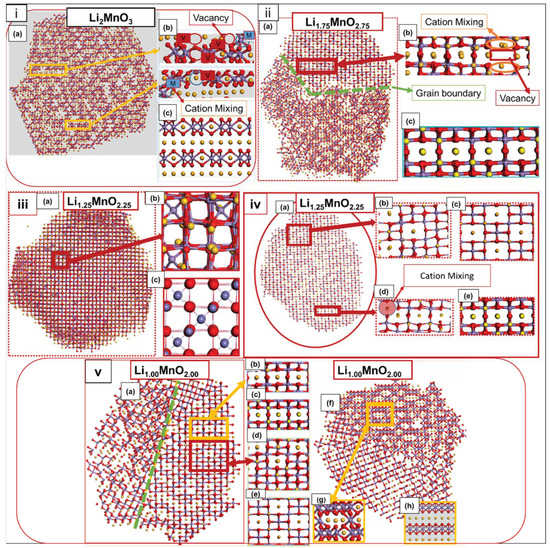
Figure 5.
[i]. (a) A cut-through Li2MnO3 and (b) magnified portion of the cut through, illustrating the Li2MnO3 component, comparable with (c) the cut-through Li2MnO3 perfect model. [ii] (a) Cut-through Li1.75MnO2.75, (b) magnified portion of (a) revealing the Li2MnO3 component, comparable with (c) the perfect Li2MnO3 model. [iii] (a) Li1.25MnO2.25 atomic structures, revealing (b) spinel Mn3O4 component, comparable with (c) the Mn3O4 perfect model. [iv] (a) Cut-through Li1.25MnO2.25, depicting (b) spinel LiMn2O4 component, comparable with (c) LiMn2O4 perfect model, (d) magnified portion from (a) illustrating the Li2MnO3 component, comparable with (e) Li2MnO3 perfect model. [v] (a) Cut-through Li1.00MnO2.00 revealing the (b) Li2MnO3 component, comparable with (c) Li2MnO3 perfect model, (d) magnified segment from (a) illustrating the LiMn2O4 component, comparable with (e) LiMn2O4 perfect model, (f) cut through Li1.00MnO2.00 viewed from different orientation revealing (g) magnified portion of (f) showing, LiMnO2, component, comparable with (h) LiMnO2 perfect model.
Our models reveal that all layers are mixed upon crystallisation, leading to the formation of disoriented phases, including the layered Li2MnO3, layered LiMnO2, and cubic-spinel LiMn2O4. Furthermore, the models showed the presence of grains, which increased along with Li/O extraction, however, for nanoporous 73 Å, the Li1.25MnO2.25 concentration depicted no grain boundaries. The resulting structures crystallised into multiple grains, which increased with decreasing Li/O content, along with stacking faults and vacancies, thus leading to Mn ions migrating to the Li layers. Interrogating the structural composition of the charged structures revealed the presence of spinel-layered-type polymorphs, consisting of a 3D spinel framework and straight tunnels (layered structure), which would allow for efficient lithium-ion diffusion during intercalation, as described in the literature for the parent bulk structures [7]. The polymorphs that emanated during the charging process were compared with the SAED images [5,26] from experimental studies. The spinel components contain Li atoms that, predominantly, reside in the octahedral 16c and 16d sites, compared to the tetrahedral 8a positions of pure LiMn2O4. Another crucial component, which emanated from lower oxygen and lithium contents, was the LiMnO2 polymorph. This, also, affects the precise structural analysis, due to the level of defects formed within the crystal domains [27].
3.3. X-ray Diffraction Patterns (XRDs)
For further characterisation, XRDs for the calculated nanoporous Li2−xMnO3−x models were compared with the ones from the literature, to consider whether structural features corresponding to those of known metal oxides may have evolved during the recrystallisation and charging process.
Figure 6 illustrates the XRD patterns for the (i) nanoporous 73 Å and (ii) nanoporous 75 Å, during the charging process. The XRDs of experimentally synthesized (a) MnO3 [28], (b) LiMnO2, (c) LiMn2O4 [29] and (d) Li2MnO3 [15] are superimposed with the calculated XRD patterns for the simulated systems (e-i). The simulated XRDs display a broad character at lower angles, corresponding to the ordering of atoms in the transition metal layers, thus resulting in highly distorted structures, as observed on the microstructures [8].
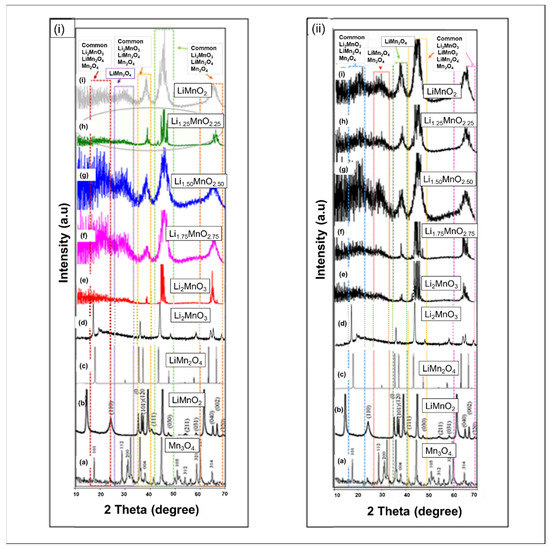
Figure 6.
[i] XRDs graphs for the (a) Mn3O4 reproduced with permission from Ref. [28]. 2017. Water Conservation Science and Engineering, (b) LiMnO2 reprodused with permission from Ref. [29]. 2008. Journal of Solid State Electrochemistry, (c) LiMn2O4 [29], (d) Li2MnO3 reproduced with permission from Ref. [15]. 2018. Ionics., superimposed with simulated XRDs calculated from the nanoporous 73 Å, (e) Li2MnO3, (f) Li1.75MnO2.75, (g) Li1.50 MnO 2.50, (h) Li1.25 MnO2.25, and (i) LiMnO2. [ii] diffraction peaks for the the (a) Mn3O4 [28], (b) LiMnO2, (c) LiMn2O4 [29], (d)Li2MnO3 [15], superimposed with simulated XRDs calculated from nanoporous 75 Å, (e) Li2MnO3, (f) Li1.75MnO2.75, (g) Li1.50 MnO 2.50, (h) Li1.25 MnO2.25, and (i) LiMnO2.
In Figure 6i, a shoulder peak associated with the Li2MnO3, Mn3O4, and LiMn2O4 phase emerges at lower angles (2Θ ~ 18–25°), while another peak associated with Mn3O4 emerges at 2Θ ~ 29°. These peaks drastically decrease for the Li1.25MnO2.25 concentration and become narrowed. The same is observed at 2Θ ~ 37°, 2Θ ~ 47°, and 2Θ ~ 68°, where the peaks increase but decrease for the Li1.25MnO2.25 concentration. This concentration has, also, revealed fewer grain boundaries during recrystallisation. Figure 6ii, also, reveals the emergence of shoulder peaks at low angles, and the peak at 2Θ ~ 37° increases with a decrease in Li/O content. The multiple peaks at 2Θ ~ 47° and 2Θ ~ 68° merge into a broader peak that shifts to the right, as the Li/O content decreases, while the peaks correspond to the spinel phase. At lower concentrations (Li1.00MnO2.00), the diffraction peaks are broader, as a result of an increased grain boundary, as seen on the microstructures.
The XRD of the simulated systems depicts broader peaks, which are more intense at lower angles, corresponding to the ordering of atoms in TM layers, denoted as the superionic feature in Li2MnO3. The spinel and layered morphologies observed from the microstructures are, also, observed in the XRD analysis. Again, the nanoporous 73 Å Li1.25MnO2.25 XRDs is narrowed, compared to the other concentrations. A drastic decrease is observed from the flattening of peaks, for both spinel and layered components. This concentration has, also, revealed fewer grain boundaries during recrystallisation. As previously reported by Xiao et al., the presence of high contents of Mn3+ highly enhances the activation of Li2MnO3 and, thus, the electrochemical performance [26].
3.4. Diffusion Coefficient
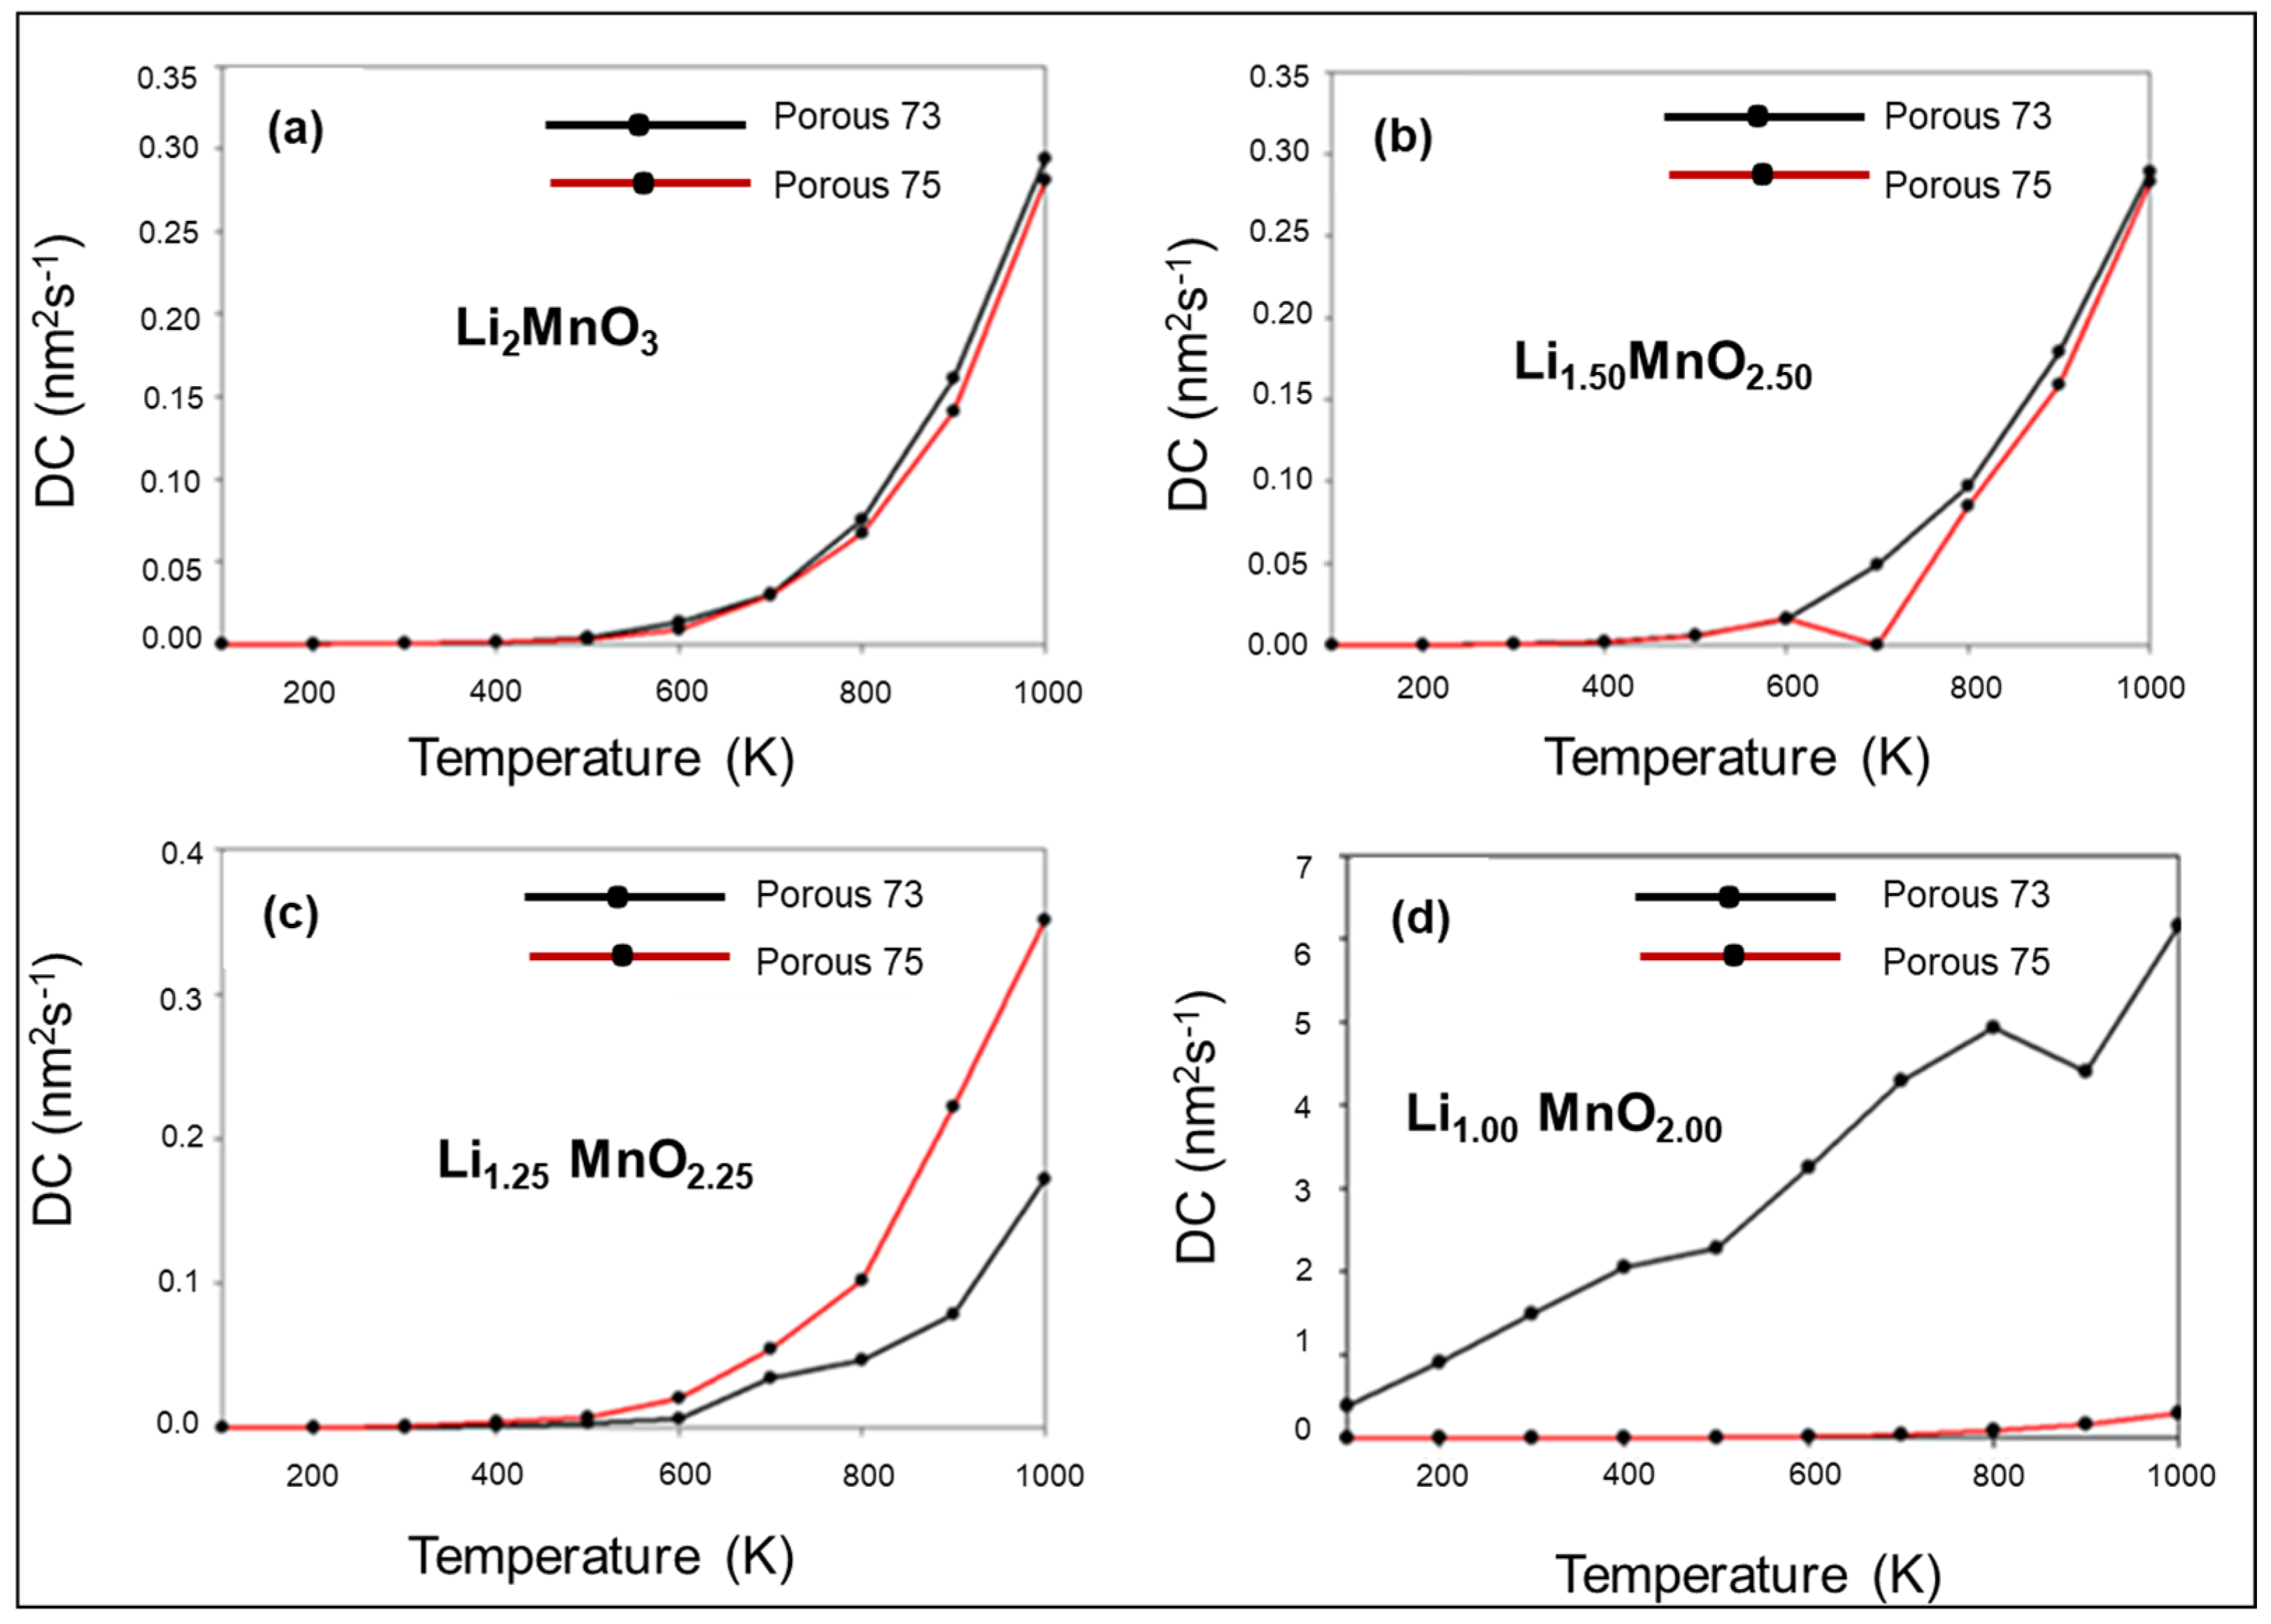
Li-ion diffusion was investigated at different temperatures and charge states (Li2−xMnO3−x). Figure 7a illustrates the diffusion coefficient (DC) of the Li2MnO3 nanoporous 75 Å (red trace) and nanoporous 73 Å (black trace). Li-ion in nanoporous 73 Å diffuses slightly higher than the nanoporous 75 Å, while Li mobility is observed at 500 K, and the diffusion coefficient increases, exponentially, until 1000 K. The same pattern is observed in Figure 7b, as both the Li1.50MnO2.50 porous structures show Li motion at 500 K; however, for the nanoporous 75 Å, Li diffusion drops to zero at 700 K and increases, again, until 1000 K.
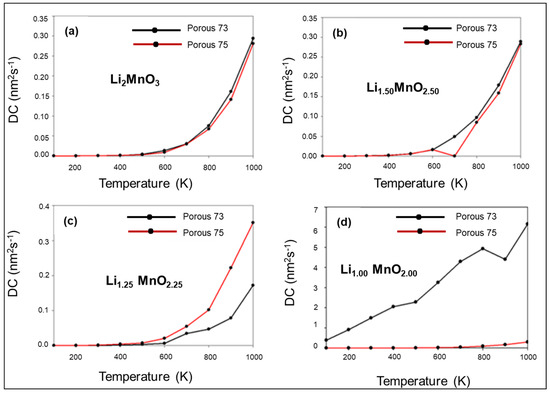
Figure 7.
Diffusion coefficient plots for Li-ions in (a) Li2MnO3, (b) Li1.50MnO2.50, (c) Li1.25MnO2.25, and (d) Li1.00MnO2.00, at various temperatures, where black trace represents nanoporous 73 Å and red trace represents nanoporous 75 Å, respectively.
In Figure 7c, the Li1.25MnO2.25 systems also depict Li mobility starting at 500 K, with nanoporous 75 Å showing better Li diffusivity than porous 73 Å. In terms of the Li1.00MnO2.00 structures (Figure 7d), Li mobility is observed at a lower temperature (100 K) for the nanoporous 73 Å and significantly increases until 800 K, before it slightly drops and increases, again, until 1000 K. This sudden change may be attributed to severe structural transformation, emanating from the removal of Li/O content.
4. Conclusions
We generated Li2−xMnO3−x nanoporous structures of different cell sizes (73, 75 Å) and interrogated their microstructures, XRDs, and lithium-ion diffusion, during the charging involving the simultaneous removal of oxygen and lithium ions. Our results display highly distorted structures, emanating from factors including stacking faults, vacancies, cation-mixing and splitting, and displacement of the XRD patterns. The presence of the layered (Li2MnO3, LiMnO2) and spinel (Mn3O4, LiMn2O4) polymorphs was deduced from the microstructures and XRDs. Lithium-ion diffusion was more favorable on the nanoporous 73 Å, particularly for Li1.00MnO2.00, which showed the highest diffusion coefficient value. This study has revealed the different internal structural transitions that occur within the intermediate phases and their impact on the cycling capabilities of Li2MnO3 cathodes, while similar results were observed, experimentally [2,13].
Author Contributions
Supervision, conceptualization, funding acquisition, P.E.N.; supervision, conceptualization, review, R.S.L.; conceptualization, formal analysis, methodology, writing—editing, investigation, writing original draft, T.M. All authors have read and agreed to the published version of the manuscript.
Funding
The study was funded by the South African Research Chair Initiative of the Department of Science and Innovation, and the National Research Foundation in Pretoria, grant number 136301.
Informed Consent Statement
Not applicable.
Data Availability Statement
The data presented in this work are available on request from the corresponding author.
Acknowledgments
The authors acknowledge the Centre for High-Performance Computing (CHPC) in Cape Town for computing resources.
Conflicts of Interest
The authors declare no conflict of interest.
References
- Kim, T.; Song, W.; Son, D.-Y.; Ono, L.K.; Qi, Y. Lithium-ion batteries: Outlook on the present, future and hybridized technologies. J. Mater. Chem. 2019, 7, 2942–2964. [Google Scholar] [CrossRef]
- Marusczyk, A.; Albina, J.; Hammerschmidt, T.; Drautz, R.; Eckl, T.; Henkelman, G. Oxygen activity and peroxide formation as charge compensation mechanisms in Li2MnO3. J. Mater. Chem. 2017, 5, 15183–15190. [Google Scholar] [CrossRef]
- Li, F.; Zhang, X.; Lin, J.; Ma, J.; Zhang, S.; Yang, G. Unveiling the role of oxygen vacancy in Li2MnO3 upon delithiation. J. Phys. Chem. 2019, 123, 23403–23409. [Google Scholar] [CrossRef]
- Li, Q.; Yao, Z.; Lee, E.; Xu, Y.; Thackery, M.M.; Wolverton, C.; Dravid, V.P.; Wu, J. Dynamic imaging of crystalline defects in lithium-manganese oxide electrodes during electrochemical activation to high voltage. Nat. Commun. 2019, 10, 1692–1698. [Google Scholar] [CrossRef] [PubMed]
- Sun, Y.; Cong, H.; Zan, L.; Zhang, Y. Oxygen vacancies and stacking faults introduced by low-temperature reduction improve the electrochemical properties of Li2MnO3 nanobelts as lithium-ion battery cathodes. ACS Appl. Mater. Interfaces 2017, 9, 38545–38555. [Google Scholar] [CrossRef]
- Sayle, T.X.T.; Caddeo, F.; Monama, N.O.; Kgatwane, K.M.; Ngoepe, P.E.; Sayle, D.C. Origin of electrochemical activity in nano-Li2MnO3; stabilization via a ‘point defect scaffold’. Nanoscale 2015, 7, 1167–1180. [Google Scholar] [CrossRef]
- Xie, H.; Cui, J.; Yao, Z.; Ding, X.; Zhang, Z.; Luo, D.; Lin, Z. Revealing the role of spinel phase on Li-rich layered oxides: A review. Chem. Eng. J. 2021, 427, 131978–131992. [Google Scholar] [CrossRef]
- Song, Y.; Zhao, X.; Wang, C.; Bi, H.; Zhang, J.; Li, S.; Wang, M.; Che, R. Insight into the atomic structure of Li2MnO3 in Li-rich Mn-based cathode materials and the impact of its atomic arrangement on electrochemical performance. J. Mater. Chem. 2017, 5, 11214–11223. [Google Scholar] [CrossRef]
- Nakamura, T.N.; Gao, H.; Ohta, K.; Kimura, Y.; Tamenori, Y.; Nitta, K.; Ina, T.; Oishi, M.; Amezawa, K. Defect chemical studies on oxygen release from the Li-rich cathode material Li1.2Mn0.6Ni0.2O2-δ. J. Mater. Chem. A 2019, 7, 5009–5019. [Google Scholar] [CrossRef]
- Zhou, W. Effects of external mechanical loading on stress generation during lithiation in Li-ion battery electrodes. Electrochim. Acta 2015, 185, 28–33. [Google Scholar] [CrossRef]
- Ledwaba, R.S.; Kgatwane, K.M.; Sayle, D.C.; Ngoepe, P.E. Structural characterisation and mechanical properties of nanosized spinel LiMn2O4 cathode investigated using atomistic simulation. Mater. Res. Bull. 2022, 141, 111611. [Google Scholar] [CrossRef]
- Chen, R.; Zhao, T.; Zhang, X.; Liab, L.; Wu, F. Advanced cathode materials for lithium-ion batteries using nanoarchitectonics. Nanoscale Horiz. 2016, 1, 423–444. [Google Scholar] [CrossRef] [PubMed]
- Kataoka, R.; Taguchi, N.; Kojima, T.; Takeichi, N.; Kiyobayashi, T. Improving the oxygen redox stability of NaCl-type cation disordered Li2MnO3 in a composite structure of Li2MnO3 and spinel-type LiMn2O4. J. Mater. Chem. 2019, 7, 5381–5390. [Google Scholar] [CrossRef]
- Long, B.R.; Croy, J.R.; Park, J.S.; Wen, J.; Miller, D.J.; Thackeray, M.M. Advances in Stabilizing ‘Layered-Layered’ xLi2MnO3·(1-x)LiMO2 (M=Mn, Ni, Co) Electrodes with a Spinel Component. J. Electrochem. Soc. 2014, 161, A2160–A2167. [Google Scholar] [CrossRef]
- Xiang, Y.; Wu, X. Enhanced electrochemical performances of Li2MnO3 cathode materials by Al doping. Ionics 2018, 24, 83–89. [Google Scholar] [CrossRef]
- Sun, Y.; Zan, L.; Zhang, Y. Enhanced electrochemical performances of Li2MnO3 cathode materials via adjusting oxygen vacancies content for lithium-ion batteries. Appl. Surf. Sci. 2019, 83, 270–277. [Google Scholar] [CrossRef]
- Lim, J.; Moon, J.; Gim, J.; Kim, S.; Kim, K.; Song, J.; Kang, J.; Im, W.B.; Kim, J. Fully activated Li2MnO3 nanoparticles by oxidation reaction. J. Mater. Chem. 2012, 22, 11772–11777. [Google Scholar] [CrossRef]
- Menon, A.S.; Ojwang, D.O.; Willhammar, T.; Peterson, V.K.; Edstrom, K.; Gomez, C.P.; Brant, W.R. The influence of synthesis routes on the crystallography, morphology and electrochemistry of Li2MnO3. ACS Appl. Mater. Interfaces 2020, 12, 5939–5950. [Google Scholar] [CrossRef]
- Maphanga, R.R.; Sayle, T.X.T.; Ngoepe, P.E.; Sayle, D.C. Amorphization and recrystallization study of lithium insertion into manganese dioxide. Phys. Chem. Chem. Phys. 2011, 13, 1307–1313. [Google Scholar] [CrossRef]
- Massel, F.; Hikima, K.; Rensmo, H.; Suzuki, K.; Hirayama, M.; Xu, C.; Younesi, R.; Liu, Y.-S.; Guo, J.; Kanno, R.; et al. Excess lithium in transition metal layers of epitaxially grown thin film cathodes of Li2MnO3 leads to rapid loss of covalency during first battery cycle. J. Phys. Chem. C 2019, 123, 28519–28526. [Google Scholar] [CrossRef]
- Guerrini, N.; Jin, L.; Lozano, J.G.; Luo, K.; Sobkowiak, A.; Tsuruta, K.; Massel, F.; Duda, L.-C.; Roberts, M.R.; Bruce, P.G. Charging mechanism of Li2MnO3. Chem. Mater. 2020, 32, 3733–3740. [Google Scholar] [CrossRef]
- Forester, T.R.; Smith, W. DL_POLY_2.0: A general-purpose parallel molecular dynamics simulation package. J. Mol. Dyn. 1996, 14, 136–141. [Google Scholar] [CrossRef]
- Watson, G.W.; Kelsey, E.T.; De Leeuw, N.H.; Harris, D.J.; Parker, S.C. Atomistic simulation of dislocation, surfaces and interfaces in MgO. J. Chem. Soc. Faraday Trans. 1996, 92, 433–438. [Google Scholar] [CrossRef]
- Sayle, T.X.T.; Catlow, C.R.A.; Maphanga, R.R.; Ngoepe, P.E.; Sayle, D.C. Generating MnO2 nanoparticles using simulated amorphization and recrystallization. J. Am. Chem. Soc. 2005, 127, 12828–12837. [Google Scholar] [CrossRef] [PubMed]
- Yang, Y.; Su, H.; Wua, T.; Jiang, Y.; Liu, D.; Yan, P.; Tian, H.; Yu, H. Atomic pair distribution function research on Li2MnO3 electrode structure evolution. Sci. Bull. 2019, 64, 553–561. [Google Scholar] [CrossRef]
- Xiao, L.; Xiao, J.A.; Yu, X.; Yan, P.; Zheng, J.; Engelhard, M.H.; Bhattacharya, P.; Wang, C.; Wang, C.; Yang, X.Q.; et al. Effects of structural defects on the electrochemical activation of Li2MnO3. Nano Energy 2015, 16, 143–151. [Google Scholar] [CrossRef]
- Matsunaga, T.; Komatsu, H.; Shimoda, K.; Minato, T.; Yonemura, M.; Kamiyama, T.; Kobayashi, S.; Kato, T.; Hirayama, T.; Ikuhara, Y.; et al. Dependence of structural defects in Li2MnO3 on synthesis temperature. Chem. Mater. 2016, 28, 4143–4150. [Google Scholar] [CrossRef]
- Ullah, A.K.M.A.; Kibria, A.K.M.F.; Akter, M.; Khan, M.N.I.; Shakhawat, A.R.M.T.; Firoz, H. Oxidative degradation of methylene blue using Mn3O4 nanoparticles. Water Conserv. Sci. Eng. 2017, 1, 249–256. [Google Scholar] [CrossRef]
- Tu, X.Y.; Shu, K.Y. X-ray diffraction study on phase transition of orthorhombic LiMnO2 in electrochemical conversions. J. Solid State Electrochem. 2008, 12, 245–249. [Google Scholar] [CrossRef]

Publisher’s Note: MDPI stays neutral with regard to jurisdictional claims in published maps and institutional affiliations. |
© 2022 by the authors. Licensee MDPI, Basel, Switzerland. This article is an open access article distributed under the terms and conditions of the Creative Commons Attribution (CC BY) license (https://creativecommons.org/licenses/by/4.0/).