
Recent Advances in Ethylene Gas Detection


Abstract
:1. Introduction
2. The State-of-the-Art Ethylene Gas Detection Technologies
2.1. Gas Chromatographic System, Non-Dispersive Infrared and Raman Spectroscopy
2.2. Photo-/Surface Acoustic Devices and Quartz Crystal Microbalance
2.3. Optical Devices
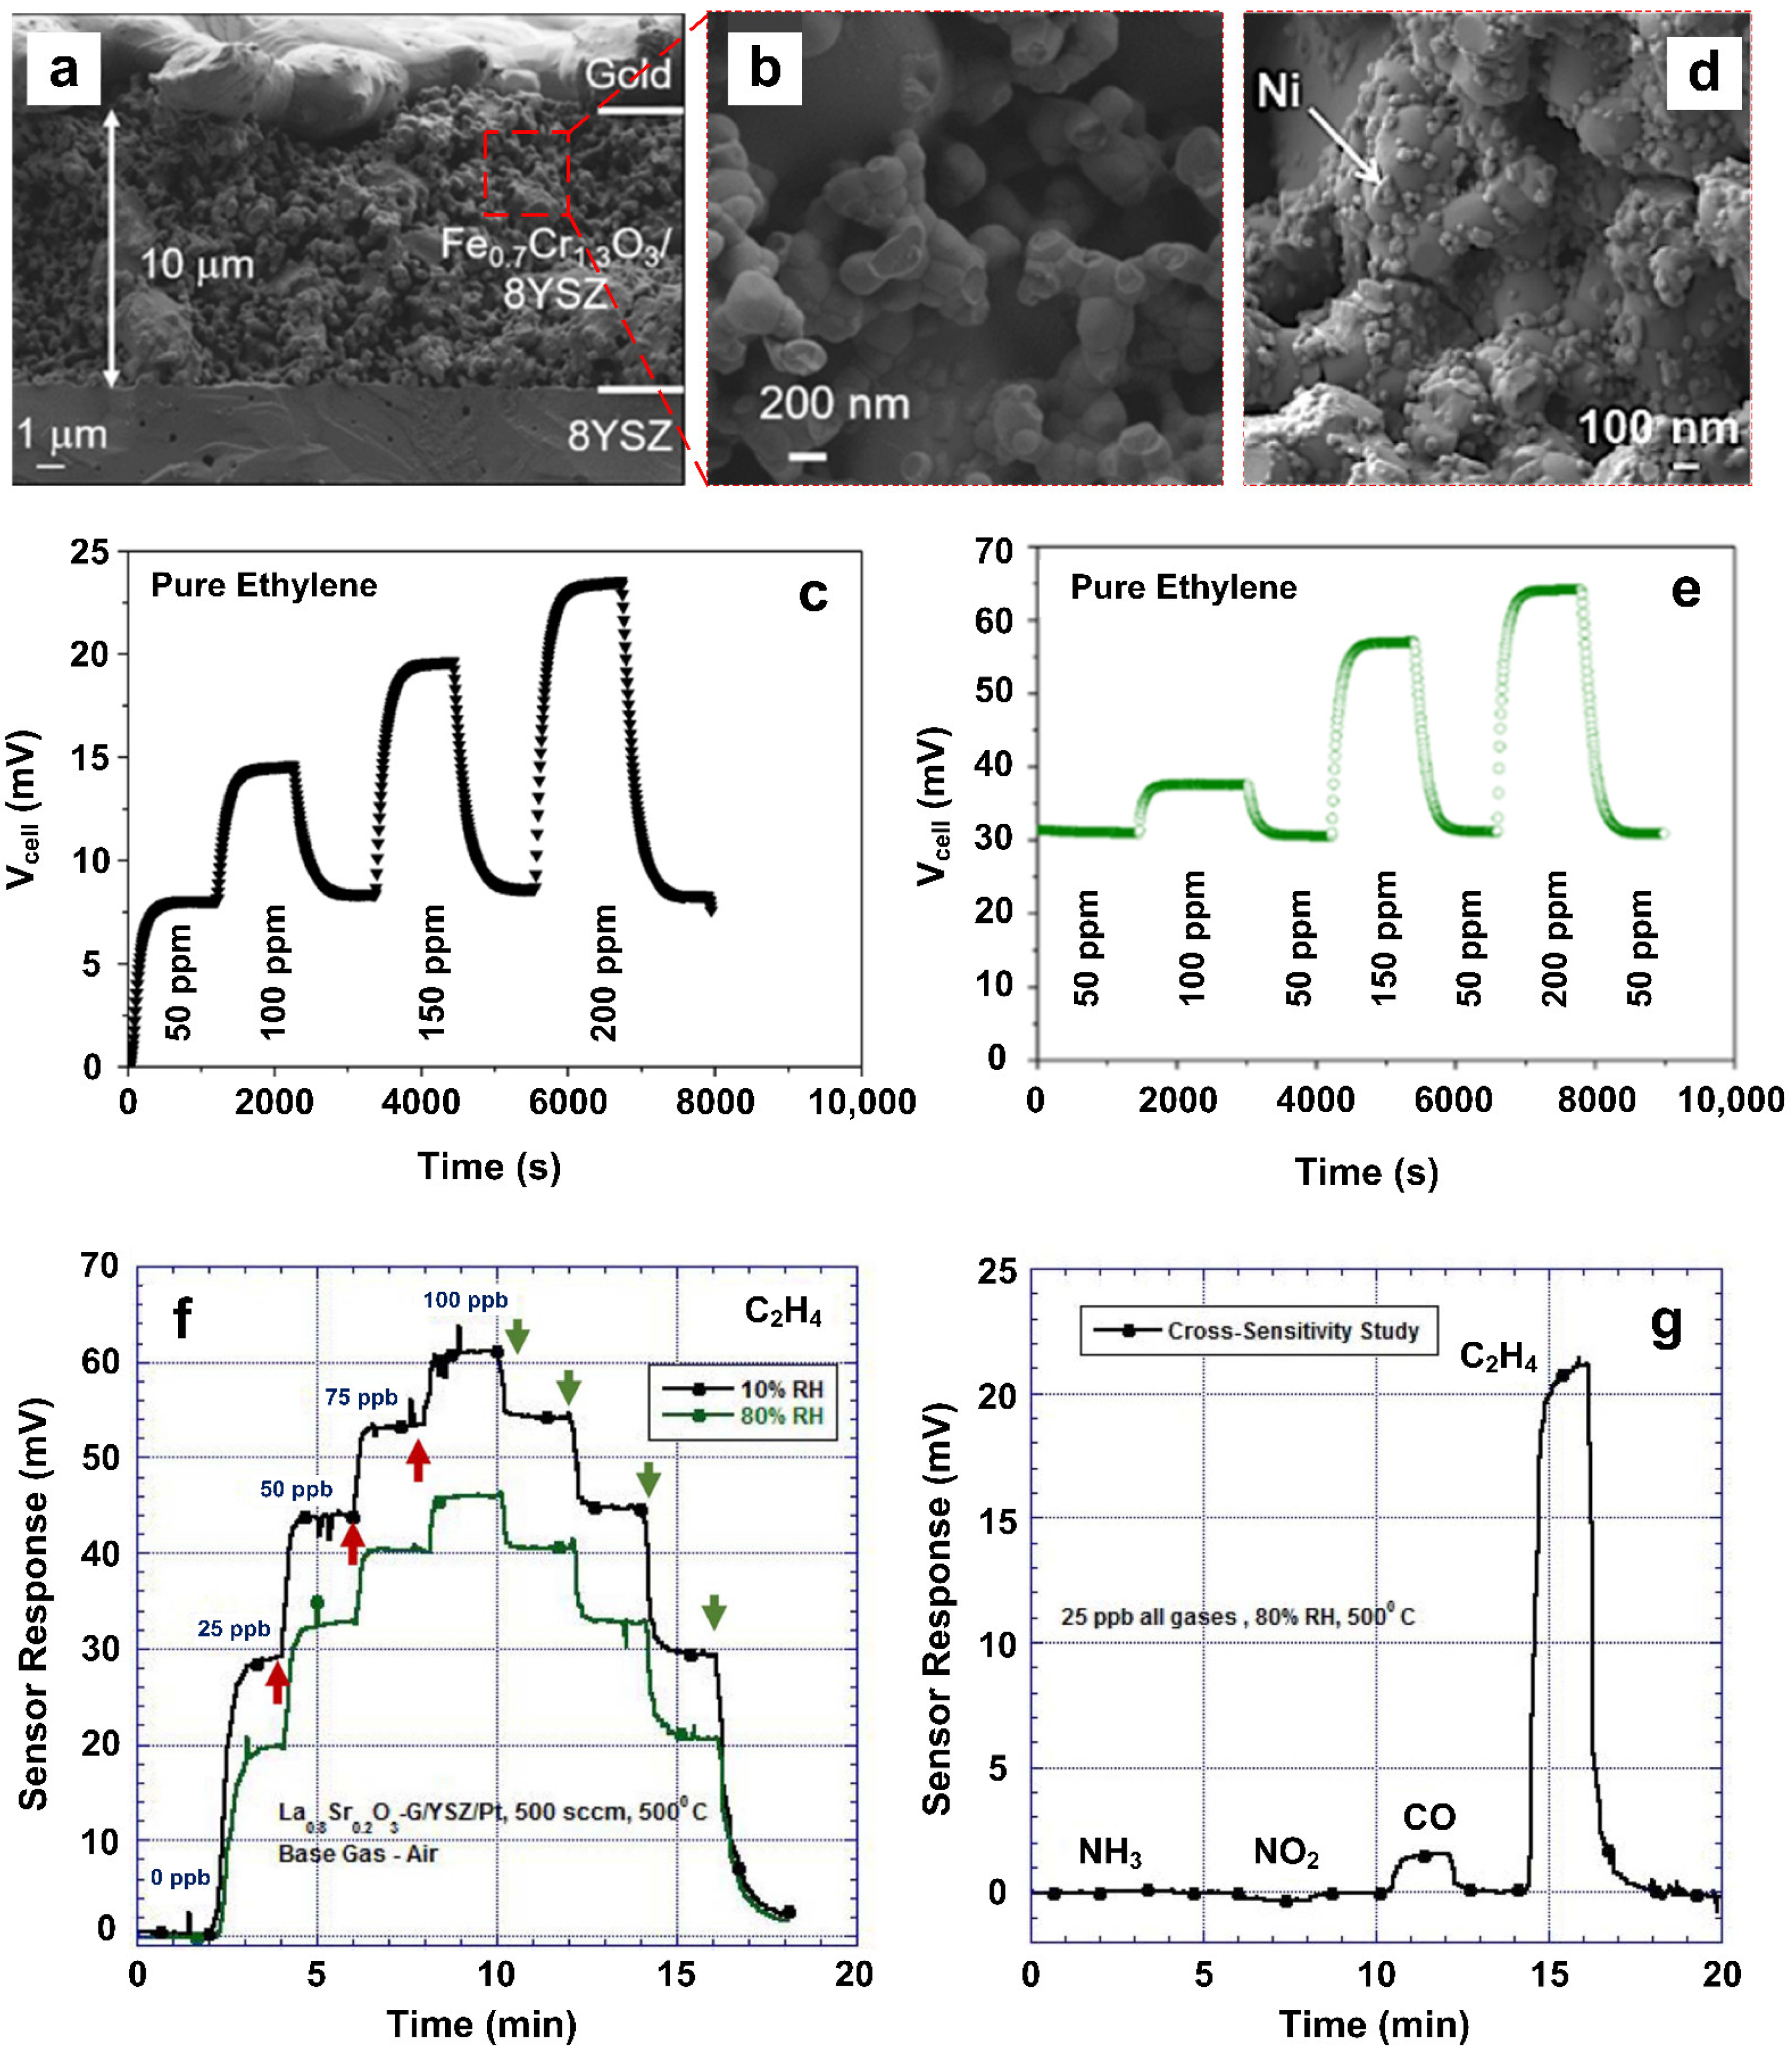
2.4. Potentiometric Gas Sensors
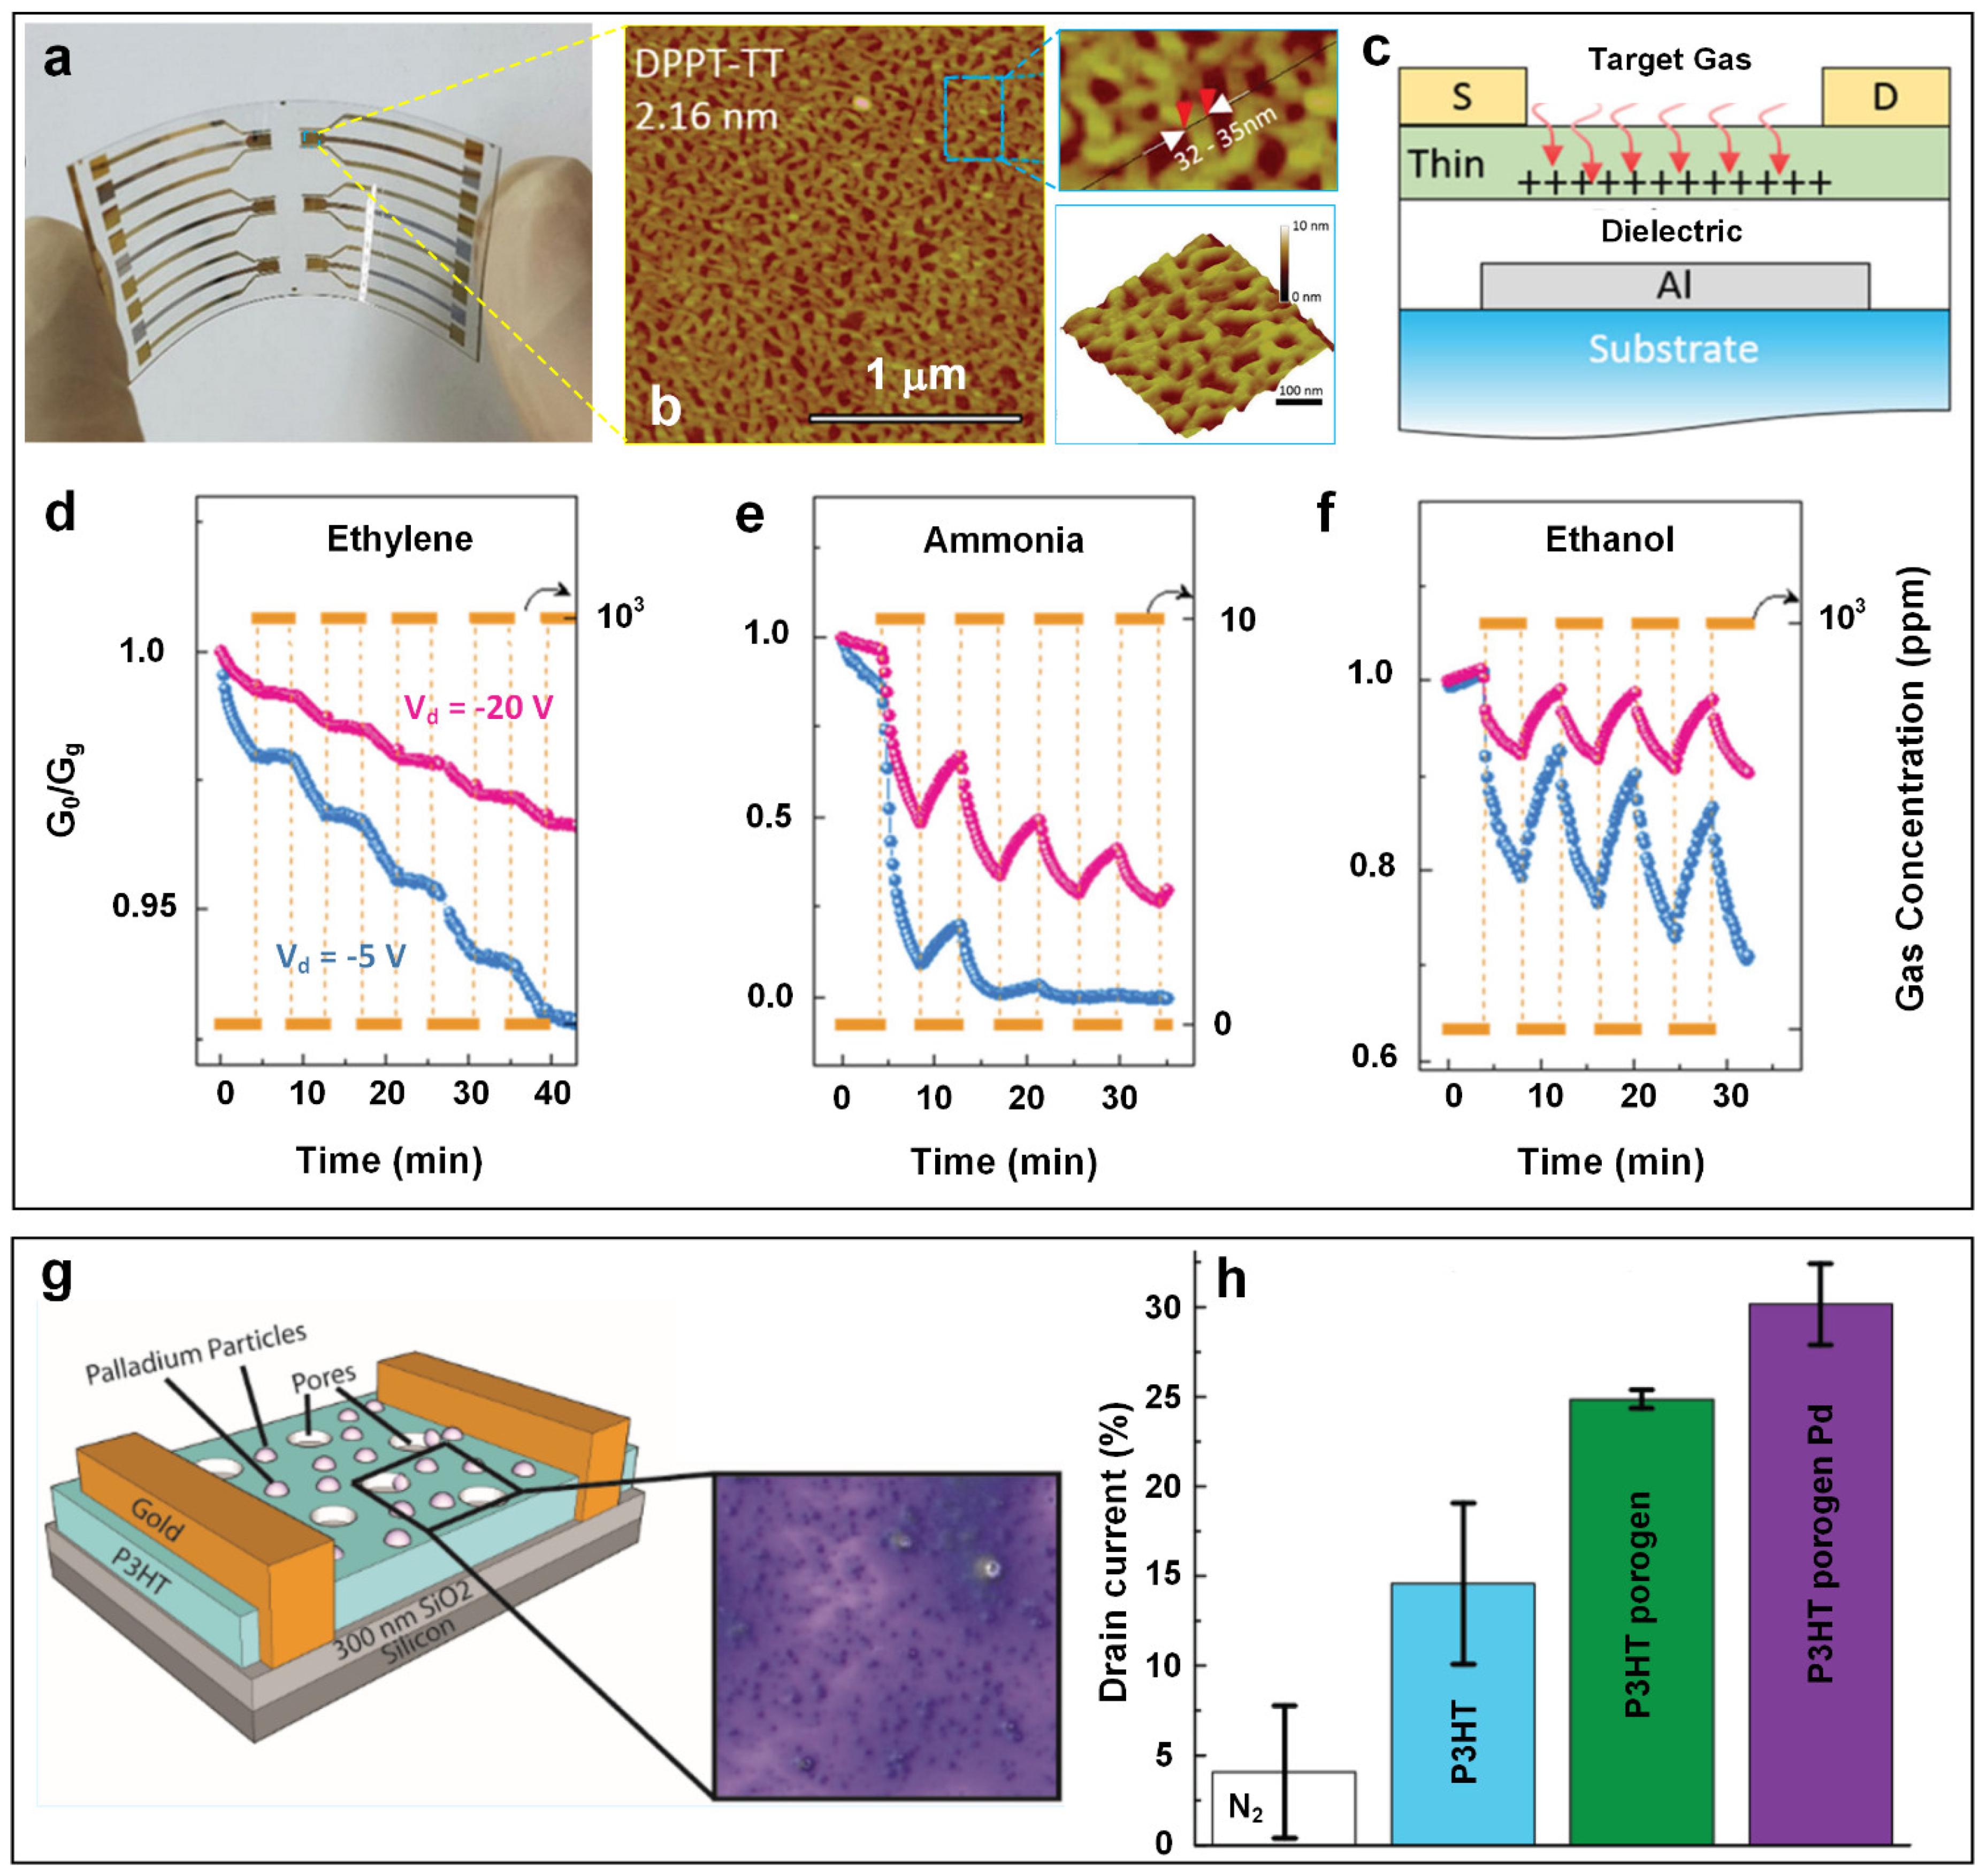
2.5. Field-Effect Transistor-Based Gas Sensors
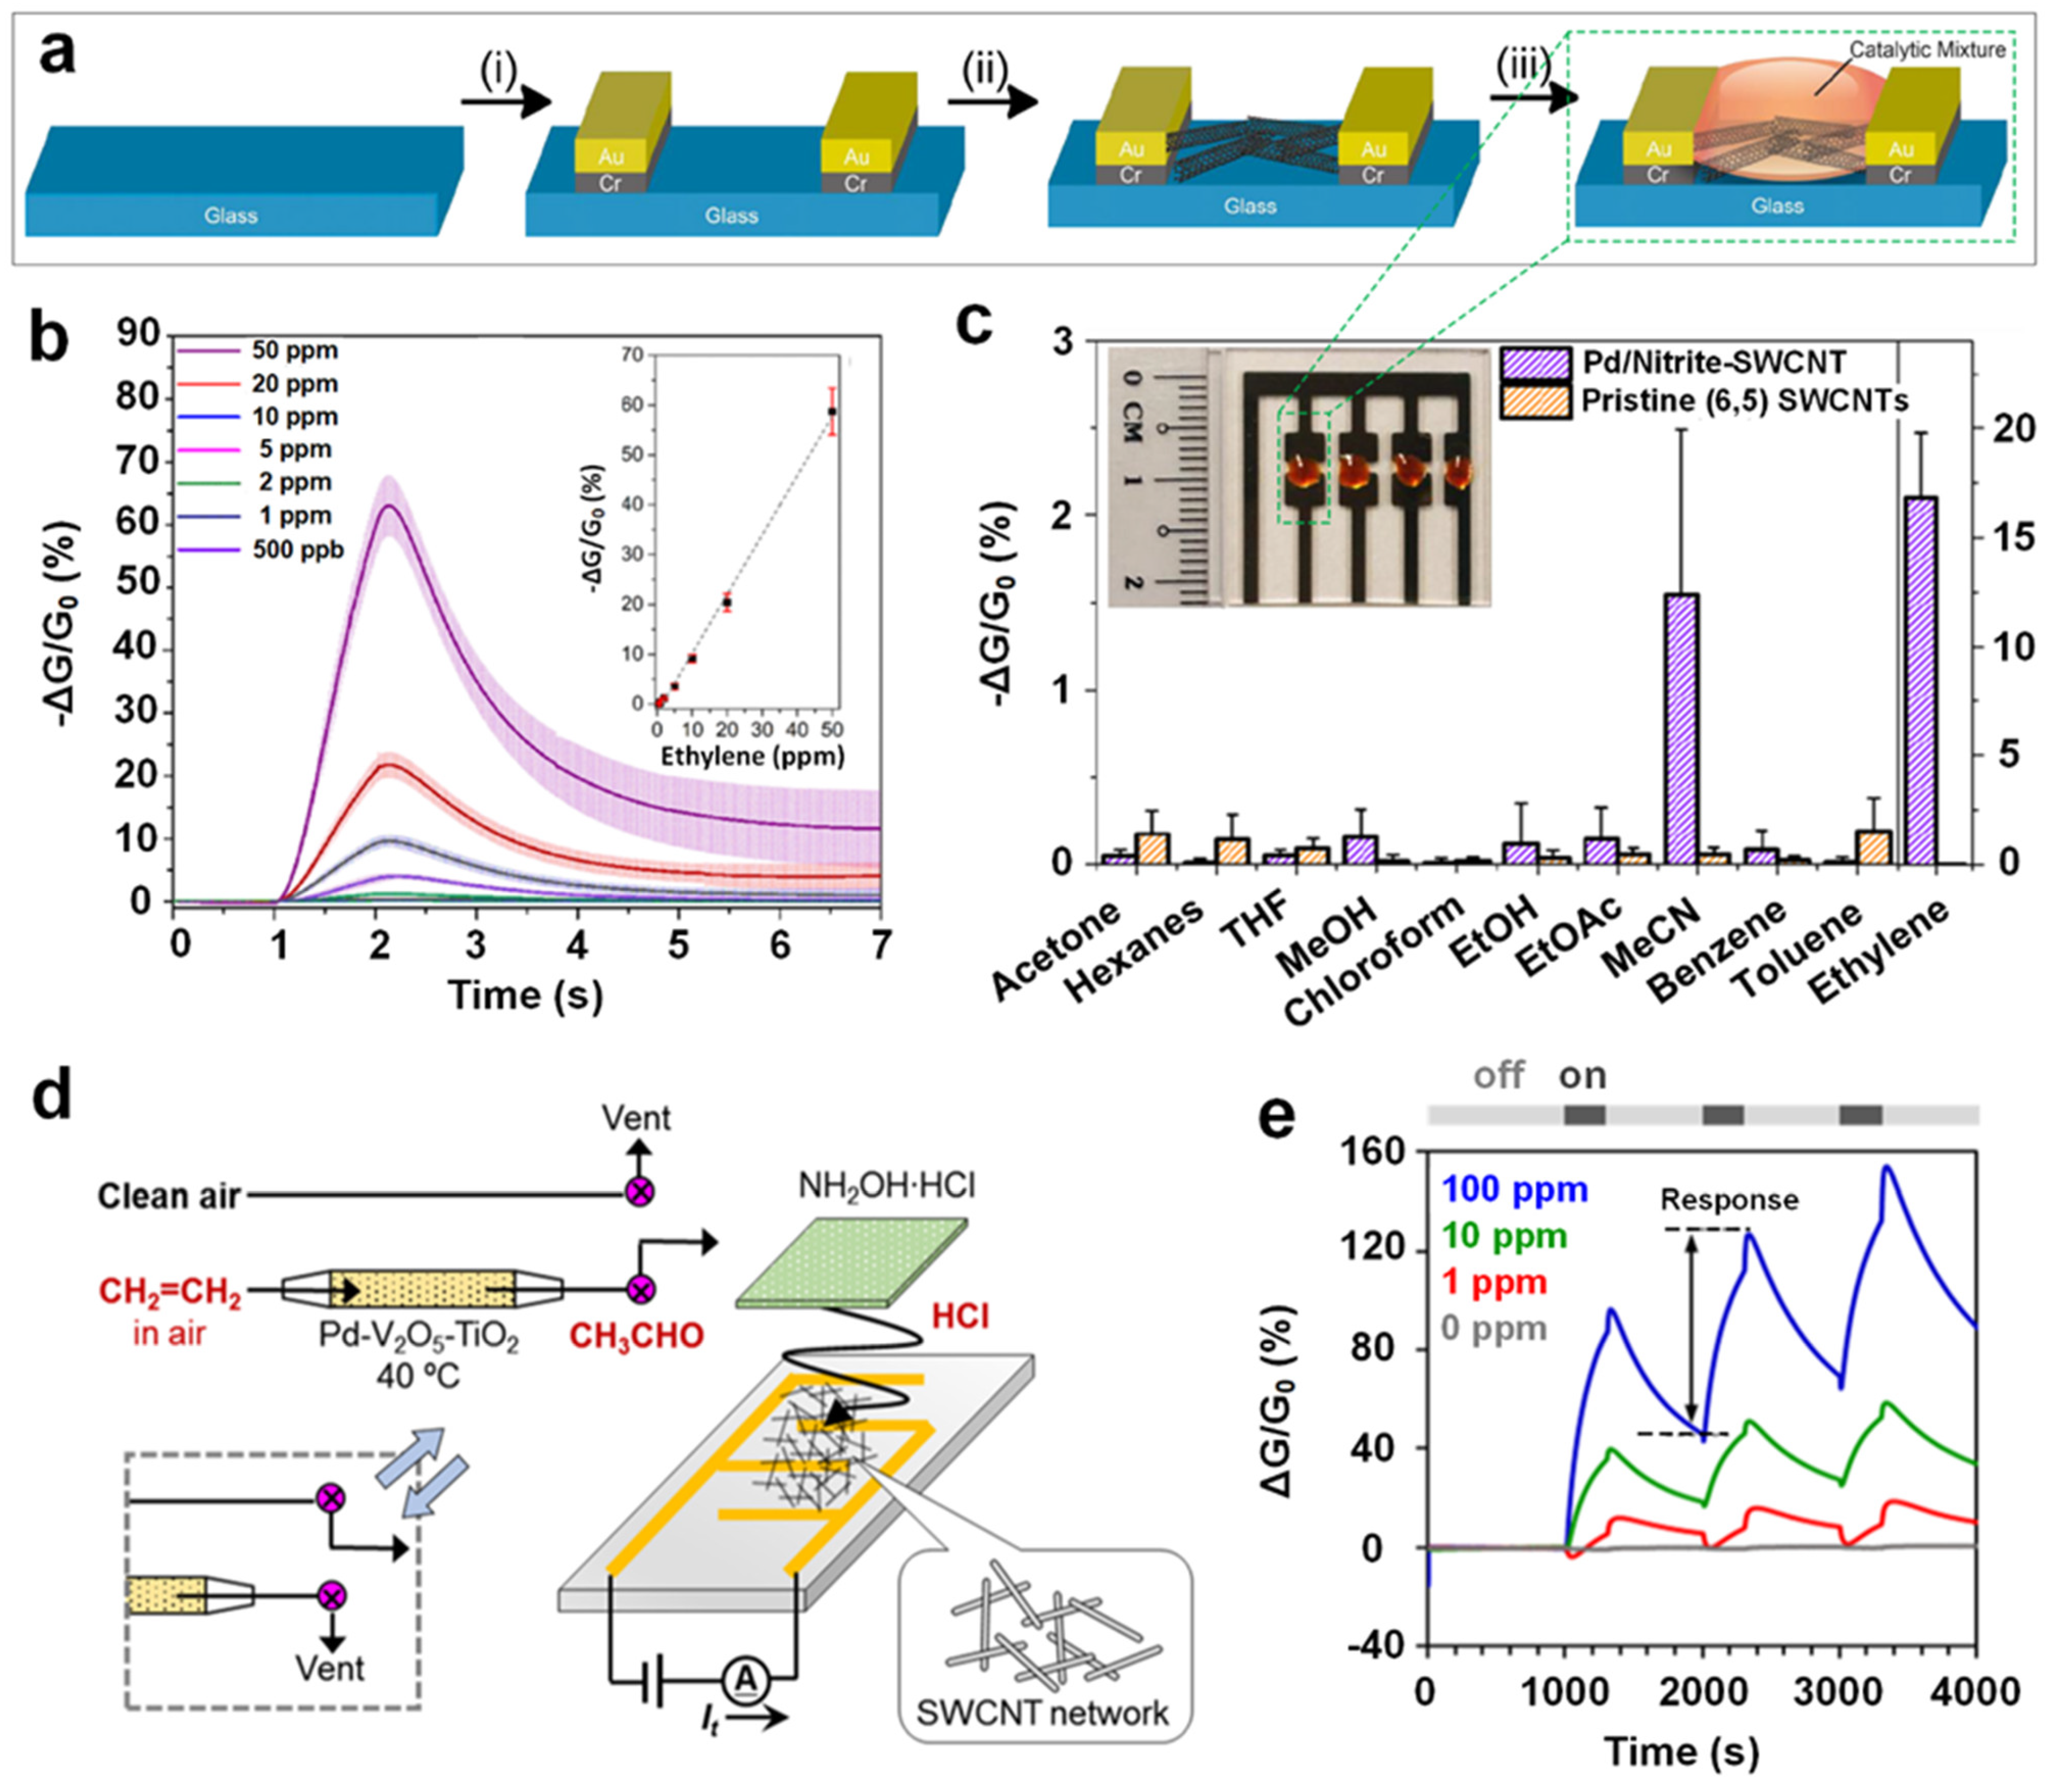
2.6. CNT-Based Chemiresistive Gas Sensors
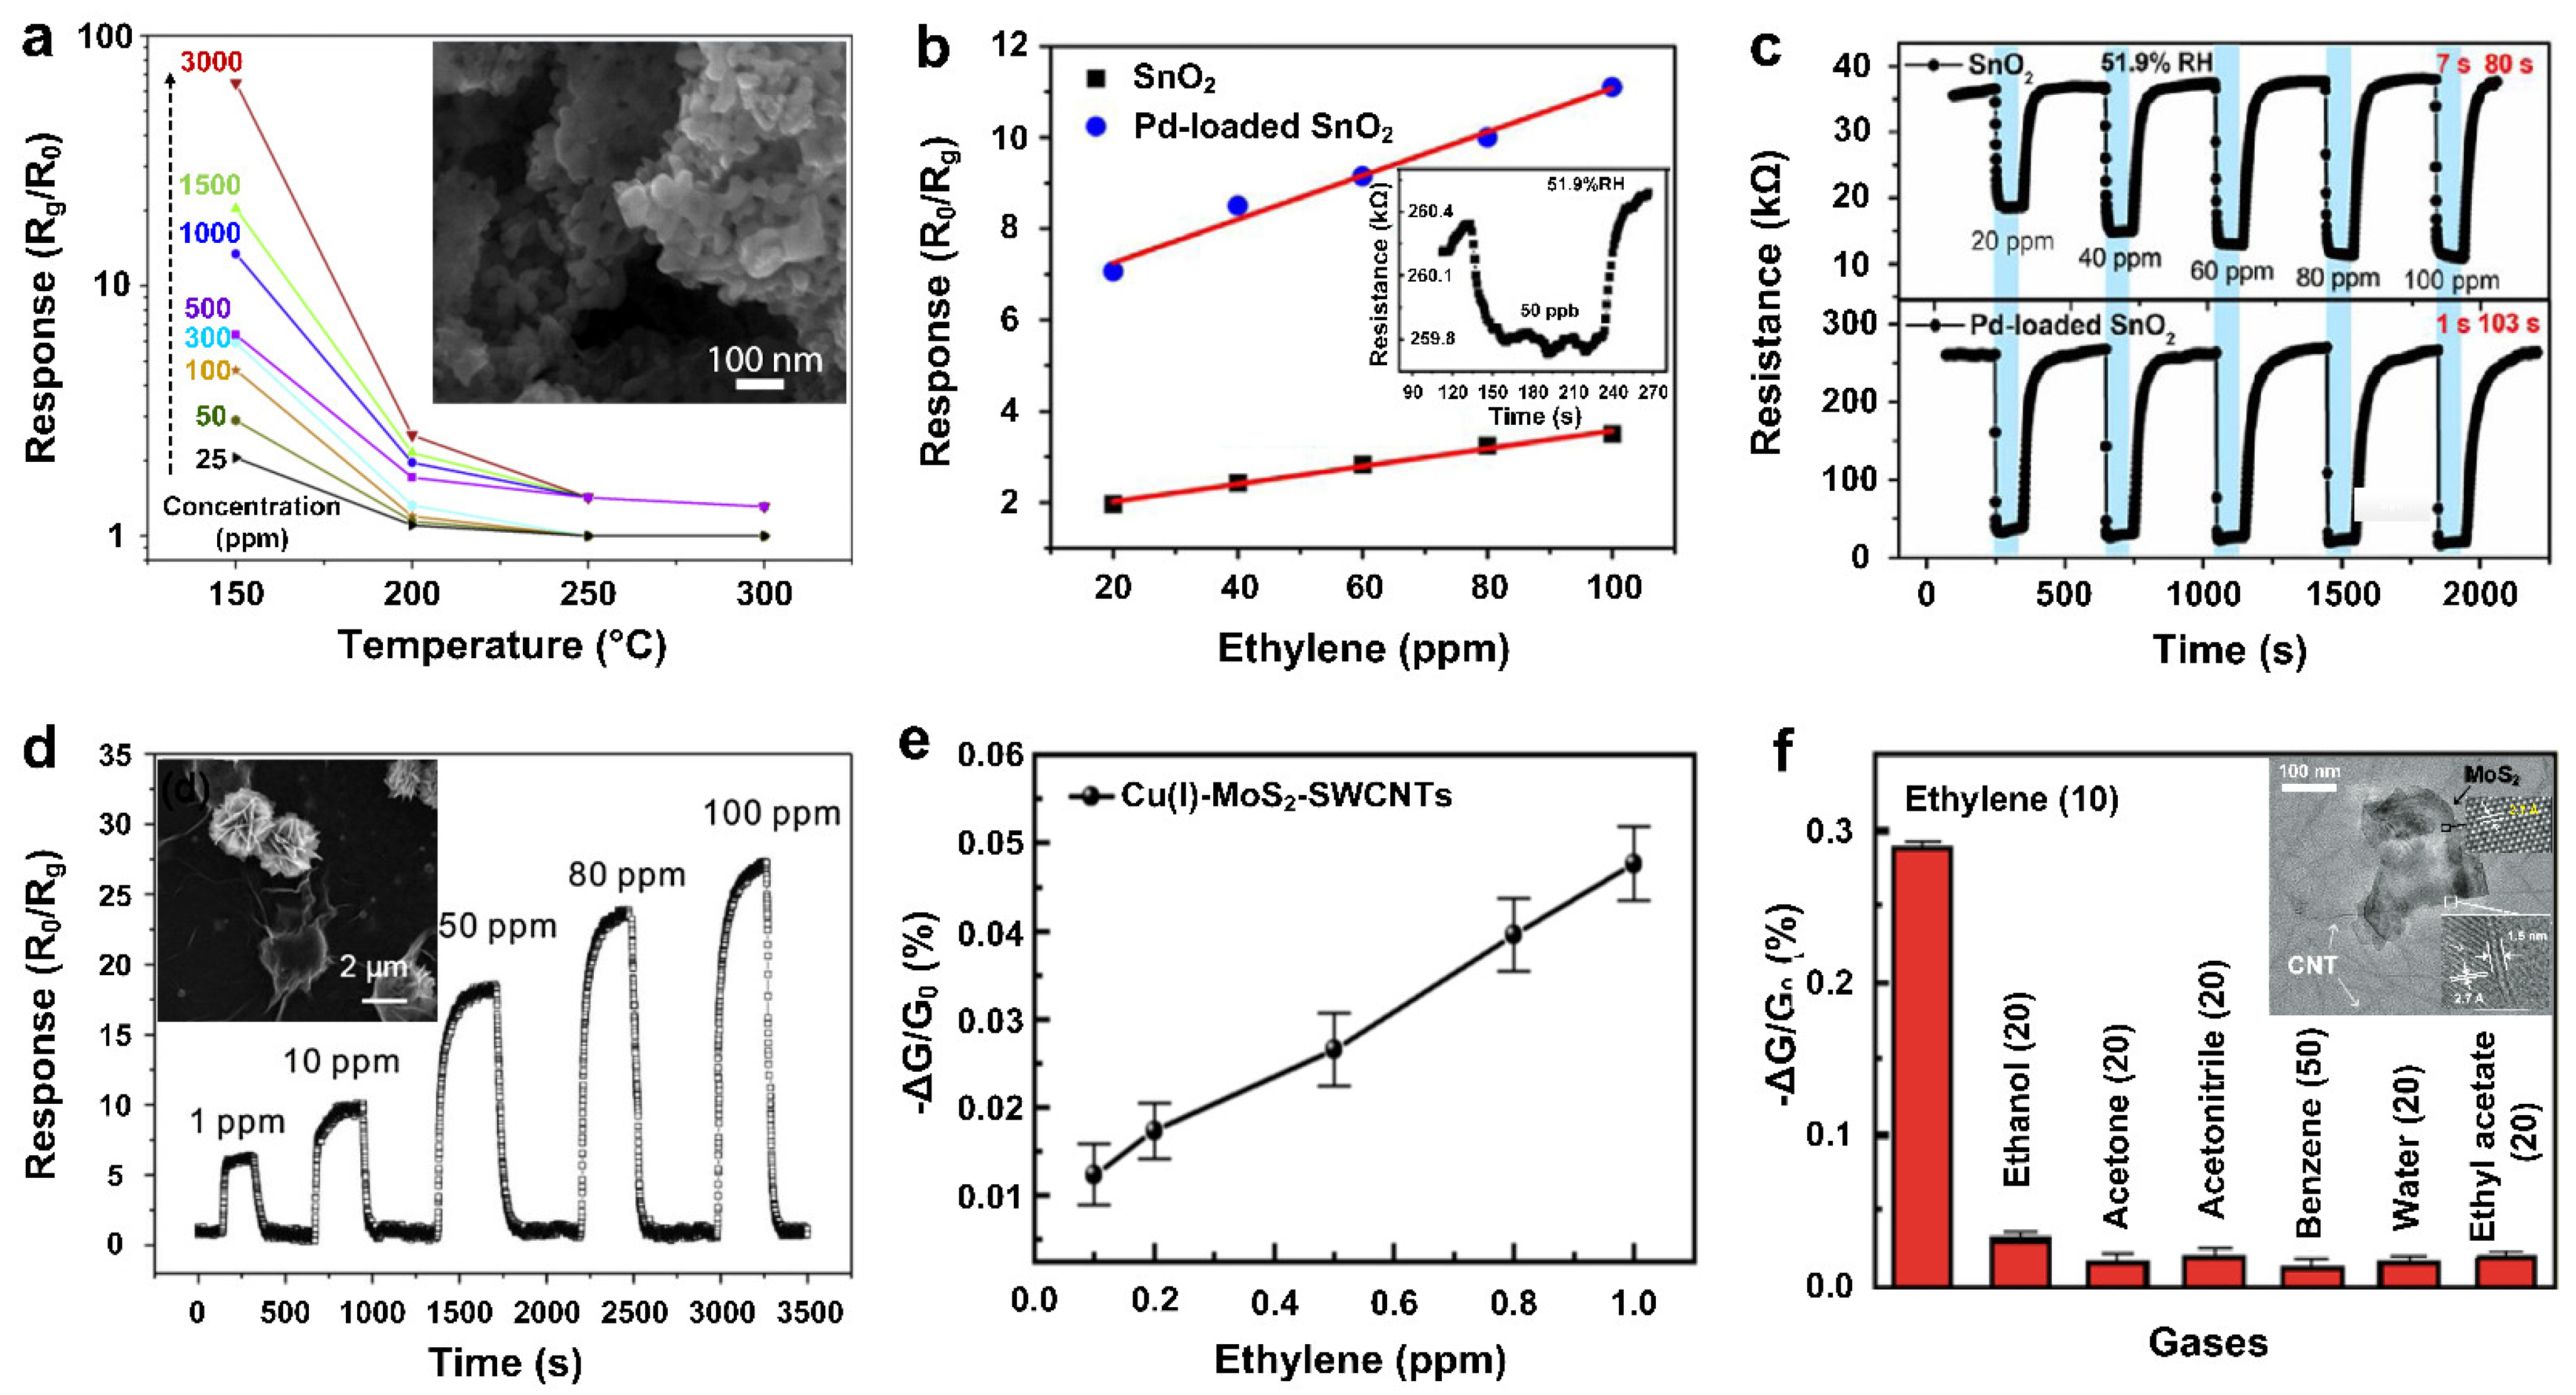
2.7. Metal Oxide-Based Chemiresistive Gas Sensors
2.8. Dual Metal Oxide-Based Chemiresistive Gas Sensors
3. Summary and Outlook
- Smaller nanostructured dimensions can generally enhance the gas-sensing response.
- The introduction of a Cu(I) complex and/or noble and transition metal nanoparticles (e.g., Pd, Pt and Ni) can potentially enhance sensitivity and selectivity towards ethylene gas detection simultaneously.
- Increasing the specific surface area and/or creating highly porous microstructure could greatly boost gas-sensing performance.
- Secondary energy stimulators, such as bias, UV/visible/IR light, and mechanical energy (e.g., piezoelectric effect), might be considered to co-assist/replace the high operating temperatures for some metal oxide-based gas sensors.
- The in-depth understanding of the science behind the interaction of gas molecules with sensing elements, such as the dipole fluctuations in ethylene molecules among subtle field effects in graphene, and the development of advanced analytical technologies to trace their corresponding sensing behaviors can pave the way to selectively distinguish decent signals for defining the sensing performance of target analytes, providing more meaningful insights into the gas detection.
Author Contributions
Funding
Institutional Review Board Statement
Informed Consent Statement
Data Availability Statement
Acknowledgments
Conflicts of Interest
References
- Wang, Z.; Fingas, M.; Yang, C.; Christensen, J.H. Crude Oil and Refined Product Fingerprinting: Principles. In Environ. Forensics; Morrison, R.D., Murphy, B.L., Eds.; Academic Press: Burlington, NT, USA, 1964; pp. 339–407. [Google Scholar]
- Aguado, S.; Bergeret, G.; Daniel, C.; Farrusseng, D. Absolute Molecular Sieve Separation of Ethylene/Ethane Mixtures with Silver Zeolite A. J. Am. Chem. Soc. 2012, 134, 14635–14637. [Google Scholar] [CrossRef] [PubMed]
- Li, J.-R.; Kuppler, R.J.; Zhou, H.-C. Selective gas adsorption and separation in metal–organic frameworks. Chem. Soc. Rev. 2009, 38, 1477. [Google Scholar] [CrossRef] [PubMed]
- Janssen, S.; Schmitt, K.; Blanke, M.; Bauersfeld, M.L.; Wöllenstein, J.; Lang, W. Ethylene detection in fruit supply chains. Philos. Trans. R. Soc. A 2014, 372, 20130311. [Google Scholar] [CrossRef] [PubMed]
- Aziz, M.S.I.; Orr-Ewing, A.J. Development and application of an optical sensor for ethene in ambient air using near infra-red cavity ring down spectroscopy and sample preconcentration. J. Environ. Monit. 2012, 14, 3094. [Google Scholar] [CrossRef]
- Calvert, J.G.; Atkinson, R.; Becker, K.H.; Kamens, R.M.; Seinfeld, J.H.; Wallington, T.H.; Yarwood, G. The Mechanisms of Atmospheric Oxidation of the Aromatic Hydrocarbons; Oxford University Press: Oxford, UK, 2002. [Google Scholar]
- De Gouw, J.A.; Te Lintel Hekkert, S.; Mellqvist, J.; Warneke, C.; Atlas, E.L.; Fehsenfeld, F.C.; Fried, A.; Frost, G.J.; Harren, F.J.M.; Holloway, J.S.; et al. Airborne Measurements of Ethene from Industrial Sources Using Laser Photo-Acoustic Spectroscopy. Environ. Sci. Technol. 2009, 43, 2437–2442. [Google Scholar] [CrossRef]
- Zhang, J.; Wei, Y.; Fang, Z. Ozone pollution: A major health hazard worldwide. Front. Immunol. 2019, 10, 2518. [Google Scholar] [CrossRef]
- Jackson, M.B. Ethylene in root growth and development. In The Plant Hormone Ethylene; Jackson, M.B., Ed.; CRC Press: Boca Raton, FL, USA, 2018; pp. 159–181. [Google Scholar]
- El-Maarouf-Bouteau, H.; Sajjad, Y.; Bazin, J.; Langlade, N.; Cristescu, S.M.; Balzergue, S.; Baudouin, E.; Bailly, C. Reactive oxygen species, abscisic acid and ethylene interact to regulate sunflower seed germination. Plant Cell Environ. 2015, 38, 364–374. [Google Scholar] [CrossRef]
- Fu, W.; Van Dijkman, T.F.; Lima, L.M.C.; Jiang, F.; Schneider, G.F.; Bouwman, E. Ultrasensitive Ethene Detector Based on a Graphene–Copper(I) Hybrid Material. Nano Lett. 2017, 17, 7980–7988. [Google Scholar] [CrossRef]
- Mallick, M.; Minhaz Hossain, S.; Das, J. Graphene Oxide Based Fruit Ripeness Sensing e-Nose. Mater. Today Proc. 2018, 5, 9866–9870. [Google Scholar] [CrossRef]
- Esser, B.; Schnorr, J.M.; Swager, T.M. Selective Detection of Ethylene Gas Using Carbon Nanotube-based Devices: Utility in Determination of Fruit Ripeness. Angew. Chem. Int. Ed. 2012, 51, 5752–5756. [Google Scholar] [CrossRef]
- Kathirvelan, J.; Vijayaraghavan, R. An infrared based sensor system for the detection of ethylene for the discrimination of fruit ripening. Infrared Phys. Technol. 2017, 85, 403–409. [Google Scholar] [CrossRef]
- Popa, C. Ethylene Measurements from Sweet Fruits Flowers Using Photoacoustic Spectroscopy. Molecules 2019, 24, 1144. [Google Scholar] [CrossRef] [PubMed]
- Fong, D.; Luo, S.-X.; Andre, R.S.; Swager, T.M. Trace Ethylene Sensing via Wacker Oxidation. ACS Cent. Sci. 2020, 6, 507–512. [Google Scholar] [CrossRef] [PubMed]
- Khan, M.I.R.; Nazir, F.; Asgher, M.; Per, T.S.; Khan, N.A. Selenium and sulfur influence ethylene formation and alleviate cadmium-induced oxidative stress by improving proline and glutathione production in wheat. J. Plant Physiol. 2015, 173, 9–18. [Google Scholar] [CrossRef]
- Dumitras, D.; Dutu, D.; Matei, C.; Magureanu, A.; Petrus, M.; Popa, C.; Patachia, M.J.R.R.i.P. Measurements of ethylene concentration by laser photoacoustic techniques with applications at breath analysis. Rom. Rep. Phys. 2008, 60, 593–602. [Google Scholar]
- Popa, C.; Patachia, M.; Banita, S.; Matei, C.; Bratu, A.; Dumitras, D.J.L.P. The level of ethylene biomarker in the renal failure of elderly patients analyzed by photoacoustic spectroscopy. Laser Phys. 2013, 23, 125701. [Google Scholar] [CrossRef]
- Kirman, C.; Li, A.; Sheehan, P.; Bus, J.; Lewis, R.; Hays, S. Ethylene oxide review: Characterization of total exposure via endogenous and exogenous pathways and their implications to risk assessment and risk management. J. Toxicol. Environ. Health B Crit. Rev. 2021, 24, 1–29. [Google Scholar] [CrossRef]
- Yoon, H.J.; Jun, D.H.; Yang, J.H.; Zhou, Z.; Yang, S.S.; Cheng, M.M.-C. Carbon dioxide gas sensor using a graphene sheet. Sens. Actuators B Chem. 2011, 157, 310–313. [Google Scholar] [CrossRef]
- Rana, M.M.; Ibrahim, D.S.; Mohd Asyraf, M.R.; Jarin, S.; Tomal, A. A review on recent advances of CNTs as gas sensors. Sens. Rev. 2017, 37, 127–136. [Google Scholar] [CrossRef]
- Drewniak, S.; Muzyka, R.; Stolarczyk, A.; Pustelny, T.; Kotyczka-Morańska, M.; Setkiewicz, M. Studies of Reduced Graphene Oxide and Graphite Oxide in the Aspect of Their Possible Application in Gas Sensors. Sensors 2016, 16, 103. [Google Scholar] [CrossRef]
- Chen, H.; Bo, R.; Shrestha, A.; Xin, B.; Nasiri, N.; Zhou, J.; Di Bernardo, I.; Dodd, A.; Saunders, M.; Lipton-Duffin, J.; et al. NiO–ZnO Nanoheterojunction Networks for Room-Temperature Volatile Organic Compounds Sensing. Adv. Opt. Mater. 2018, 6, 1800677. [Google Scholar] [CrossRef]
- Bo, R.; Zhang, F.; Bu, S.; Nasiri, N.; Di Bernardo, I.; Tran-Phu, T.; Shrestha, A.; Chen, H.; Taheri, M.; Qi, S.; et al. One-Step Synthesis of Porous Transparent Conductive Oxides by Hierarchical Self-Assembly of Aluminum-Doped ZnO Nanoparticles. ACS Appl. Mater. Interfaces 2020, 12, 9589–9599. [Google Scholar] [CrossRef] [PubMed]
- Chen, X.; Behboodian, R.; Bagnall, D.; Taheri, M.; Nasiri, N. Metal-Organic-Frameworks: Low Temperature Gas Sensing and Air Quality Monitoring. Chemosensors 2021, 9, 316. [Google Scholar] [CrossRef]
- Feng, L.; Dong, C.; Li, M.; Li, L.; Jiang, X.; Gao, R.; Wang, R.; Zhang, L.; Ning, Z.; Gao, D.; et al. Terbium-based metal-organic frameworks: Highly selective and fast respond sensor for styrene detection and construction of molecular logic gate. J. Hazard. Mater. 2020, 388, 121816. [Google Scholar] [CrossRef]
- Zhao, Q.; Duan, Z.; Yuan, Z.; Li, X.; Si, W.; Liu, B.; Zhang, Y.; Jiang, Y.; Tai, H. High performance ethylene sensor based on palladium-loaded tin oxide: Application in fruit quality detection. Chin. Chem. Lett. 2020, 31, 2045–2049. [Google Scholar] [CrossRef]
- Janssen, S.; Tessmann, T.; Lang, W. High sensitive and selective ethylene measurement by using a large-capacity-on-chip preconcentrator device. Sens. Actuator B Chem. 2014, 197, 405–413. [Google Scholar] [CrossRef]
- Zaidi, N.A.; Tahir, M.W.; Vellekoop, M.J.; Lang, W. A Gas Chromatographic System for the Detection of Ethylene Gas Using Ambient Air as a Carrier Gas. Sensors 2017, 17, 2283. [Google Scholar] [CrossRef]
- Jochum, T.; Rahal, L.; Suckert, R.J.; Popp, J.; Frosch, T. All-in-one: A versatile gas sensor based on fiber enhanced Raman spectroscopy for monitoring postharvest fruit conservation and ripening. Analyst 2016, 141, 2023–2029. [Google Scholar] [CrossRef]
- Wang, Z.; Li, Z.; Ren, W. Quartz-enhanced photoacoustic detection of ethylene using a 10.5 μm quantum cascade laser. Opt. Express 2016, 24, 4143. [Google Scholar] [CrossRef]
- Giglio, M.; Elefante, A.; Patimisco, P.; Sampaolo, A.; Sgobba, F.; Rossmadl, H.; Mackowiak, V.; Wu, H.; Tittel, F.K.; Dong, L.; et al. Quartz-enhanced photoacoustic sensor for ethylene detection implementing optimized custom tuning fork-based spectrophone. Opt. Express 2019, 27, 4271. [Google Scholar] [CrossRef]
- Wang, Z.; Geng, J.; Ren, W. Quartz-enhanced photoacoustic spectroscopy (QEPAS) detection of the ν7 band of ethylene at low pressure with CO2 interference analysis. Appl. Spectrosc. 2017, 71, 1834–1841. [Google Scholar] [CrossRef] [PubMed]
- Mohebbifar, M.R. Ppb level detection of carbonyl sulfide and ethene and study resonant frequencies using laser photoacoustic spectroscopy. Microw. Opt. Technol. Lett. 2021, 63, 2517–2522. [Google Scholar] [CrossRef]
- Gong, Z.; Chen, K.; Yang, Y.; Zhou, X.; Yu, Q. Photoacoustic spectroscopy based multi-gas detection using high-sensitivity fiber-optic low-frequency acoustic sensor. Sens. Actuators B Chem. 2018, 260, 357–363. [Google Scholar] [CrossRef]
- Chen, K.; Zhang, B.; Guo, M.; Chen, Y.; Deng, H.; Yang, B.; Liu, S.; Ma, F.; Zhu, F.; Gong, Z.; et al. Photoacoustic trace gas detection of ethylene in high-concentration methane background based on dual light sources and fiber-optic microphone. Sens. Actuators B Chem. 2020, 310, 127825. [Google Scholar] [CrossRef]
- Šetka, M.; Bahos, F.A.; Matatagui, D.; Potoček, M.; Kral, Z.; Drbohlavová, J.; Gràcia, I.; Vallejos, S. Love wave sensors based on gold nanoparticle-modified polypyrrole and their properties to ammonia and ethylene. Sens. Actuators B Chem. 2020, 304, 127337. [Google Scholar] [CrossRef]
- Tolentino, M.A.K.P.; Albano, D.R.B.; Sevilla, F.B. Piezoelectric sensor for ethylene based on silver(I)/polymer composite. Sens. Actuators B Chem. 2018, 254, 299–306. [Google Scholar] [CrossRef]
- Luo, M.; Shao, K.; Long, Z.; Wang, L.; Peng, C.; Ouyang, J.; Na, N. A paper-based plasma-assisted cataluminescence sensor for ethylene detection. Sens. Actuators B Chem. 2017, 240, 132–141. [Google Scholar] [CrossRef]
- Li, Z.; Suslick, K.S. Colorimetric Sensor Array for Monitoring CO and Ethylene. Anal. Chem. 2019, 91, 797–802. [Google Scholar] [CrossRef]
- Nguyen, L.H.; Oveissi, F.; Chandrawati, R.; Dehghani, F.; Naficy, S. Naked-Eye Detection of Ethylene Using Thiol-Functionalized Polydiacetylene-Based Flexible Sensors. ACS Sens. 2020, 5, 1921–1928. [Google Scholar] [CrossRef]
- Toldra-Reig, F.; Serra, J. Development of Potentiometric Sensors for C2H4 Detection. Sensors 2018, 18, 2992. [Google Scholar] [CrossRef]
- Toldra-Reig, F.; Serra, J.M. Surface Functionalization with Ni of Fe0.7Cr1.3O3/8YSZ Electrode in a Potentiometric Sensor To Selectively Detect C2H4. ACS Appl. Nano Mater. 2018, 1, 6666–6673. [Google Scholar] [CrossRef]
- Sekhar, P.K.; Ludwig, T.; Wilhelm, M.; Graf, D.; Riheen, M.A.; Mathur, S. Potentiometric Ethene Sensor for Postharvest Detection Applications. J. Electrochem. Soc. 2019, 166, B1477–B1482. [Google Scholar] [CrossRef]
- Besar, K.; Dailey, J.; Katz, H.E. Ethylene Detection Based on Organic Field-Effect Transistors with Porogen and Palladium Particle Receptor Enhancements. ACS Appl. Mater. Interfaces 2017, 9, 1173–1177. [Google Scholar] [CrossRef] [PubMed]
- Hasegawa, Y.; Spetz, A.L.; Puglisi, D. Ethylene gas sensor for evaluating postharvest ripening of fruit. In Proceedings of the IEEE 6th Global Conference on Consumer Electronics (GCCE), Nagoya, Japan, 12–15 October 2021. [Google Scholar]
- Kathirvelan, J.; Vijayaraghavan, R. Development of Prototype Laboratory Setup for Selective Detection of Ethylene Based on Multiwalled Carbon Nanotubes. J. Sens. 2014, 2014, 395035. [Google Scholar] [CrossRef]
- Adjizian, J.-J.; Leghrib, R.; Koos, A.A.; Suarez-Martinez, I.; Crossley, A.; Wagner, P.; Grobert, N.; Llobet, E.; Ewels, C.P. Boron- and nitrogen-doped multi-wall carbon nanotubes for gas detection. Carbon 2014, 66, 662–673. [Google Scholar] [CrossRef]
- Ishihara, S.; Bahuguna, A.; Kumar, S.; Krishnan, V.; Labuta, J.; Nakanishi, T.; Tanaka, T.; Kataura, H.; Kon, Y.; Hong, D. Cascade Reaction-Based Chemiresistive Array for Ethylene Sensing. ACS Sens. 2020, 5, 1405–1410. [Google Scholar] [CrossRef]
- Sholehah, A.; Pusparasmi, D.; Yuliarto, B. The application of zinc oxide layer as ethylene sensor. IOP Conf. Ser. Mater. Sci. Eng. 2019, 541, 012051. [Google Scholar] [CrossRef]
- Sholehah, A.; Faroz, D.F.; Huda, N.; Utari, L.; Septiani, N.L.W.; Yuliarto, B. Synthesis of ZnO Flakes on Flexible Substrate and Its Application on Ethylene Sensing at Room Temperature. Chemosensors 2019, 8, 2. [Google Scholar] [CrossRef]
- Husain, A.; Ahmad, S.; Mohammad, F. Thermally stable and highly sensitive ethene gas sensor based on polythiophene/zirconium oxide nanocomposites. Mater. Today Commun. 2019, 20, 100574. [Google Scholar] [CrossRef]
- Alharbi, A.A.; Sackmann, A.; Weimar, U.; Bârsan, N. A highly selective sensor to acetylene and ethylene based on LaFeO3. Sens. Actuators B Chem. 2020, 303, 127204. [Google Scholar] [CrossRef]
- Akhir, M.A.M.; Rezan, S.; Mohamed, K.; Arafat, M.M.; Haseeb, A.; Lee, H. Synthesis of SnO2 Nanoparticles via Hydrothermal Method and Their Gas Sensing Applications for Ethylene Detection. Mater. Today Chem. 2019, 17, 810–819. [Google Scholar] [CrossRef]
- Li, B.; Li, M.; Meng, F.; Liu, J. Highly sensitive ethylene sensors using Pd nanoparticles and rGO modified flower-like hierarchical porous α-Fe2O3. Sens. Actuators B Chem. 2019, 290, 396–405. [Google Scholar] [CrossRef]
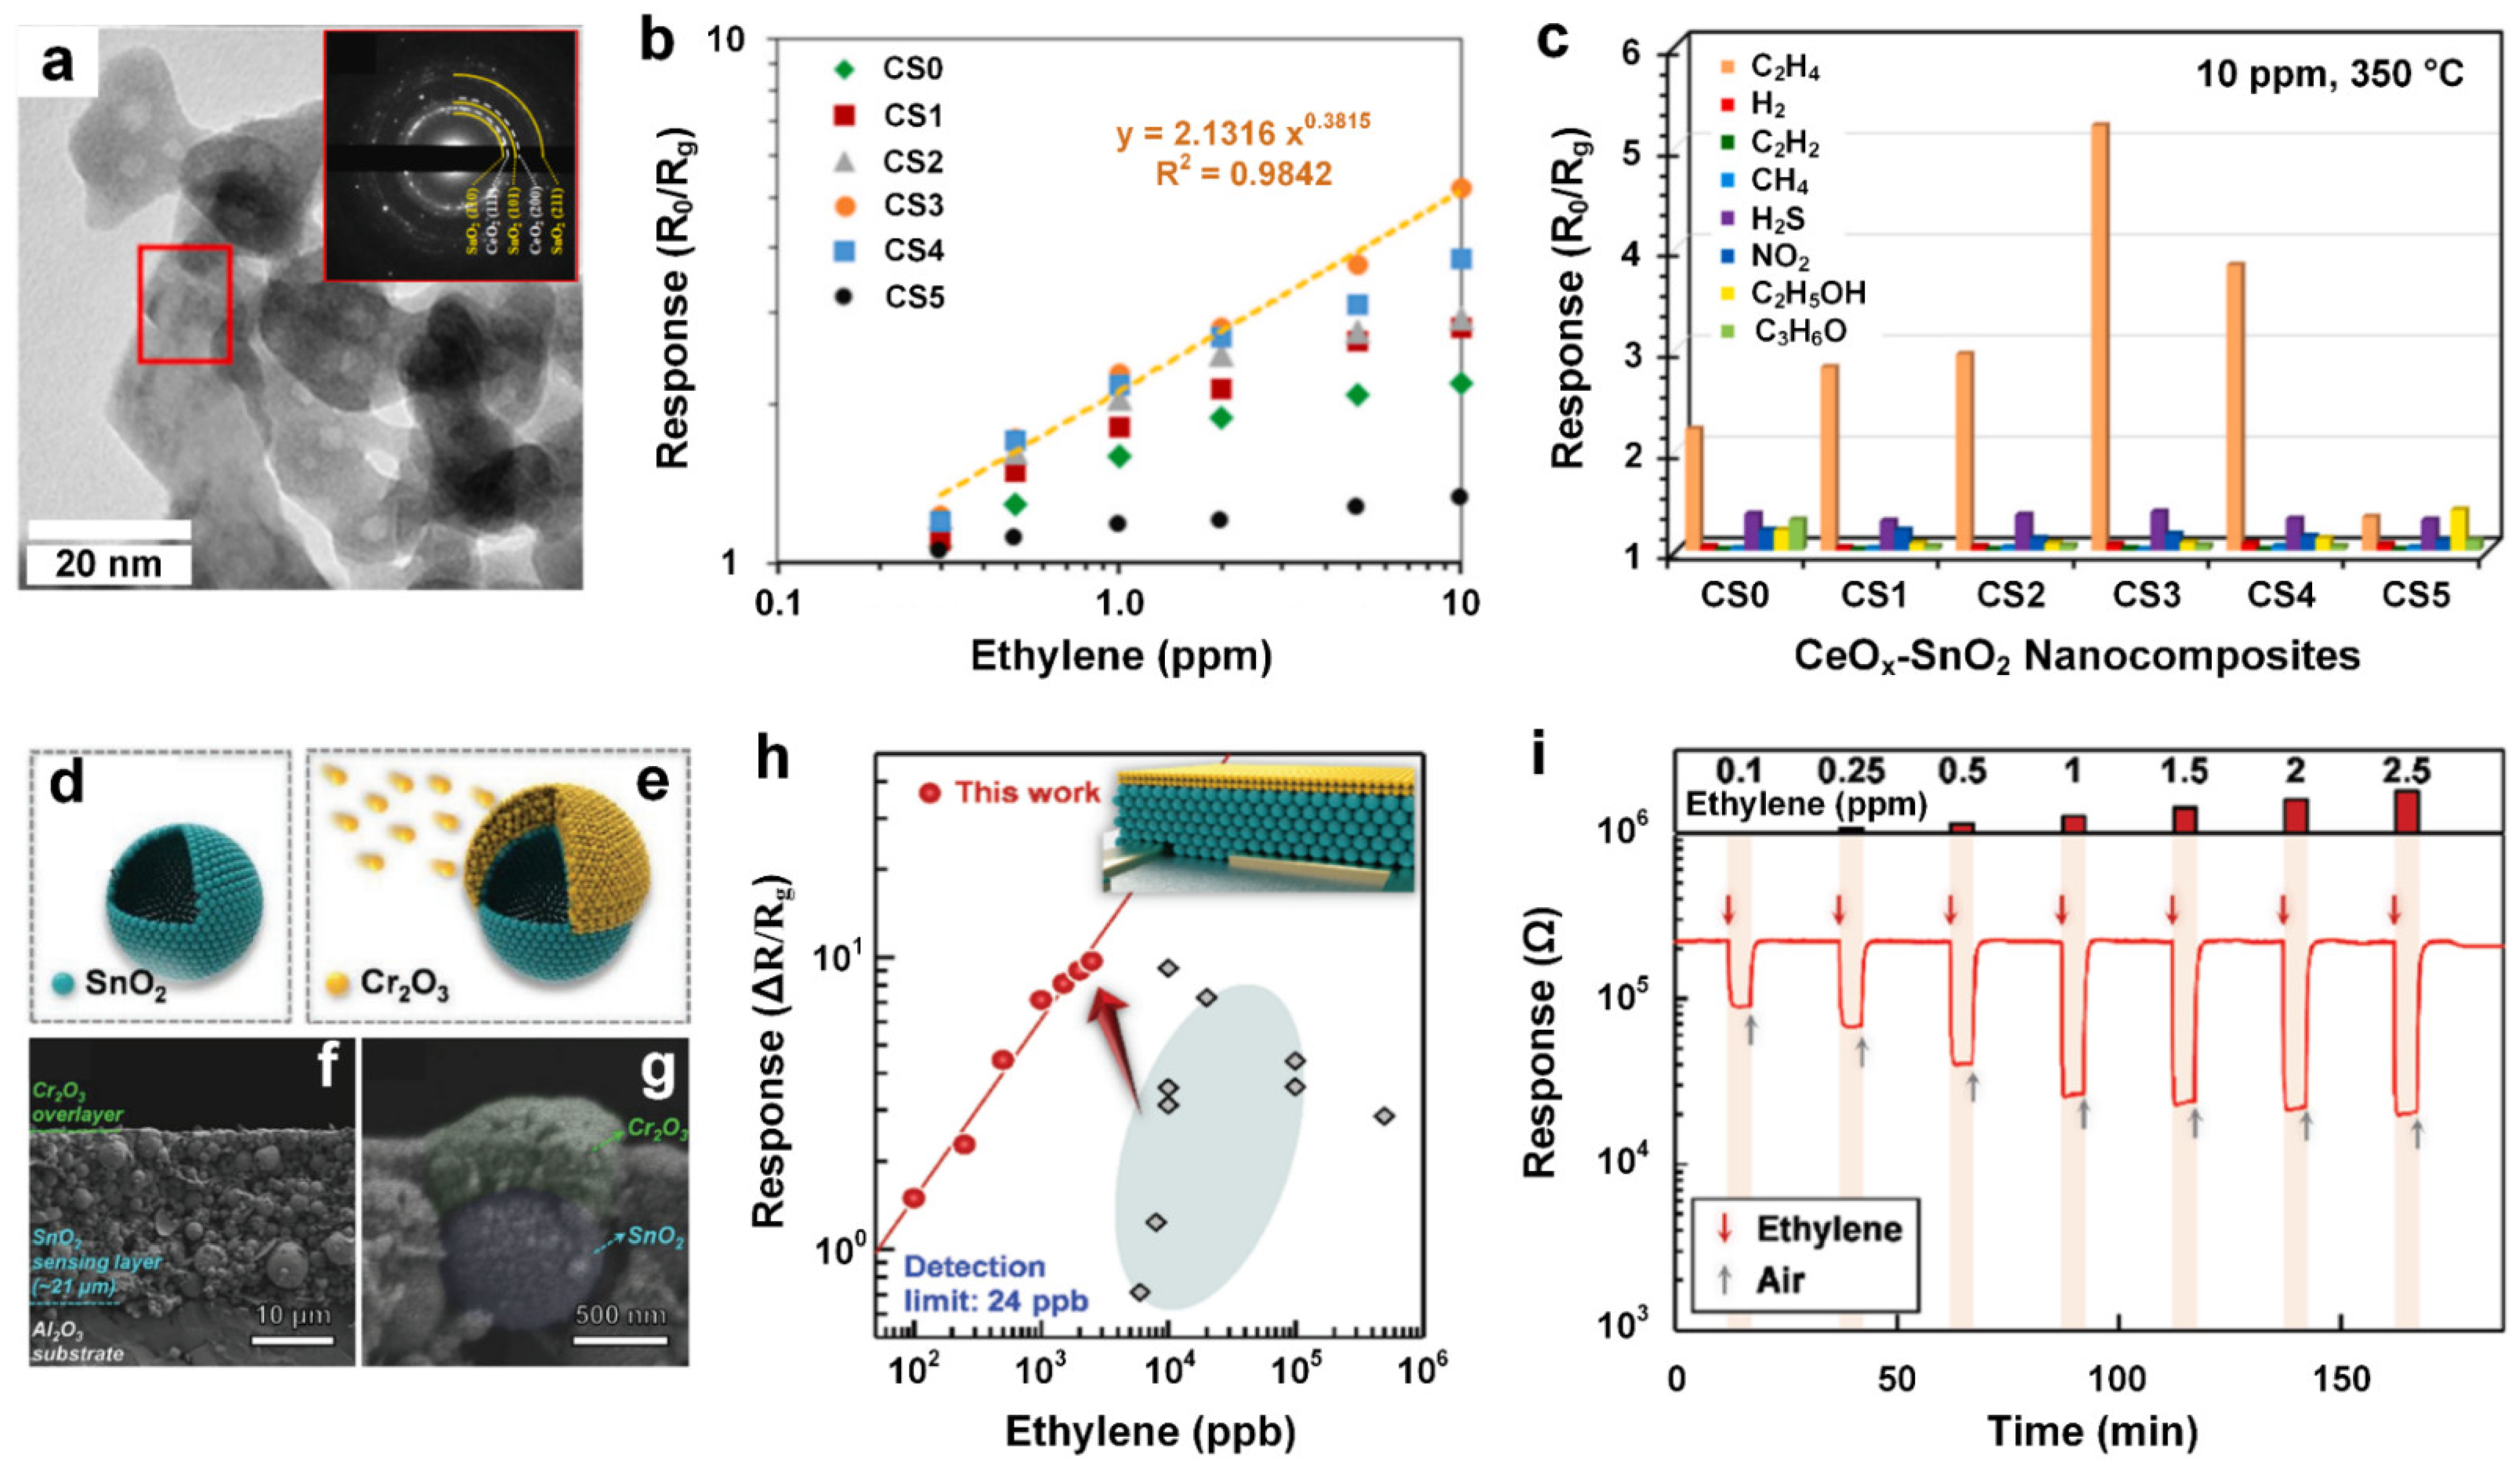
- Leangtanom, P.; Wisitsoraat, A.; Jaruwongrungsee, K.; Chanlek, N.; Phanichphant, S.; Kruefu, V. Highly sensitive and selective ethylene gas sensors based on CeOx-SnO2 nanocomposites prepared by a Co-precipitation method. Mater. Chem Phys. 2020, 254, 123540. [Google Scholar] [CrossRef]
- Jeong, S.Y.; Moon, Y.K.; Kim, T.H.; Park, S.W.; Kim, K.B.; Kang, Y.C.; Lee, J.H. A New Strategy for Detecting Plant Hormone Ethylene Using Oxide Semiconductor Chemiresistors: Exceptional Gas Selectivity and Response Tailored by Nanoscale Cr2O3 Catalytic Overlayer. Adv. Sci. 2020, 7, 1903093. [Google Scholar] [CrossRef] [PubMed]
- Kathirvelan, J.; Vijayaraghavan, R.; Thomas, A. Ethylene detection using TiO2–WO3 composite sensor for fruit ripening applications. Sens. Rev. 2017, 37, 147–154. [Google Scholar] [CrossRef]
- Karasek, F.W.; Clement, R.E. Basic Gas Chromatography-Mass Spectrometry: Principles and Techniques; Elsevier Science: Amsterdam, The Netherlands, 2012. [Google Scholar]
- Crowder, J.G.; Smith, S.D.; Vass, A.; Keddie, J. Infrared Methods for Gas Detection. In Mid-infrared Semiconductor Optoelectronics; Krier, A., Ed.; Springer: London, UK, 2006; pp. 595–613. [Google Scholar]
- De Biasio, M.; Leitner, R.; Krall, C.; Krivec, M.; Wilk, A.; Mizaikoff, B.; Waldner, R.; Starmans, F.; Maier, D. Ethylene gas sensing using non-dispersive infrared spectroscopy. In Proceedings of the 2016 IEEE SENSORS, Orlando, FL, USA, 30 October–3 November 2016; IEEE: Orlando, FL, USA, 2016. [Google Scholar]
- Ozturk, S.; Esin, Y.E.; Artan, Y.; Ozdil, O.; Demirel, B. Importance Of Band Selection For Ethene And Methanol Gas Detection In Hyperspectral Imagery. In Proceedings of the 9th Workshop on Hyperspectral Image and Signal Processing: Evolution in Remote Sensing (WHISPERS), Amsterdam, The Netherlands, 23–26 September 2018. [Google Scholar]
- Lang, Z.; Qiao, S.; He, Y.; Ma, Y. Quartz tuning fork-based demodulation of an acoustic signal induced by photo-thermo-elastic energy conversion. Photoacoustics 2021, 22, 100272. [Google Scholar] [CrossRef]
- Giglio, M.; Patimisco, P.; Sampaolo, A.; Scamarcio, G.; Tittel, F.K.; Spagnolo, V. Allan Deviation Plot as a Tool for Quartz-Enhanced Photoacoustic Sensors Noise Analysis. IEEE Trans. Ultrason. Ferroelectr. Freq. Control 2016, 63, 555–560. [Google Scholar] [CrossRef]
- Hu, J.; Zhang, L.; Lv, Y. Recent advances in cataluminescence gas sensor: Materials and methodologies. Appl. Spectrosc. Rev. 2019, 54, 306–324. [Google Scholar] [CrossRef]
- Li, L.; Zhang, L.; Zhao, Y.; Chen, Z. Colorimetric detection of Hg(II) by measurement the color alterations from the “before” and “after” RGB images of etched triangular silver nanoplates. Mikrochim. Acta 2018, 185, 235. [Google Scholar] [CrossRef]
- Pasierb, P.; Rekas, M. Solid-state potentiometric gas sensors—current status and future trends. J. Solid State Electrochem. 2009, 13, 3–25. [Google Scholar] [CrossRef]
- Toldra-Reig, F.; Serra, J.M. Potentiometric C2H4-Selective Detection on Solid-State Sensors Activated with Bifunctional Catalytic Nanoparticles. Chemosensors 2021, 9, 274. [Google Scholar] [CrossRef]
- Feng, P.; Shao, F.; Shi, Y.; Wan, Q. Gas Sensors Based on Semiconducting Nanowire Field-Effect Transistors. Sensors 2014, 14, 17406–17429. [Google Scholar] [CrossRef] [PubMed]
- Vu, C.A.; Chen, W.Y. Field-Effect Transistor Biosensors for Biomedical Applications: Recent Advances and Future Prospects. Sensors 2019, 19, 4214. [Google Scholar] [CrossRef] [PubMed]
- Khim, D.; Ryu, G.-S.; Park, W.-T.; Kim, H.; Lee, M.; Noh, Y.-Y. Precisely Controlled Ultrathin Conjugated Polymer Films for Large Area Transparent Transistors and Highly Sensitive Chemical Sensors. Adv. Mater. 2016, 28, 2752–2759. [Google Scholar] [CrossRef] [PubMed]
- Fan, H.; Han, S.; Song, Z.; Yu, J.; Katz, H.E. Organic field-effect transistor gas sensor based on GO/PMMA hybrid dielectric for the enhancement of sensitivity and selectivity to ammonia. Org. Electron. 2019, 67, 247–252. [Google Scholar] [CrossRef]
- Wang, Z.; Shi, X.; Tolbert, L.M.; Wang, F.; Liang, Z.; Costinett, D.; Blalock, B.J. A high temperature silicon carbide mosfet power module with integrated silicon-on-insulator-based gate drive. IEEE Trans. Power Syst. 2015, 30, 1432–1445. [Google Scholar] [CrossRef]
- Sciuto, A.; Calcagno, L.; Di Franco, S.; Pellegrino, D.; Selgi, L.M.; D’Arrigo, G. Radiation Hardness of 4H-SiC P-N Junction UV Photo-Detector. Materials 2021, 15, 264. [Google Scholar] [CrossRef]
- Guo, H.; Wang, Y.; Chen, S.; Zhang, G.; Zhang, H.; Li, Z. PECVD SiC as a Chemical Resistant Material in MEMS. In Proceedings of the 2006 1st IEEE International Conference on Nano/Micro Engineered and Molecular Systems, Zhuhai, China, 18–21 January 2006. [Google Scholar]
- Yáñez-Sedeño, P.; Pingarrón, J.M.; Riu, J.; Rius, F.X. Electrochemical sensing based on carbon nanotubes. TrAC Trends Anal. Chem. 2010, 29, 939–953. [Google Scholar] [CrossRef]
- Tang, R.; Shi, Y.; Hou, Z.; Wei, L. Carbon Nanotube-Based Chemiresistive Sensors. Sensors 2017, 17, 882. [Google Scholar] [CrossRef]
- Aldehydes and Ketones. Available online: https://chem.libretexts.org/Bookshelves/Organic_Chemistry/Supplemental_Modules_(Organic_Chemistry)/Aldehydes_and_Ketones (accessed on 27 June 2022).
- Nasiri, N.; Clarke, C. Nanostructured Chemiresistive Gas Sensors for Medical Applications. Sensors 2019, 19, 462. [Google Scholar] [CrossRef]
- Chen, X.; Leishman, M.; Bagnall, D.; Nasiri, N. Nanostructured Gas Sensors: From Air Quality and Environmental Monitoring to Healthcare and Medical Applications. Nanomaterials 2021, 11, 1927. [Google Scholar] [CrossRef] [PubMed]
- Tricoli, A.; Nasiri, N.; De, S. Wearable and Miniaturized Sensor Technologies for Personalized and Preventive Medicine. Adv. Funct. Mater. 2017, 27, 1605271. [Google Scholar] [CrossRef]
- Nasiri, N.; Clarke, C. Nanostructured Gas Sensors for Medical and Health Applications: Low to High Dimensional Materials. Biosensors 2019, 9, 43. [Google Scholar] [CrossRef] [PubMed]
- Chen, W.Y.; Yermembetova, A.; Washer, B.M.; Jiang, X.; Shuvo, S.N.; Peroulis, D.; Wei, A.; Stanciu, L.A. Selective Detection of Ethylene by MoS2–Carbon Nanotube Networks Coated with Cu(I)–Pincer Complexes. ACS Sens. 2020, 5, 1699–1706. [Google Scholar] [CrossRef]
- Chan, N.Y.; Zhao, M.; Huang, J.; Au, K.; Wong, M.H.; Yao, H.M.; Lu, W.; Chen, Y.; Ong, C.W.; Chan, H.L.W.; et al. Highly Sensitive Gas Sensor by the LaAlO3/SrTiO3 Heterostructure with Pd Nanoparticle Surface Modulation. Adv. Mater. 2014, 26, 5962–5968. [Google Scholar] [CrossRef]
- Daripa, S.; Khawas, K.; Behere, R.P.; Verma, R.; Kuila, B.K. Efficient Moisture-Induced Energy Harvesting from Water-Soluble Conjugated Block Copolymer-Functionalized Reduced Graphene Oxide. ACS Omega 2021, 6, 7257–7265. [Google Scholar] [CrossRef]
- Choi, W.; Choudhary, N.; Han, G.H.; Park, J.; Akinwande, D.; Lee, Y.H. Recent development of two-dimensional transition metal dichalcogenides and their applications. Mater. Today 2017, 20, 116–130. [Google Scholar] [CrossRef]
- Li, B.; Zhou, Q.; Peng, S.; Liao, Y. Recent Advances of SnO2-Based Sensors for Detecting Volatile Organic Compounds. Front. Chem. 2020, 8, 321. [Google Scholar] [CrossRef]


| Type | Materials | Fabrication Methods | OT $ (°C) | Interf. Gases ♦ | RH § (%) | Con. * (ppm) | Response | Res./Rec. + (s) | LOD & (ppb) | On-Site Trial | Refs. |
|---|---|---|---|---|---|---|---|---|---|---|---|
| GC | Large-capacity-on-chip preconcentrator device | 200 | - | - | 100 | 1.9 #; (ΔI) | - | 50 | - | [29] | |
| Gas Chromatographic System | 45 | Ambient air | - | 0.4 | 0.2 V #; (ΔV) | - | 2.3 | - | [30] | ||
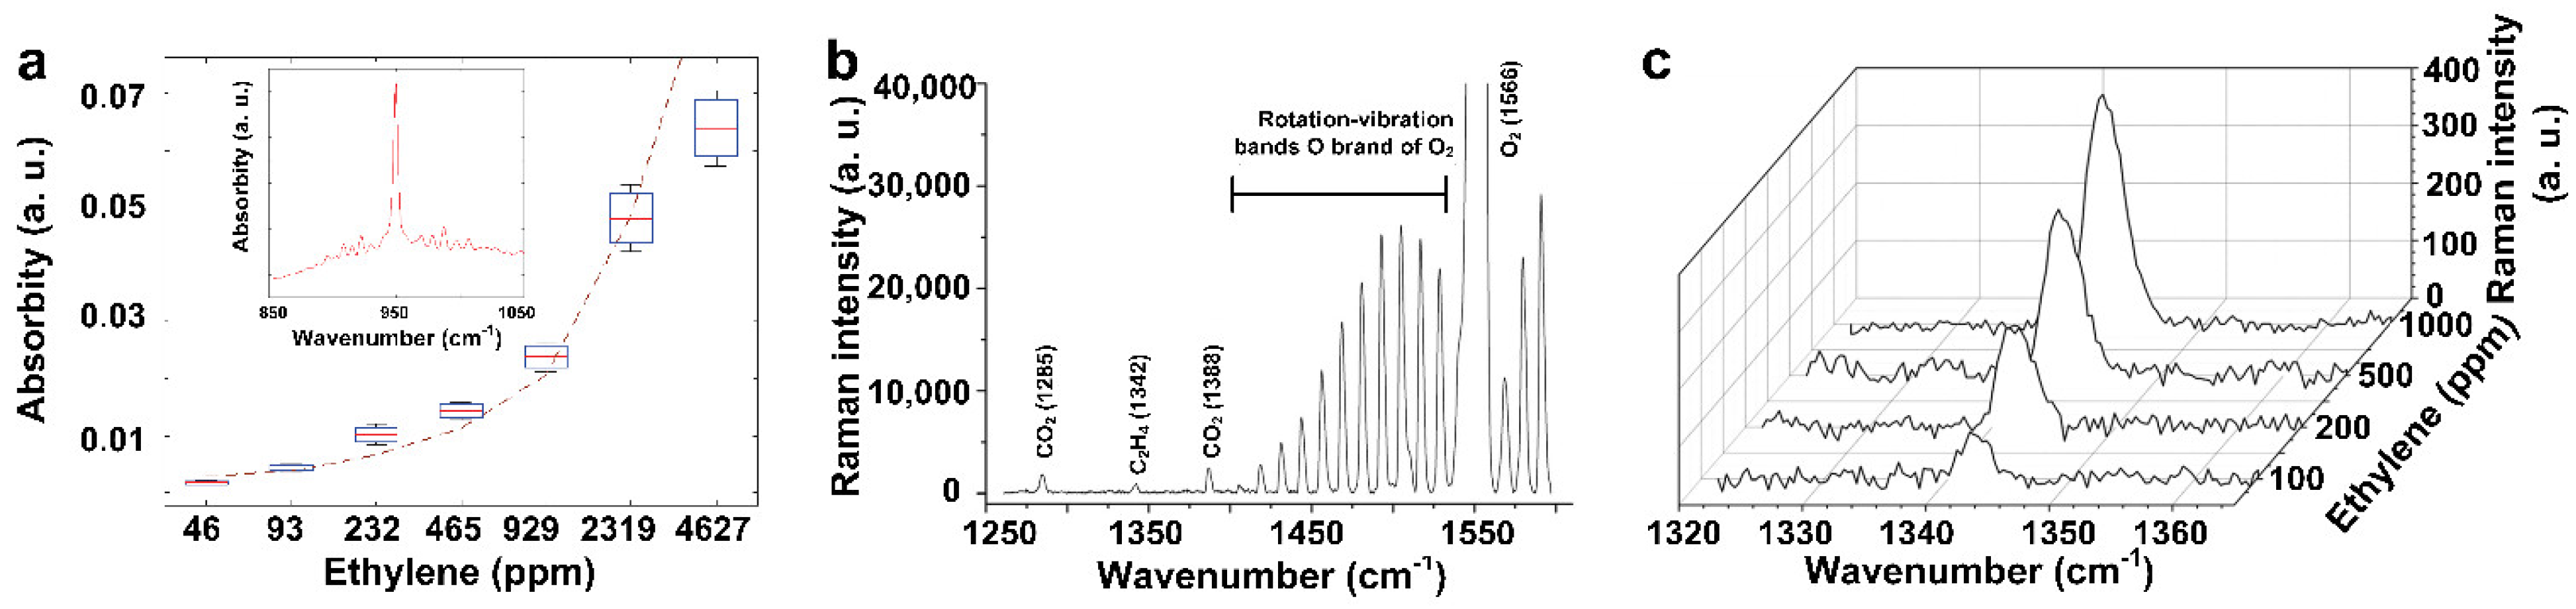
| Raman | Hollow-core photonic crystal fibers | RT | O2, CO2, NH3 and N2 | - | 1000 | 350 #; (IRaman) a | 600 Φ | 100,000 | - | [31] | |
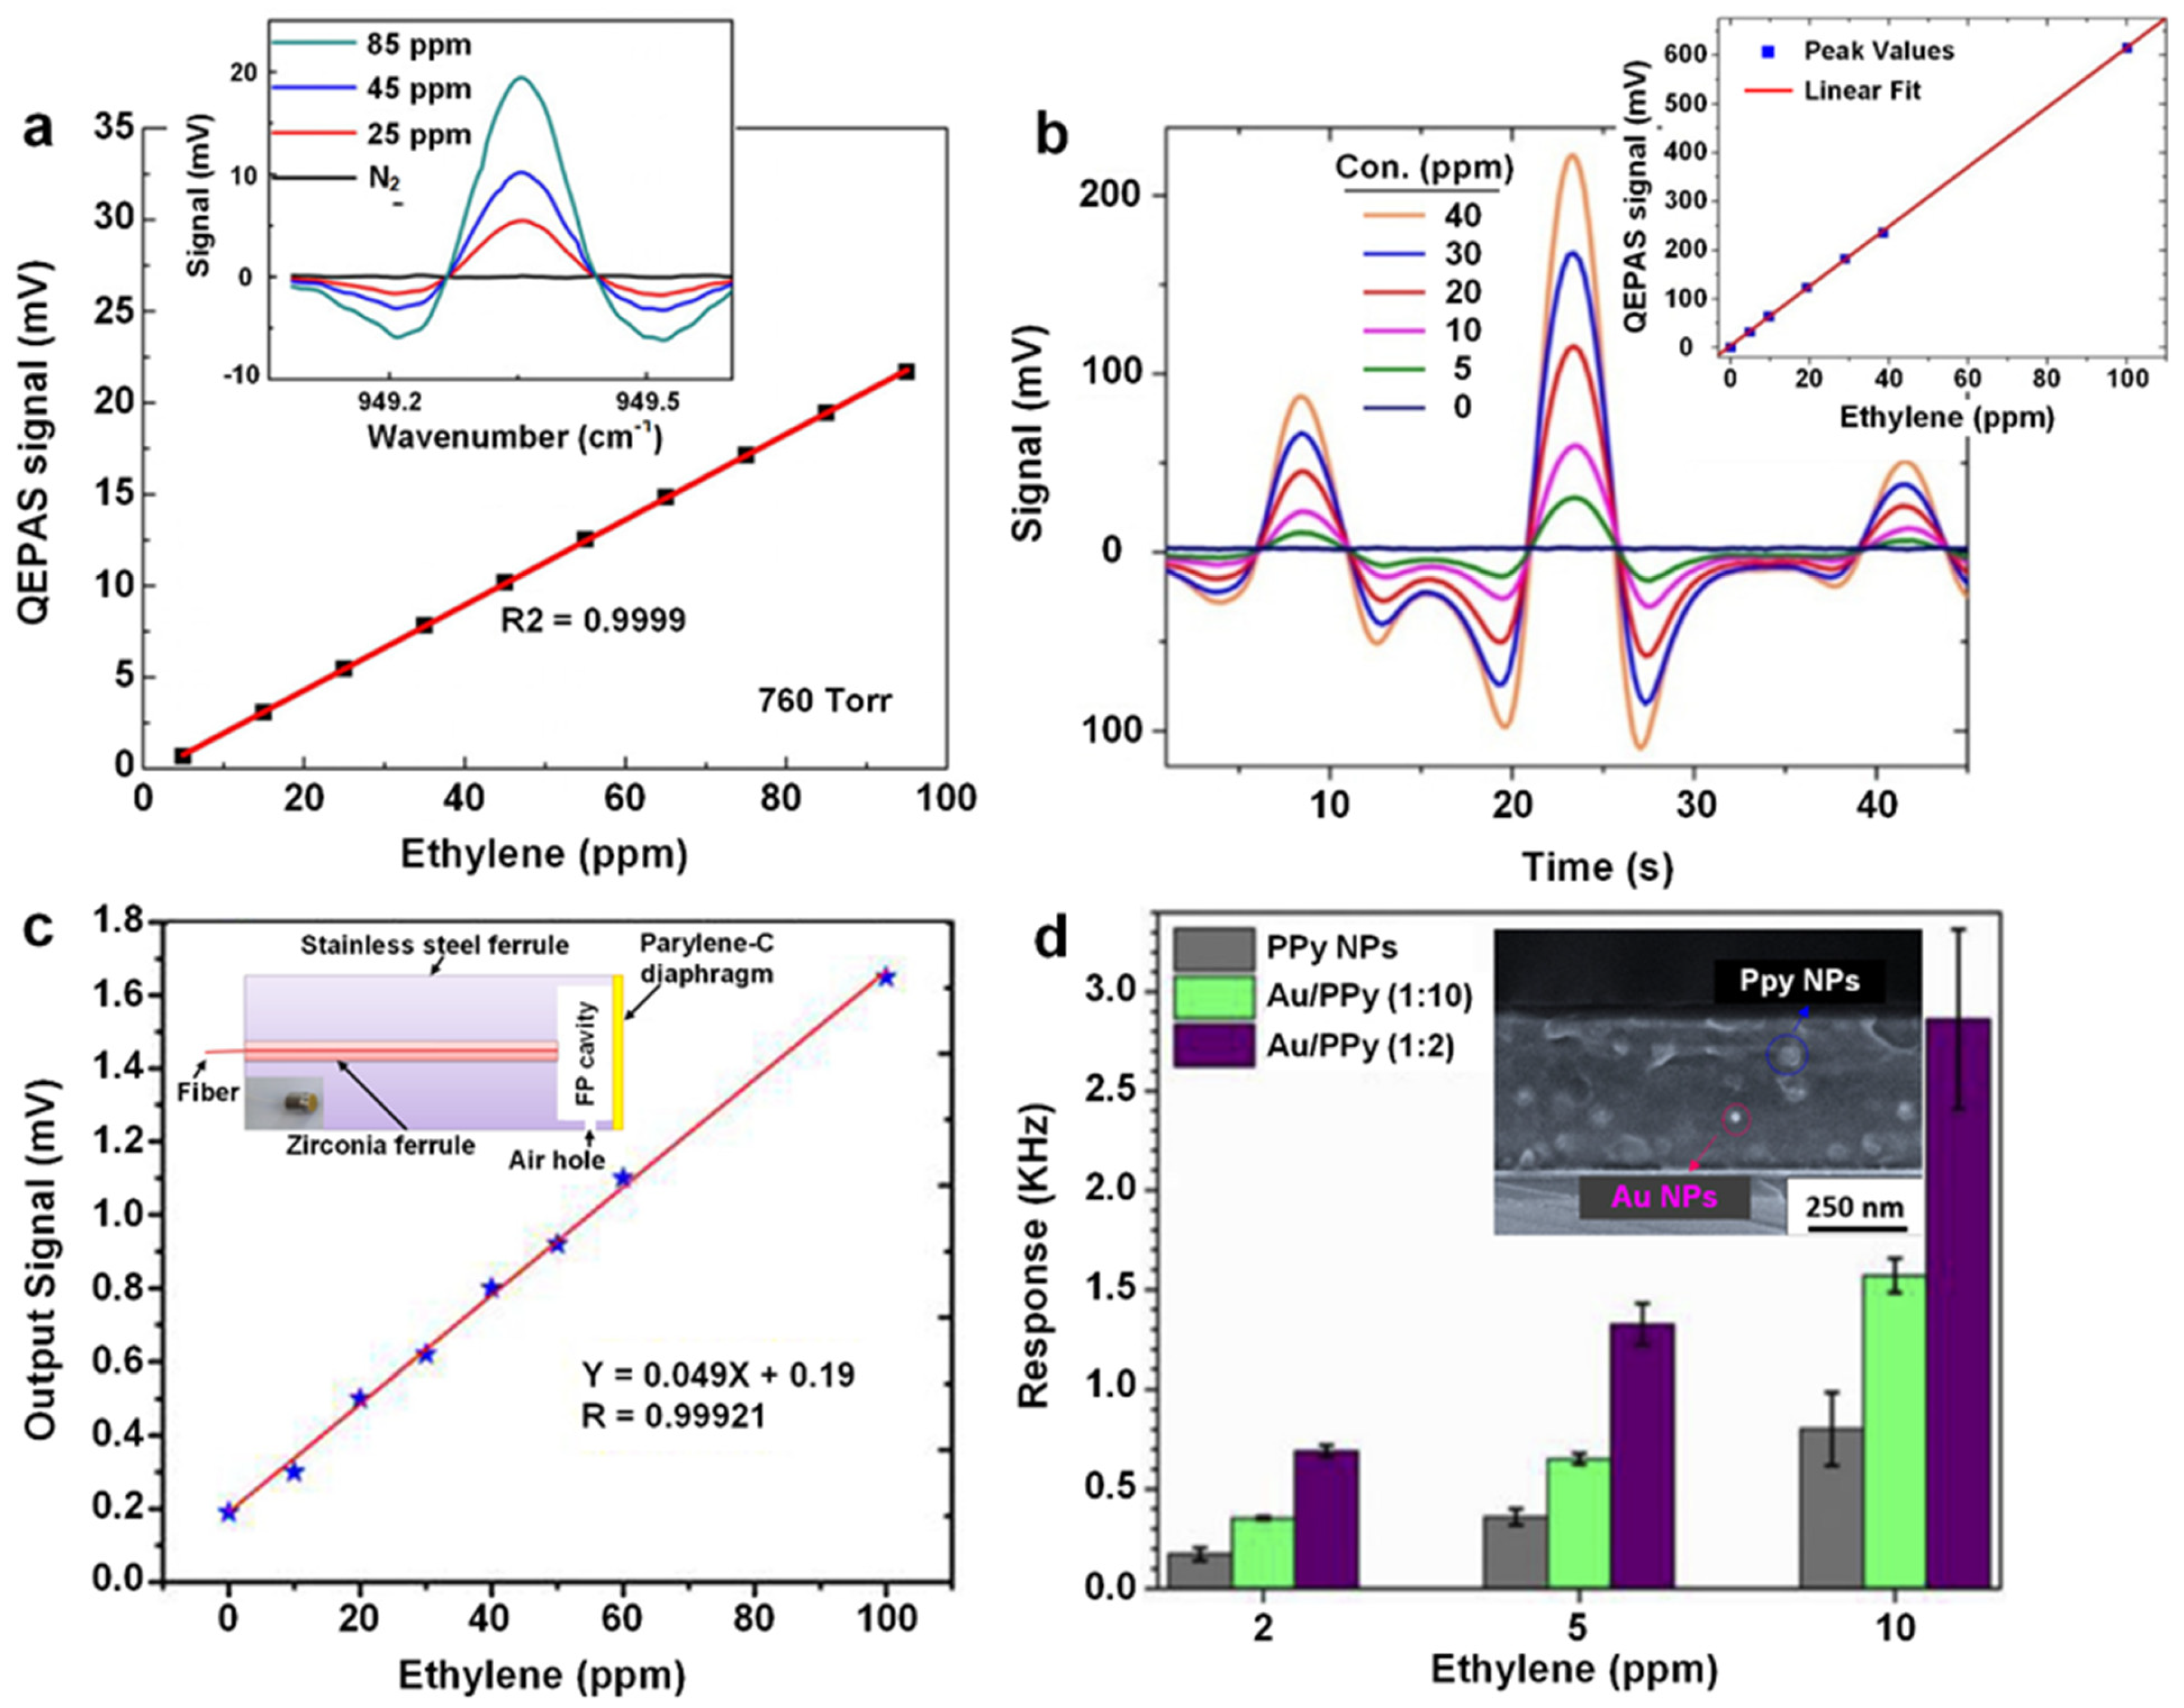
| Acoustic | Quartz-enhanced photoacoustic spectroscopy | 0 | - | - | 85 | ~21 mV; (2f) b | 70 Ψ | ~50 | Apples | [32] | |
| Quartz-enhanced photoacoustic spectroscopy | 15 | - | - | 100 | ~250 mV; (2f) b | 30 Ψ | 7 | - | [33] | ||
| Quartz-enhanced photoacoustic spectroscopy | RT | CO2 | - | 35 | ~40 mV; (2f) b | 90 Ψ | 8 | - | [34] | ||
| CO2 laser photoacoustic spectroscopy system | RT | - | 0 | - | - | - | 3 | - | [35] | ||
| Fiber-optic low-frequency acoustic sensor | RT | C2H2, CH4, C2H6, CO and CO2 | - | 30 | 1.65 mV; (2f) b | - | 160 | - | [36] | ||
| All-optical photoacoustic system | RT | CH4 | - | 20 | 0.4 nm #; (RMS) c | - | 200 | - | [37] | ||
| Au-PPy d | Spin-coating | RT | - | 0–50 | 5 | ~1.4 KHz; (Δf) e | 81/142 | 87 | - | [38] | |
| AgBF4/PVP | Drop-casting | RT | C6H14, hexane, ethyl acetate ethanol and diethyl ether | - | 7 | 51 Hz·ppm−1; (Δf/Con.) e | - | 420 | Pear, orange and banana | [39] | |
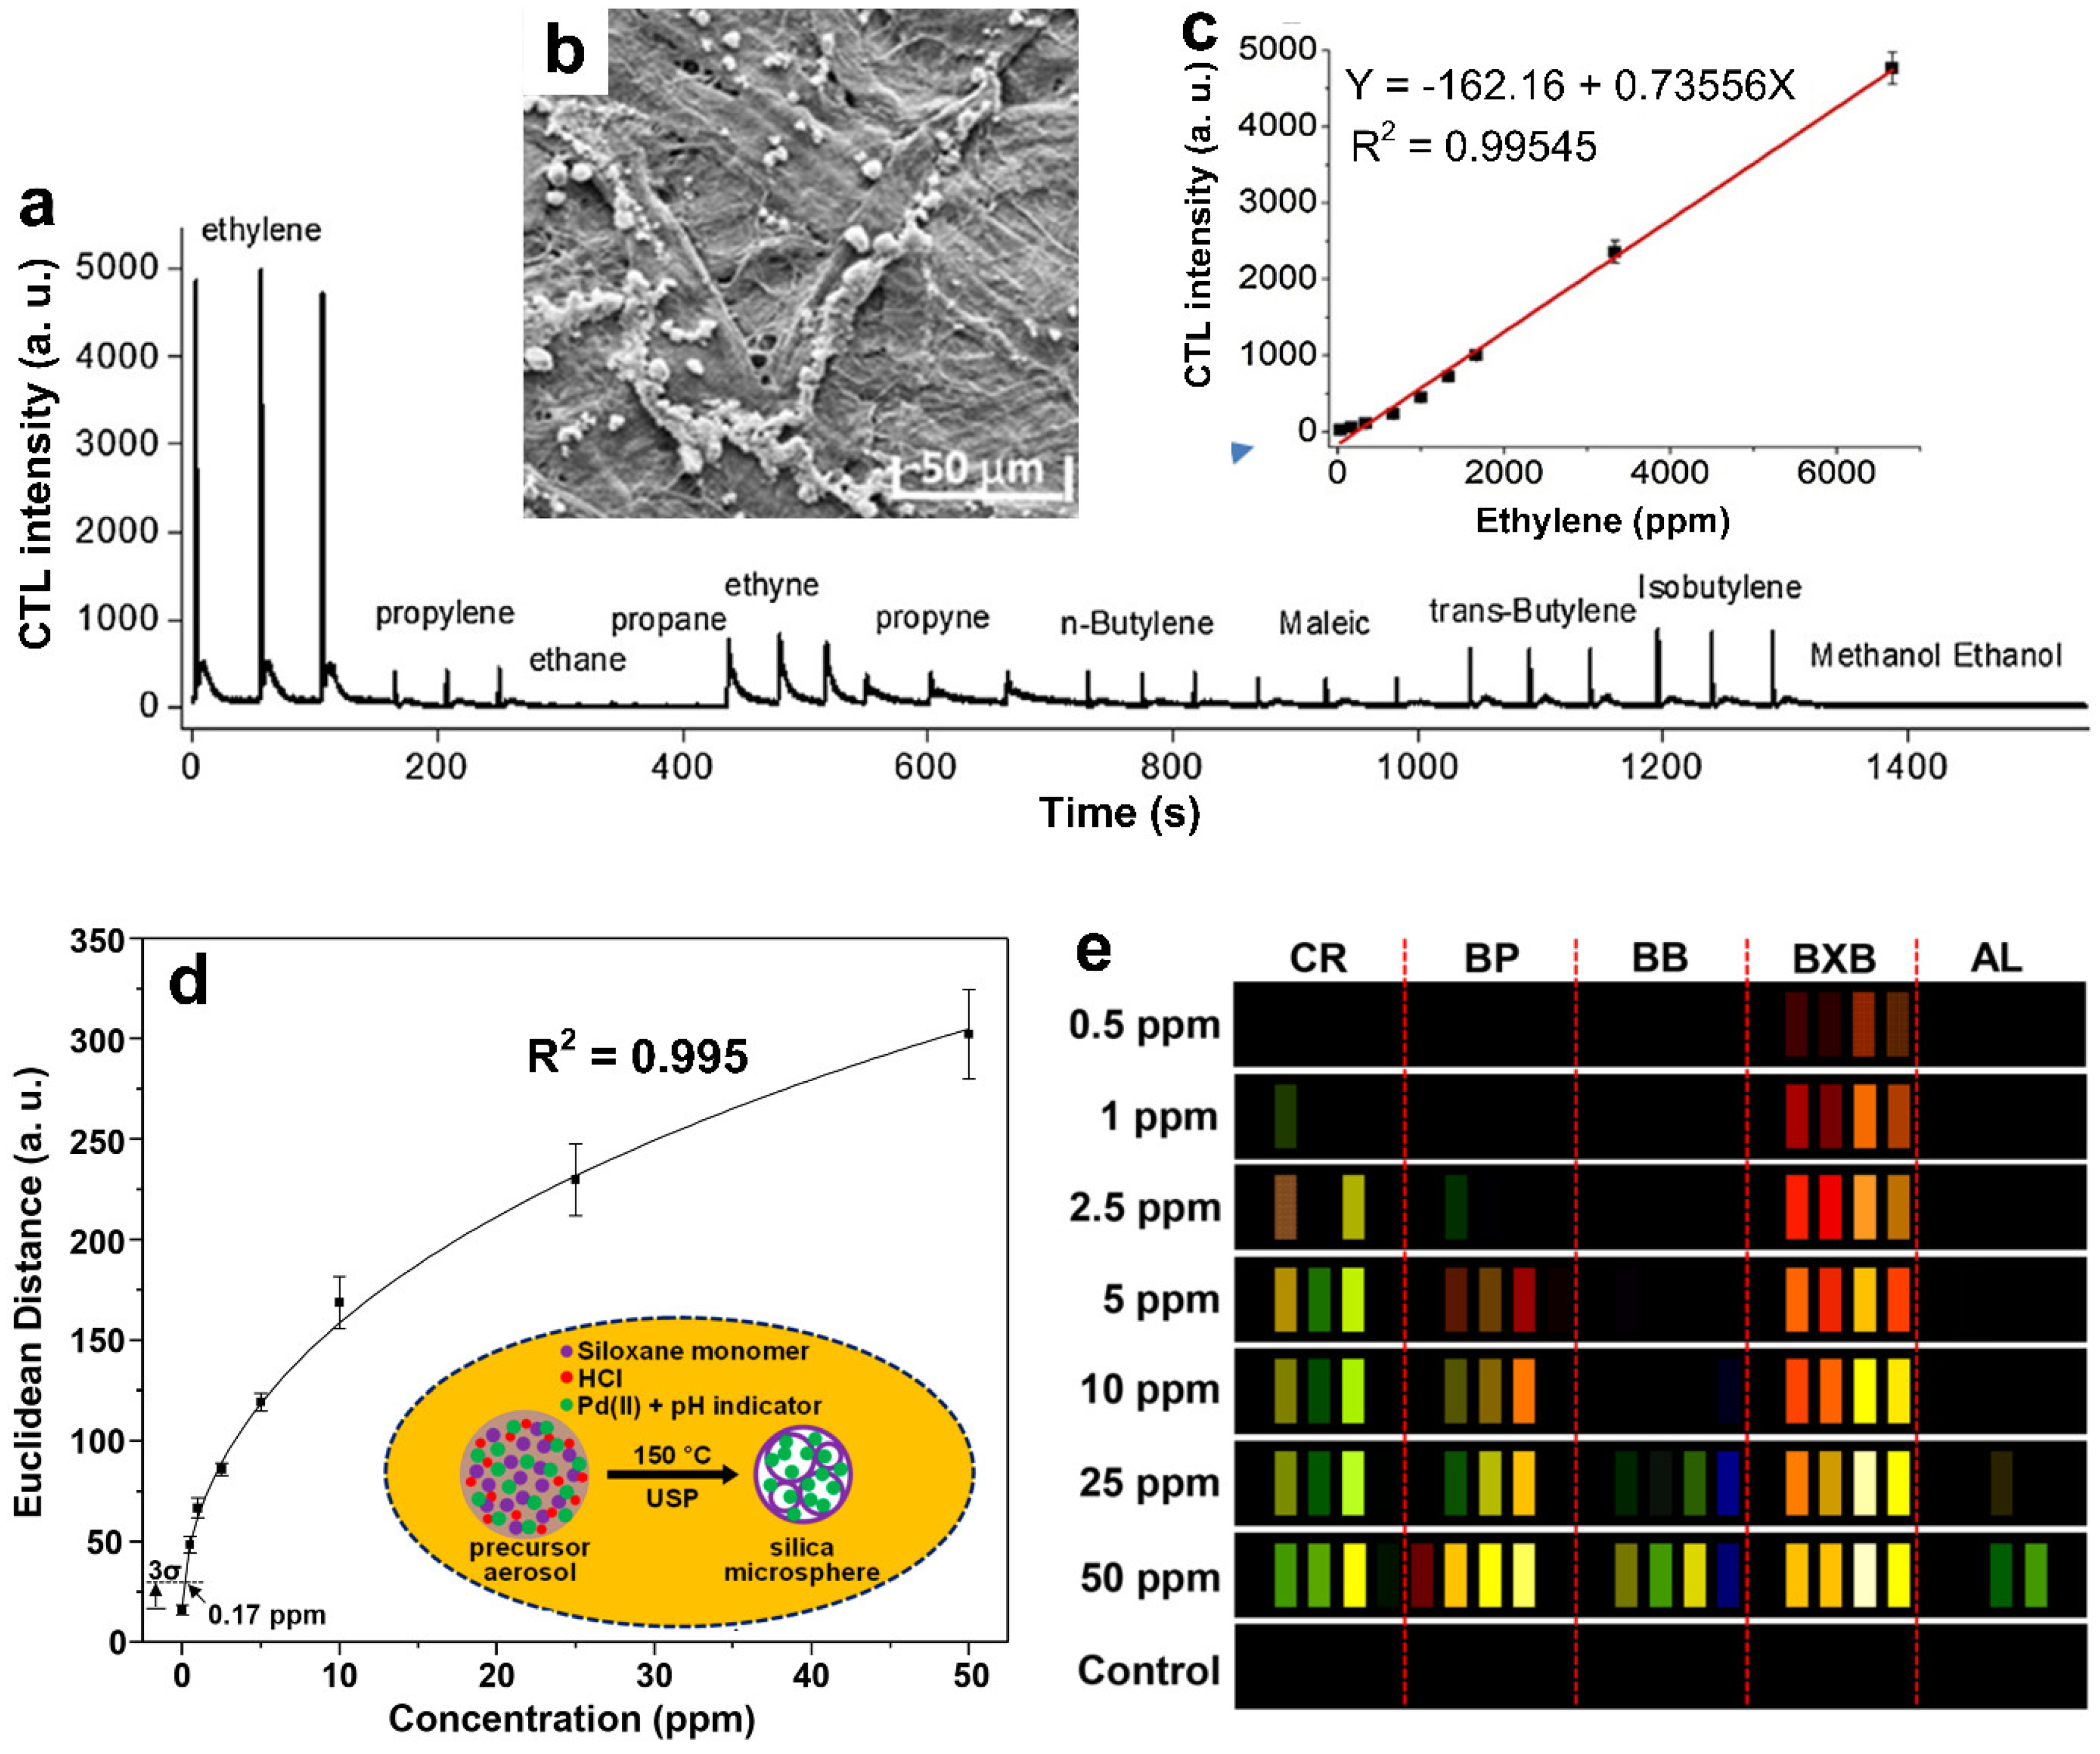
| Optical | Mn:SiO2 | Surface adsorption | RT | Various alkenes and alcohols | 0–0.5 | 0.67 vol% | ~4700; (ICTL) f | - | 10,000 | - | [40] |
| Pd(II)-SiO2 | Ultrasonic spray pyrolysis (USP) | RT | NOx, SO2, H2S and C2H2 | 0–90 | 50 | 300 #; (RGB) g | 1200/- | 170 | Bananas | [41] | |
| PCDA/PCDA-SH Liposomes h | Wet chemistry and probe sonication | RT | Air, N2 and CO2 | NG-NA Δ | 1000 | 1.38; ((R/B)/(R0/B0)) i | - | ~600,000 | Kiwis | [42] | |
| Potentiometric | Fe0.7Cr1.3O3|8YSZ|Pt j | Sol–gel, ball milling, and screen-printing | 550 | CO | 0, 3 | 200 | 23.49 mV; (Vcell) | - | - | [43] | |
| Ni-Fe0.7Cr1.3O3|8YSZ|LSM k | Sol–gel, Ball milling, screen-printing, and drop-casting | 550 | CO | 3 | 200 | 65 mV #; (Vcell) | - | - | - | [44] | |
| rGO-LSC|YSZ|Pt l | Screen-printing | 500 | NH3, NO2 and CO | 10–30 | 0.025 | ~30 mV; (Vcell) | 80/- | 10 | - | [45] | |
| Amperometric (FET) | P3HT-Pd m | Spin-coating | RT | Ethyl acetate, methanol and acetone | - | 25 | 30.2%; (ΔId/I0) n | - | - | - | [46] |
| SiC/Ir | Magnetron sputtering | 200 | - | - | 2.5 | 1.6 #; (ΔId) n | - | 500 | Apples | [47] | |
| MWCNTs | Ink-jet printing and brush coating | RT | - | - | 50 | 18.4%; (ΔR/R0) | 10/60 | - | - | [48] | |
| Amperometric (CNT) | SWCNTs/Cu(I) complex o | Drop-casting | RT | Alkenes, ethanol and acetaldehyde | - | 50 | 1.8% #; (ΔG/G0) | - | - | Banana, avocado, apple, pear and orange | [13] |
| SWCNTs/Catalytic mixture | Iodonium salt reaction and drop-casting | RT | Variety of VOCs p | 40–80 | 50 | ~59% #; (ΔG/G0) | 60 φ/300 φ | 15 | Lisianthus flowers and carnations | [16] | |
| B:MWCNTs | CVD and air brushing | RT | - | - | 7 | 0.05%; (ΔR/R0) | - | - | - | [49] | |
| Pd|SWCNTs|HA·HCl q | Impregnation, spin-coating, and drop-casting | 40 | Variety of VOCs | 50 | 100 | ~90% #; (ΔG/G0) | 300 φ/700 φ | 200 | - | [50] | |
| Amperometric (metal oxide) | ZnO | Electrodeposition and chemical bath deposition | 200 | - | - | 50 | 2.4%; (ΔR/R0) | - | - | - | [51] |
| ZnO-Ag | Doping and electrodeposition | RT | - | - | 50 | 19.6%; (ΔR/R0) | 240/480 | - | - | [52] | |
| ZrO2/PTh r | In situ chemical oxidative polymerization | RT | n-hexane, dimethylbutanes, and methyl pentanes | ~45 | - | 9 #; (ΔI/I0) | ~80/~60 | - | - | [53] | |
| LaFeO3 | Sol–gel | 150 | C2H2, CH4, C2H6, CO, CO2 and H2 | 0–50 | 3000 | 65; (Rg/R0) | - | - | - | [54] | |
| Pd:SnO2 | Hydrothermal | 375 | - | - | 100 | 957.96; (R0/Rg) | <10/<60 | - | - | [55] | |
| Pd-SnO2 | Coating | 250 | - | 51.9 | 100 | 11.1; (R0/Rg) | 1/103 | 50 | Banana, lemon, apple and pear | [28] | |
| Pd-Fe2O3/rGO | Calcination, redox reaction, and mechanical shaking | 250 | Different VOCs | - | 10 | 10; (R0/Rg) | 18 s/50 s | 10 | - | [56] | |
| Amperometric (dual metal oxides) | CeOx-SnO2 | Co-precipitation | 350 | H2, C2H2, CH4, H2S, NO2, ethanol and acetone | 0 | 10 | 5.18; (R0/Rg) | 12/- | 300 | - | [57] |
| Cr2O3/SnO2 | USP, screen-printing, and beam evaporation | 350 | Trimethylamine, dimethylamine, NH3, ethanol, formaldehyde and CO | 21, 35 | 2.5 | 16.8; (ΔR/Rg) | 6/69 | 24 | Banana, apple, mango, peach, kiwi and blueberry | [58] | |
| TiO2–WO3 | Sol–gel | 250 | - | - | 200 | 46.2%; (ΔR/R0) | - | 8000 | Banana, papaya and mango | [59] | |
Publisher’s Note: MDPI stays neutral with regard to jurisdictional claims in published maps and institutional affiliations. |
© 2022 by the authors. Licensee MDPI, Basel, Switzerland. This article is an open access article distributed under the terms and conditions of the Creative Commons Attribution (CC BY) license (https://creativecommons.org/licenses/by/4.0/).
Share and Cite
Chen, X.; Wreyford, R.; Nasiri, N. Recent Advances in Ethylene Gas Detection. Materials 2022, 15, 5813. https://doi.org/10.3390/ma15175813
Chen X, Wreyford R, Nasiri N. Recent Advances in Ethylene Gas Detection. Materials. 2022; 15(17):5813. https://doi.org/10.3390/ma15175813
Chicago/Turabian StyleChen, Xiaohu, Ryan Wreyford, and Noushin Nasiri. 2022. "Recent Advances in Ethylene Gas Detection" Materials 15, no. 17: 5813. https://doi.org/10.3390/ma15175813