
The Effect of Fe Addition in the RM(Nb)IC Alloy Nb–30Ti–10Si–2Al–5Cr–3Fe–5Sn–2Hf (at.%) on Its Microstructure, Complex Concentrated and High Entropy Phases, Pest Oxidation, Strength and Contamination with Oxygen, and a Comparison with Other RM(Nb)ICs, Refractory Complex Concentrated Alloys (RCCAs) and Refractory High Entropy Alloys (RHEAs)


Abstract
:1. Introduction
2. Experimental
3. Results
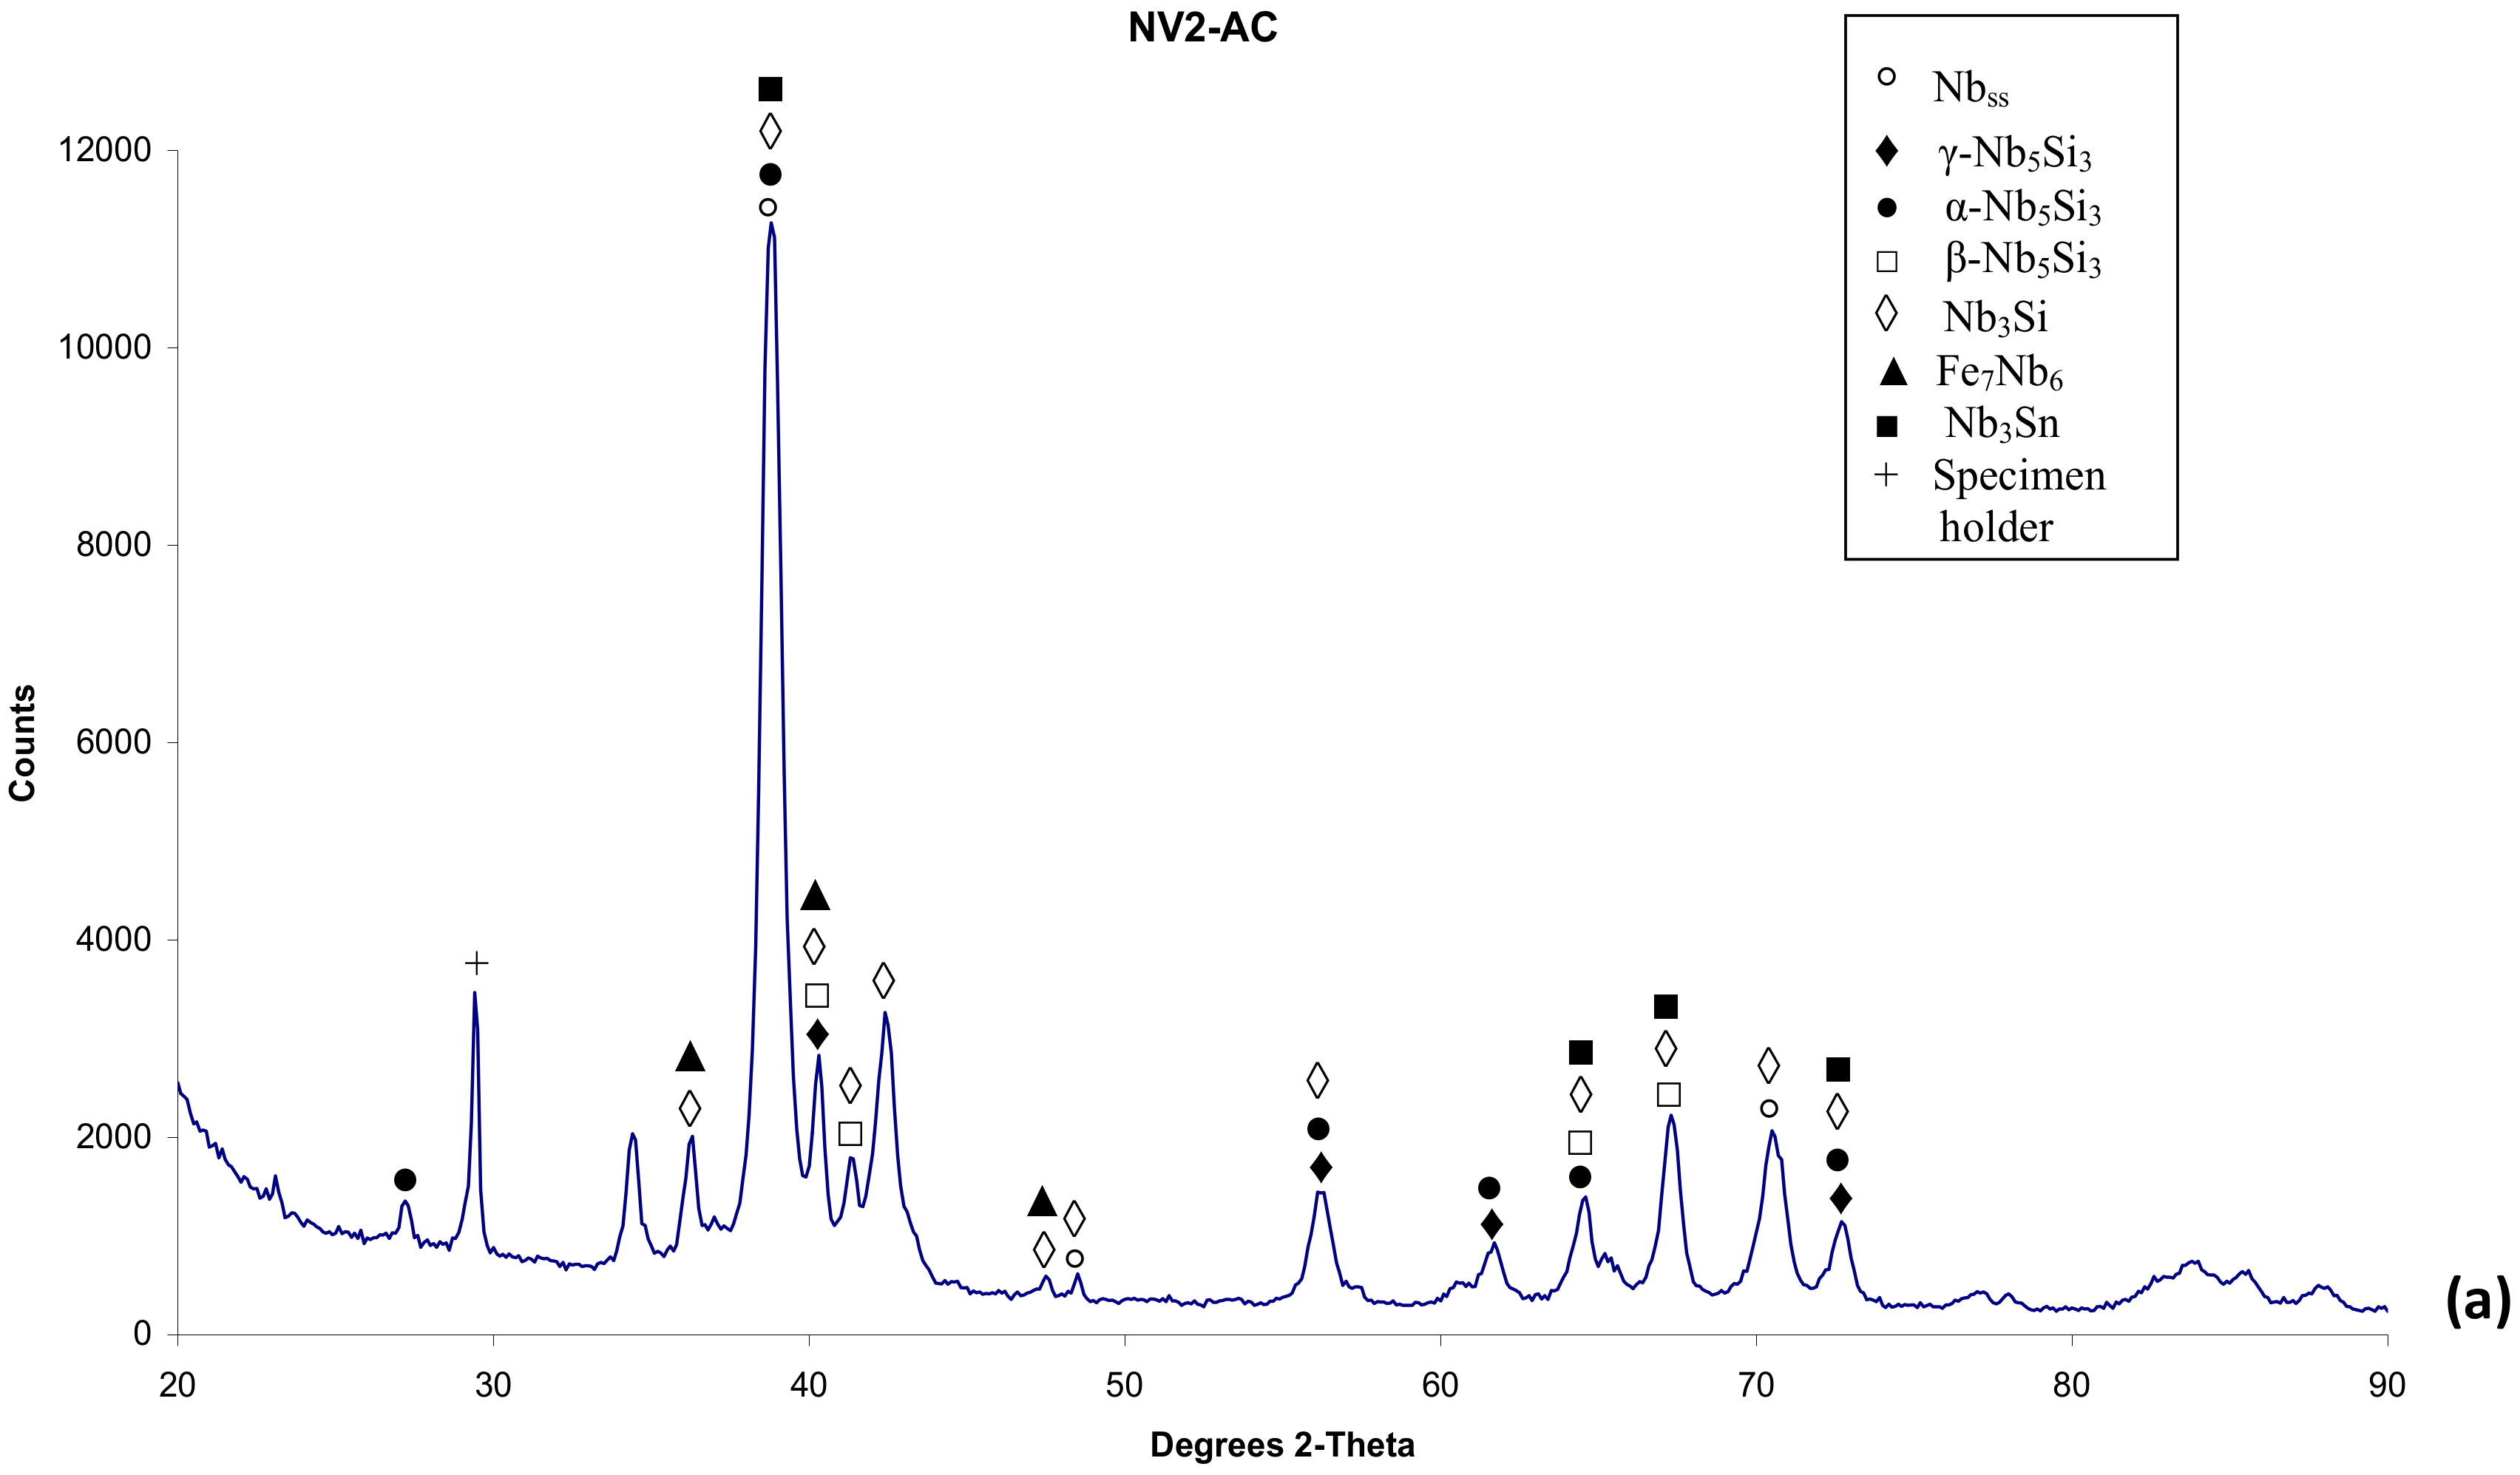
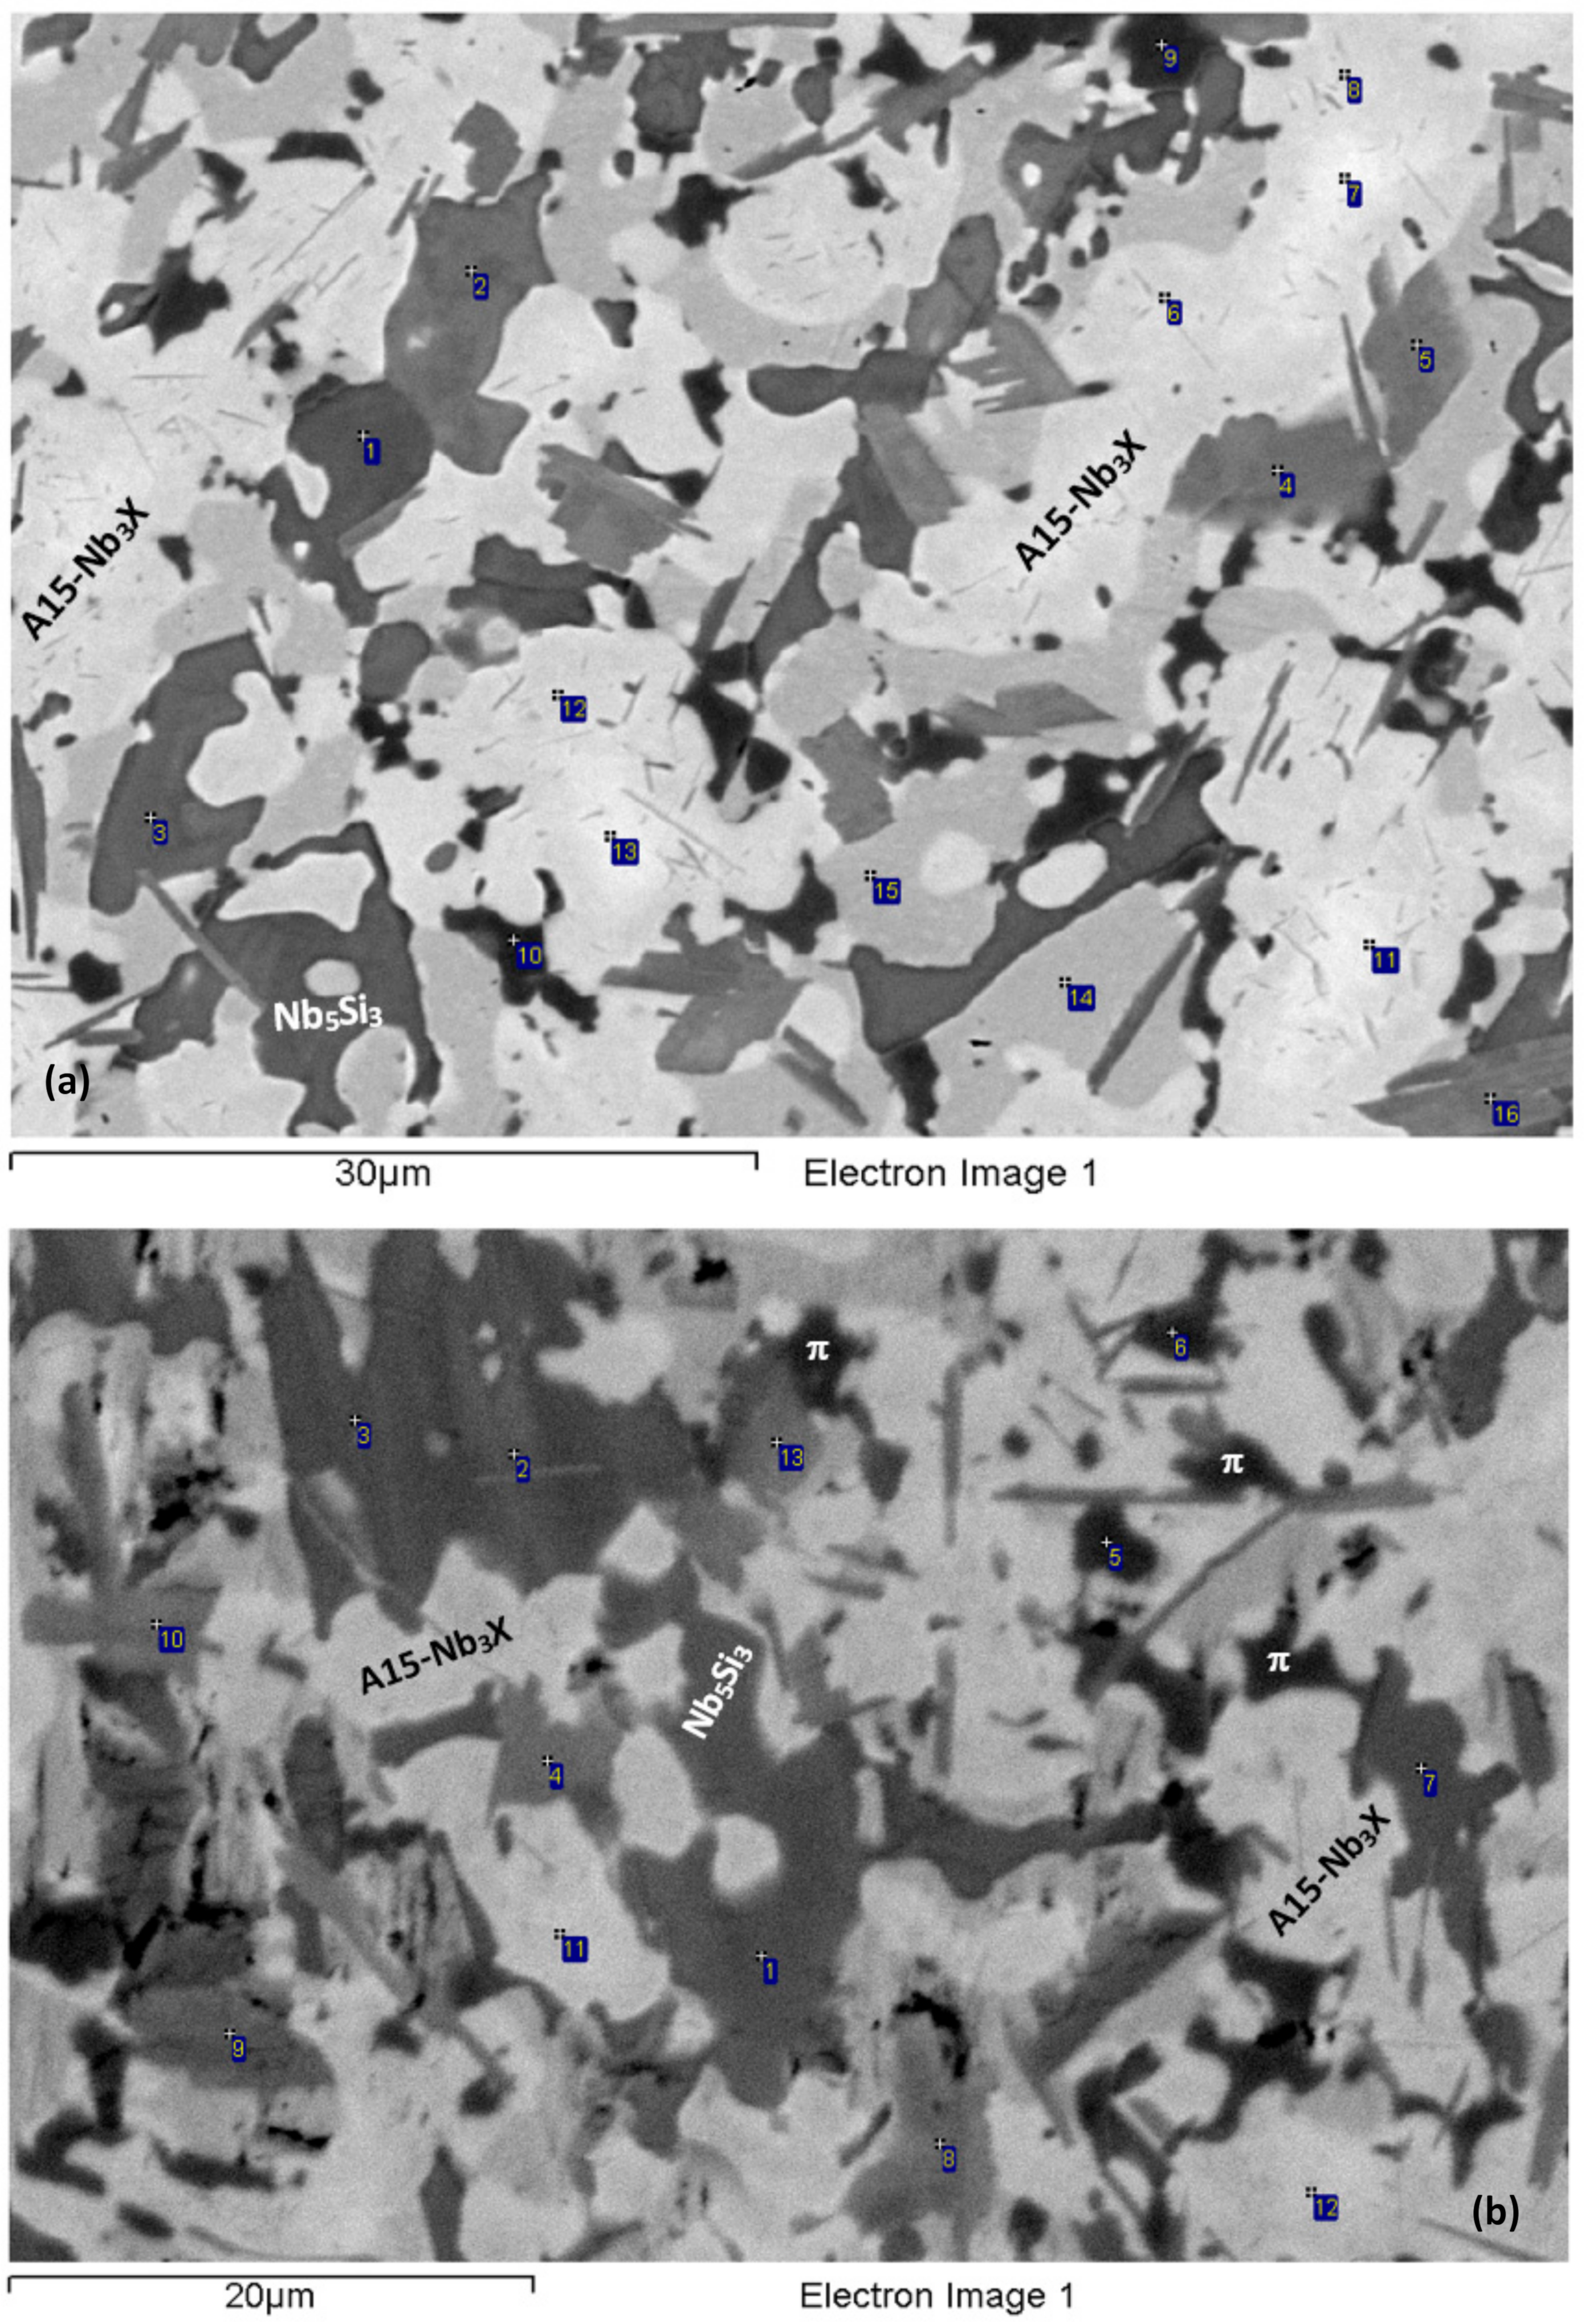
3.1. As-cast (NV2–AC)
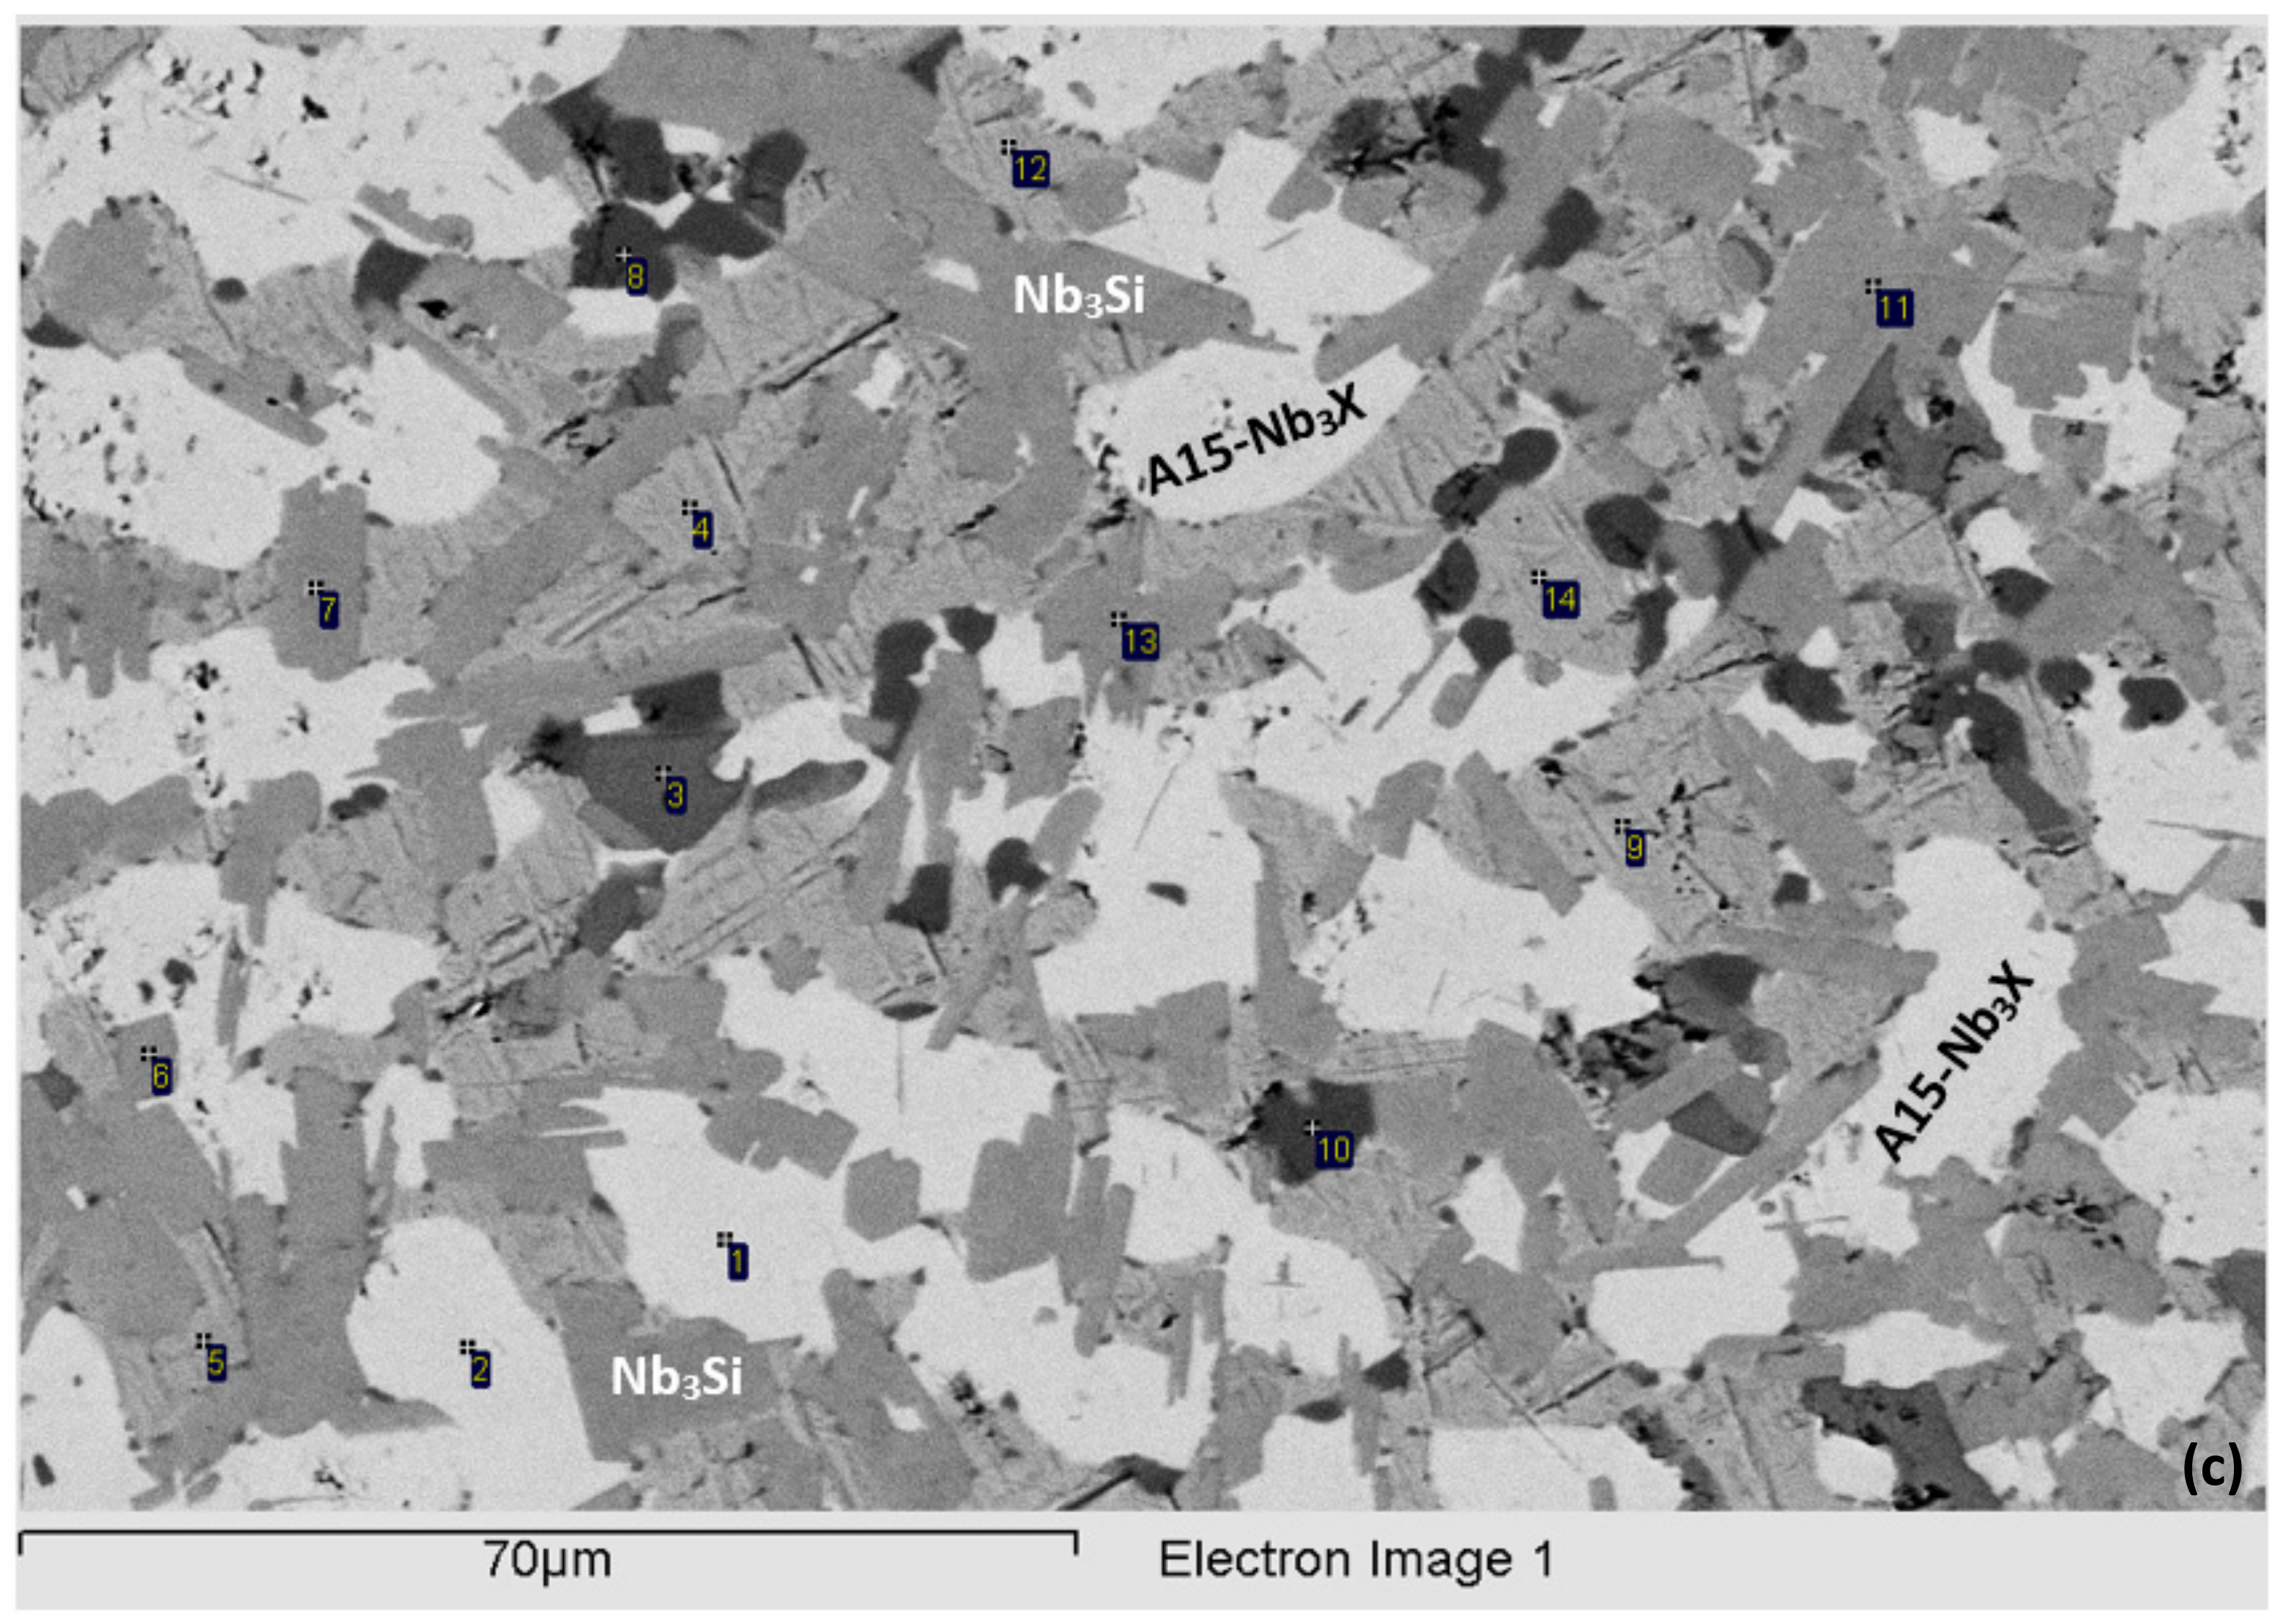
3.2. Heat-Treated (NV2–HT)
3.3. Hardness
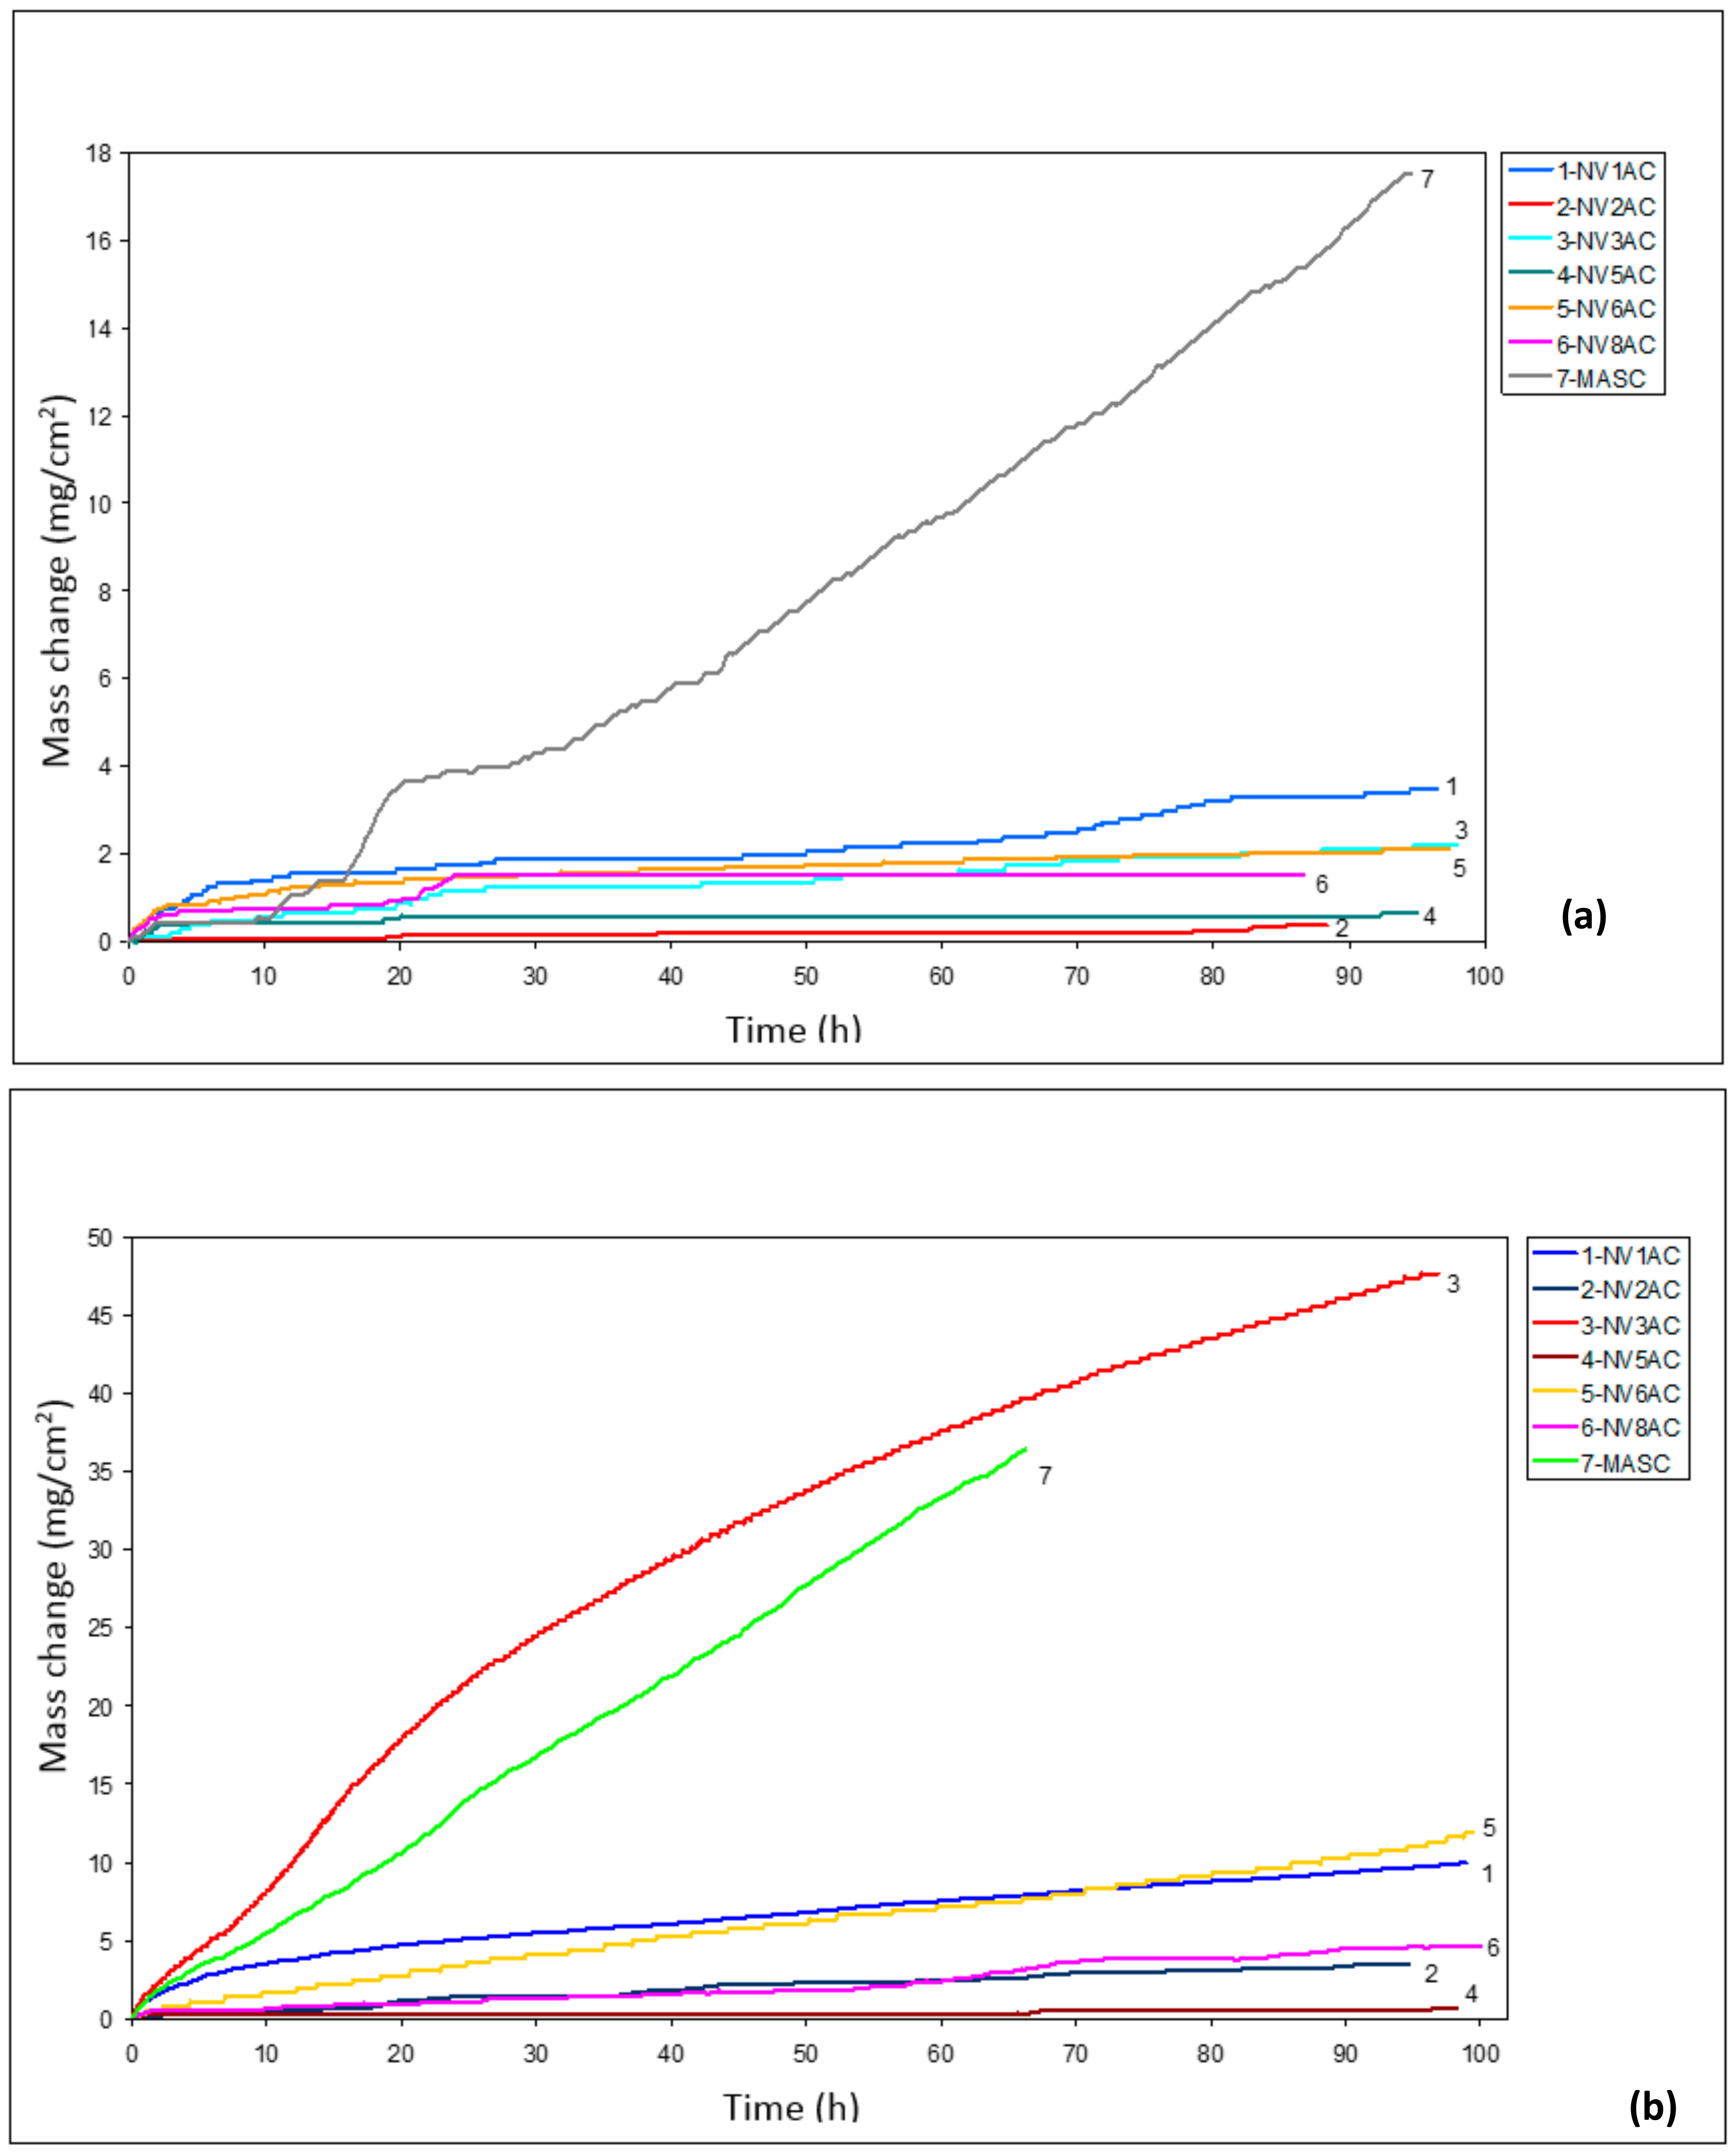
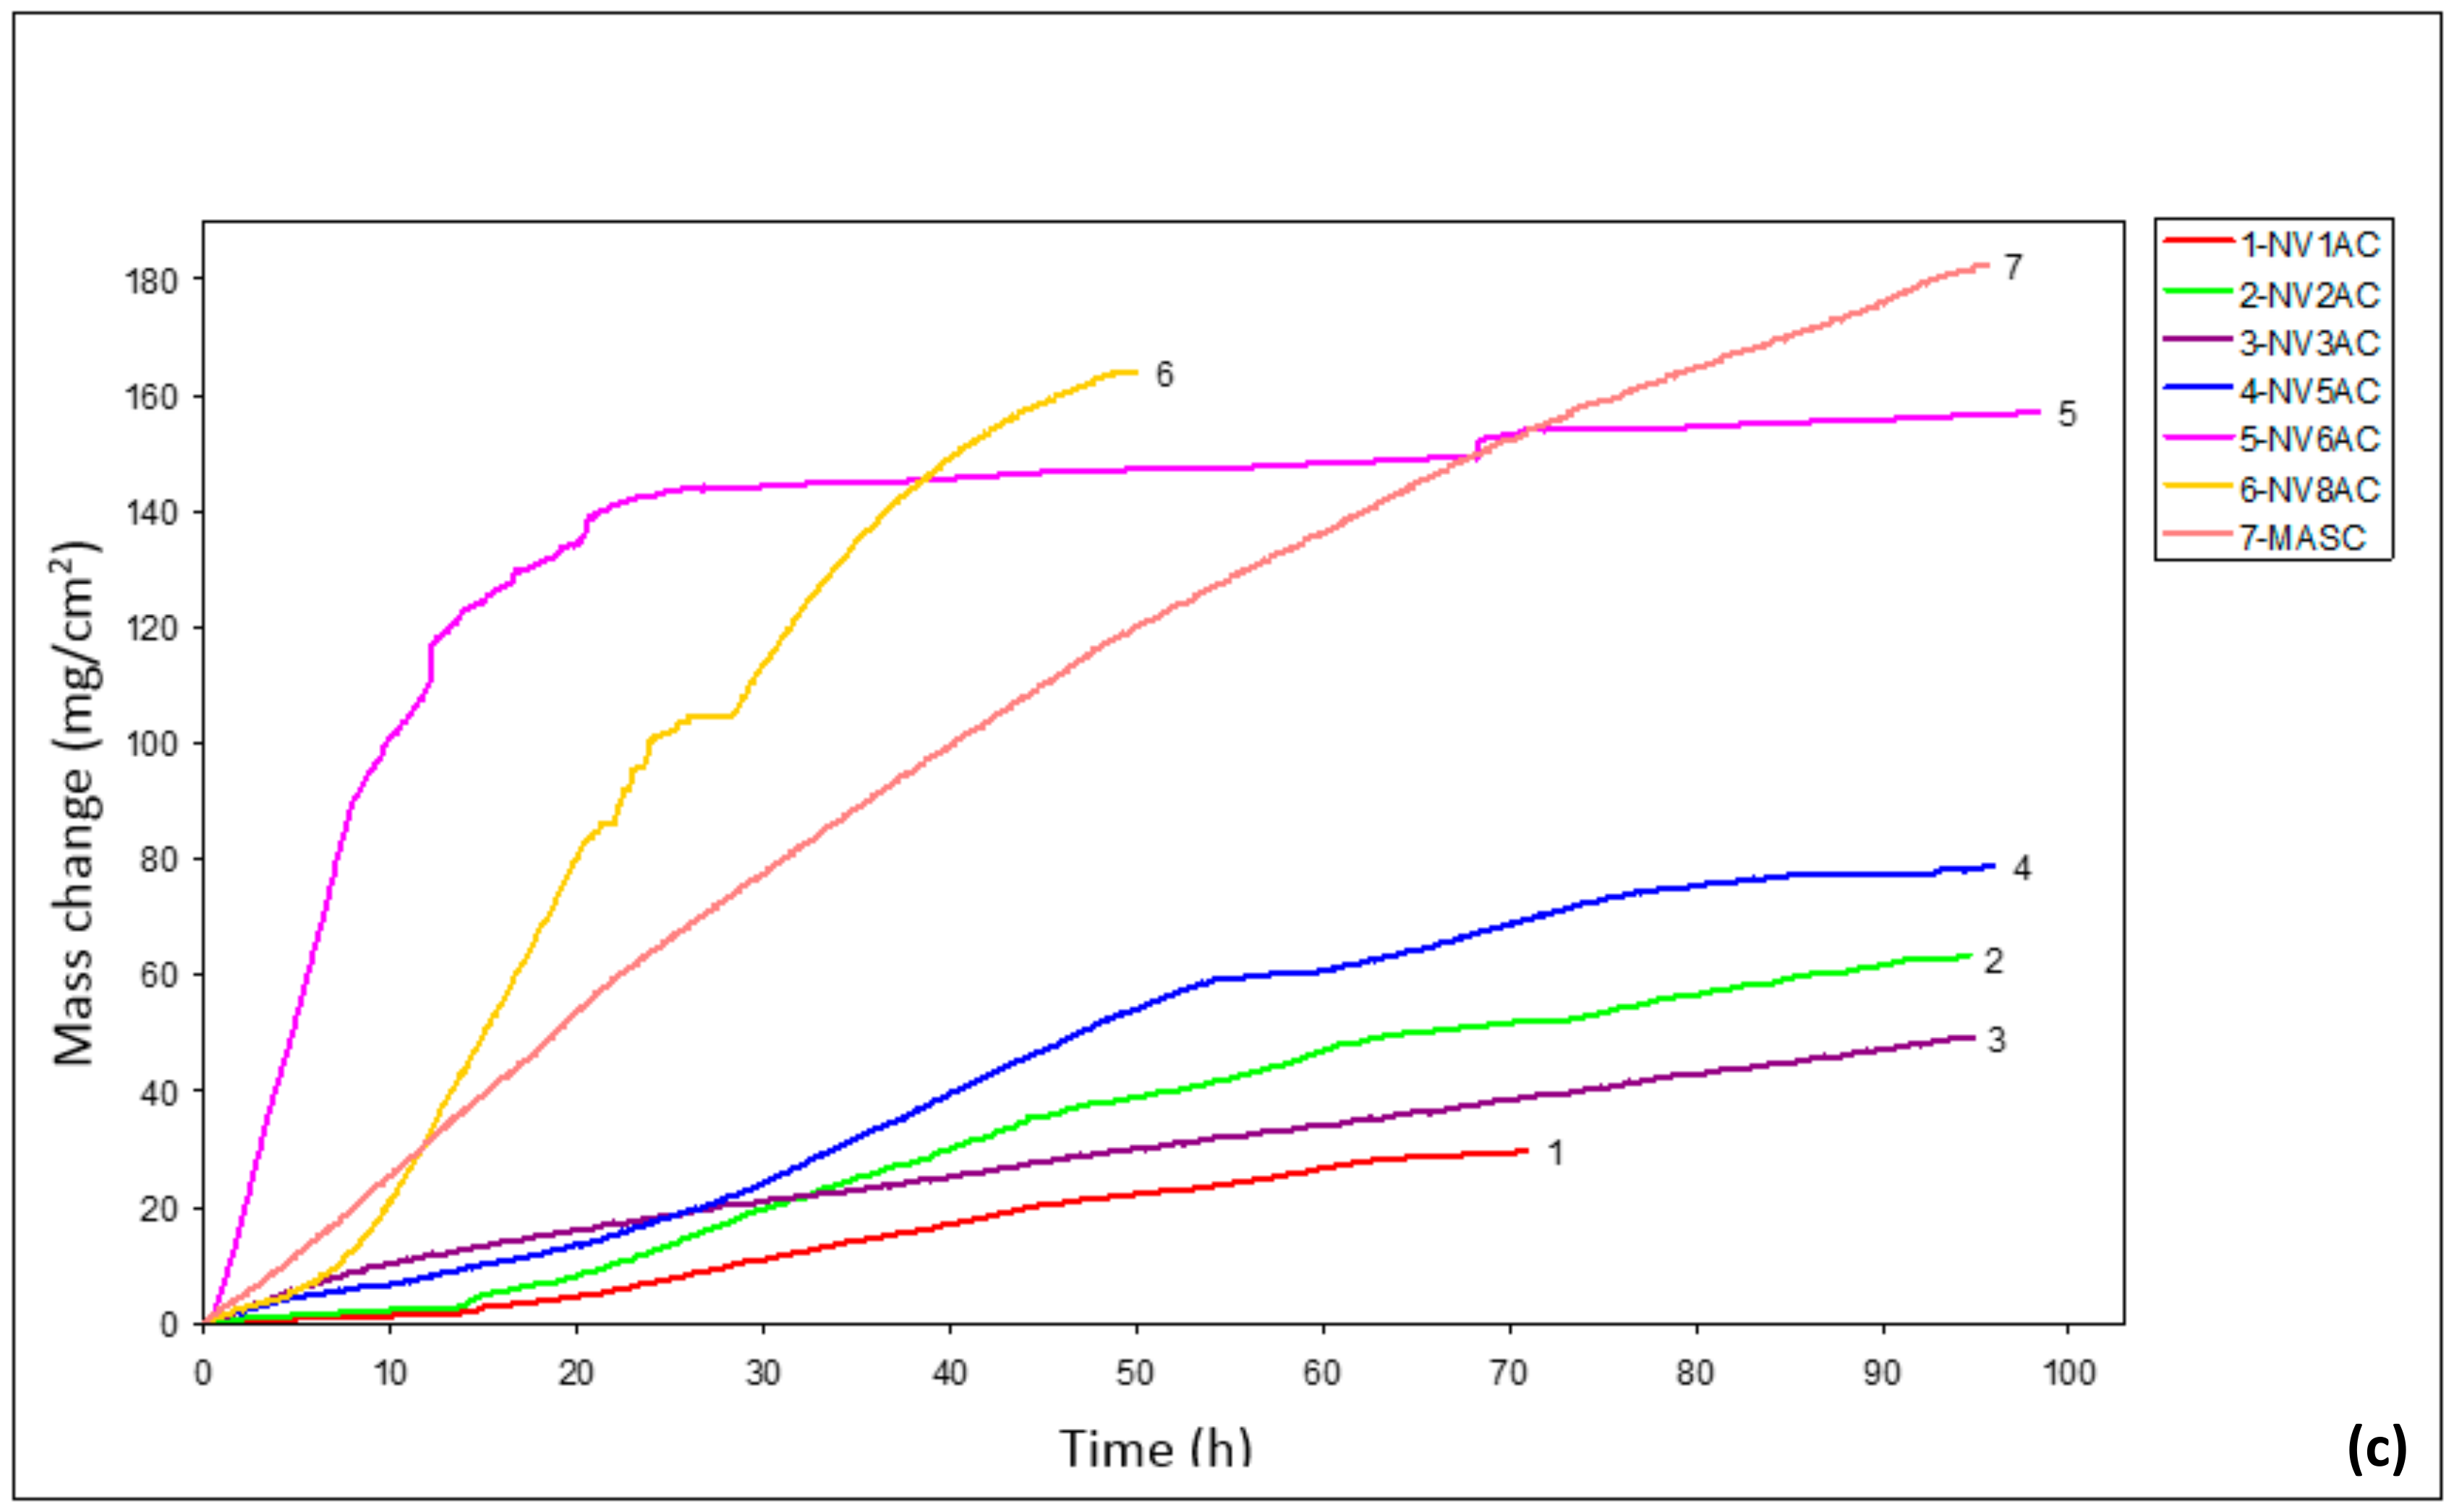
3.4. Oxidation
4. Discussion
4.1. Microstructure
4.1.1. Macrosegregation
4.1.2. Nb Solid Solution
Nb Solid Solution with No Si
4.1.3. Nb5Si3 Silicide
4.1.4. A15–Nb3X Compound
4.1.5. 3-1 Silicides
4.1.6. Eutectic
4.1.7. Cr Rich Intermetallic Phase
4.2. Hardness and Specific Strength
4.3. Oxidation
4.4. CC and HE Phases
4.5. Comparison of Experimental Data with NICE
5. Conclusions
Author Contributions
Funding
Institutional Review Board Statement
Informed Consent Statement
Data Availability Statement
Acknowledgments
Conflicts of Interest
References
- Dimiduk, D.M.; Mendiratta, M.G.; Subramanian, P.R. Structural Intermetallics; Darolia, R., Lewandowski, J.J., Liu, C.T., Martin, P.L., Miracle, D.B., Nathal, M.V., Eds.; TMS Publications: Warrendale, PA, USA, 1993; pp. 619–630. [Google Scholar]
- Bewlay, B.P.; Lipsitt, H.A.; Jackson, M.R.; Reeder, W.J.; Sutliff, J.A. Solidification processing of high temperature intermetallic eutectic-based alloys. Mater. Sci. Eng. A 1995, 192–193, 534–543. [Google Scholar] [CrossRef]
- Bewlay, B.P.; Jackson, M.R.; Gigliotti, M.F.X. Niobium silicide high temperature in situ composites. In Intermetallic Compounds—Principles and Practice; Wiley: New York, NY, USA, 2002; Volume 3, pp. 541–560. [Google Scholar]
- Senkov, O.N.; Miracle, D.B.; Chaput, K.J. Development and exploration of refractory high entropy alloys—A review. J. Mater. Res. 2018, 33, 3092–3128. [Google Scholar] [CrossRef]
- Tsakiropoulos, P. Alloys for application at ultra-high temperatures: Nb-silicide in situ composites. Challenges, breakthroughs and opportunities. Prog. Mater. Sci. 2022, 123, 100714. [Google Scholar] [CrossRef]
- Tsakiropoulos, P. Refractory Metal (Nb) Intermetallic Composites, High Entropy Alloys, Complex Concentrated Alloys and the Alloy Design Methodology NICE: Mise-en-scène Patterns of Thought and Progress. Materials 2021, 14, 989. [Google Scholar] [CrossRef] [PubMed]
- Tsakiropoulos, P. Refractory Metal Intermetallic Composites, High-Entropy Alloys, and Complex Concentrated Alloys: A Route to Selecting Substrate Alloys and Bond Coat Alloys for Environmental Coatings. Materials 2022, 15, 2832. [Google Scholar] [CrossRef] [PubMed]
- Bewlay, B.P.; Jackson, M.R.; Zhao, J.; Subramanian, P.R.; Mendiratta, M.G.; Lewandowski, J.J. Ultrahigh temperature Nb-silicide based composites. MRS Bull. 2003, 28, 646–653. [Google Scholar] [CrossRef]
- Tsakiropoulos, P. On Nb silicide based alloys: Alloy design and selection. Materials 2018, 11, 844. [Google Scholar] [CrossRef]
- Bewlay, B.P.; Whiting, P.; Briant, C.L. High temperature ordered intermetallic alloys VIII. In Proceedings of the Materials Research Society Symposium, Boston, MA, USA, 30 November–3 December 1998; Volume 552, pp. KK6.11.1–KK6.11.5. [Google Scholar]
- Schlesinger, M.E.; Okamoto, H.; Gokhale, A.B.; Abbaschian, R. The Nb-Si (Niobium-Silicon) System. J. Phase Equilibria 1993, 14, 502–509. [Google Scholar] [CrossRef]
- Tsakiropoulos, P. On the Nb silicide based alloys: Part I-The bcc Nb solid solution. J. Alloys Compd. 2017, 708, 961–971. [Google Scholar] [CrossRef]
- Bewlay, B.P.; Briant, C.L.; Jackson, M.R.; Subramanian, P.R. Recent advances in Nb-Silicide in-situ composites, RM54. In Proceedings of the 15th International Plansee Seminar, Reutte, Austria, 28 May–1 June 2001; Kneringer, G., Rodhammer, P., Wildner, H., Eds.; Plansee Holding AG: Reutte, Austria, 2001; Volume 1, pp. 404–419. [Google Scholar]
- Shah, D.M.; Anton, D.L. Ternary alloying of refractory intermetallics. Mat. Res. Soc. Symp. Proc. 1991, 213, 63–68. [Google Scholar] [CrossRef]
- Zelenitsas, K.; Tsakiropoulos, P. Study of the role of Cr and Al additions in the microstructure of Nb-Ti-Si in situ composites. Intermetallics 2005, 13, 1079–1095. [Google Scholar] [CrossRef]
- Vellios, N.; Tsakiropoulos, P. The role of Sn and Ti additions in the microstructure of Nb-18Si based alloys. Intermetallics 2007, 15, 1518–1528. [Google Scholar] [CrossRef]
- Yu, J.L.; Zhang, K.F. Tensile properties of multiphase refractory Nb–16Si–2Fe in situ composite. Scr. Mater. 2008, 59, 714–717. [Google Scholar] [CrossRef]
- Yu, J.L.; Zhang, K.F.; Li, Z.K.; Zheng, X.; Wang, G.F.; Bai, R. Fracture toughness of a hot extruded multiphase Nb-10Si-2Fe in situ composite. Scr. Mater. 2009, 61, 620–623. [Google Scholar] [CrossRef]
- Concharov, I.; Hisamova, L.; Mustafaeva, L.; Razumov, N.; Makhmutov, T.; Kim, A.; Wang, Q.; Shamshurin, A.; Popovich, A. Microstructure and phase composition of the Nb-Si based in situ composite from plasma spheroidized powder. Mater. Today Proc. 2020, 30, 545–548. [Google Scholar] [CrossRef]
- Raghavan, V.; Ghosh, G. The Fe–Nb–Si (iron–niobium–silicon) system. Mater. Sci. Eng. 1984, 37, 421b–425b. [Google Scholar]
- Wang, D.; Yang, S.; Yang, M.; Zheng, J.; Hu, H.; Liu, X.; Wang, C. Experimental investigation of phase equilibria in the Fe–Nb–Si ternary system. J. Alloys Compd. 2014, 605, 183–192. [Google Scholar] [CrossRef]
- Vellios, N.; Tsakiropoulos, P. Study of the role of Fe and Sn additions in the microstructure of Nb-24Ti-18Si-5Cr silicide based alloys. Intermetallics 2010, 18, 1729–1736. [Google Scholar] [CrossRef]
- Menon, E.S.K.; Mendiratta, M.G.; Dimiduk, D.M. High temperature oxidation mechanisms in Nb silicide bearing multicomponent alloys. In Structural Intermetallics; Hemker, K.J., Dimiduk, D.M., Clements, H., Darolia, R., Inui, H., Larsen, J.M., Sikka, V.K., Thomas, M., Whittenberger, J.D., Eds.; TMS Publications: Warrendale, PA, USA, 2001; pp. 591–600. [Google Scholar]
- Thandorn, T.; Tsakiropoulos, P. The effect of Boron on the microstructure and properties of refractory metal intermetallic composites (RM(Nb)ICs) based on Nb-24Ti-xSi (x = 16, 17 or 18 at.%) with additions of Al, Cr or Mo. Materials 2021, 14, 6101. [Google Scholar] [CrossRef]
- Thandorn, T.; Tsakiropoulos, P. On the microstructure and properties of Nb-Ti-Cr-Al-B-Si-X (X = Hf, Sn, Ta) refractory complex concentrated alloys. Materials 2021, 14, 7615. [Google Scholar] [CrossRef]
- Li, Z.; Tsakiropoulos, P. The effect of Ge addition on the oxidation of Nb-24Ti-18Si silicide based alloys. Materials 2019, 12, 3120. [Google Scholar] [CrossRef] [PubMed]
- Xu, Z.; Utton, C.; Tsakiropoulos, P. A study of the effect of 2 at.% Sn on the microstructure and isothermal oxidation at 800 and 1200 °C of Nb-24Ti-18Si based alloys with Al and/or Cr additions. Materials 2018, 11, 1826. [Google Scholar] [CrossRef] [PubMed]
- Xu, Z.; Utton, C.; Tsakiropoulos, P. A study of the effect of 5 at.% Sn on the microstructure and isothermal oxidation at 800 and 1200 °C of Nb-24Ti-18Si based alloys with Al and/or Cr additions. Materials 2020, 13, 245. [Google Scholar] [CrossRef] [PubMed]
- Knittel, S.; Mathieu, S.; Portebois, L.; Vilasi, M. Effect of tin addition on Nb-Si based in situ composites. Part II: Oxidation behaviour. Intermetallics 2014, 47, 43–52. [Google Scholar] [CrossRef]
- Zacharis, E.; Utton, C.; Tsakiropoulos, P. A study of the effects of Hf and Sn on the microstructure, hardness and oxidation of Nb-18Si silicide based alloys-RM(Nb)ICs with Ti addition and comparison with refractory complex concentrated alloys (RCCAs). Materials 2022, 15, 4596. [Google Scholar] [CrossRef] [PubMed]
- Vellios, N.; Tsakiropoulos, P. The role of Fe and Ti additions in the microstructure of Nb-18Si-5Sn silicide-based alloys. Intermetallics 2007, 15, 1529–1537. [Google Scholar] [CrossRef]
- Vellios, N.; Keating, P.; Tsakiropoulos, P. On the microstructure and properties of the Nb- 23Ti-5Si-5Al-5Hf-5V-2Cr-2Sn (at.%) silicide based alloy—RM(Nb)IC. Metals 2021, 11, 1868. [Google Scholar] [CrossRef]
- Bewlay, B.P.; Sitzman, S.D.; Brewer, L.N.; Jackson, M.R. Analyses of eutectoid phase transformations in Nb-silicide in-situ composites. Microsc. Microanal. 2004, 10, 470–480. [Google Scholar] [CrossRef]
- Tsakiropoulos, P. On the macrosegregation of silicon in niobium silicide based alloys. Intermetallics 2014, 55, 95–101. [Google Scholar] [CrossRef]
- Grammenos, I.; Tsakiropoulos, P. Study of the role of Mo and Ta additions in the microstructure of Nb-18Si-5Hf silicide based alloy. Intermetallics 2010, 18, 1524–1530. [Google Scholar] [CrossRef]
- Grammenos, I.; Tsakiropoulos, P. Study of the role of Hf, Mo and W additions in the microstructure of Nb-20Si silicide based alloys. Intermetallics 2011, 19, 1612–1621. [Google Scholar] [CrossRef]
- McCaughey, C.; Tsakiropoulos, P. Type of primary Nb5Si3 and precipitation of Nbss in αNb5Si3 in a Nb-8.3Ti-21.1Si-5.4Mo-4W-0.7Hf (at.%) near eutectic Nb-silicide based alloy. Materials 2018, 11, 967. [Google Scholar] [CrossRef] [PubMed]
- Zhao, J.; Utton, C.; Tsakiropoulos, P. On the microstructure and properties of Nb-18Si-6Mo-5Al-5Cr-2.5W-1Hf Nb-silicide based alloys with Ge, Sn and Ti additions (at.%). Materials 2020, 13, 4548. [Google Scholar] [CrossRef] [PubMed]
- Tsakiropoulos, P.; Zelenitsas, K.; Vellios, N. Study of the effect of Al, Cr and Sn additions on the microstructure and properties of Nb silicide based alloys. MRS Online Proc. Libr. 2011, 1295, 367–372. [Google Scholar] [CrossRef]
- Chan, K.S. The fracture toughness of Niobium-based in situ composites. Metall. Mater. Trans. A 1996, 27, 2518–2531. [Google Scholar] [CrossRef]
- Davidson, D.L.; Chan, K.S.; Loloee, R.; Crimp, M.A. Fatigue and fracture toughness of a Nb-Ti-Cr-Al-X single phase alloy at ambient temperature. Metall. Mater. Trans. A 2000, 31, 1075–1084. [Google Scholar] [CrossRef]
- Jackson, M.R.; Jones, K.D. Mechanical behaviour of Nb-Ti base alloys. In Refractory Metals: Extraction, Processing and Applications; Nona, K., Liddell, C., Sadoway, D.R., Eds.; TMS Publications: Warrendale, PA, USA, 1990; pp. 311–319. [Google Scholar]
- Argent, B.B.; Phelps, B. The oxidation of Niobium-titanium and Niobium-molybdenum alloys. J. Less Common Met. 1960, 2, 181–190. [Google Scholar] [CrossRef]
- Perrin, C.; Bardolle, J.; Mollimard, D. Oxidation kinetics of Nb-Ti alloys. Compt. Rend. Ser. C 1971, 272, 929–932. (In French) [Google Scholar]
- Papadimitriou, I.; Utton, C.; Tsakiropoulos, P. The impact of Ti and temperature on the stability of Nb5Si3 phases: A first-principles study. Sci. Technol. Adv. Mater. 2017, 18, 467–479. [Google Scholar] [CrossRef]
- Tsakiropoulos, P. On the alloying and properties of tetragonal Nb5Si3 in Nb-silicide based alloys. Materials 2018, 11, 69. [Google Scholar] [CrossRef]
- Nelson, J.; Ghadyani, M.; Utton, C.; Tsakiropoulos, P. A study of the effects of Al, Cr, Hf and Ti additions on the microstructure and oxidation of Nb-24Ti-18Si silicide based alloys. Materials 2018, 11, 1579. [Google Scholar] [CrossRef] [PubMed]
- Zacharis, E.; Utton, C.; Tsakiropoulos, P. A study of the effects of Hf and Sn on the microstructure, hardness and oxidation of Nb-18Si silicide based alloys without Ti addition. Materials 2018, 11, 2447. [Google Scholar] [CrossRef]
- Tsakiropoulos, P. Alloying and hardness of eutectics with Nbss and Nb5Si3 in Nb-silicide based alloys. Materials 2018, 11, 592. [Google Scholar] [CrossRef] [PubMed]
- Okamoto, H. Desk Handbook: Phase Diagrams for Binary Alloys; ASM International: Metals Park, OH, USA, 2000. [Google Scholar]
- Tsakiropoulos, P. Alloying and properties of C14-NbCr2 and A15-Nb3X (X = Al, Ge, Si, Sn) in Nb-silicide based alloys. Materials 2018, 11, 395. [Google Scholar] [CrossRef] [PubMed]
- Gorr, B.; Schellert, S.; Müller, F.; Christ, H.; Kauffmann, A.; Heilmaier, M. Current Status of Research on the Oxidation Behavior of Refractory High Entropy Alloys. Adv. Eng. Mater. 2021, 23, 2001047. [Google Scholar] [CrossRef]


| Alloy | Nbss | A15-Nb3X | Nb5Si3 | tP32 Nb3Si | Nb3Si-m | Nb3Si-m’ | C14-NbCr2 | FeNb4Si | Ref. |
|---|---|---|---|---|---|---|---|---|---|
| NV9 | X | X | X | - | - | - | - | - | [22] |
| NV6 | X | X | X | - | - | - | - | - | [22] |
| EZ2 = NV6 + 5Hf | X | X | X | - | - | - | - | - | [30] |
| NV8 = NV6 + 5Fe | - | X | - | X | - | - | - | - | [31] |
| ZX4 = NV6 + 5Cr | X | X | X | - | - | - | X | - | [28] |
| ZX6 = NV6 + 5Al | - | X | X | - | - | - | - | - | [28] |
| ZX8 = NV6 + 5Al + 5Cr | X | X | X | - | - | - | X | - | [28] |
| EZ5 = EZ2 + 5Al | - | X | X | - | - | - | - | - | [30] |
| EZ6 = EZ2 + 5Cr | X | X | X | - | - | - | X | - | [30] |
| EZ8 = EZ2 + 5Al + 5Cr | - | X | X | - | - | - | X | - | [30] |
| KZ4 | X | - | X | - | - | - | - | - | [15] |
| NV3 = KZ4 + 5Fe | X | - | X | - | X | X | - | X | [22] |
| NV5 = KZ4 + 5Fe + 5Sn | - | X | X | - | - | X | - | X | [22] |
| ZX3 = KZ4 + 2Sn | X | - | X | - | - | - | X | - | [27] |
| KZ7 | X | - | X | - | - | - | - | - | [15] |
| ZX5 = KZ7 + 2Sn | X | X | X | - | - | - | - | - | [27] |
| KZ5 | X | - | X | - | - | - | - | - | [15] |
| ZX7 = KZ5 + 2Sn | X | X | X | - | - | - | X | - | [27] |
| Condition | ρ (g/cm3) | Hardness (HV) | % Area of Nbss | % Area of Nb3X |
|---|---|---|---|---|
| NV2–AC | 6.93–7.06 | 606–724 | 46.6–54.4 | 14.8–29.5 |
| 6.97 ± 0.1 | 670 ± 30 | 48.8 ± 2.6 | 20.0 ±4.4 | |
| NV2–HT1 | - | 698–762 | 18.8–42.0 | 35.1–46.8 |
| - | 715 ± 19 | 29.1 ± 7.6 | 40.8 ± 4 | |
| NV2–HT2 | - | 657–715 | 20.2–22.8 | 30.7–32.9 |
| - | 694 ± 18 | 21.5 ± 1.1 | 31.5 ± 1 |
| NV2–AC | Al | Si | Ti | Cr | Fe | Nb | Sn | Hf |
|---|---|---|---|---|---|---|---|---|
| Nbss | 1.9–2.9 | 0.8–2.3 | 27.1–37.0 | 4.0–6.9 | 1.3–3.7 | 43.5–56.0 | 4.2–5.7 | 0.0–2.0 |
| 2.5 ± 0.3 | 1.4 ± 0.3 | 32.4 ± 2.1 | 5.8 ± 0.8 | 2.8 ± 0.7 | 48.9 ± 3 | 4.9 ± 0.4 | 1.3 ± 0.5 | |
| Ti-rich Nbss | 2.4–3.2 | 0.7–2.0 | 37.2–50.2 | 3.6–5.9 | 2.9–5.3 | 28.7–44.0 | 4.5–6.0 | 1.3–2.5 |
| 2.7 ± 0.2 | 1.0 ± 0.2 | 43.0 ± 3.2 | 4.9 ± 0.7 | 4.2 ± 0.6 | 37.4 ± 3.8 | 5.1 ± 0.4 | 1.7 ± 0.4 | |
| A15-Nb3X | 1.8–2.9 | 4.1–6.7 | 21.9–30.2 | 1.5–3.4 | 0.1–1.8 | 46.7–57.9 | 9.7–12.0 | 0.0–1.6 |
| 2.4 ± 0.2 | 5.1 ± 0.5 | 25.4 ± 2.3 | 2.3 ± 0.5 | 0.7 ± 0.4 | 52.9 ± 3 | 10.9 ± 0.7 | 0.3 | |
| Nb5Si3 | 1.3–1.9 | 29.5–34.6 | 22.1–30.8 | 0.8–1.8 | 0.2–2.9 | 26.1–40.0 | 0.4–2.4 | 1.2–4.8 |
| 1.5 ± 0.2 | 31.9 ± 1.3 | 26.5 ± 2.6 | 1.2 ± 0.2 | 1.5 ± 0.7 | 33.1 ± 3.9 | 1.5 ± 0.6 | 2.8 ± 1.1 | |
| Ti-lean Nb5Si3 | 0.6–1.1 | 34.6–36.1 | 18.4–20.9 | 0.1–0.7 | 0.2–0.7 | 37.5–40.9 | 0.9–1.4 | 2.5–3.3 |
| 0.8 ± 0.2 | 35.3 ± 0.4 | 19.9 ± 0.7 | 0.2 | 0.3 | 39.5 ± 1 | 1.2 ± 0.1 | 2.8 ± 0.3 | |
| Hf-rich Nb5Si3 | 1.1–1.8 | 34.3–36.0 | 26.8–30.7 | 0.6–1.8 | 0.2–1.2 | 22.7–30.8 | 0.1–0.7 | 3.4–7.4 |
| 1.5 ± 0.2 | 35.2 ± 0.5 | 28.4 ± 1.1 | 1.0 ± 0.3 | 0.7 ± 0.4 | 27.9 ± 2 | 0.2 | 5.1 ± 1 | |
| Fe7Nb6 μ phase | 1.5–2.0 | 8.0–9.8 | 20.2–25.5 | 20.6–28.1 | 17.1–21.5 | 16.2–22.3 | 0.0–0.8 | 2.6–5.5 |
| 1.8 ± 0.2 | 9.1 ± 0.4 | 23.0 ± 1.4 | 24.2 ± 1.9 | 19.0 ± 1.4 | 18.8 ± 1.5 | 0.2 | 3.9 ± 0.8 | |
| Nb3Si | 1.0–2.1 | 22.6–24.6 | 23.3–31.5 | 2.0–4.8 | 1.8–3.6 | 29.9–42.5 | 0.5–3.5 | 2.6–4.0 |
| 1.7 ± 0.5 | 23.5 ± 0.8 | 29.2 ± 3.9 | 2.6 ± 1.5 | 2.6 ± 0.9 | 34.8 ± 5.4 | 2.2 ± 1.4 | 3.4 ± 0.6 | |
| Nb3Si-m’ | 0.6–0.9 | 26.7–27.7 | 21.3–22.8 | 0.6–1.7 | 3.6–4.5 | 41.2–43.1 | - | 2.2–3.2 |
| 0.8 ± 0.2 | 27.2 ± 0.3 | 22 ± 0.5 | 1 ± 0.3 | 4 ± 0.3 | 42.1 ± 0.6 | - | 2.9 ± 0.4 | |
| Eutectic | 1.6–2.2 | 14.1–19.4 | 26.4–31.9 | 3.2–4.1 | 1.5–3.6 | 36.7–42.0 | 2.3–3.1 | 2.2–3.4 |
| 1.9 ± 0.2 | 16.7 ± 1.6 | 31.1 ± 1.4 | 3.7 ± 0.3 | 2.4 ± 0.6 | 38.7 ± 1.1 | 2.9 ± 0.4 | 2.6 ± 0.4 | |
| NV2–HT1 | ||||||||
| Nbss no Si | 1.5–2.2 | - | 33.3–37.1 | 3.6–4.7 | 1–2.7 | 50.1–55.4 | 2.6–3.3 | 0.8–1.3 |
| 2 ± 0.2 | - | 34.8 ± 1.3 | 3.9 ± 0.5 | 1.9 ± 0.8 | 53.5 ± 2 | 2.9 ± 0.3 | 1 ± 0.2 | |
| Nbss | 2.4–2.9 | 0.5–0.9 | 37–38.6 | 4.2–5.3 | 1.7–2.1 | 46.7–48.1 | 3.3–4 | 1.1–1.5 |
| 2.7 ± 0.2 | 0.7 ± 0.2 | 37.7 ± 0.6 | 4.9 ± 0.4 | 1.8 ± 0.1 | 47.1 ± 0.3 | 3.8 ± 0.2 | 1.3 ± 0.2 | |
| A15-Nb3X | 1.1–4.0 | 1.4–5.6 | 19.1–32.0 | 1.2–4.4 | 0.2–3.1 | 42.5–62.0 | 9.3–14.9 | 0.4–1.3 |
| 2.7 ± 0.7 | 3.8 ± 1.2 | 28.1 ± 3.4 | 2.1 ± 0.7 | 1.0 ± 0.8 | 51.2 ± 4.2 | 10.4 ± 1.5 | 0.7 ± 0.2 | |
| Nb5Si3 | 1.1–1.9 | 33.1–35.7 | 27.3–32.7 | 0.2–2.2 | 0.3–1.8 | 23–30.3 | 0.2–0.7 | 3.9–5.7 |
| 1.4 ± 0.2 | 34.8 ± 0.7 | 30.2 ± 1.4 | 0.8 ± 0.5 | 0.9 ± 0.4 | 26.7 ± 2 | 0.4 ± 0.2 | 4.8 ± 0.5 | |
| Si-lean Nb5Si3 | 1.4–1.5 | 30.7–33 | 29.2–34.7 | 1.2–4.2 | 0.8–3.0 | 21.8–28.9 | 0.4–0.8 | 4.2–5.0 |
| 1.5 ± 0.1 | 31.8 ± 1.2 | 30.8 ± 2.6 | 2.7 ± 1.4 | 2.0 ± 1 | 26.0 ± 3.1 | 0.6 ± 0.2 | 4.6 ± 0.3 | |
| π phase | 1.2–1.7 | 6.9–11.5 | 20.4–22.5 | 23.9–32.3 | 13.5–18.7 | 16.2–22.8 | - | 3.5–4.4 |
| 1.4 ± 0.2 | 7.6 ± 0.3 | 21.4 ± 0.4 | 30.3 ± 0.8 | 17.3 ± 0.5 | 18.1 ± 0.6 | - | 3.9 ± 0.2 | |
| Nb3Si | 0.9–1.1 | 23.9–24.1 | 25.6–25.9 | 1.2–4.1 | 4.4–5.5 | 36–39.7 | 0.1–0.6 | 3.5–3.6 |
| 1.0 ± 0.1 | 24.0 ± 0.1 | 25.7 ± 0.2 | 2.7 ± 2.1 | 4.9 ± 0.8 | 37.8 ± 1.2 | 0.3 | 3.6 ± 0.1 | |
| Nb3Si-m’ | 0.5–1.0 | 25.7–28.7 | 22.8–26.9 | 0.7–4.0 | 3.0–5.4 | 35.0–41.0 | 0.1–0.7 | 2.9–3.6 |
| 0.7 ± 0.2 | 26.9 ± 0.8 | 25.6 ± 0.8 | 1.8 ± 0.8 | 4.3 ± 0.6 | 37.2 ± 1.3 | 0.2 | 3.3 ± 0.2 | |
| NV2–HT2 | ||||||||
| Nbss no Si | 2.4–3 | – | 37.3–41.4 | 4.1–5.8 | 1.3–2.6 | 43.9–49 | 3.2–4.6 | 1.1–1.5 |
| 2.7 ± 0.2 | – | 38.7 ± 1.2 | 5 ± 0.7 | 1.9 ± 0.5 | 46.6 ± 2.2 | 3.8 ± 0.6 | 1.3 ± 0.2 | |
| Nbss | 2.5–3.3 | 0.4–1.2 | 39–42 | 5.2–6.6 | 1.6–2.3 | 41.1–43.3 | 3.7–4.6 | 1.1–1.8 |
| 3 ± 0.3 | 0.7 ± 0.3 | 40.7 ± 0.9 | 6 ± 0.6 | 1.9 ± 0.3 | 42.2 ± 0.9 | 4 ± 0.2 | 1.5 ± 0.3 | |
| A15-Nb3X | 2.8–3.8 | 2.5–4.2 | 31–33.5 | 2.3–3.3 | 0.2–1.4 | 42.8–46.8 | 11.3–13.0 | 0.7–1.0 |
| 3.3 ± 0.3 | 3.1 ± 0.4 | 32.1 ± 0.8 | 2.7 ± 0.2 | 0.8 ± 0.5 | 45.2 ± 1.1 | 12.0 ± 0.6 | 0.8 ± 0.1 | |
| Hf-rich Nb5Si3 | 1.2–1.7 | 35.1–36.1 | 26.9–31.6 | 0.2–0.7 | 0.6–1.0 | 22.2–30.4 | 0.1–0.5 | 3.8–6.8 |
| 1.5 ± 0.2 | 35.7 ± 0.3 | 28.8 ± 1.7 | 0.4 | 0.7 ± 0.1 | 27.8 ± 3.2 | 0.3 | 4.8 ± 1.1 | |
| π phase | 1.3–2.0 | 7.5–9.1 | 18.4–21.4 | 27.3–32.5 | 15.9–20.5 | 17.7–19.5 | - | 3.6–4 |
| 1.7 ± 0.2 | 8.3 ± 0.4 | 19.5 ± 1 | 30.6 ± 1.9 | 17.4 ± 1.6 | 18.7 ± 0.5 | - | 3.8 ± 0.1 | |
| Nb3Si | 0.8–0.9 | 23.4–24.4 | 24.6–26.8 | 0.9–2.1 | 2.9–3.9 | 39.6–40.1 | 1.5–2.4 | 2.7–3.1 |
| 0.9 ± 0.1 | 23.9 ± 1.2 | 25.6 ± 1.2 | 1.5 ± 0.6 | 3.4 ± 0.7 | 39.9 ± 0.7 | 1.9 ± 1.2 | 2.9 ± 0.3 | |
| Nb3Si-m’ | 0.2–1.0 | 27.7–28.9 | 23.1–24.4 | 0.6–1.4 | 3.4–4.3 | 38–39.4 | - | 3.2–3.9 |
| 0.6 ± 0.3 | 28.4 ± 0.3 | 23.9 ± 0.4 | 0.8 ± 0.2 | 3.9 ± 0.3 | 38.9 ± 0.4 | - | 3.5 ± 0.2 | |
| Alloy | 700 °C | 800 °C | 900 °C | ||
|---|---|---|---|---|---|
| kl (g·cm−2·s−1) | kp (g2·cm−4·s−1) | kl (g·cm−2·s−1) | kp (g2·cm−4·s−1) | kl (g·cm−2·s−1) | |
| NV1 | - | 3.4 × 10⁻¹¹ | - | 2.8 × 10⁻¹⁰ | 5.4 × 10⁻⁸ (0–16 h), 1.3 × 10⁻⁷ (>16 h) |
| NV2 | - | 4.4 × 10⁻¹³ | - | 3.4 × 10⁻¹¹ | 9.8 × 10⁻⁸ (0–16 h), 2.0 × 10⁻⁷ (>16 h) |
| NV3 | - | 1.4 × 10⁻¹¹ | 1.4 × 10⁻⁷ | - | 1.4 × 10⁻⁷ |
| NV5 | - | 1.3 × 10⁻¹² | - | 1.3 × 10⁻¹² | 3.0 × 10⁻⁷ (0–55 h), 1.3 × 10⁻⁷ (>55 h) |
| NV6 | - | 1.3 × 10⁻¹¹ | 3.3 × 10⁻⁸ | - | 2.1 × 10⁻⁶ (0–17 h), 9.3 × 10⁻⁸ (>17 h) |
| NV8 | - | 7.2 × 10⁻¹² | - | 6.1 × 10⁻¹¹ | 3.1 × 10⁻⁷ (0–5 h), 9.8 × 10⁻⁷ (>5 h) |
| MASC | 5.6 × 10⁻⁸ (>10 h) | 6.9 × 10⁻¹² (0–10 h) | 1.5 × 10⁻⁷ | - | 5.3 × 10⁻⁷ |
| Oxide Scale | |||||||||
|---|---|---|---|---|---|---|---|---|---|
| Phase | O | Al | Si | Ti | Cr | Fe | Nb | Sn | Hf |
| Nb and Ti-rich oxide | 69.2–71.2 | 0.5–1.1 | 0.5–2.7 | 5.6–8.3 | 03–1.3 | 0.1–0.7 | 17.3–19.1 | 0.1–1.1 | 0.2–0.5 |
| 70.1 ± 0.3 | 0.8 ± 0.2 | 1.8 ± 0.4 | 7.6 ± 0.3 | 0.8 ± 0.3 | 0.2 | 18.1 ± 0.5 | 0.3 | 0.3 | |
| Si-rich oxide | 67.8–69.0 | 0.3–0.9 | 9.6–12.7 | 7.3–10.8 | 0.1–0.6 | 0.1–0.6 | 8.2–9.9 | 0.1–0.3 | 1.2–1.8 |
| 68.3 ± 0.4 | 0.5 ± 0.2 | 12.0 ± 0.3 | 8.3 ± 1 | 0.2 | 0.1 | 9.0 ± 0.4 | 0.1 | 1.5 ± 0.2 | |
| Ti-rich oxide | 66.8–68.3 | 0.3–1.5 | 0.1–0.4 | 21.3–28.1 | 1.0–4.6 | 0.1–0.4 | 2.7–6.7 | - | 0.1–0.3 |
| 67.5 ± 0.2 | 0.6 ± 0.3 | 0.2 | 24.2 ± 1.5 | 2.6 ± 1 | 0.2 | 4.4 ± 1.1 | - | 0.2 | |
| Diffusion zone (analyses up to about 50 μm below oxide scale) | |||||||||
| Nbss | 17.5–30.9 | 1.1–2.3 | 0.1–1.5 | 19.2–31.6 | 2.3–6.1 | 1.0–3.4 | 15.2–35.9 | 2.3–3.9 | 0.6–1.2 |
| 28.4 ± 2 | 1.8 ± 0.3 | 0.8 ± 0.2 | 24.5 ± 2 | 4.4 ± 1.1 | 2.1 ± 0.8 | 33.8 ± 1 | 3.2 ± 0.2 | 1.0 ± 0.1 | |
| Nb5Si3 | 5.8–14.1 | 1.2–1.7 | 27.7–33.6 | 25.1–28.3 | 0.5–1.8 | 0.1–0.9 | 24.0–29.9 | 0.1–0.7 | 3.5–4.4 |
| 7.9 ± 1.1 | 1.3 ± 0.1 | 32.2 ± 0.4 | 26.4 ± 0.5 | 0.9 ± 0.2 | 0.4 ± 0.1 | 26.5 ± 1 | 0.3 | 4.1 ± 0.1 | |
| A15–Nb3X | 10.2–36.4 | 1.5–2.6 | 2.9–5.5 | 14.6–28.6 | 1.1–2.1 | 0.1–1.4 | 33.2–48.8 | 7.6–10.5 | 0.5–0.8 |
| 18.8 ± 3 | 2.1 ± 0.2 | 4.2 ± 0.4 | 21.3 ± 2.1 | 1.7 ± 0.3 | 0.3 | 41.9 ± 2.1 | 9.0 ± 0.5 | 0.7 ± 0.1 | |
| Sn-rich A15–Nb3X | 29.9–33.8 | 0.1–0.7 | 1.0–1.5 | 4.3–12.4 | 0.1–1.3 | 0.1–2.9 | 39.8–46.0 | 11.2–15.7 | 0.1–0.6 |
| 31.9 ± 0.8 | 0.2 | 1.2 ± 0.1 | 8.5 ± 0.9 | 0.7 ± 0.2 | 1.3 ± 0.8 | 42.3 ± 1.1 | 13.5 ± 1.1 | 0.4 | |
| π phase (see text) | 7.4–29.8 | 1.2–2.0 | 5.5–9.2 | 14.4–23.9 | 14.8–24.3 | 12.4–19.0 | 15.5–22.2 | 0.1–2.3 | 2.2–3.7 |
| 14.6 ± 2.1 | 1.6 ± 0.3 | 7.8 ± 0.9 | 20.0 ± 0.8 | 19.4 ± 1.3 | 15.9 ± 1.1 | 16.9 ± 1.8 | 0.8 ± 0.4 | 3.0 ± 0.3 | |
| Bulk (analyses from about 50 to about 300 μm below oxide scale) | |||||||||
| Nbss | 11.5–14.6 | 1.6–2.0 | 0.6–1.4 | 29.1–34.1 | 2.5–6.6 | 1.4–3.4 | 40.4–44.6 | 2.1- 3.7 | 0.7–1.3 |
| 12.6 ± 0.9 | 1.7 ± 0.3 | 1.0 ± 0.2 | 31.7 ± 0.6 | 4.3 ± 0.8 | 2.3 ± 0.7 | 42.8 ± 0.8 | 2.6 ± 0.2 | 1.0 ± 0.1 | |
| Nb5Si3 | 5.8–7.8 | 1.2–1.3 | 32.9–33.6 | 25.6–29.3 | 0.6–1.0 | 0.4–1.0 | 23.3–27.5 | 0.3–0.4 | 3.9–4.8 |
| 6.6 ± 0.3 | 1.2 ± 0.1 | 33.2 ± 0.2 | 27.6 ± 0.8 | 0.8 ± 0.1 | 0.7 ± 0.2 | 25.1 ± 0.8 | 0.4 ± 0.1 | 4.4 ± 0.2 | |
| A15–Nb3X | 8.0–11.2 | 1.9–2.4 | 4.3–6.1 | 21.0–24.6 | 1.4–2.1 | 0.1–0.7 | 46.8–49.9 | 9.3–10.4 | 0.6–0.8 |
| 10.1 ± 0.4 | 2.2 ± 0.1 | 5.0 ± 0.6 | 22.0 ± 0.9 | 1.8 ± 0.2 | 0.4 | 48.2 ± 0.8 | 9.6 ± 0.3 | 0.7 ± 0.1 | |
| π phase (see text) | 4.6–6.0 | 1.3–1.6 | 7.8–10.3 | 21.7–24.8 | 22.6–25.3 | 17.4–19.0 | 15.0–17.0 | 0.1–0.4 | 2.9–3.8 |
| 5.4 ± 0.3 | 1.4 ± 0.1 | 8.5 ± 0.5 | 22.9 ± 0.8 | 23.8 ± 0.8 | 18.2 ± 0.5 | 16.3 ± 0.4 | 0.1 | 3.4 ± 0.3 | |
| Ti oxide (see text) | 16.2–20.6 | 0.9–2.1 | 1.1–2.4 | 39.2–44.8 | 3.1–5.4 | 7.8–16.4 | 9.6–18.6 | 1.2–4.0 | 1.7–2.8 |
| 18.4 ± 1 | 1.3 ± 0.4 | 1.5 ± 0.2 | 41.1 ± 1 | 4.3 ± 0.8 | 12.3 ± 1.2 | 15.5 ± 1.2 | 2.2 ± 0.6 | 2.3 ± 0.4 | |
| Oxide Scale | |||||||
|---|---|---|---|---|---|---|---|
| Phase | O | Si | Ti | Cr | Fe | Nb | Sn |
| Nb and Ti-rich oxide | 67.4–69.3 | 0.9–2.3 | 7.1–15.6 | 0.2–2.2 | 0.1–2.9 | 14.8–19.5 | - |
| 68.6 ± 0.6 | 1.6 ± 0.3 | 10.4 ± 2 | 1.5 ± 0.5 | 0.7 ± 0.5 | 17.2 ± 1.1 | - | |
| Si-rich oxide | 67.3–69.1 | 9.7–11.9 | 4.5–6.5 | 0.2–1.2 | 0.1–1.5 | 13.1–15.8 | - |
| 68.4 ± 0.5 | 11.0 ± 0.4 | 5.4 ± 0.5 | 0.5 ± 0.3 | 0.4 | 14.3 ± 0.5 | - | |
| Ti-rich oxide | 67.4–69.0 | 0.2–0.9 | 24.2–27.7 | 0.8–2.0 | 0.1–2.5 | 2.1–4.9 | - |
| 68.1 ± 0.5 | 0.7 ± 0.2 | 25.8 ± 0.9 | 1.4 ± 0.3 | 0.6 | 3.4 ± 0.5 | - | |
| Nb-rich oxide | 66.5–70.0 | 0.8–2.8 | 2.5–5.9 | 0.9–3.2 | 0.3–0.6 | 21.6–25.1 | - |
| 67.9 ± 1.1 | 1.8 ± 0.5 | 4.6 ± 0.7 | 2.2 ± 0.8 | 0.4 ± 0.1 | 23.1 ± 0.9 | - | |
| Mixed oxide (see text) | 66.5–68.2 | 4.8–6.7 | 4.7–7.9 | 1.6–3.2 | 0.4–2.2 | 14.7–19.5 | - |
| 67.6 ± 0.5 | 5.7 ± 0.7 | 6.6 ± 0.9 | 2.4 ± 0.5 | 1.0 ± 0.5 | 16.6 ± 1.1 | - | |
| Bulk (analyses up to about 300 μm below oxide scale) | |||||||
| Nbss (see text) | 11.2–35.8 | 0.1–0.9 | 26.7–38.6 | 1.2–4.2 | 1.0–5.7 | 18.4–39.8 | 3.3–4.5 |
| 28.1 ± 1.9 | 0.4 | 34.5 ± 1.9 | 2.5 ± 0.8 | 2.6 ± 1 | 28.1 ± 3 | 3.8 ± 0.3 | |
| Nb5Si3 | 5.1–9.8 | 28.3–31.2 | 15.6–19.6 | 0.7–1.4 | 0.8–2.2 | 37.9–44.0 | 1.5–2.1 |
| 7.2 ± 0.8 | 30.4 ± 0.8 | 16.4 ± 0.8 | 1.0 ± 0.2 | 1.1 ± 0.2 | 42.2 ± 1.1 | 1.7 ± 0.1 | |
| A15–Nb3X | 8.1–31.1 | 3.1–4.5 | 10.3–21.0 | 1.2–2.7 | 0.6–2.2 | 38.1–49.7 | 9.2–14.7 |
| 16.8 ± 0.8 | 3.9 ± 0.3 | 18.4 ± 1.9 | 2.2 ± 0.5 | 1.1 ± 0.5 | 45.7 ± 0.9 | 11.9 ± 0.7 | |
| Sn-rich A15–Nb3X | 14.7–31.8 | 3.3–7.4 | 1.2–12.7 | 0.1–0.4 | 1.3–2.8 | 33.8–47.0 | 17.2–28.2 |
| 23.0 ± 0.5 | 5.7 ± 0.7 | 5.1 ± 2.1 | 0.1 | 1.9 ± 0.4 | 42.9 ± 0.9 | 21.3 ± 0.9 | |
| Ti oxide (see text) | 16.6–19.6 | 1.2–4.8 | 44.1–53.3 | 4.0–6.2 | 12.7–19.0 | 5.6–11.9 | 0.6–3.0 |
| 17.7 ± 0.8 | 2.5 ± 0.8 | 49.6 ± 1.1 | 4.7 ± 0.5 | 15.3 ± 0.9 | 8.4 ± 0.8 | 1.8 ± 0.9 | |
| FeNb4Si | 5.0–13.4 | 12.6–18.2 | 19.0–25.0 | 9.5–14.8 | 9.8–15.1 | 29.4–34.9 | - |
| 8 ± 0.9 | 13.8 ± 0.8 | 21.0 ± 1.1 | 12.9 ± 0.7 | 11.8 ± 1.1 | 32.5 ± 1.3 | - | |
| Fe7Nb6 | 6.1–14.6 | 7.1–8.2 | 29.4–39.0 | 6.5–16.5 | 17.8–18.9 | 14.1–20.9 | - |
| 10.8 ± 0.8 | 7.6 ± 0.2 | 34.2 ± 1.2 | 11.5 ± 1.3 | 18.4 ± 0.1 | 17.5 ± 0.5 | - | |
| Nb3Si m’ | 7.2–8.3 | 26.7–28.5 | 19.5–20.4 | 1.6–2.4 | 2.3–3.6 | 37.1–38.8 | 1.4–2.1 |
| 7.7 ± 0.3 | 27.6 ± 0.5 | 20.0 ± 0.1 | 2.0 ± 0.2 | 2.9 ± 0.3 | 38.0 ± 0.5 | 1.8 ± 0.2 | |
| Nominal Composition (at.%) | Alloy | MACSi (at.%) | Reference |
|---|---|---|---|
| Nb–18Si–24Ti–5Cr–5Sn | ZX4 | 7.3 | [28] |
| Nb–18Si–24Ti–5Cr–5Fe–5Sn | NV5 | 4 | [22] |
| Nb–18Si–24Ti–5Cr–5Fe | NV3 | 2.6 | [22] |
| Nb–30Ti–10Si–5Cr–5Sn–3Fe–2Al–2Hf | NV2 | 2.5 | This work |
| Nb–18Si–24Ti–5Cr | KZ4 | 1.9 | [15] |
| Nominal Composition (at.%) | Alloy | AC | HT | Reference | |
|---|---|---|---|---|---|
| Nbss | Ti-Rich Nbss | Nbss | |||
| Nb–18Si + 24Ti | KZ3 | X | X | X | [15] |
| Nb–18Si +24Ti + 5Cr | KZ4 | X | X | X | [15] |
| Nb–18Si +24Ti + 5Al | KZ7 | X | X | X | [15] |
| Nb–18Si +24Ti + 5Al + 5Cr | KZ5 | X | X | X | [15] |
| Nb–18Si +24Ti + 5Cr + 2Sn | ZX3 | X | X | X | [27] |
| Nb–18Si +24Ti + 5Al + 2Sn | ZX5 | X | X | X | [27] |
| Nb–18Si +24Ti + 5Al + 5Cr + 2Sn | ZX7 | X | X | X | [27] |
| Nb–18Si +24Ti + 5Cr + 5Sn | ZX4 | X | - | X | [28] |
| Nb–18Si +24Ti + 5Al + 5Sn | ZX6 | X | - | - | [28] |
| Nb–18Si +24Ti + 5Al + 5Cr + 5Sn | ZX8 | - | - | X | [28] |
| Nb–18Si +24Ti + 5Al + 5Sn + 5Hf | EZ5 | X | - | - | [30] |
| Nb–18Si +24Ti + 5Cr + 5Sn + 5Hf | EZ6 | X | X | X | [30] |
| Nb–18Si +24Ti + 5Al + 5Cr + 5Sn + 5Hf | EZ8 | X | - | - | [30] |
| Nb–18Si +24Ti + 5Sn | NV6 | X | - | X | [16] |
| Nb–18Si +24Ti + 5Cr + 5Fe | NV3 | X | X | X | [22] |
| Nb–18Si +24Ti + 5Cr + 5Fe + 5Sn | NV5 | X | - | - | [22] |
| Nb–18Si +24Ti + 5Fe + 5Sn | NV8 | X | X | - | [31] |
| Location | Phase | Characteristic Features |
|---|---|---|
| Oxide scale | Nb and Ti-rich oxide, Si-rich oxide, Ti-rich oxide | Thickness: non-uniform, but less severe non-uniformity compared with the alloy NV1 [32] |
| Cracks still present, but noticeably less compared with NV1 | ||
| Small Sn-rich areas in scale | ||
| Diffusion zone (up to 50 μm below scale) | Nbss, Nb5Si3, Nb3Sn, Sn-rich Nb3Sn, π phase | Thicker compared with the alloy NV1 and almost continuous layer of Nb3Sn was formed at the interface with the scale |
| Cracks parallel to the oxide scale surface formed in Nb5Si3 grains | ||
| Severely oxidised solid solution exhibiting “pitting” | ||
| No “pitting” in Nb3Sn grains | ||
| Bulk (from 50 to 300 μm below scale) | Nbss, Nb5Si3, Nb3Sn, π phase, Ti oxide | “Pitting” of Nbss almost eliminated |
| No cracking of Nb5Si3 grains | ||
| Lamellar microstructure seen in the eutectic in NV2–AC still present and intact | ||
| Formation of Ti oxide(s) that were randomly distributed in the microstructure. Ti oxide formed mainly around the π phase and its interface with Nbss, from which sometimes a lamellar microstructure of solid solution and Nb5Si3 silicide was formed |
| Location | Phase | Characteristic Features |
|---|---|---|
| Oxide scale | Nb and Ti-rich oxide, Si-rich oxide, Ti-rich oxide and mixed oxide | Thickness: thinner than NV2 but still non-uniform and non-uniformity the same with NV2 |
| Cracking more severe than in NV2 | ||
| Small Sn-rich areas in scale | ||
| Subscale | Sn-rich Nb3Sn | Cracks parallel to oxide scale surface formed in Nb5Si3 grains |
| Sn-rich Nb3Sn formed at the interface of alloy with scale. This A15 compound exhibited severe “pitting” | ||
| Ti oxide formed in the few areas where solid solution grains were present (note that the volume fraction of Nbss in NV5–AC was about 2 at%) | ||
| Bulk (up to 300 μm below scale) | Nbss, Nb5Si3, Nb3Sn, Nb3Si m’, FeNb4Si (τ4), Fe7Nb6 and Ti oxide | Volume fraction of Ti oxide increased compared with NV5–AC. Some grains of the Ti oxide were large in size |
| Ti oxide was not formed near τ4 and Fe7Nb6 | ||
| Microstructure architecture similar to that in NV5–AC |
| Phase | CC | HE | Alloy | Condition or Area | Data in |
|---|---|---|---|---|---|
| Nb5Si3 | X | - | NV2 | AC, HT1 | Table 3 |
| Ti-lean Nb5Si3 | X | - | AC | ||
| Hf-rich Nb5Si3 | X | - | AC, HT2 | ||
| Fe7Nb6 (μ phase) | X | - | AC | ||
| Nb3Si | X | - | AC, HT1, HT2 | ||
| Nbss + Nb5Si3 eutectic | X | - | AC | ||
| Si-poor Nb5Si3 | X | - | HT1 | ||
| π phase | X | - | HT1, HT2 | ||
| Nb3Si-m’ | X | - | HT1, HT2 | ||
| Oxidised at 800 °C | |||||
| Nbss | X | - | NV2 | DZ | Table 5 |
| Nb5Si3 | X | - | DZ, Bulk | ||
| π phase | X | - | DZ, Bulk | ||
| Nbss | X | - | NV5 | Bulk | Table 6 |
| FeNb4Si | - | X | |||
| Fe7Nb6 | - | X | |||
| Nb3Si-m’ | X | - | |||
| Nb5Si3 | X | - | NV1 | Bulk | [32] |
| Lamellar Nbss + Nb5Si3 | X | - | |||
| Nbss | X | - | |||
| Ti-rich Nbss | X | - | |||
| Nbss | X | - | ZX5, ZX7 | DZ | [27] |
| Nb5Si3 | X | - | |||
| Lamellar Nbss + Nb5Si3 | X | ZX8 | DZ | [28] | |
| Oxidised at 1200 °C | |||||
| NbSn2 | X | - | ZX3, ZX4 | Sn-rich area below the scale | [27,28] |
| Nb5Si3 | X | - | ZX5 | [27] | |
| C14–NbCr2 | X | ZX7 | Bulk | [27] |
Publisher’s Note: MDPI stays neutral with regard to jurisdictional claims in published maps and institutional affiliations. |
© 2022 by the authors. Licensee MDPI, Basel, Switzerland. This article is an open access article distributed under the terms and conditions of the Creative Commons Attribution (CC BY) license (https://creativecommons.org/licenses/by/4.0/).
Share and Cite
Vellios, N.; Tsakiropoulos, P. The Effect of Fe Addition in the RM(Nb)IC Alloy Nb–30Ti–10Si–2Al–5Cr–3Fe–5Sn–2Hf (at.%) on Its Microstructure, Complex Concentrated and High Entropy Phases, Pest Oxidation, Strength and Contamination with Oxygen, and a Comparison with Other RM(Nb)ICs, Refractory Complex Concentrated Alloys (RCCAs) and Refractory High Entropy Alloys (RHEAs). Materials 2022, 15, 5815. https://doi.org/10.3390/ma15175815
Vellios N, Tsakiropoulos P. The Effect of Fe Addition in the RM(Nb)IC Alloy Nb–30Ti–10Si–2Al–5Cr–3Fe–5Sn–2Hf (at.%) on Its Microstructure, Complex Concentrated and High Entropy Phases, Pest Oxidation, Strength and Contamination with Oxygen, and a Comparison with Other RM(Nb)ICs, Refractory Complex Concentrated Alloys (RCCAs) and Refractory High Entropy Alloys (RHEAs). Materials. 2022; 15(17):5815. https://doi.org/10.3390/ma15175815
Chicago/Turabian StyleVellios, Nikos, and Panos Tsakiropoulos. 2022. "The Effect of Fe Addition in the RM(Nb)IC Alloy Nb–30Ti–10Si–2Al–5Cr–3Fe–5Sn–2Hf (at.%) on Its Microstructure, Complex Concentrated and High Entropy Phases, Pest Oxidation, Strength and Contamination with Oxygen, and a Comparison with Other RM(Nb)ICs, Refractory Complex Concentrated Alloys (RCCAs) and Refractory High Entropy Alloys (RHEAs)" Materials 15, no. 17: 5815. https://doi.org/10.3390/ma15175815
APA StyleVellios, N., & Tsakiropoulos, P. (2022). The Effect of Fe Addition in the RM(Nb)IC Alloy Nb–30Ti–10Si–2Al–5Cr–3Fe–5Sn–2Hf (at.%) on Its Microstructure, Complex Concentrated and High Entropy Phases, Pest Oxidation, Strength and Contamination with Oxygen, and a Comparison with Other RM(Nb)ICs, Refractory Complex Concentrated Alloys (RCCAs) and Refractory High Entropy Alloys (RHEAs). Materials, 15(17), 5815. https://doi.org/10.3390/ma15175815