
Development of a Three-Dimensional Optical Verification Technology without Environmental Pollution for Metal Components with Different Surface Properties


Abstract
:1. Introduction
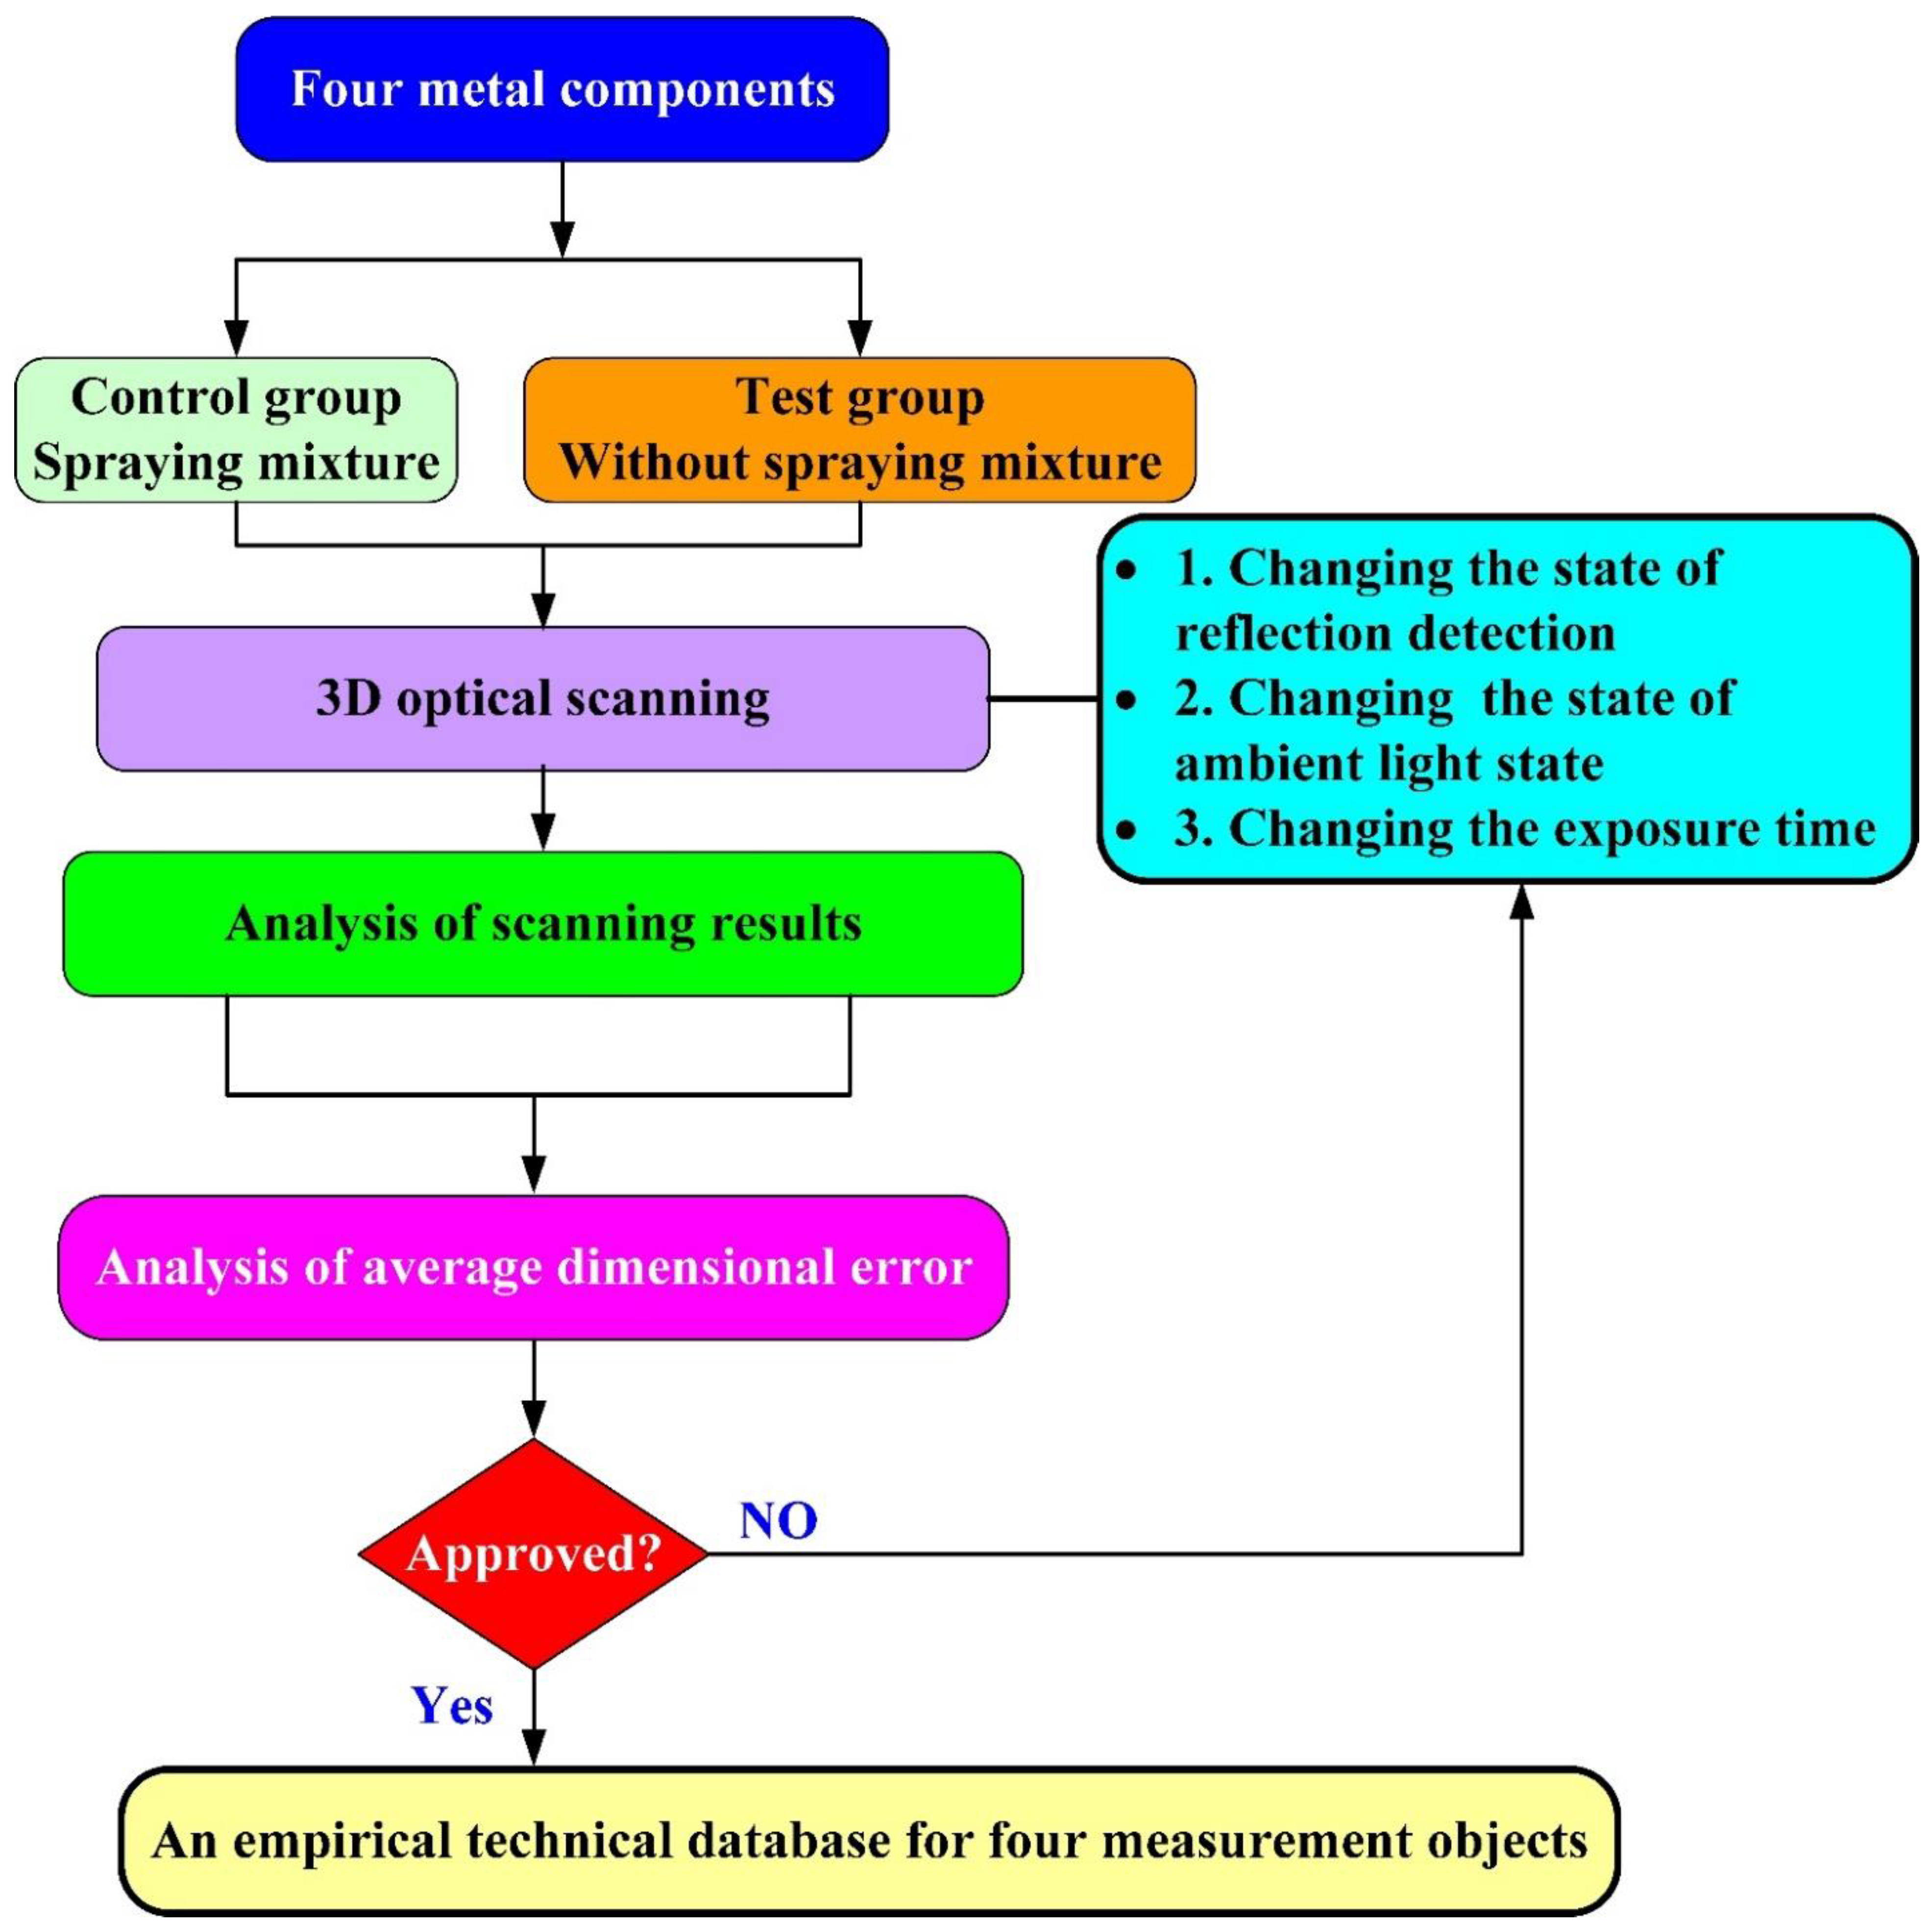
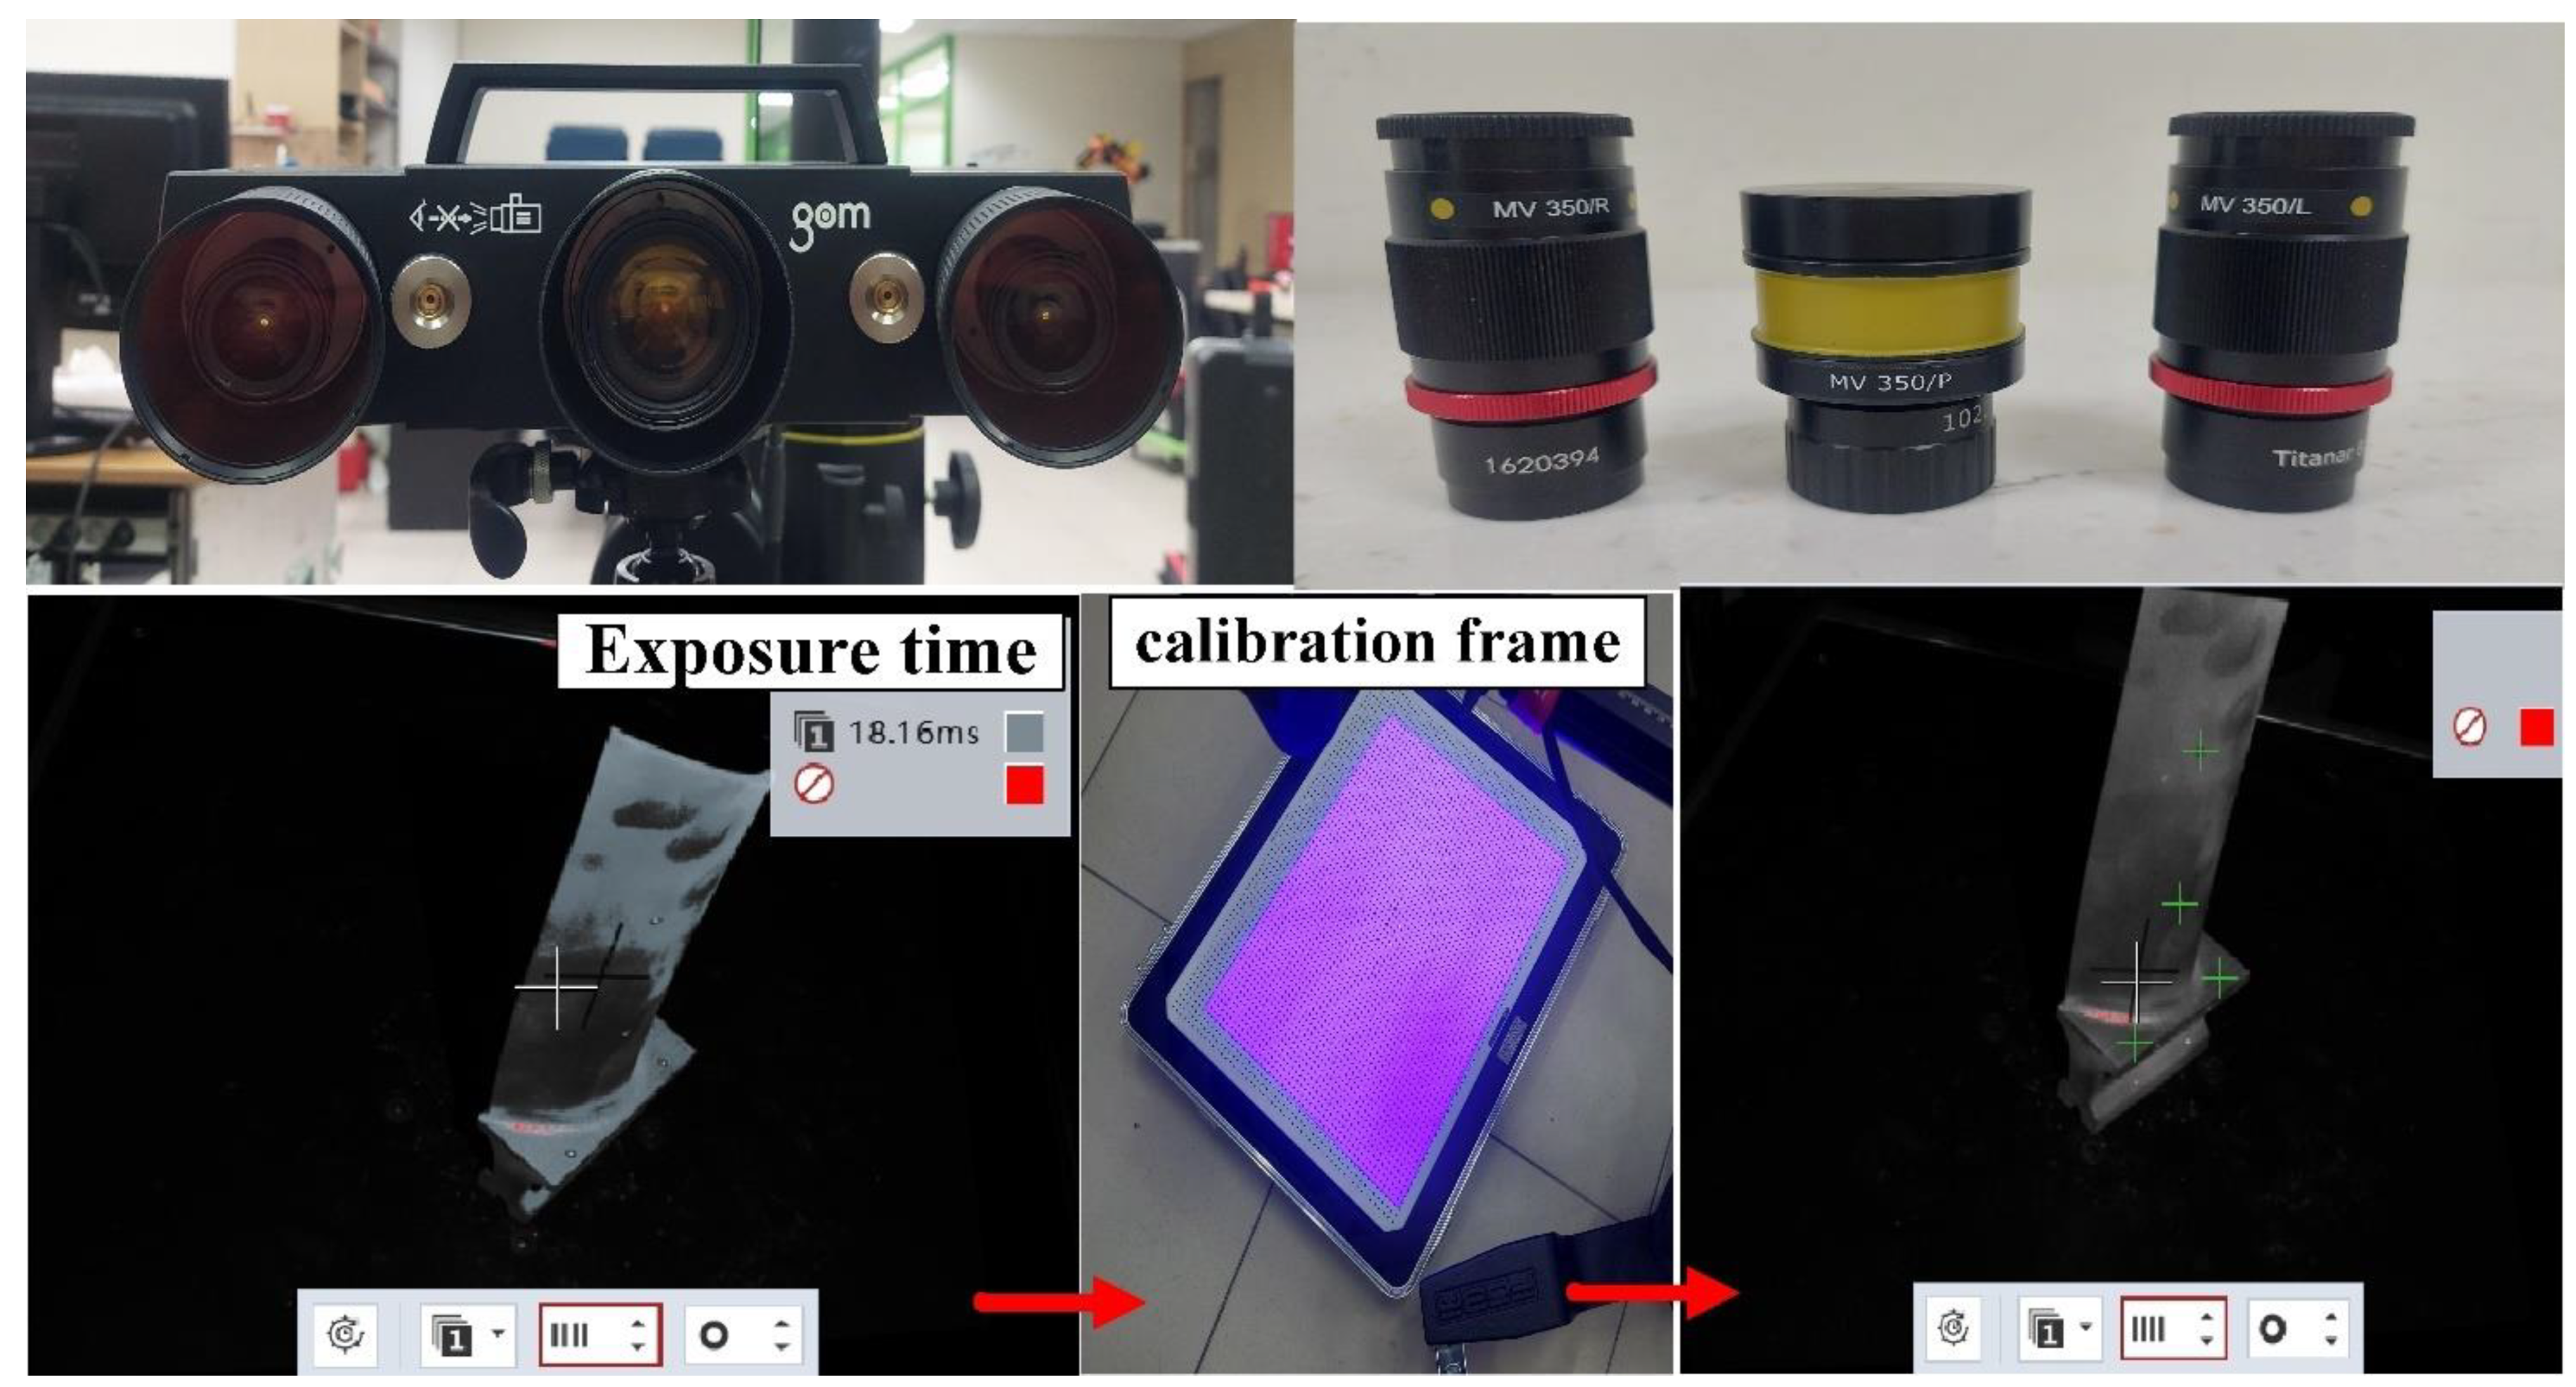
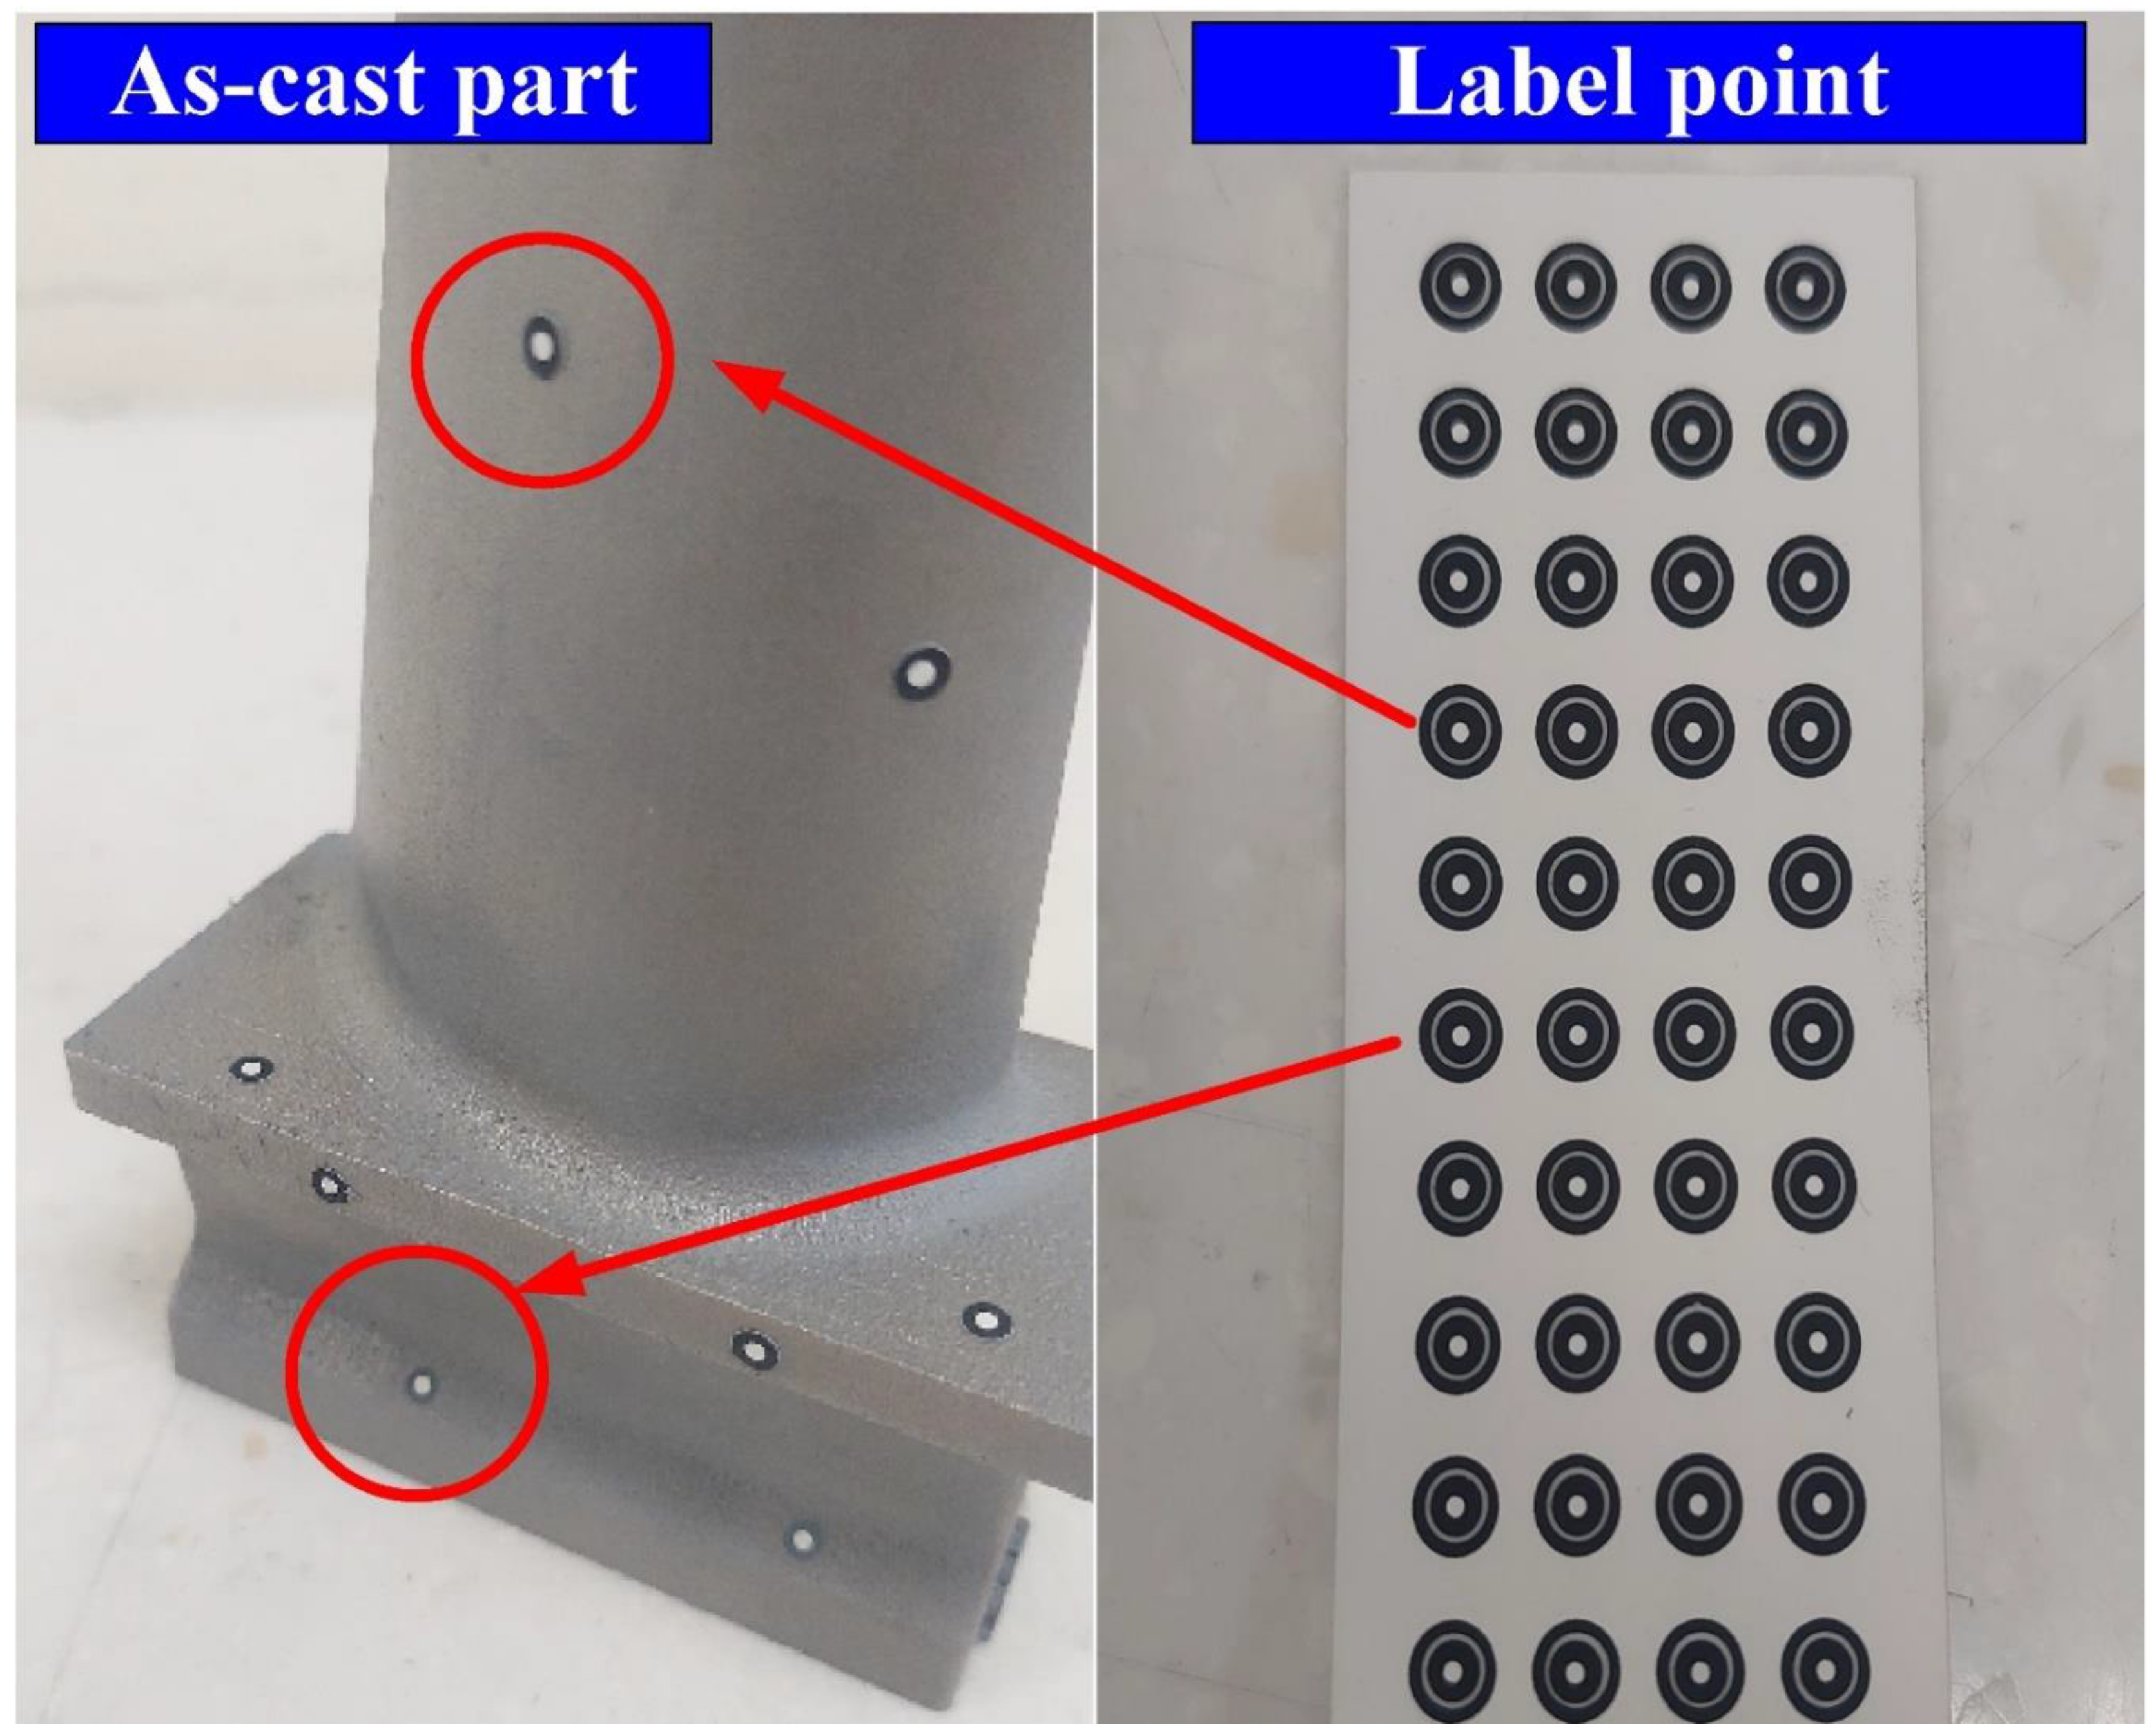
2. Experimental Details
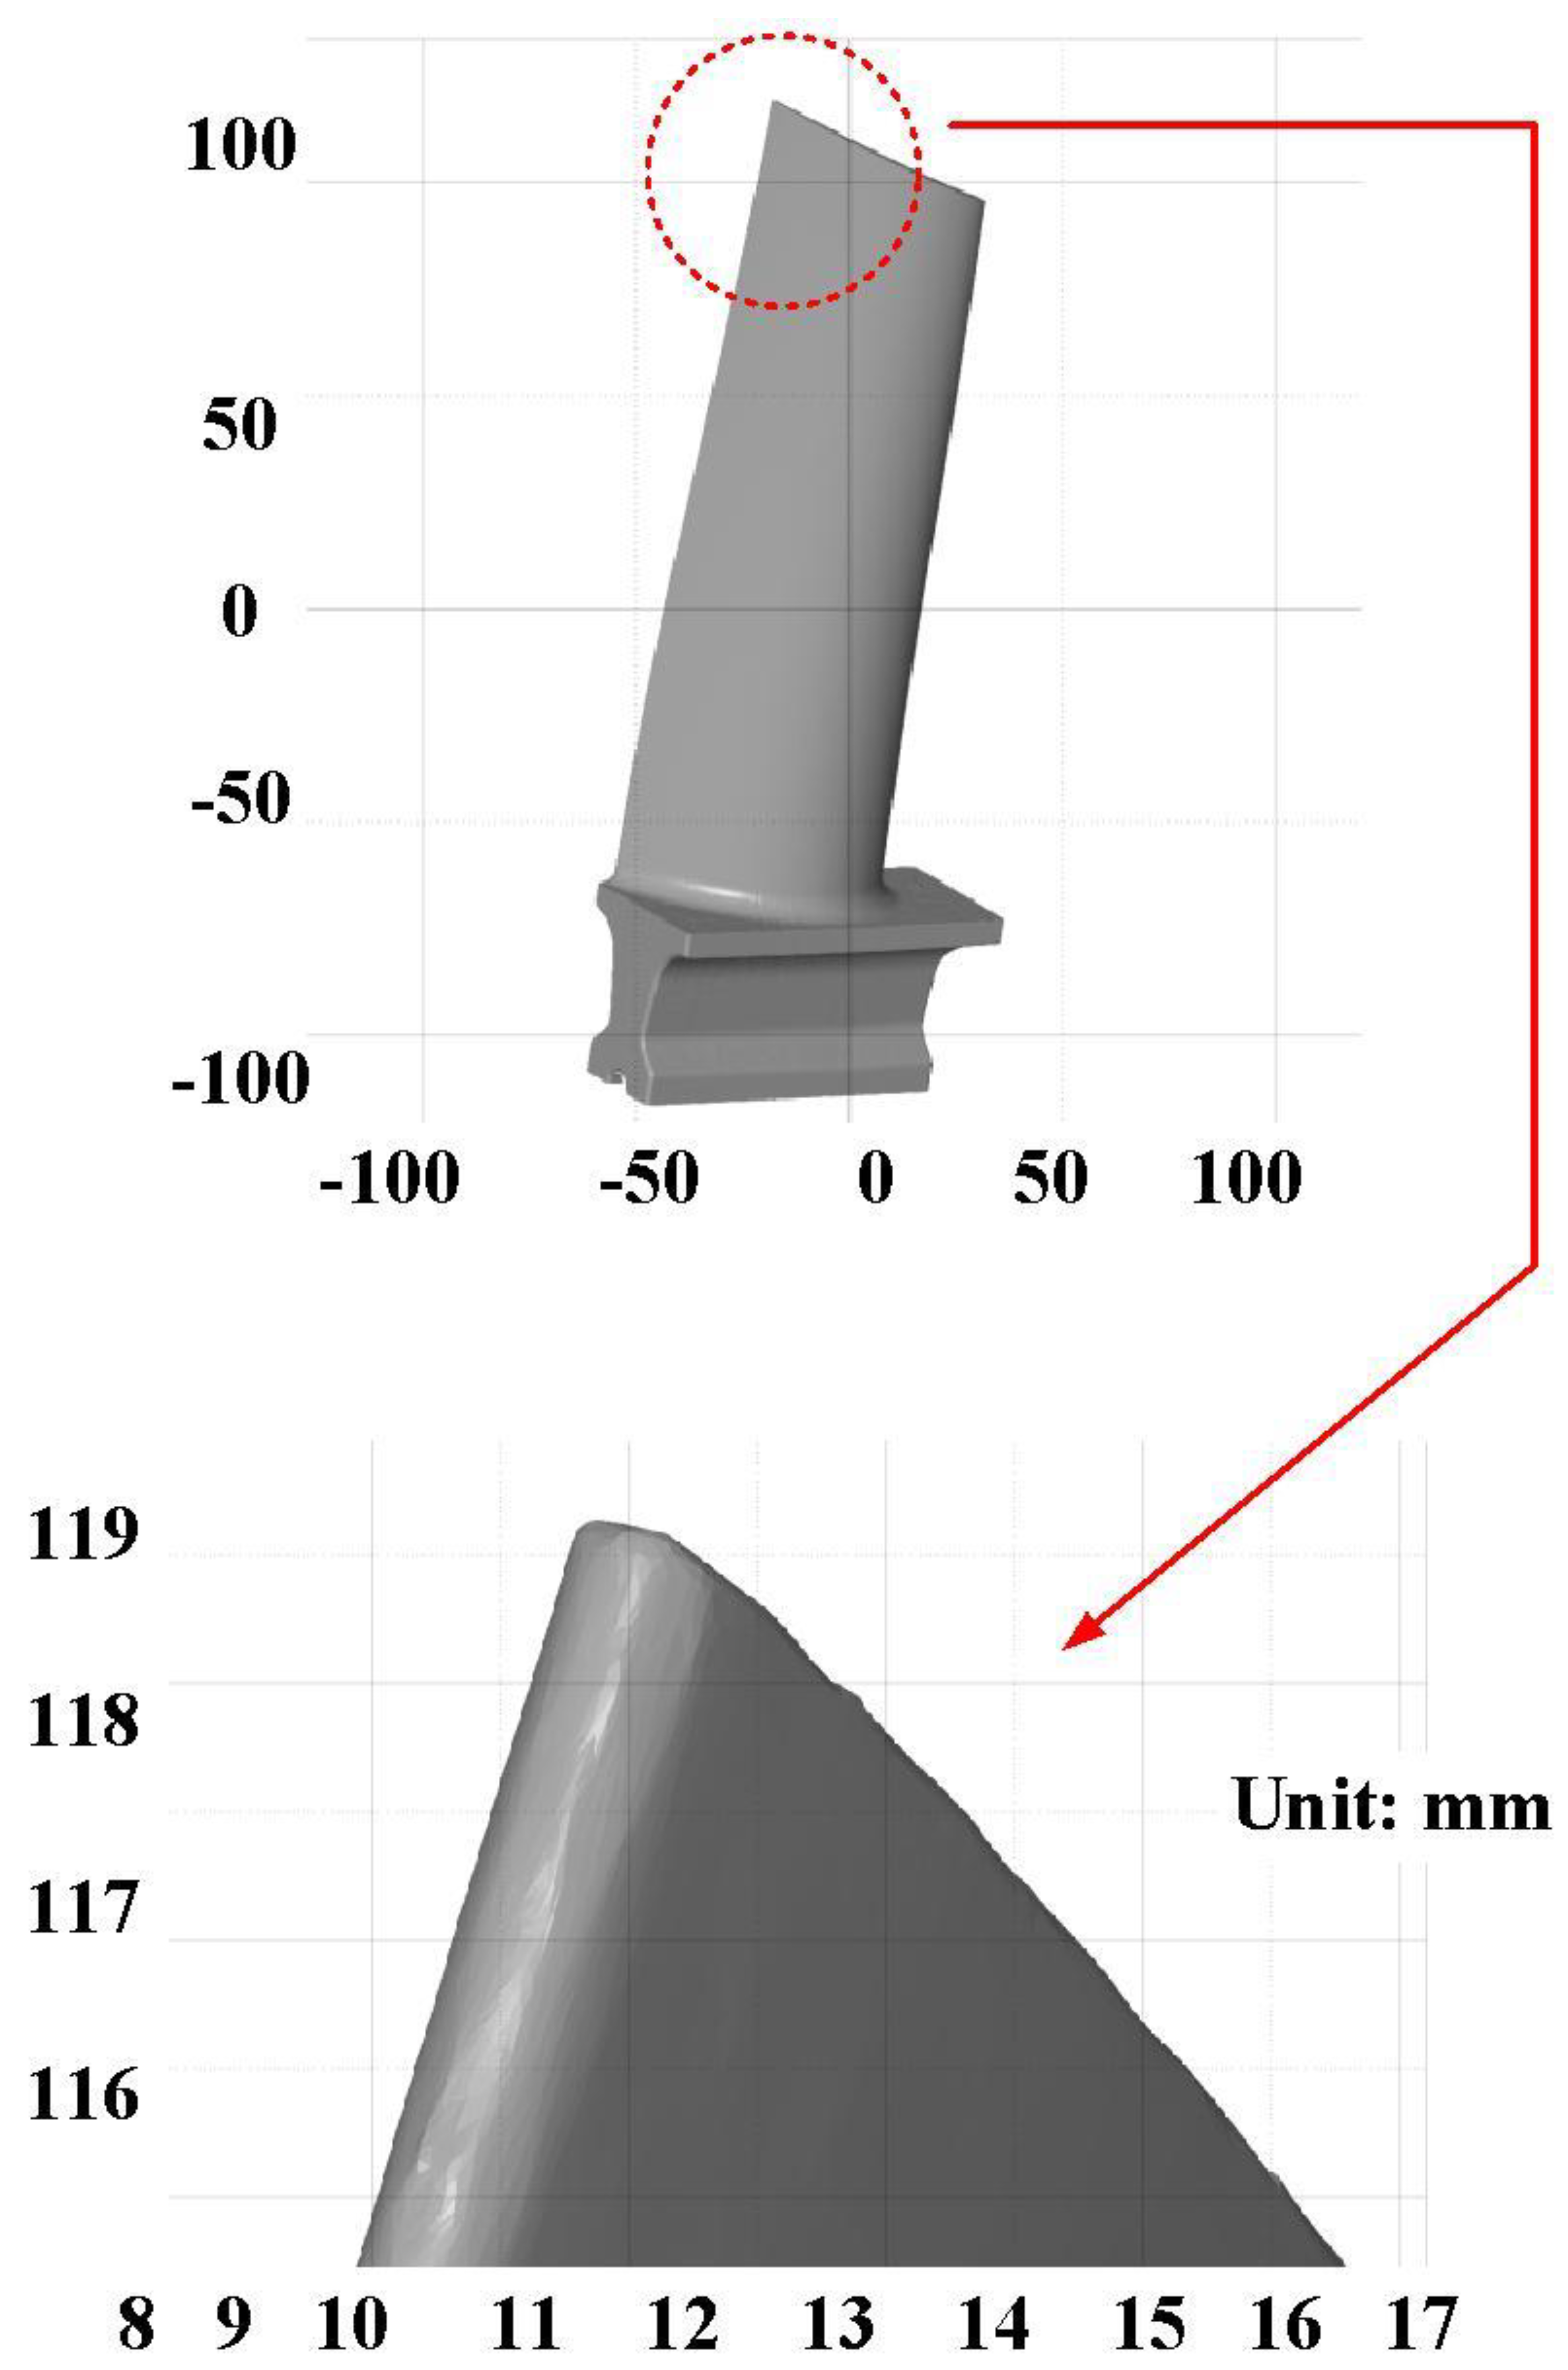
3. Results and Discussion
4. Conclusions
- The remarkable findings in this study are very practical and provide the greatest application potential in the precision machining industry because the precise 3D optical measurements of the object without matte coatings were proven to work.
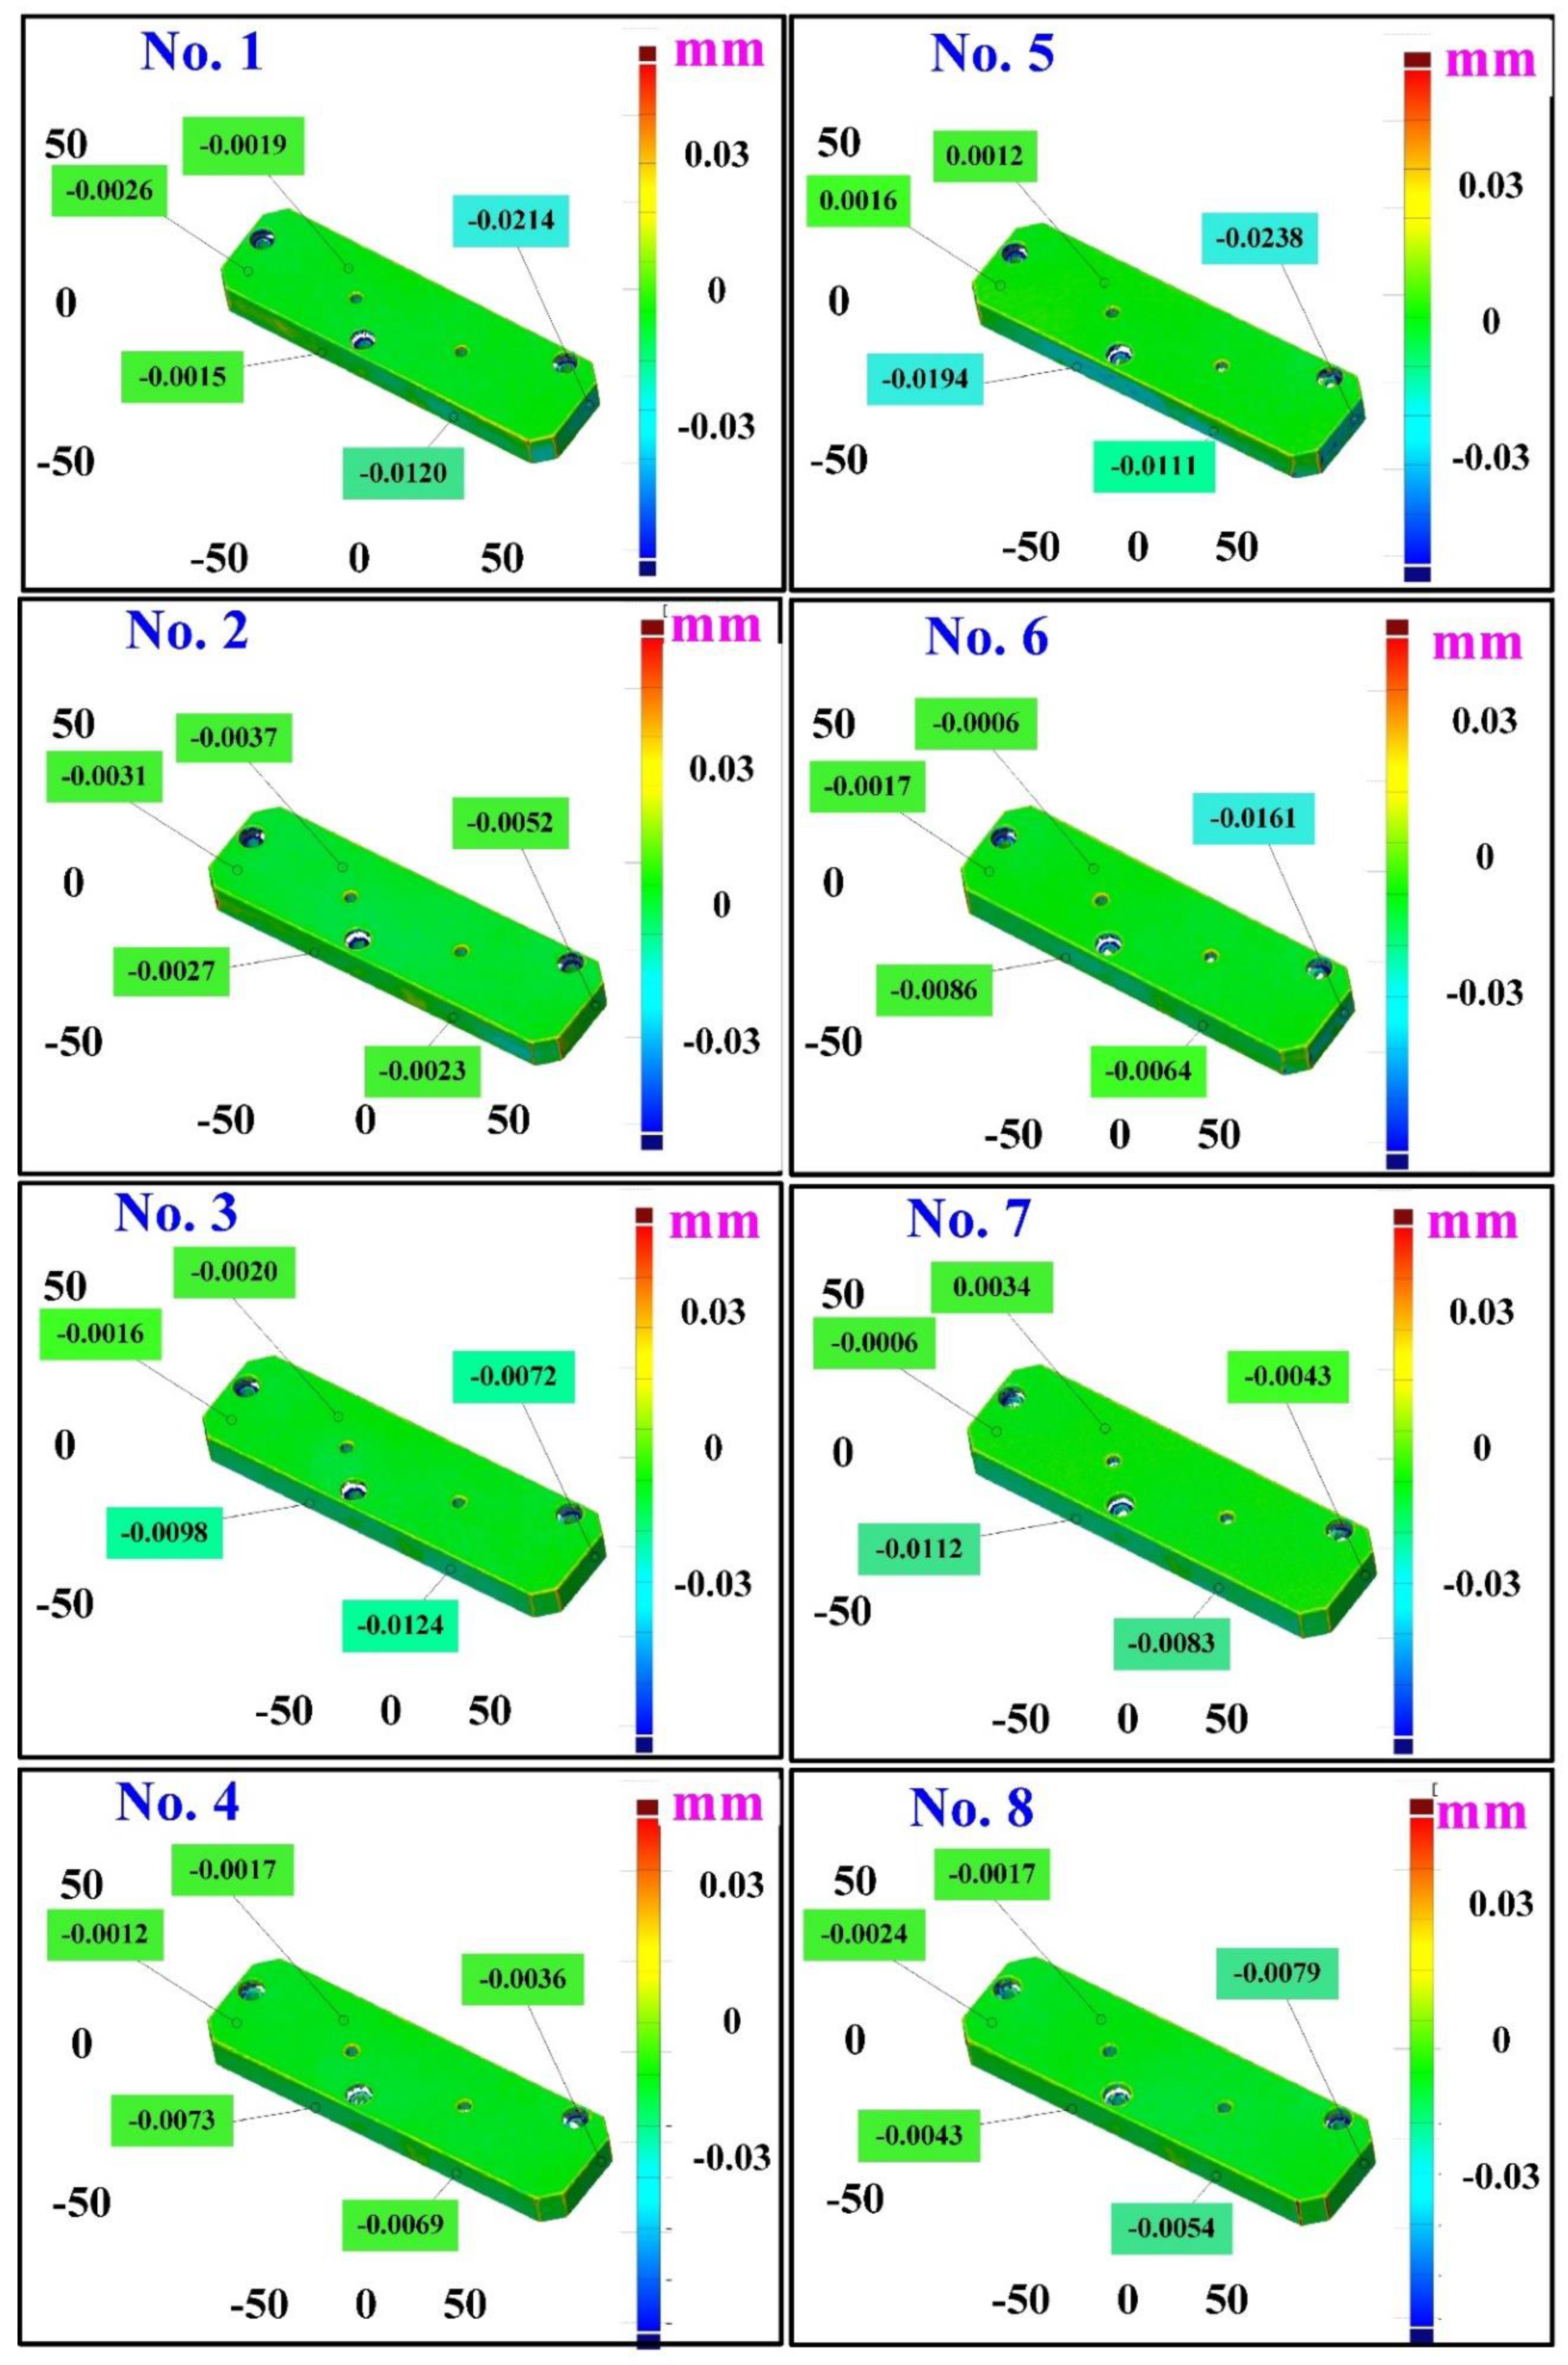
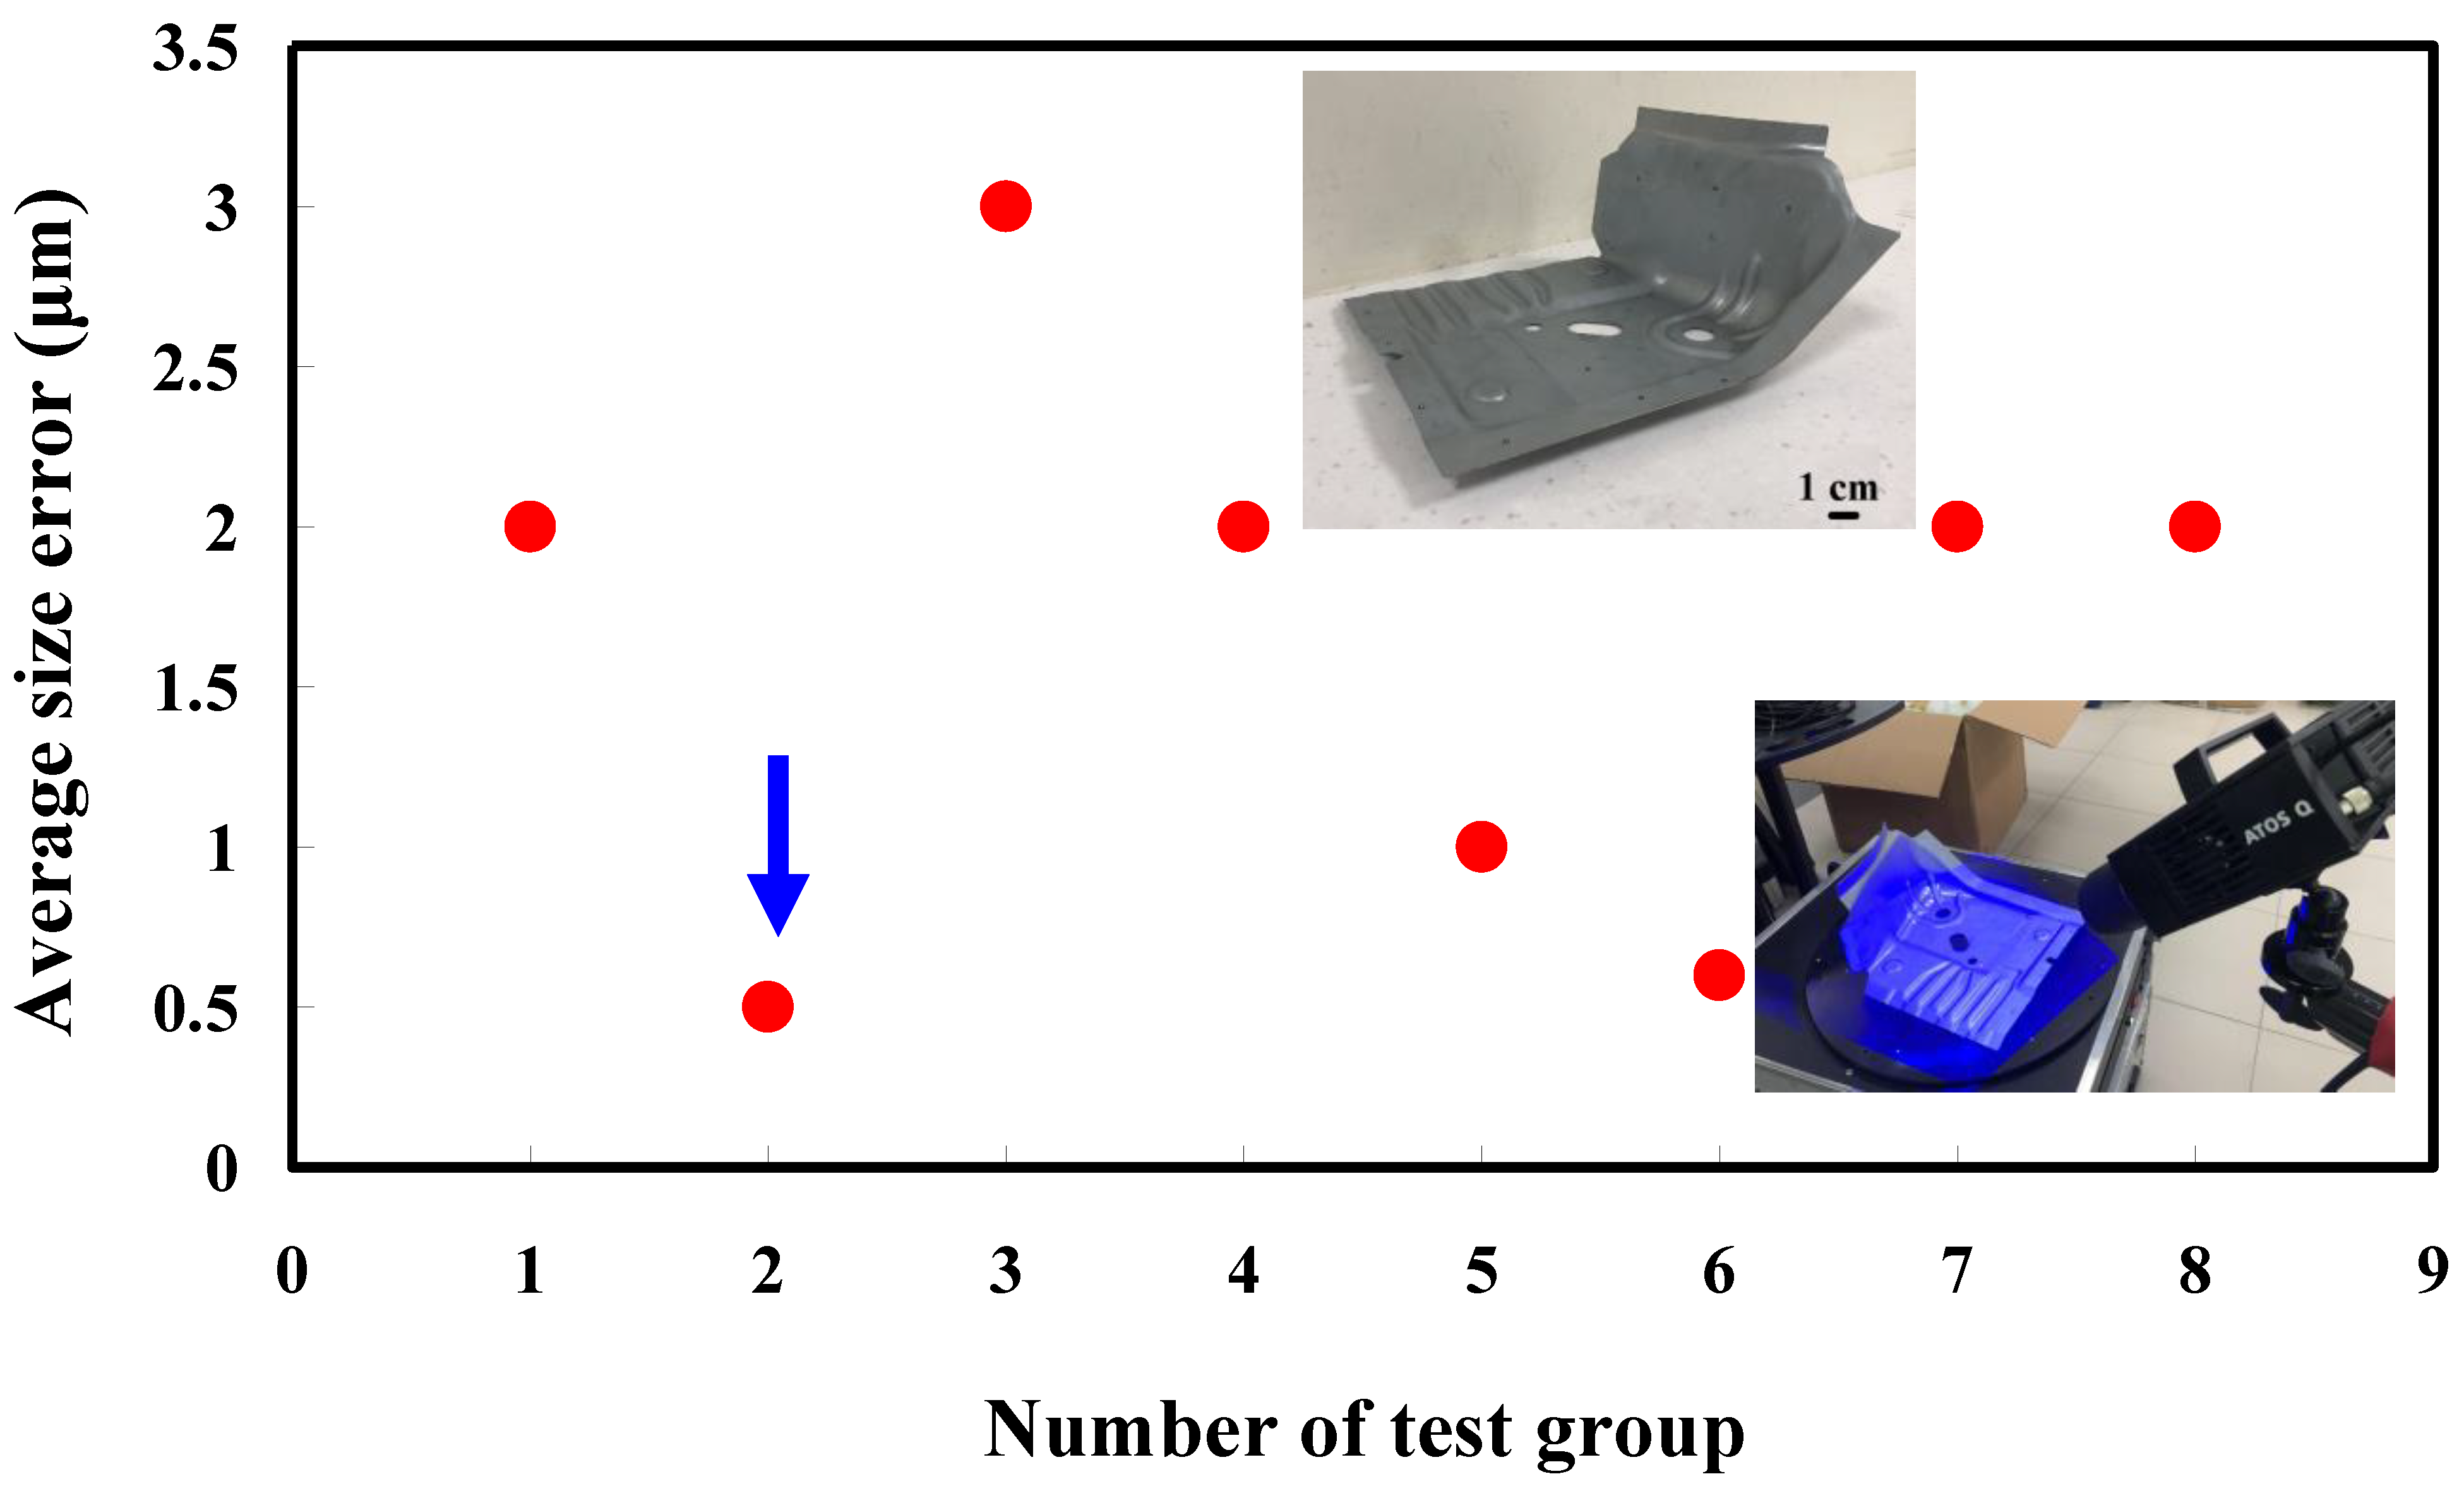
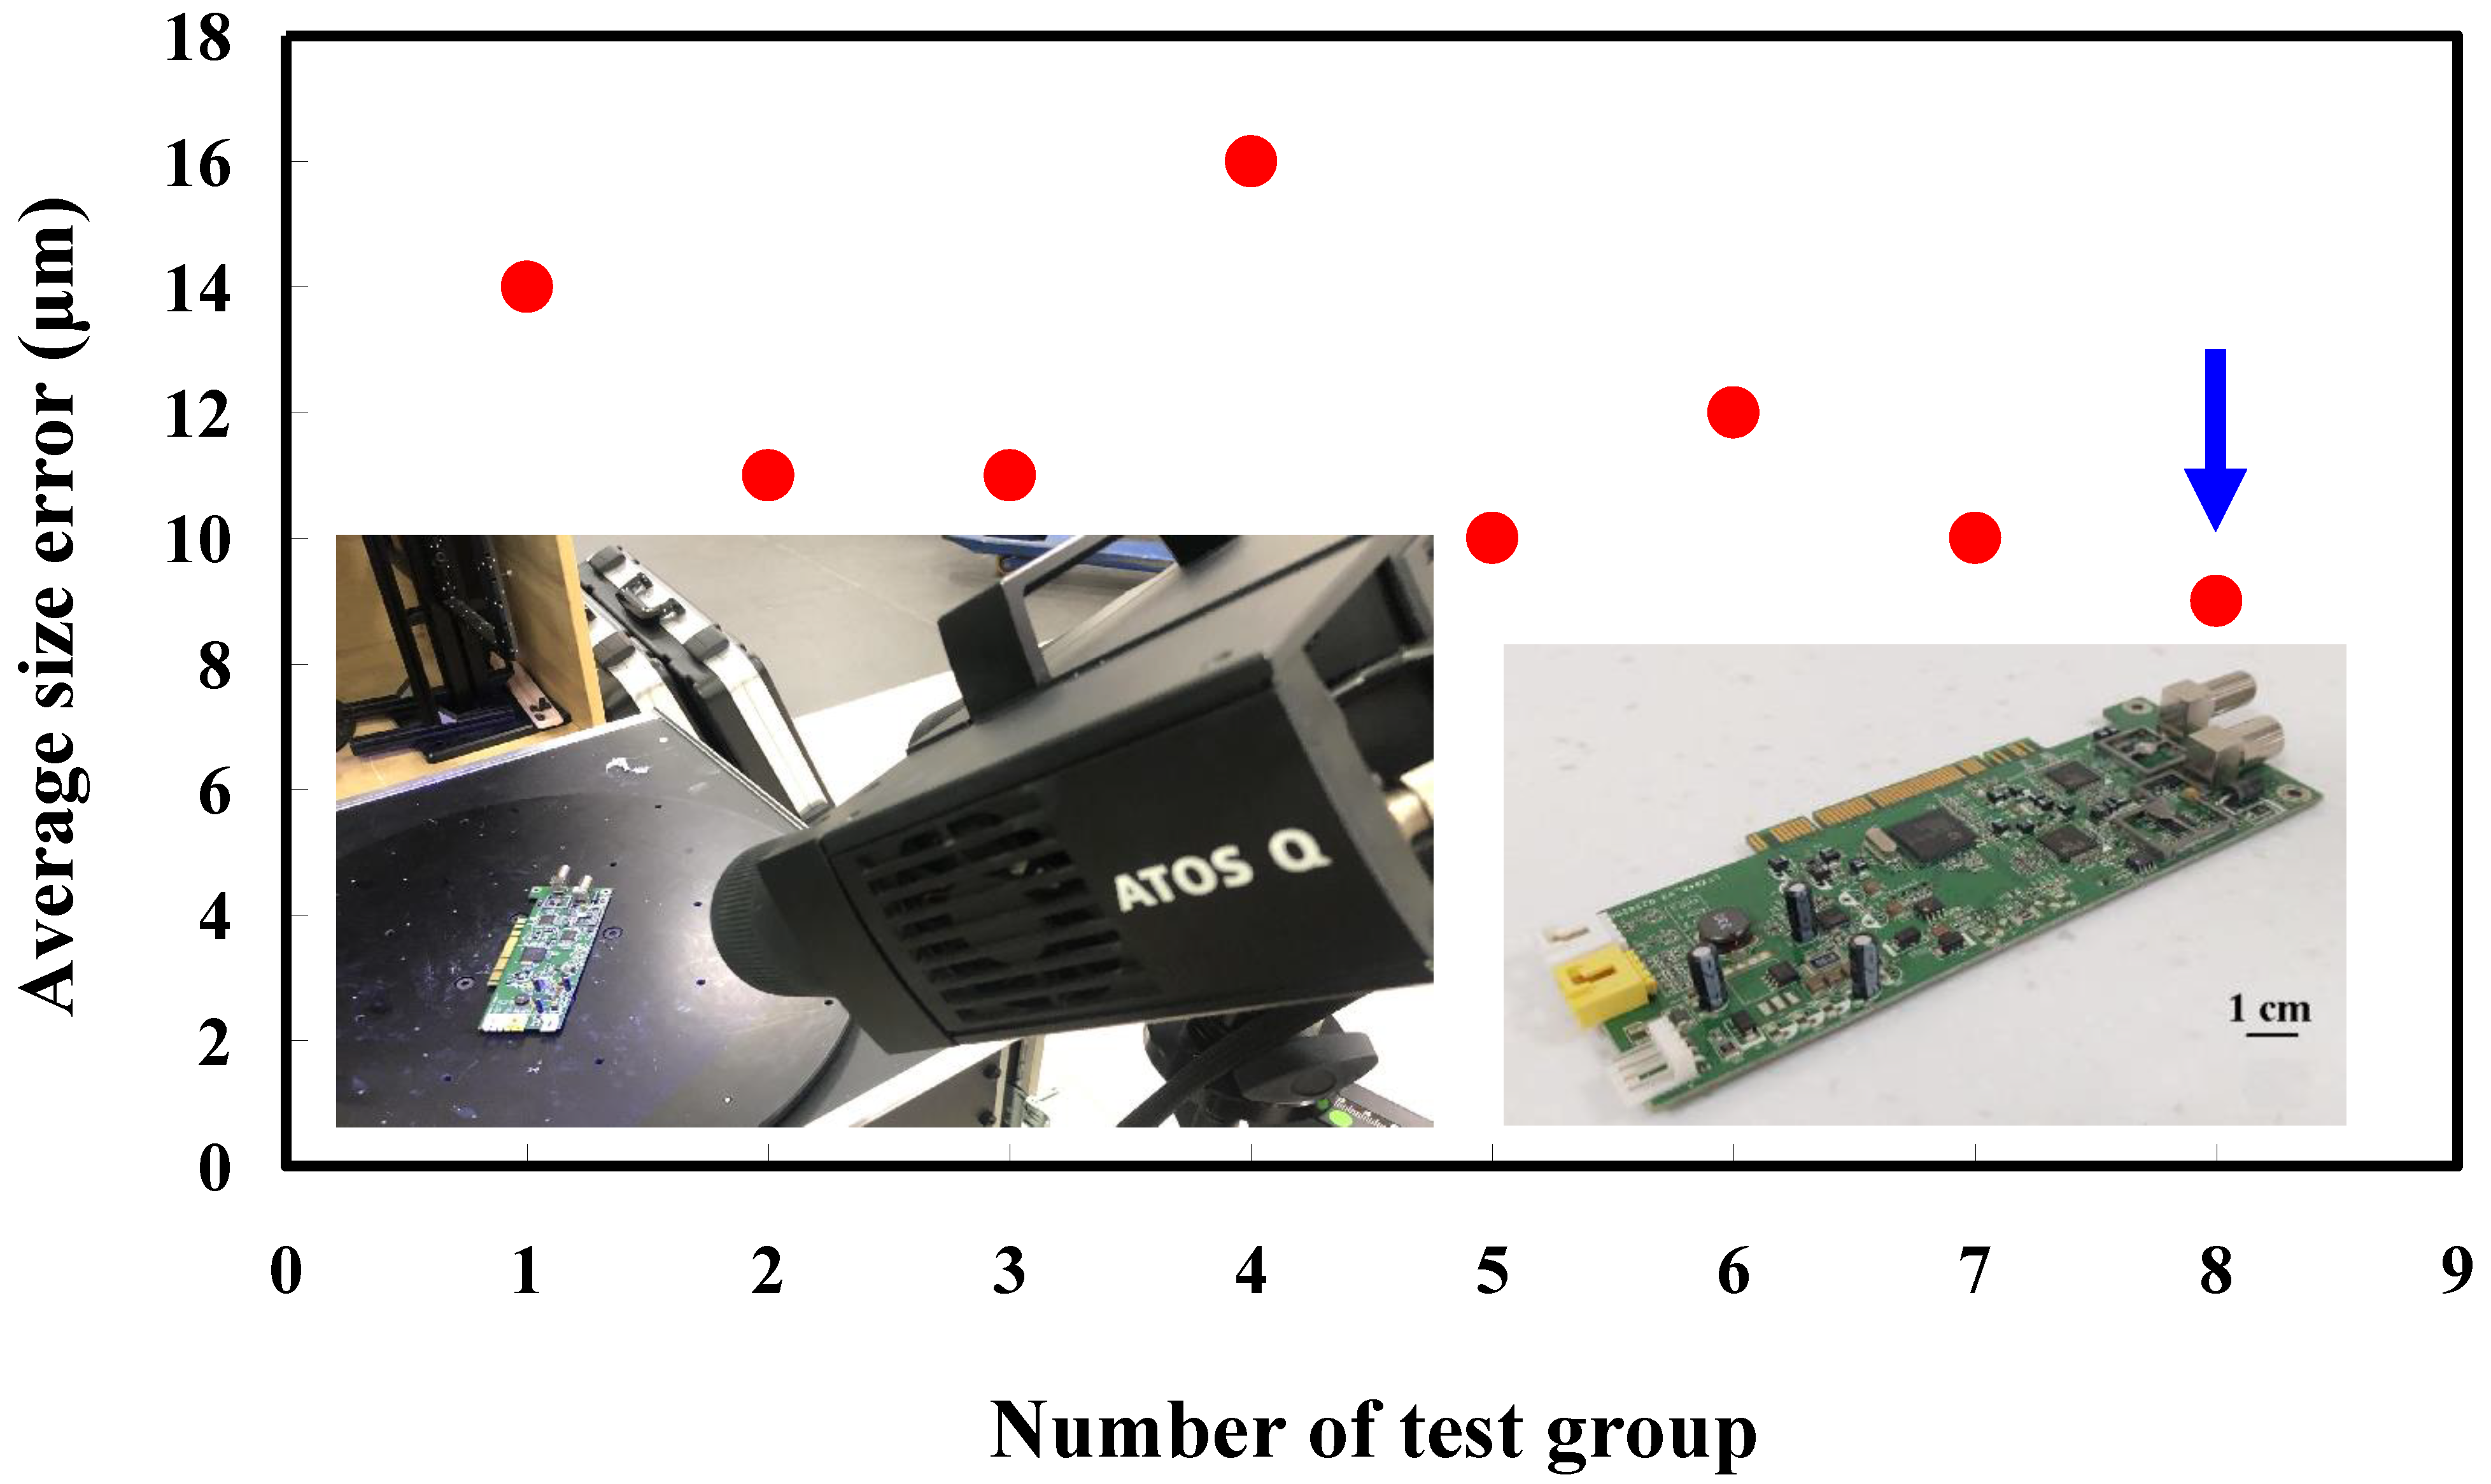
- An empirical technical database for four measurement objects with different surfaces was built. This empirical technical database can serve as an alternative to the conventional 3D optical measurements because both the suggested approach and suggested measurement parameters are shown in Table 3. According to the information in Table 3, precise optical measurements without matte coatings for four similar metal components can be obtained. Average size error of the four different kinds of measurement objects of this characteristic can be controlled at 3 µm, 0.1 µm, 0.5 µm, and 9 µm.
- The proposed environmentally friendly 3D optical verification technology meets the SDGs. Three advantages were obtained, i.e., cost savings in the 3D optical measurements, savings in the post-processing time of the measurement object after 3D optical measurements, and savings in the lead time before optical measurements.
Author Contributions
Funding
Institutional Review Board Statement
Informed Consent Statement
Data Availability Statement
Conflicts of Interest
References
- Kwak, J.B. Completely in situ and non-contact warpage assessment using 3D DIC with virtual patterning method. Int. J. Adv. Manuf. Technol. 2019, 100, 2803–2811. [Google Scholar] [CrossRef]
- Mussatayev, M.; Huang, M.; Beshleyev, S. Thermal influences as an uncertainty contributor of the coordinate measuring machine (CMM). Int. J. Adv. Manuf. Technol. 2020, 111, 537–547. [Google Scholar] [CrossRef]
- Wang, R.; Law, A.C.; Garcia, D.; Yang, S.; Kong, Z. Development of structured light 3D-scanner with high spatial resolution and its applications for additive manufacturing quality assurance. Int. J. Adv. Manuf. Technol. 2021, 117, 845–862. [Google Scholar] [CrossRef]
- Yang, W.; Jung, Y.-G.; Kwak, T.; Kim, S.K.; Lim, H.; Kim, D.-H. Microstructure and Mechanical Properties of an Al–Mg–Si–Zr Alloy Processed by L-PBF and Subsequent Heat Treatments. Materials 2022, 15, 5089. [Google Scholar] [CrossRef]
- Szatkiewicz, T.; Laskowska, D.; Bałasz, B.; Mitura, K. The Influence of the Structure Parameters on the Mechanical Properties of Cylindrically Mapped Gyroid TPMS Fabricated by Selective Laser Melting with 316L Stainless Steel Powder. Materials 2022, 15, 4352. [Google Scholar] [CrossRef] [PubMed]
- Kogo, B.; Xu, C.; Wang, B.; Chizari, M.; Kashyzadeh, K.R.; Ghorbani, S. An Experimental Analysis to Determine the Load-Bearing Capacity of 3D Printed Metals. Materials 2022, 15, 4333. [Google Scholar] [CrossRef]
- Rękas, A.; Kaczmarek, T.; Wieczorowski, M.; Gapiński, B.; Jakubowicz, M.; Grochalski, K.; Kucharski, D.; Marciniak-Podsadna, L. Analysis of Tool Geometry for the Stamping Process of Large-Size Car Body Components Using a 3D Optical Measurement System. Materials 2021, 14, 7608. [Google Scholar] [CrossRef]
- Affatato, S.; Valigi, M.C.; Logozzo, S. Knee Wear Assessment: 3D Scanners Used as a Consolidated Procedure. Materials 2020, 13, 2349. [Google Scholar] [CrossRef]
- Affatato, S.; Valigi, M.C.; Logozzo, S. Wear Distribution Detection of Knee Joint Prostheses by Means of 3D Optical Scanners. Materials 2017, 10, 364. [Google Scholar] [CrossRef]
- Valigi, M.C.; Logozzo, S.; Affatato, S. New Challenges in Tribology: Wear Assessment Using 3D Optical Scanners. Materials 2017, 10, 548. [Google Scholar] [CrossRef]
- Zhao, C.-Y.; Cheung, C.F.; Fu, W.-P. An Investigation of the Cutting Strategy for the Machining of Polar Microstructures Used in Ultra-Precision Machining Optical Precision Measurement. Micromachines 2021, 12, 755. [Google Scholar] [CrossRef] [PubMed]
- Kim, M.-K.; Yoon, S.W. Thermal Impedance Characterization Using Optical Measurement Assisted by Multi-Physics Simulation for Multi-Chip SiC MOSFET Module. Micromachines 2020, 11, 1060. [Google Scholar] [CrossRef] [PubMed]
- Shi, H.; Liu, X.; Lou, Y. Materials and micro drilling of high frequency and high speed printed circuit board: A review. Int. J. Adv. Manuf. Technol. 2019, 100, 827–841. [Google Scholar] [CrossRef]
- Batiuskaite, D.; Bruzaite, I.; Snitka, V.; Ramanavicius, A. Assessment of TiO2 Nanoparticle Impact on Surface Morphology of Chinese Hamster Ovary Cells. Materials 2022, 15, 4570. [Google Scholar] [CrossRef] [PubMed]
- Urbas, U.; Zorko, D.; Vukašinović, N.; Černe, B. Comprehensive Areal Geometric Quality Characterisation of Injection Moulded Thermoplastic Gears. Polymers 2022, 14, 705. [Google Scholar] [CrossRef] [PubMed]
- Favier, L.; Sescu, A.M.; Abdelkader, E.; Berthou, L.O.; Lutic, D. Urea-Assisted Synthesis of Mesoporous TiO2 Photocatalysts for the Efficient Removal of Clofibric Acid from Water. Materials 2021, 14, 6035. [Google Scholar] [CrossRef]
- Mukhtarkhanov, M.; Perveen, A.; Talamona, D. Application of Stereolithography Based 3D Printing Technology in Investment Casting. Micromachines 2020, 11, 946. [Google Scholar] [CrossRef]
- Lin, M.-J. Micro Aspheric Convex Lenses Fabricated by Precise Scraping. Micromachines 2022, 13, 778. [Google Scholar] [CrossRef]
- Castanhera, I.D.C.; Diniz, A.E.; Button, S.T. Effects of plasma nitriding and nitrocarburizing thermochemical treatments and surface texture on surface damage evolution of hot stamping punches. Int. J. Adv. Manuf. Technol. 2021, 112, 2341–2358. [Google Scholar] [CrossRef]
- Sun, M.; Bao, T.; Xie, D.; Lv, H.; Si, G. Towards Application-Driven Task Offloading in Edge Computing Based on Deep Reinforcement Learning. Micromachines 2021, 12, 1011. [Google Scholar] [CrossRef]
- Liu, Y.; Deng, J. Machining process modeling of green alumina ceramics in orthogonal cutting and fragmentation process. Int. J. Adv. Manuf. Technol. 2021, 113, 1009–1027. [Google Scholar] [CrossRef]
- Kuo, C.-C.; You, Z.-Y.; Chang, S.-J.; Liao, J.-D.; Yu, S.-T.; Zeng, R.-T. Development of green conformal cooling channels for rapid tooling. Int. J. Adv. Manuf. Technol. 2020, 111, 109–125. [Google Scholar] [CrossRef]
- Yu, H.; Lyu, Y.; Wang, J. Green manufacturing with a bionic surface structured grinding wheel-specific energy analysis. Int. J. Adv. Manuf. Technol. 2019, 104, 2999–3005. [Google Scholar] [CrossRef]
- Kumar, L.; Jain, P.K.; Sharma, A.K. A fuzzy goal programme–based sustainable Greenfield supply network design for tyre retreading industry. Int. J. Adv. Manuf. Technol. 2020, 108, 2855–2880. [Google Scholar] [CrossRef]
- Lluch-Cerezo, J.; Meseguer, M.D.; García-Manrique, J.A.; Benavente, R. Influence of Thermal Annealing Temperatures on Powder Mould Effectiveness to Avoid Deformations in ABS and PLA 3D-Printed Parts. Polymers 2022, 14, 2607. [Google Scholar] [CrossRef]
- Tambrallimath, V.; Keshavamurthy, R.; Bavan, S.D.; Patil, A.Y.; Khan, T.M.Y.; Badruddin, I.A.; Kamangar, S. Mechanical Properties of PC-ABS-Based Graphene-Reinforced Polymer Nanocomposites Fabricated by FDM Process. Polymers 2021, 13, 2951. [Google Scholar] [CrossRef] [PubMed]
- Lin, W.-C.; Fan, F.-Y.; Huang, C.-F.; Shen, Y.-K.; Wang, H. Analysis of the Warpage Phenomenon of Micro-Sized Parts with Precision Injection Molding by Experiment, Numerical Simulation, and Grey Theory. Polymers 2022, 14, 1845. [Google Scholar] [CrossRef]
- Ratautas, K.; Vosylius, V.; Jagminienė, A.; Stankevičienė, I.; Norkus, E.; Račiukaitis, G. Laser-Induced Selective Electroless Plating on PC/ABS Polymer: Minimisation of Thermal Effects for Supreme Processing Speed. Polymers 2020, 12, 2427. [Google Scholar] [CrossRef]
- Verma, P.; Ubaid, J.; Schiffer, A.; Jain, A.; Martínez-Pañeda, E.; Kumar, S. Essential work of fracture assessment of acrylonitrile butadiene styrene (ABS) processed via fused filament fabrication additive manufacturing. Int. J. Adv. Manuf. Technol. 2021, 113, 771–784. [Google Scholar] [CrossRef]
- Zhao, N.-Y.; Lian, J.-Y.; Wang, P.-F.; Xu, Z.-B. Recent progress in minimizing the warpage and shrinkage deformations by the optimization of process parameters in plastic injection molding: A review. Int. J. Adv. Manuf. Technol. 2022, 120, 85–101. [Google Scholar] [CrossRef]
- Hsieh, Y.-C.; Doan, M.H. Research on both the radiation heating and the cooling system inside the stretch blow molding machine CPSB-LSS12. Int. J. Adv. Manuf. Technol. 2018, 98, 2357–2364. [Google Scholar] [CrossRef]
- Basir, A.; Sulong, A.B.; Jamadon, N.H.; Muhamad, N. Sintering Behavior of Bi-Material Micro-Component of 17-4PH Stainless Steel and Yttria-Stabilized Zirconia Produced by Two-Component Micro-Powder Injection Molding Process. Materials 2022, 15, 2059. [Google Scholar] [CrossRef] [PubMed]
- Waalkes, L.; Längerich, J.; Imgrund, P.; Emmelmann, C. Piston-Based Material Extrusion of Ti-6Al-4V Feedstock for Complementary Use in Metal Injection Molding. Materials 2022, 15, 351. [Google Scholar] [CrossRef] [PubMed]
- Liu, L.; Han, X.; Li, M.; Zhang, D. Influence of Mineralogical Structure of Mold Flux Film on Heat Transfer in Mold during Continuous Casting of Peritectic Steel. Materials 2022, 15, 2980. [Google Scholar] [CrossRef] [PubMed]
- Samal, S.; Kosjakova, O.; Vokoun, D.; Stachiv, I. Shape Memory Behaviour of PMMA-Coated NiTi Alloy under Thermal Cycle. Polymers 2022, 14, 2932. [Google Scholar] [CrossRef]
- Xu, C.; Peng, X.; Liu, J.; Hu, H.; Lai, T.; Yang, Q.; Xiong, Y. A High Efficiency and Precision Smoothing Polishing Method for NiP Coating of Metal Mirror. Micromachines 2022, 13, 1171. [Google Scholar] [CrossRef]
- Yazıcı, N.; Kodal, M.; Özkoç, G. Lab-Scale Twin-Screw Micro-Compounders as a New Rubber-Mixing Tool: ‘A Comparison on EPDM/Carbon Black and EPDM/Silica Composites’. Polymers 2021, 13, 4391. [Google Scholar] [CrossRef]
- Dar, J.; Ravimal, D.; Lee, C.; Lee, S.-K. Field surface roughness levelling of the lapping metal surface using specular white light. Int. J. Adv. Manuf. Technol. 2022, 119, 2895–2909. [Google Scholar] [CrossRef]


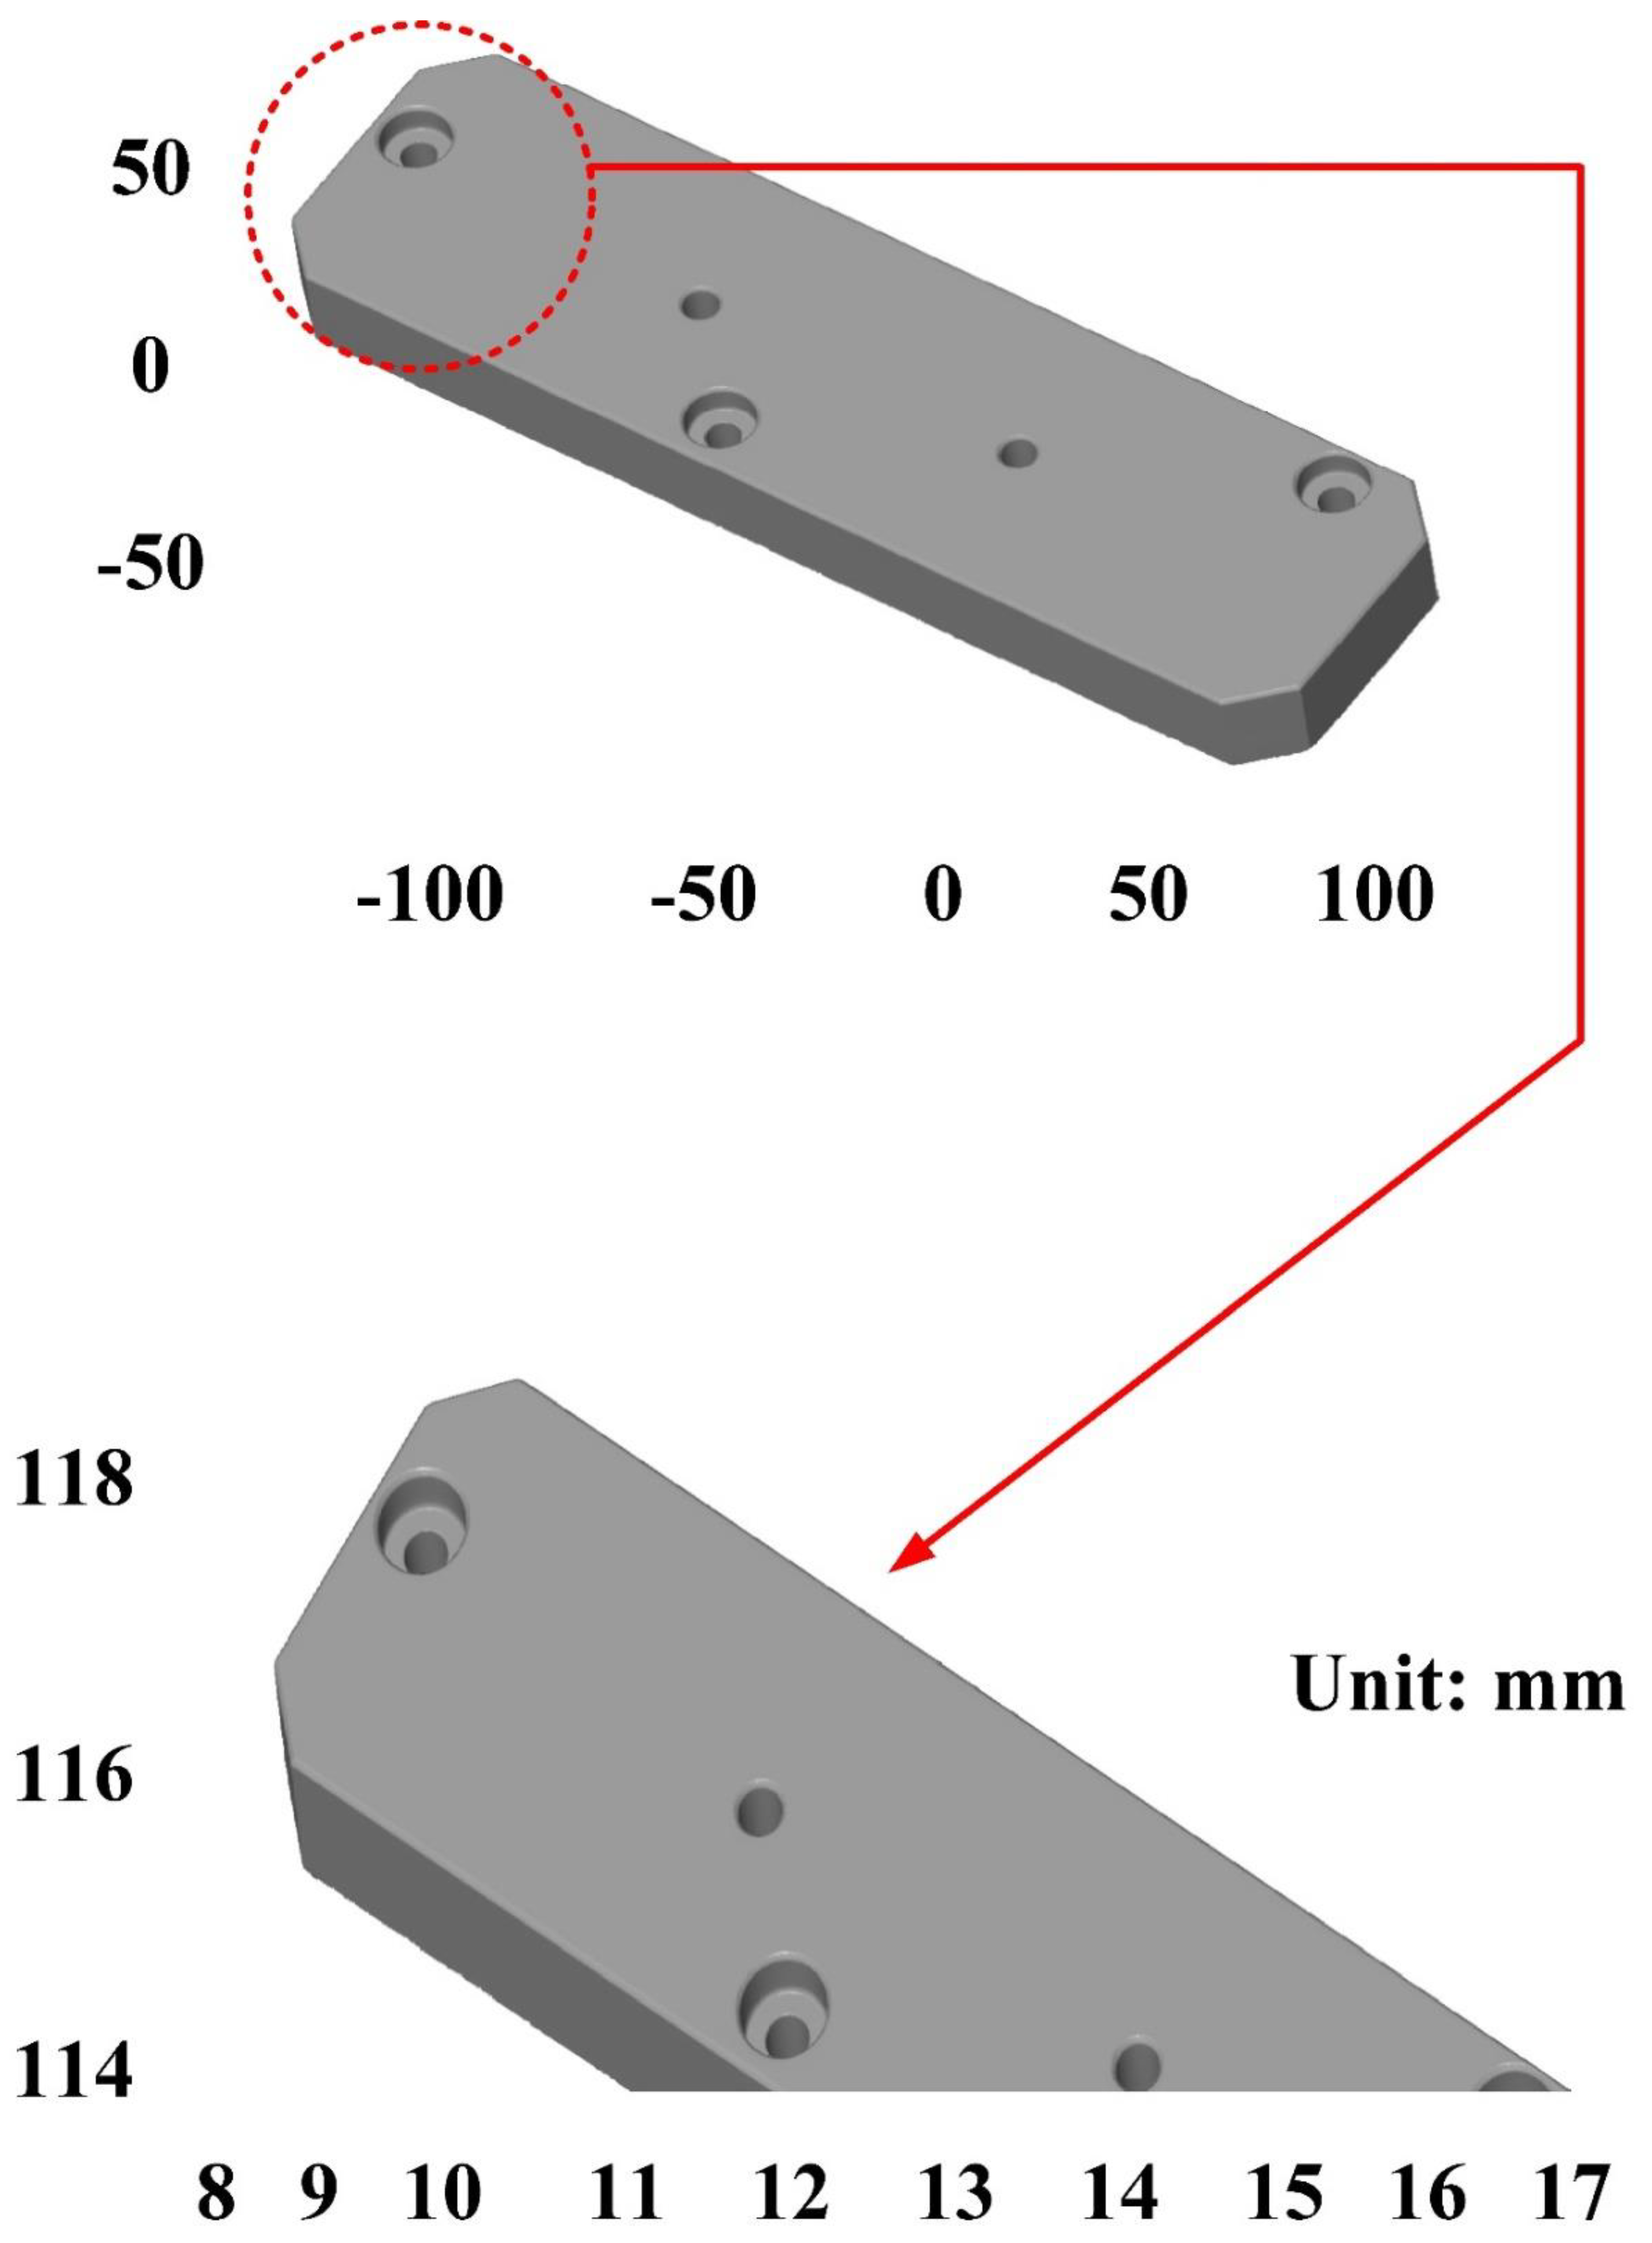
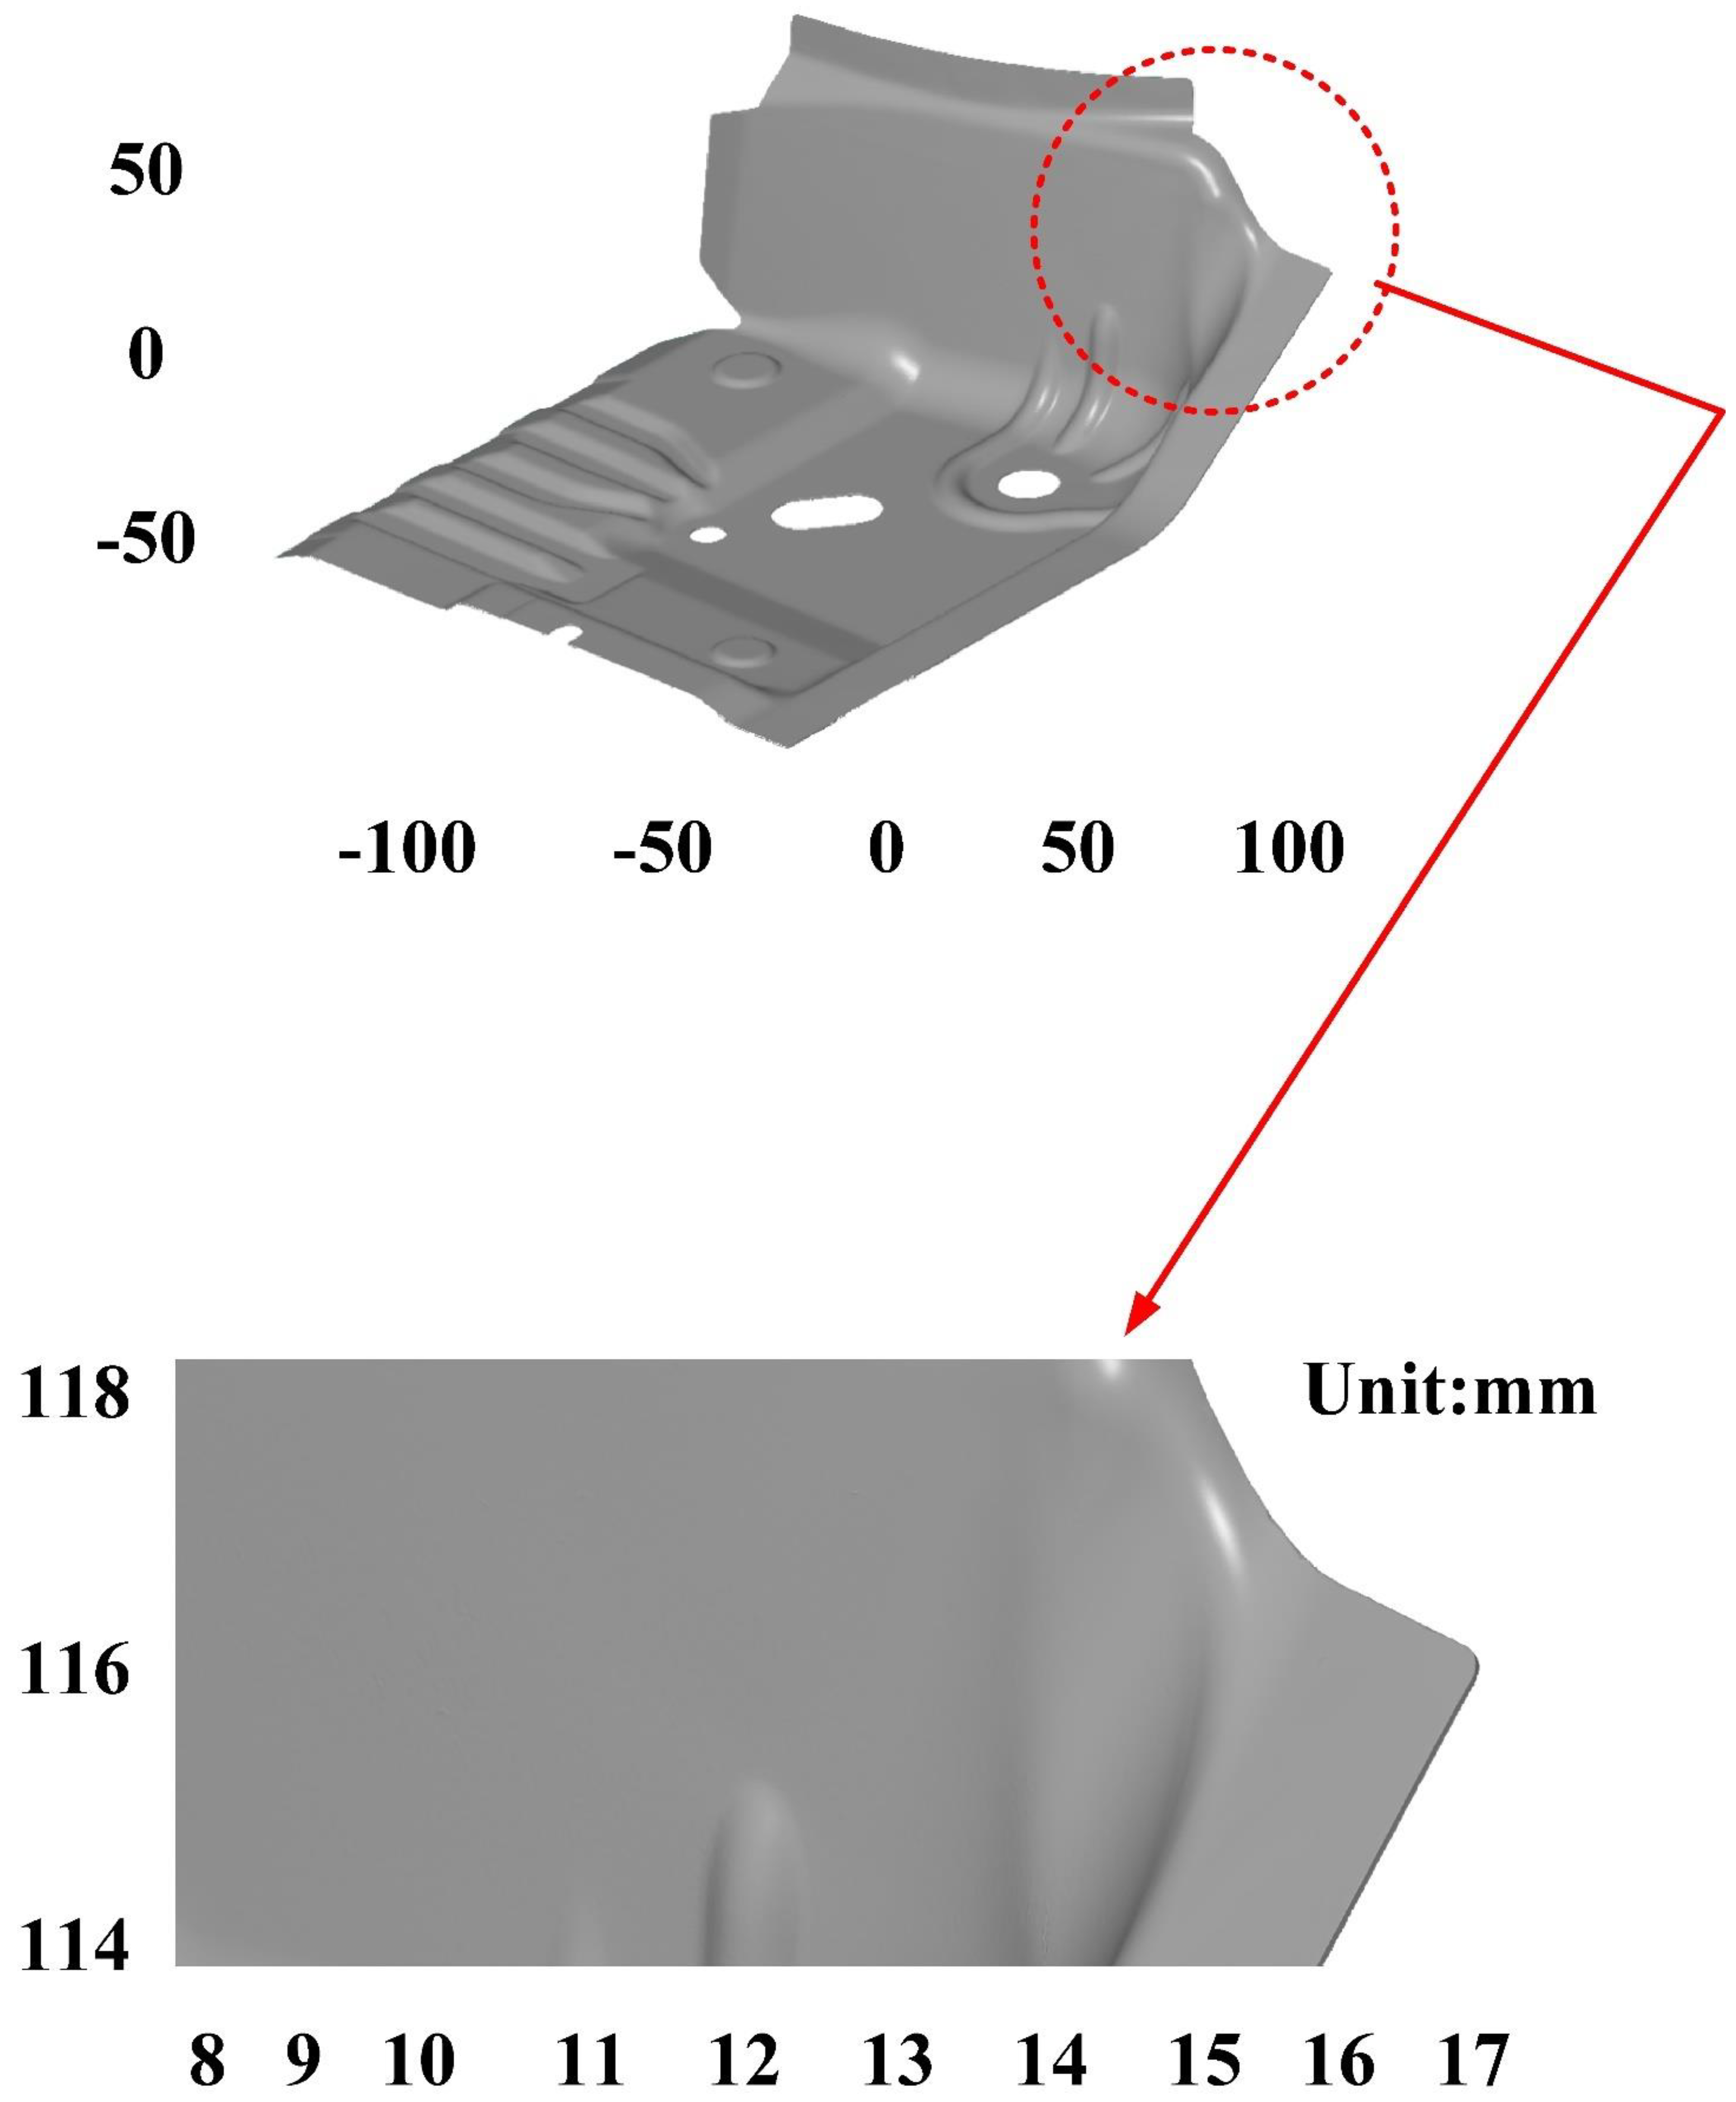
| No. | Measurement Objects | Surface Property |
|---|---|---|
| 1 | As-cast turbine blade | Rough surface |
| 2 | Cast part after CNC machining | Glossy surface |
| 3 | Sheet metal | Glossy surface |
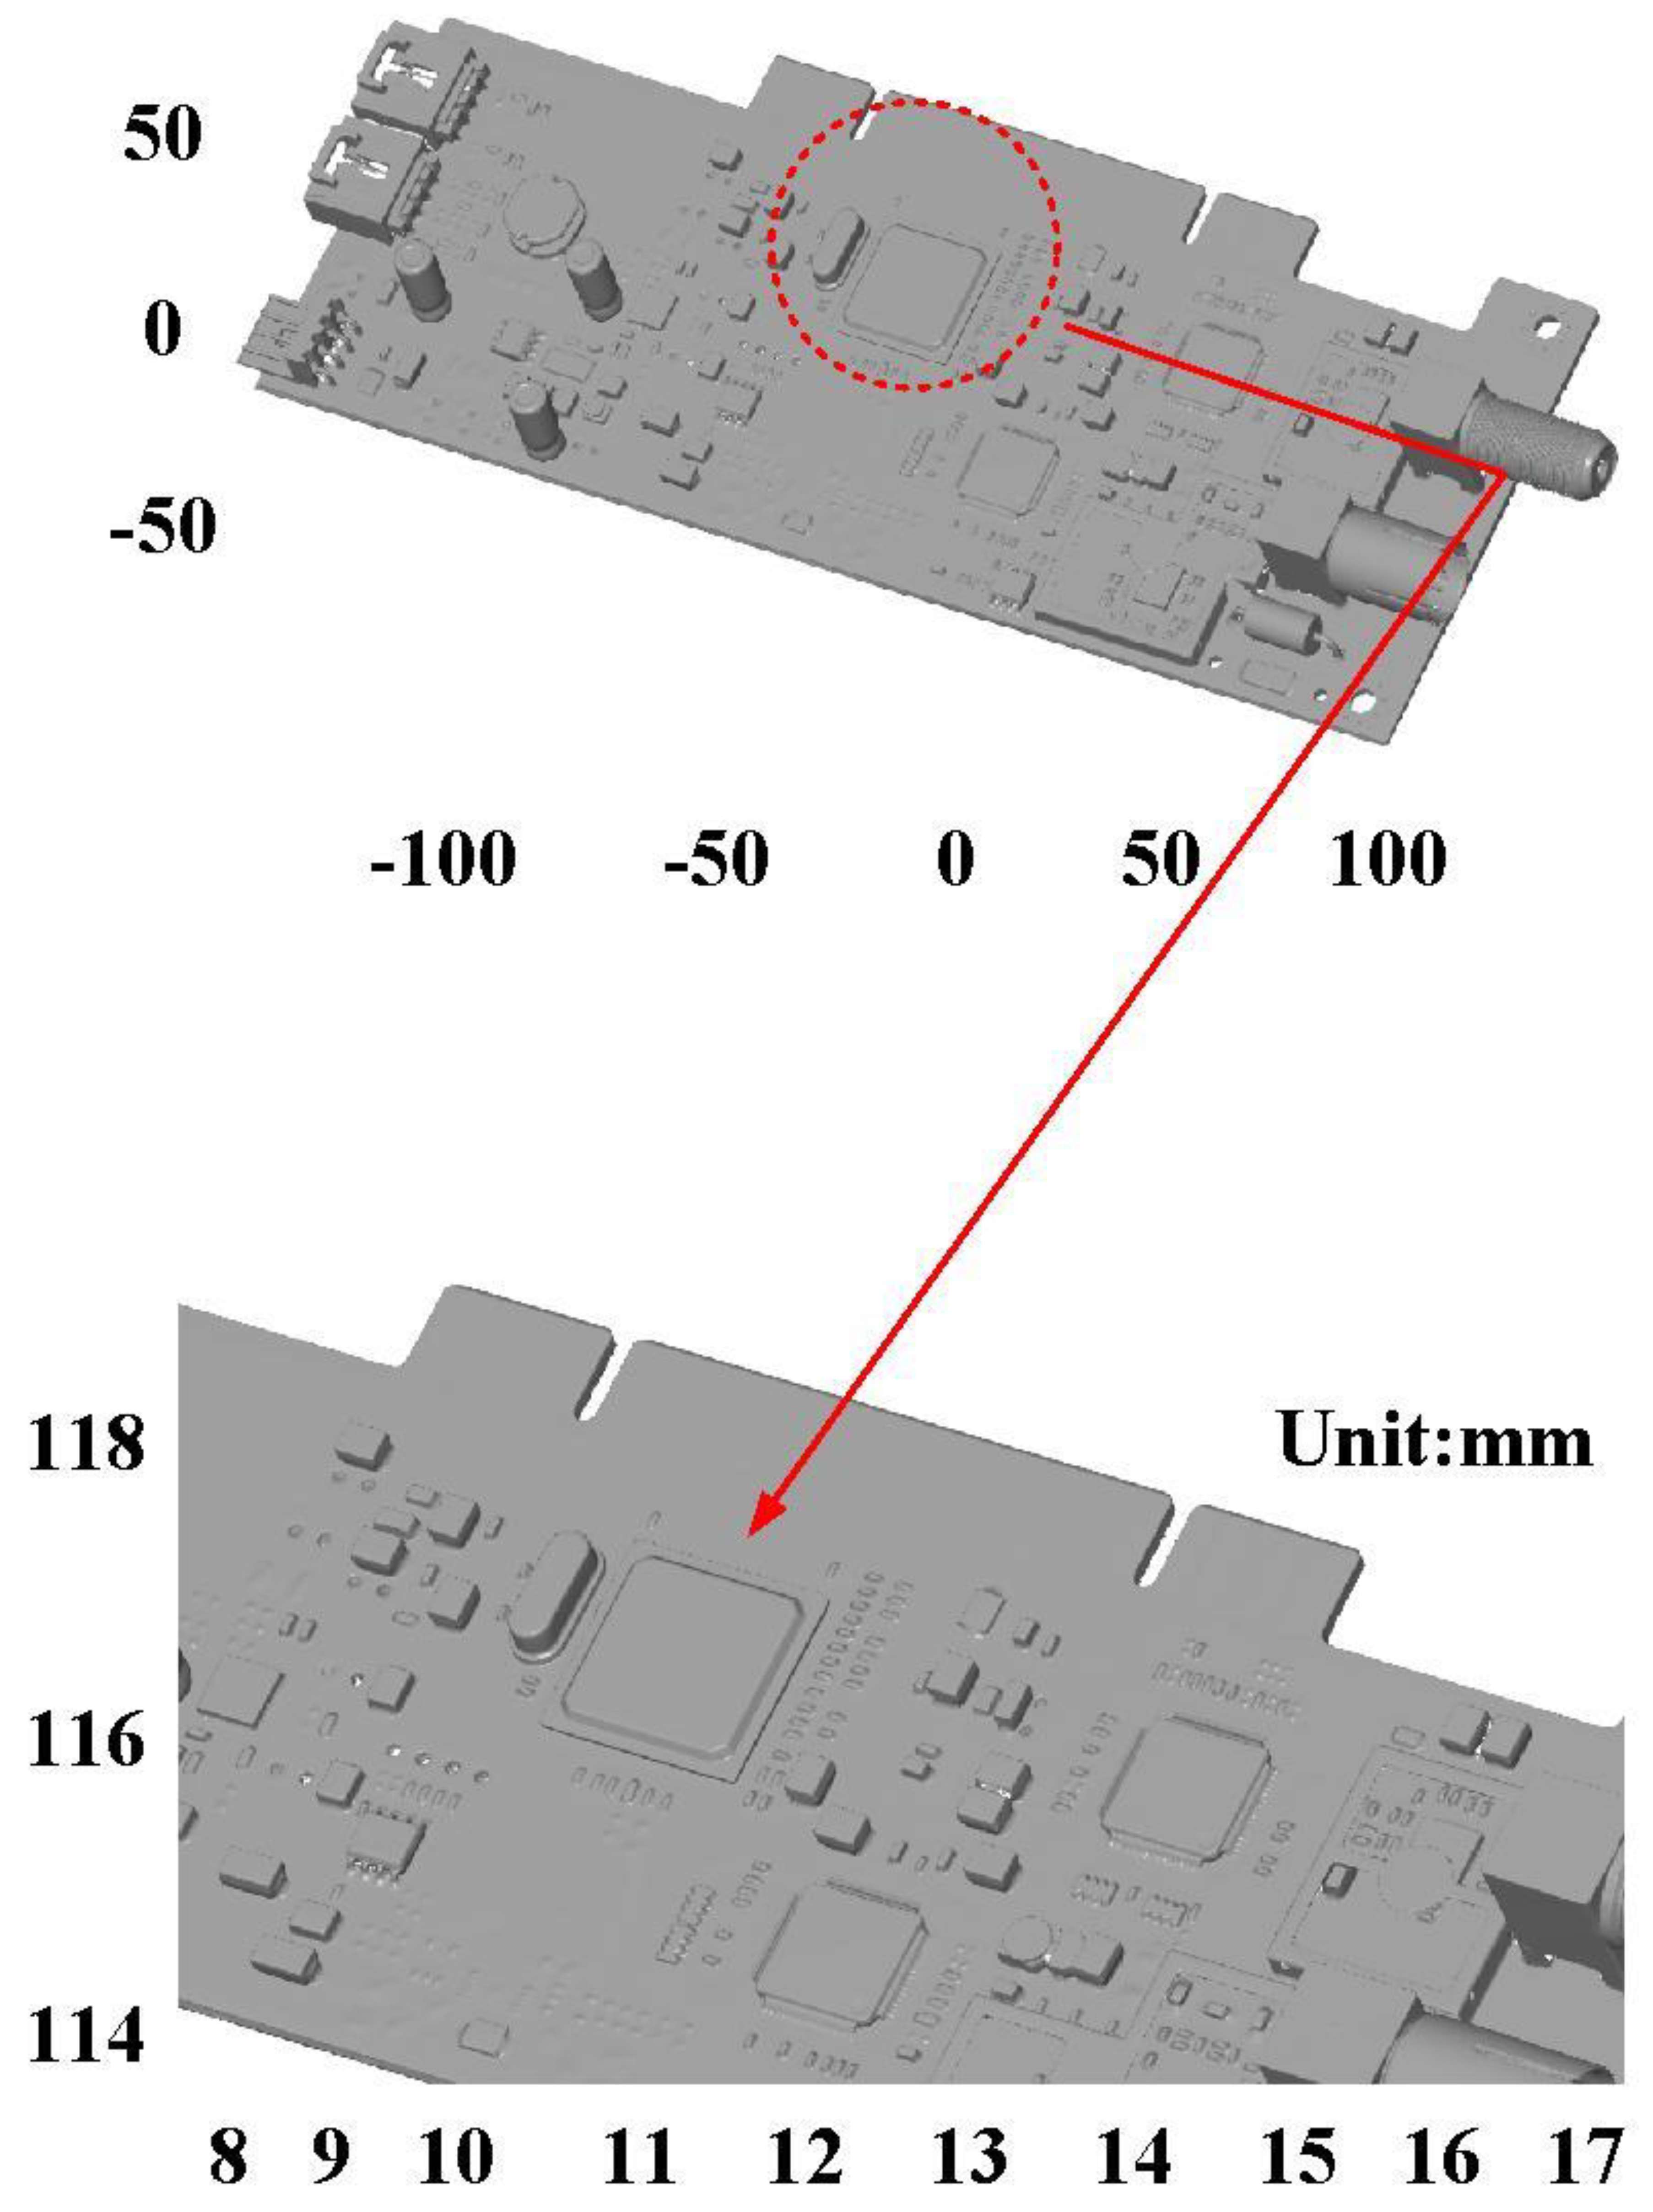
| 4 | Circuit board | Uneven surface |
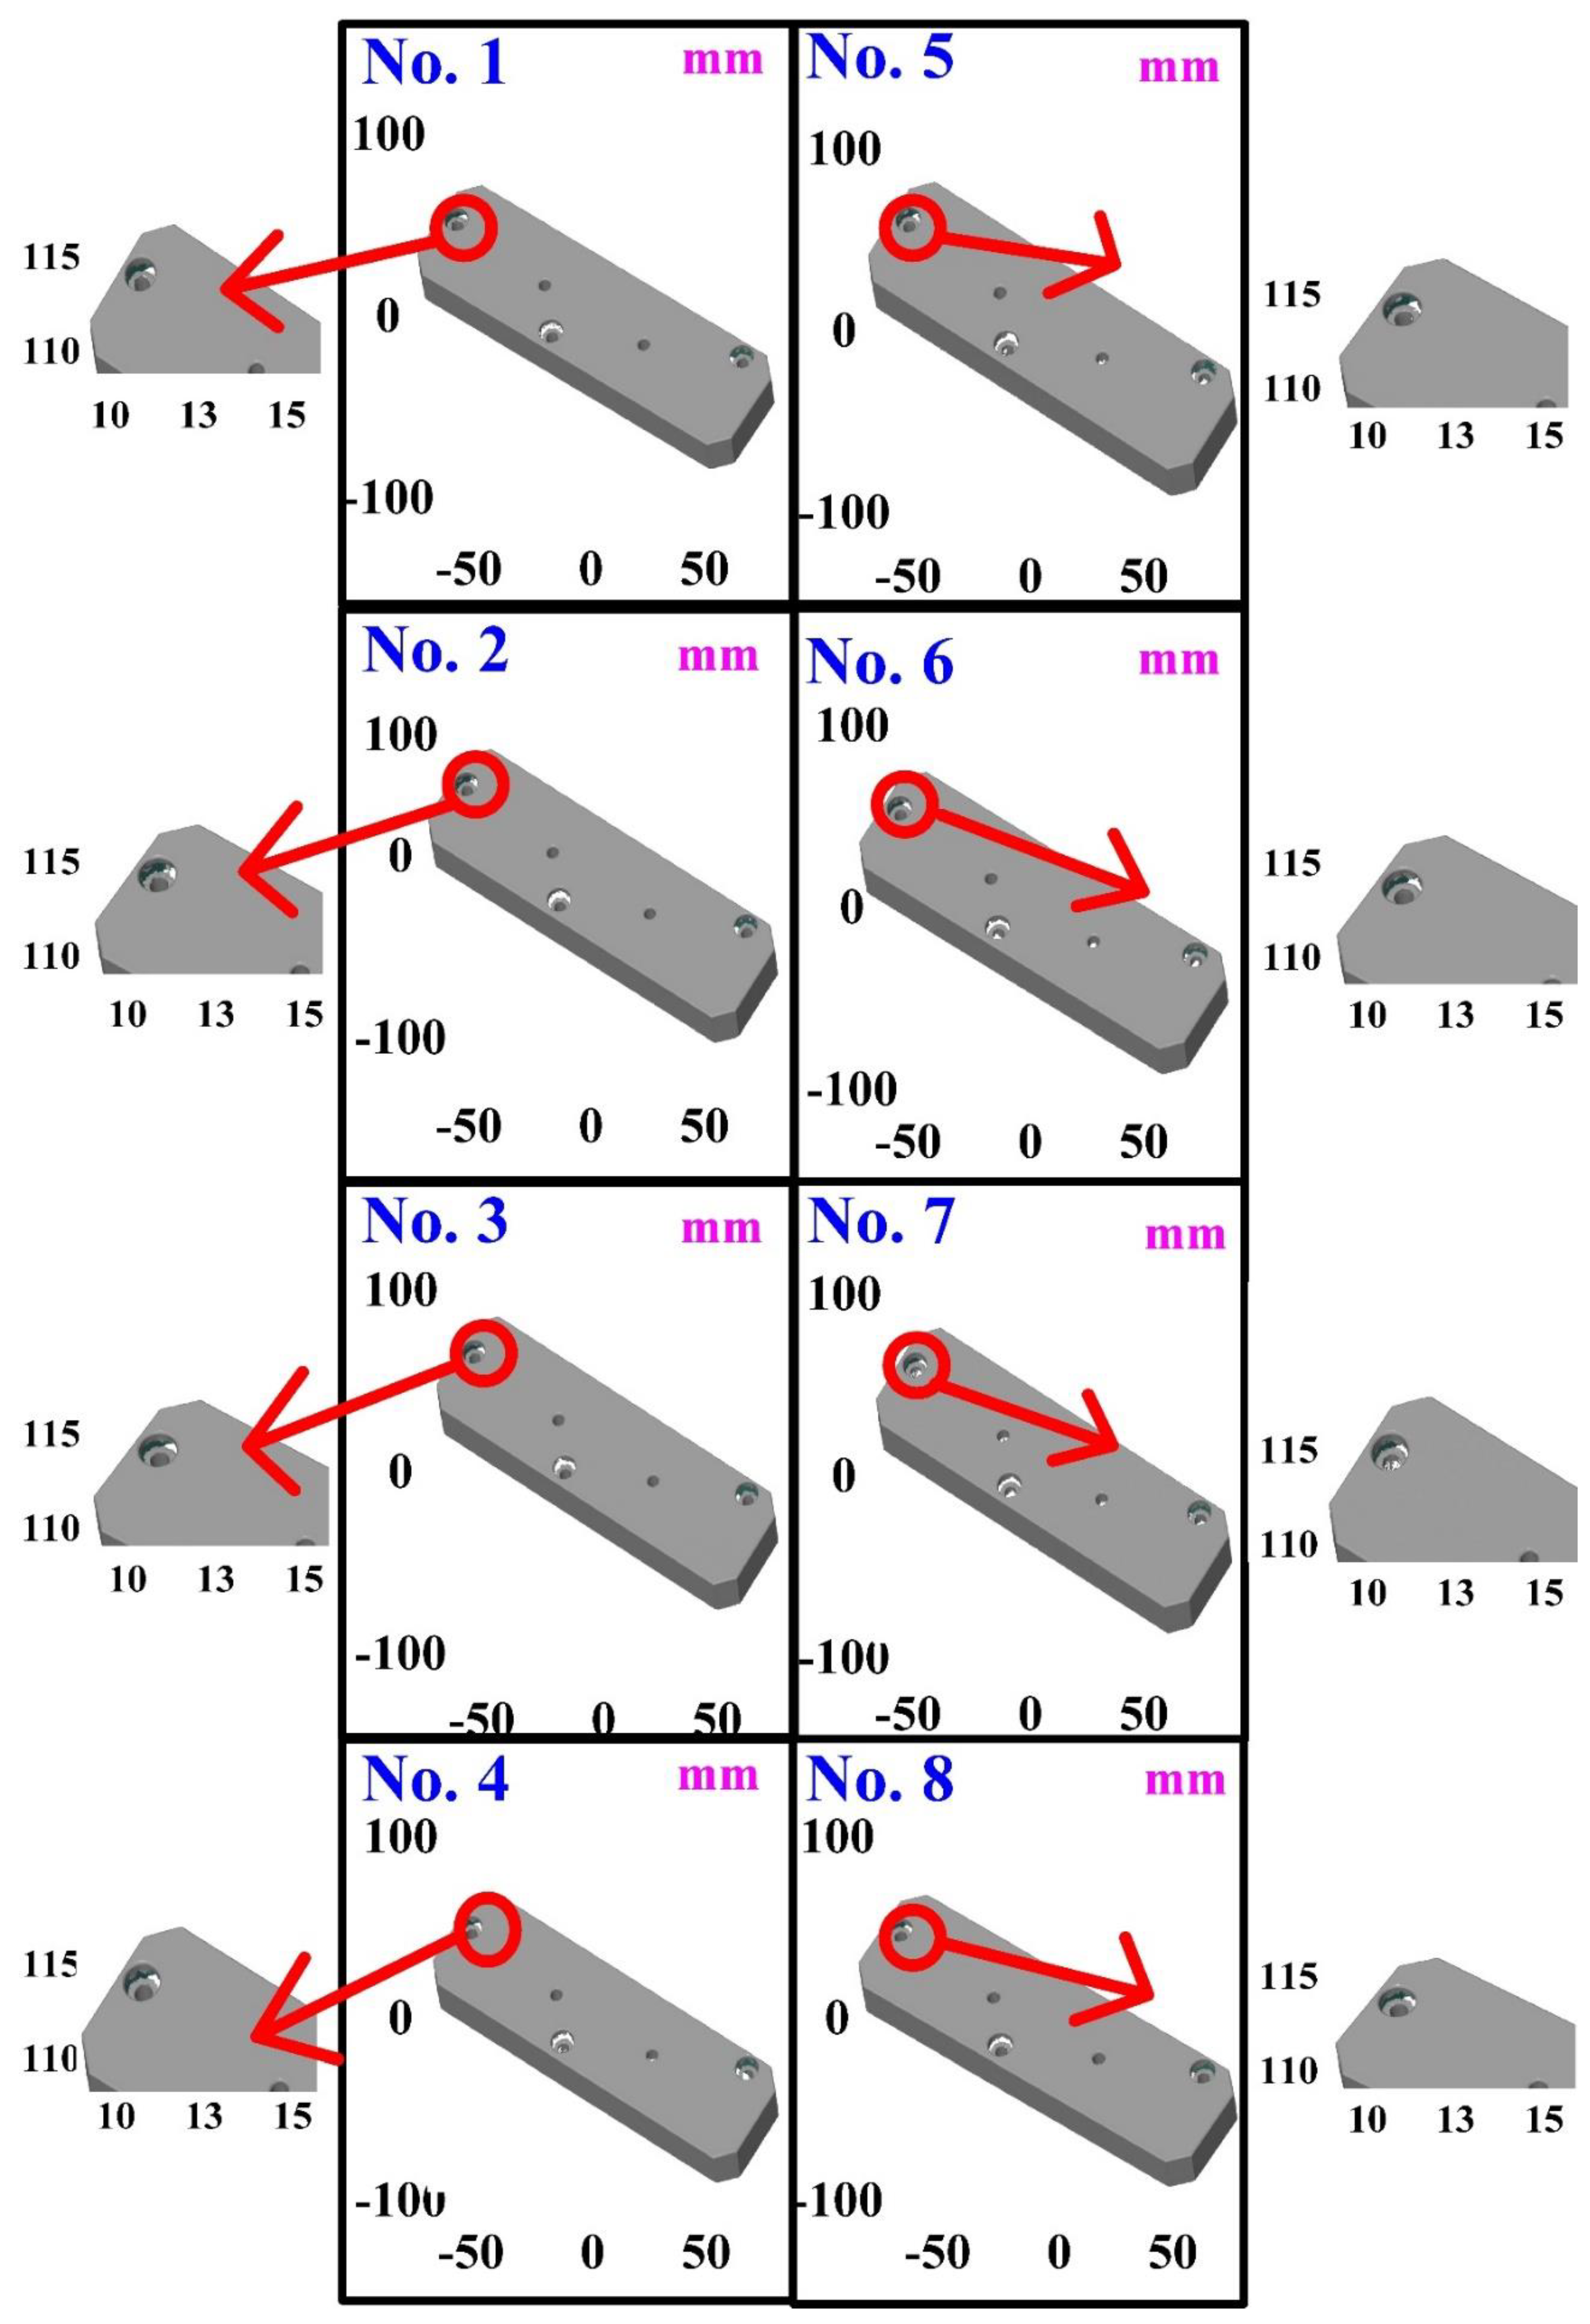
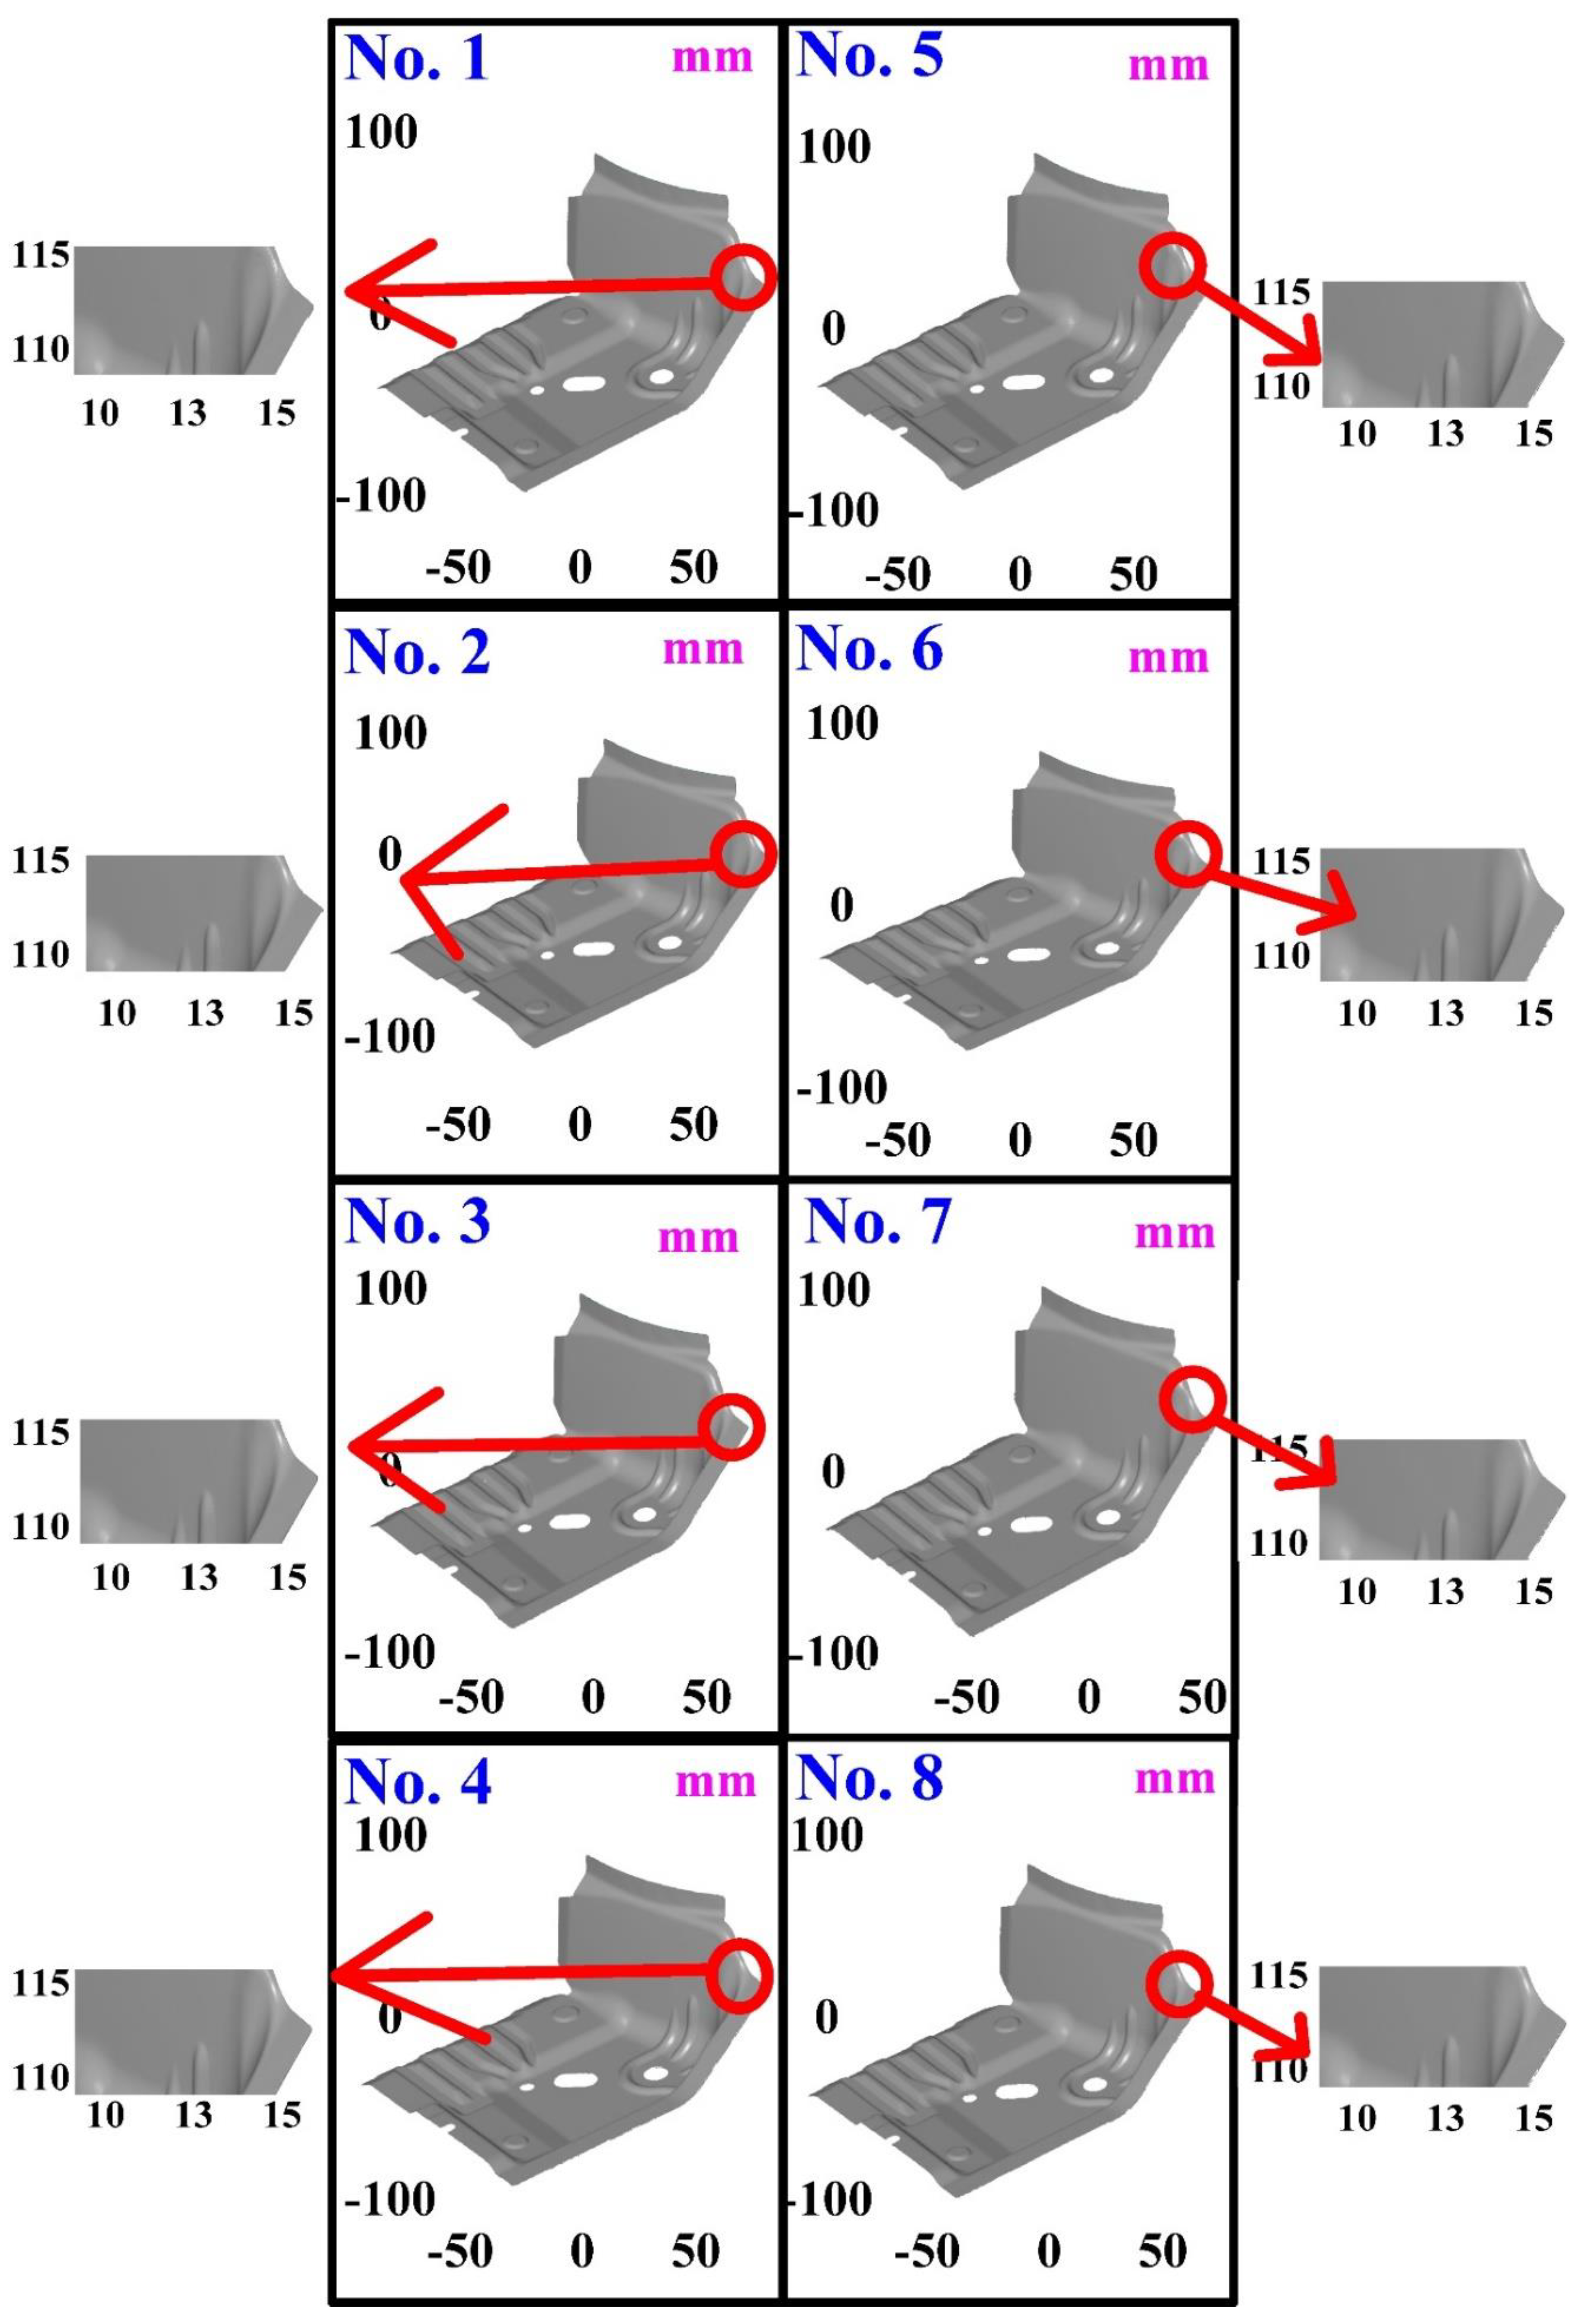
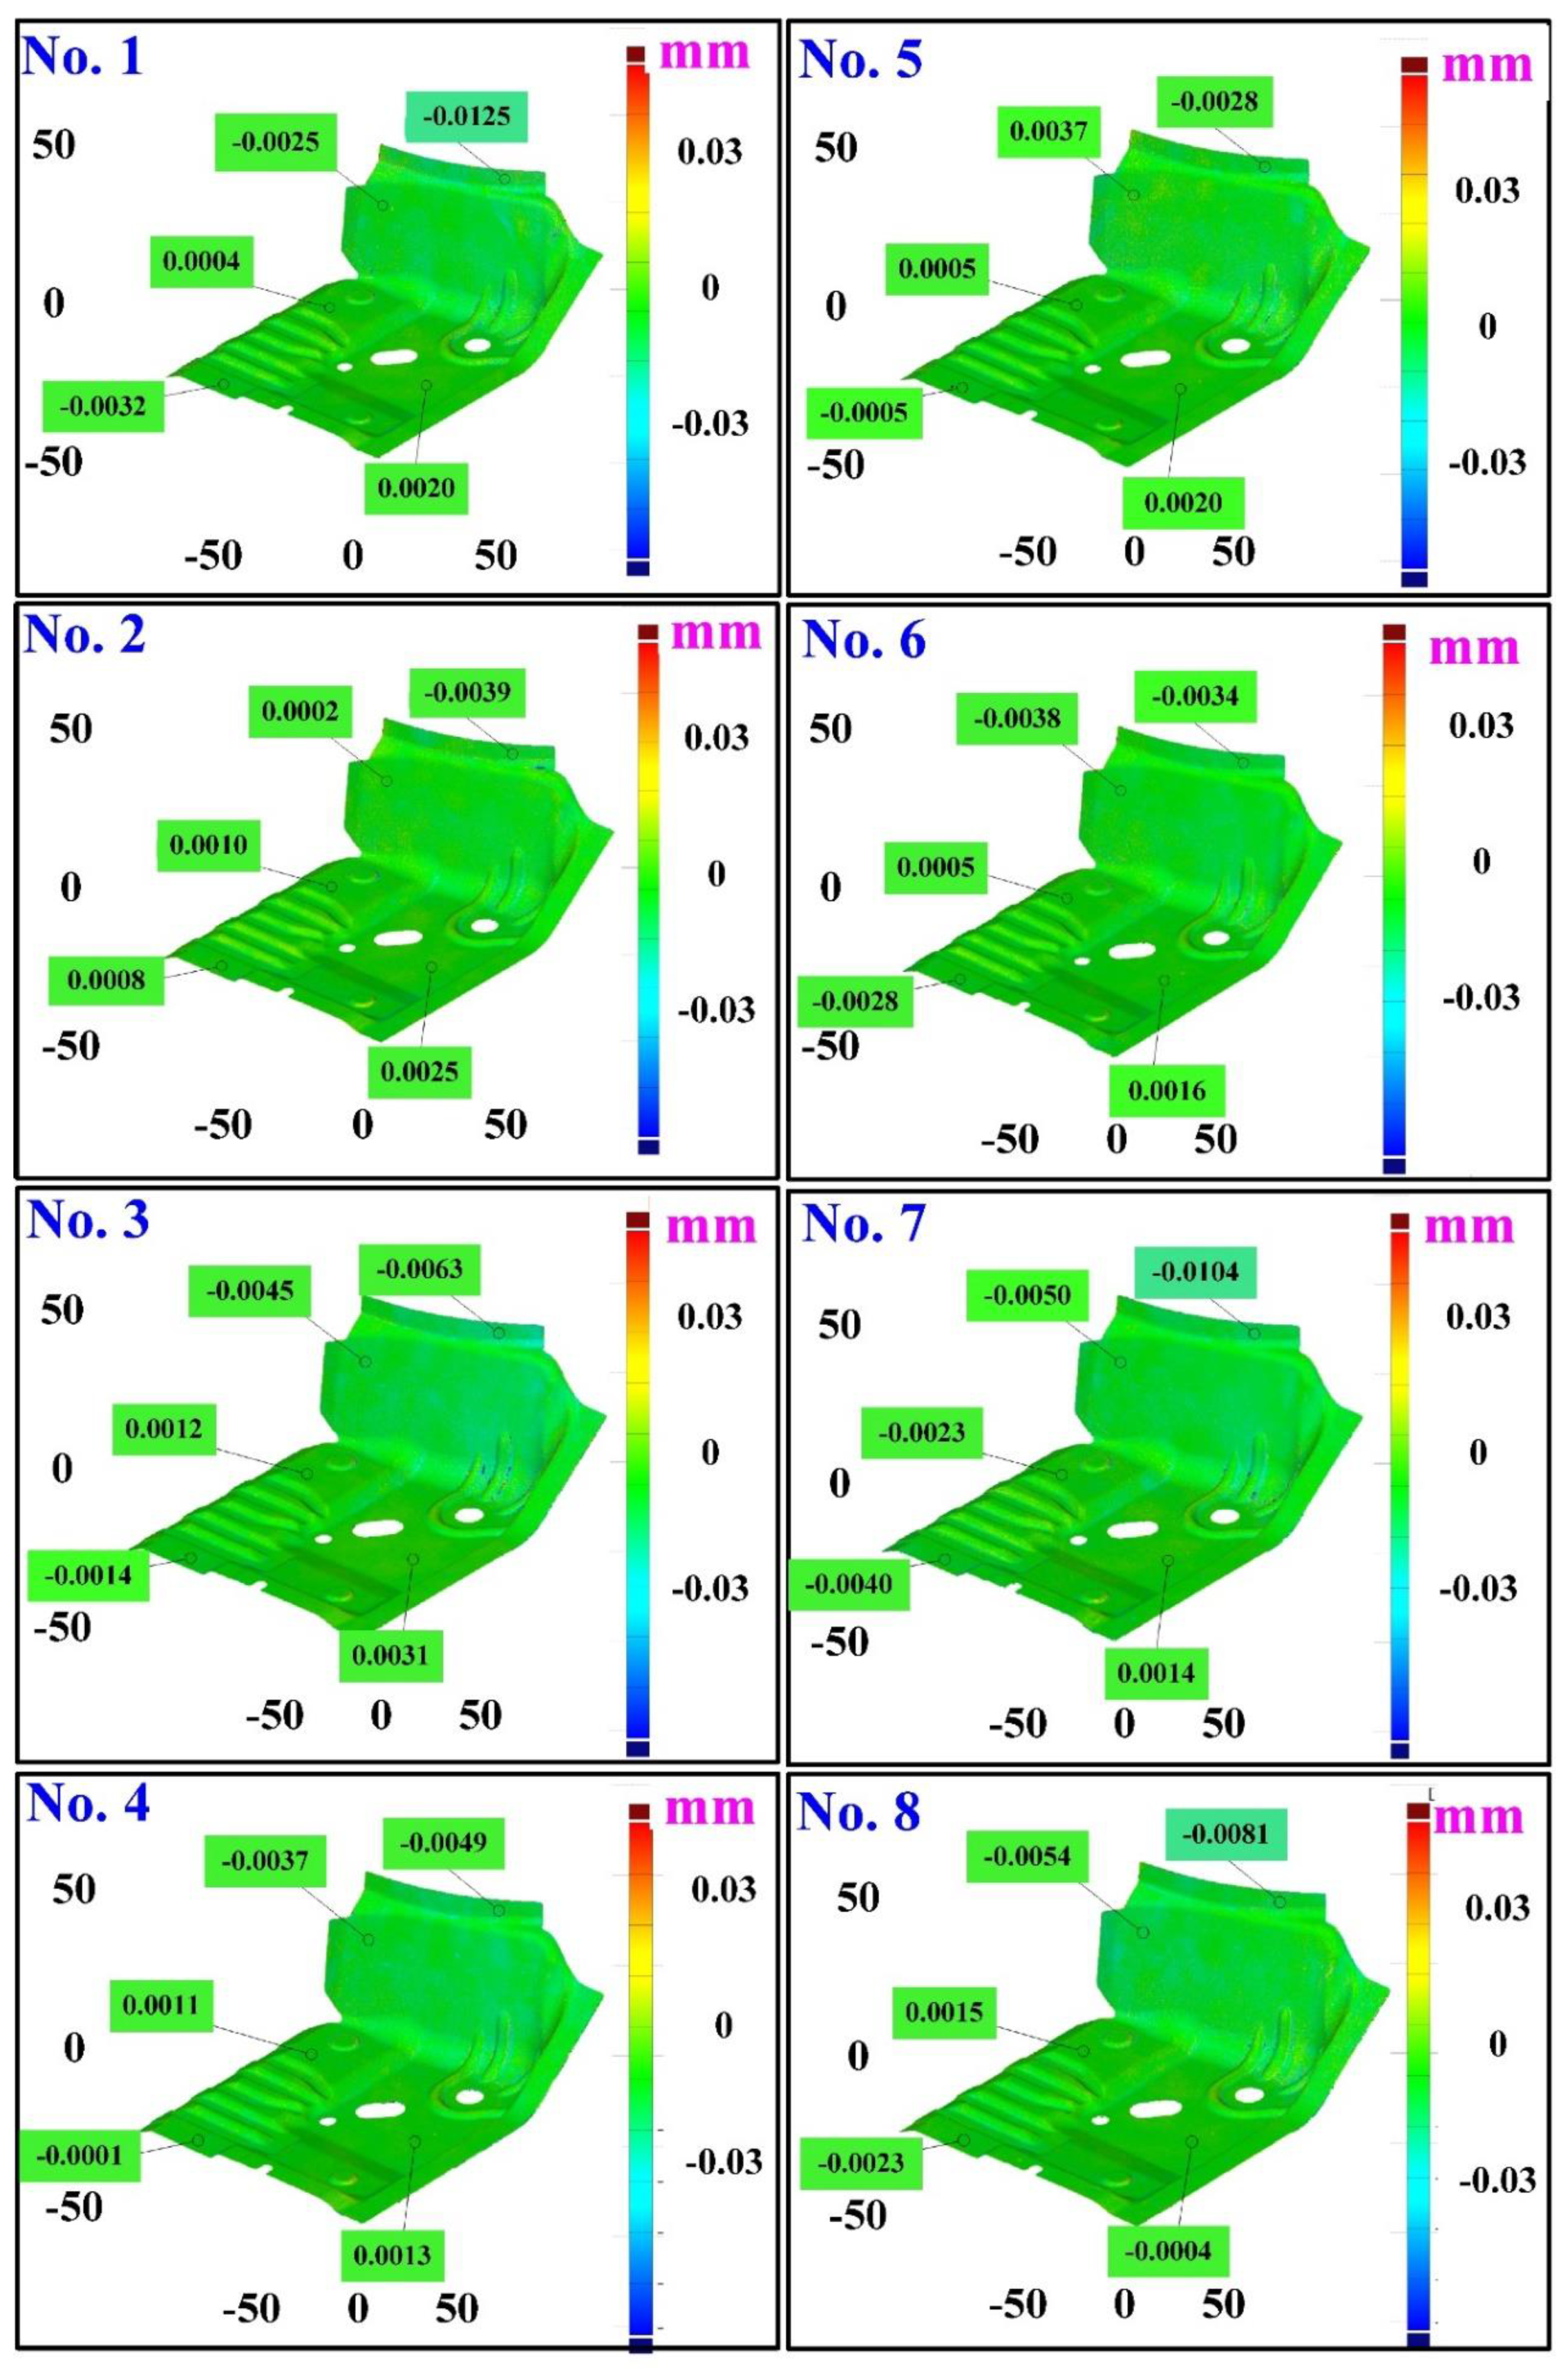
| No. | Scan Area | Ambient Light | Exposure Time |
|---|---|---|---|
| 1 | Scan all | ON | One |
| 2 | Scan all | ON | Two |
| 3 | Scan all with reflection detection | ON | One |
| 4 | Scan all with reflection detection | ON | Two |
| 5 | Scan all | OFF | One |
| 6 | Scan all | OFF | Two |
| 7 | Reflection detection | OFF | One |
| 8 | Reflection detection | OFF | Two |
| Measurement Product | Suggested Approach | Suggested Measurement Parameters | Average Size Error (µm) |
|---|---|---|---|
| As-cast turbine blade | 8 | Full resolution, more point, scan all with reflection detection, ambient light off, and two exposure times. | 3 |
| Cast part after CNC machining | 4 | Full resolution, more point, scan all with reflection detection, ambient light on, and two exposure times. | 0.1 |
| Glossy sheet metal | 2 | Full resolution, more point, scan all, reflection detection on, and two exposure times. | 0.5 |
| Circuit board | 8 | Full resolution, more point, scan all with reflection detection, ambient light off, and two exposure times. | 9 |
Publisher’s Note: MDPI stays neutral with regard to jurisdictional claims in published maps and institutional affiliations. |
© 2022 by the authors. Licensee MDPI, Basel, Switzerland. This article is an open access article distributed under the terms and conditions of the Creative Commons Attribution (CC BY) license (https://creativecommons.org/licenses/by/4.0/).
Share and Cite
Kuo, C.-C.; He, Z.-Y.; Lee, C.-X. Development of a Three-Dimensional Optical Verification Technology without Environmental Pollution for Metal Components with Different Surface Properties. Materials 2022, 15, 6139. https://doi.org/10.3390/ma15176139
Kuo C-C, He Z-Y, Lee C-X. Development of a Three-Dimensional Optical Verification Technology without Environmental Pollution for Metal Components with Different Surface Properties. Materials. 2022; 15(17):6139. https://doi.org/10.3390/ma15176139
Chicago/Turabian StyleKuo, Chil-Chyuan, Zong-Yan He, and Chil-Xian Lee. 2022. "Development of a Three-Dimensional Optical Verification Technology without Environmental Pollution for Metal Components with Different Surface Properties" Materials 15, no. 17: 6139. https://doi.org/10.3390/ma15176139