Article

High-Efficiency Iron Extraction from Low-Grade Siderite via a Conveyor Bed Magnetization Roasting–Magnetic Separation Process: Kinetics Research and Applications

College of Materials Science and Engineering, Xi’an University of Architecture and Technology, Xi’an 710055, China
*
Authors to whom correspondence should be addressed.
Materials 2022, 15(18), 6260; https://doi.org/10.3390/ma15186260
Submission received: 12 August 2022 / Revised: 5 September 2022 / Accepted: 6 September 2022 / Published: 8 September 2022
(This article belongs to the Section Manufacturing Processes and Systems)

Abstract

:
Upgrading and utilizing low-grade iron ore is of great practical importance to improve the strategic security of the iron ore resource supply. In this study, a thermal analysis–infrared (IR) analysis–in-situ IR method was used to investigate the reaction mechanism and kinetics of Daxigou siderite. Experiments were conducted using a conveyor bed magnetization roasting process (CBMRP) to investigate the magnetization of siderite. Multi-stage magnetic separation processes were adopted to extract magnetite. The results show that simultaneously the iron carbonate in siderite decomposes, and magnetite is formed between 364 °C and 590 °C under both inert and reducing atmospheres. The activation energy of the magnetization roasting reaction is 106.1 kJ/mol, consistent with a random nucleation and growth reaction mechanism. Magnetization roasting at 750–780 °C for approximately 3.5 s in the CBMRP results in a magnetic conversion rate of >0.99 of the iron minerals in the siderite. A beneficiation process of one roughing, one sweeping, and three cleaning processes was adopted. A dissociation particle size of −400 mesh accounting for 94.78%, a concentrate iron grade of 62.8 wt.%, and a recovery of 68.83% can be obtained. Overall, a theoretical and experimental basis is presented for the comprehensive utilization of low-grade siderite.

1. Introduction

Siderite is a low-grade, difficult-to-sort iron ore comprising iron carbonate (FeCO3) as its main component [1]. The known iron ore reserves in China may be as high as 1.8 billion tons, representing waste that is effectively unutilized at present [2]. Siderite resources in China are mainly located in Yunnan, Shaanxi, Gansu, Qinghai, and Xinjiang, all of which have reserves of >100 million tons of ilmenite. The Daxigou siderite in Shangluo City, Shaanxi Province, is the largest siderite deposit in China, with a reserve of >300 million tons. With the continuous and rapid development of the iron and steel industry in China, high-quality iron ore resources are being depleted. Therefore, developing a comprehensive technology for utilizing low-grade iron ore resources is of great practical significance for the sustainable development of the iron and steel industry [1,3,4].
When siderite is roasted under an inert or reducing atmosphere, its FeCO3 component decomposes and gradually converts to magnetite [2,3,4], which can then be magnetically separated from non-magnetic veinstone minerals [5,6,7]. Magnetization roasting and magnetic separation are thus two key technologies employed in the comprehensive utilization of siderite [8,9,10,11]. To date, rotary kiln, fluidized bed, and conveyor bed methods have been developed and used in China as methods for the magnetization roasting of siderite [12,13]. The conveyor bed magnetization roasting process (CBMRP, also known as suspension roasting) is a process that has been recently developed for the magnetization roasting of siderite employing micron-sized powder as a raw material that has been fully magnetized via roasting at 600–800 °C for 3–10 s under a reducing atmosphere. CBMRP is a simple process with high reaction efficiency, and large processing capacity, and the waste heat of the reaction can be recovered and the exhaust gas can be easily purified, which has significant technical advantages compared with the rotary kiln process [8,14]. To date, a large number of conveyor bed roasting process pilot tests have been completed and have been employed in the construction of production lines [15,16,17]. As the magnetization roasting time of the conveyor bed is very short, the magnetization roasting of siderite is very sensitive to the influence of the atmosphere, temperature, and time. Therefore, an accurate model of the reaction kinetics is required to provide a basis for process design and production control.
Numerous studies have shown that the magnetization roasting of iron-based minerals is influenced by the calcination method, reaction atmosphere, and parameters of the calcination conditions (temperature, time, particle size, etc.), and their reaction mechanism and kinetics are very complex [2,3,8,10,11,12]. In the magnetization roasting of siderite, not only the decomposition of FeCO3 occurs but also the phase transformation of iron minerals [2,3,4]. To date, most of the studies on iron mineral transformations have employed intermittent sampling and analysis methods, which are appropriate for slow calcination processes involving rotary kilns and fluidized beds, but there are limitations in the analysis of iron mineral transformations under the fast conditions of CBMRP. In-situ infrared (IR) analysis is a technology that is used in the online detection of materials structures and is widely used in the reaction characterization of organic compounds [18,19,20]. However, conventional in-situ IR analysis can only be used at temperatures <500 °C and cannot be introduced into a reducing reaction atmosphere, which limits its application in the reduction reaction of metal minerals. In this study, a specially-modified online in-situ IR analyzer with programmed temperature control and use under a reducing atmosphere in the range of 25–750 °C was developed. A specially-tailored potassium bromide (KBr) glass was used to extend the wavenumber range of an IR absorption spectrometer to a range of 4000–400 cm−1, enabling the detection of the IR absorption characteristics of iron minerals in the low-wavenumber region. Using this spectrometer solves the issues associated with detecting the transformation process of iron minerals that occurs during the magnetization roasting of siderite, thus providing a basis for the study of its reaction mechanism and kinetics. To date, there is still a lack of systematic studies on the application of magnetization reaction kinetics of siderite to the design and control practices of industrial production lines. In addition, studies on the reaction characteristics of siderite in CBMRP and the beneficiation process of low-grade siderite roasted ores are also necessary.
In this study, Daxigou siderite was used as raw material. The reaction process, iron mineral transformation, and reaction kinetics of siderite were characterized by combined thermal analysis–IR analysis and online in-situ IR analysis. Kinetic equations were used to predict the magnetization reactions of siderite at different temperatures, and CBMRP pilot tests were performed. The effect of magnetization was investigated by conducting a mineral phase analysis of the roasted ore in terms of magnetic conversion rate, and the optimal magnetization roasting parameters were determined. A multi-stage magnetic separation process was used to analyze the beneficiation of roasted ore produced by CBMRP, and the beneficiation effect was characterized according to the grade and recovery of iron concentrate. A systematic approach is established in this study in terms of the reaction mechanism, kinetics, magnetization roasting process system, and beneficiation process of siderite, which serves as a reference for the development, process design, and production control of conveyor bed magnetization technology.

2. Materials and Methods

2.1. Raw Materials

Daxigou siderite was used as raw material, procured from Shangluo City, Shaanxi Province, China. Siderite is a sedimentary metamorphic iron ore, with an iron grade of 16–23%; a typical low-grade type of siderite that is difficult to concentrate. A total of 32 tons of raw material of siderite was collected, which was the same batch of raw material used for production by the Daxigou Mining Company of the Shaanxi Long Steel Group. The raw ore was crushed and ground into a powder using a vertical mill, and 98.25% of the final particle size passed through a −200 mesh standard sieve (d50 = 42.85 μm). The finished material after grinding was thoroughly mixed and 50 kg of raw material was collected for chemical composition analysis using multi-point sampling. The rest of the powder was loaded into a silo as a raw material for CBMRP testing.
The mineral phase analysis of siderite was conducted by X-ray diffractometry (XRD, D/MAX-2200, RIKEN, Wako City, Japan) using a Cu Kα radiation source, tube voltage of 45 kV, tube current of 40 mA, and scanning was conducted over a 2θ range of 5–85° with a scanning speed of 5°/min. The XRD pattern of siderite is shown in Figure 1.
The chemical elements in siderite were analyzed by X-ray fluorescence spectroscopy (XRF, S4PIONEER, Bruker, Germany), using X-ray tube parameters of 4.2 kW, 60 kV (max), and 140 mA (max). The quantitative method without a standard sample was adopted. The grade of iron of siderite was analyzed using a chemical elemental analysis method, the results of which are shown in Table 1.
Figure 1 and Table 1 show that the major minerals in the raw material are siderite, quartz, and muscovite, of which FeCO3 is the major iron mineral component. In addition, siderite also contains minerals of Mn, Mg, S, and other elements. The average iron grade of Daxigou siderite is 21.42 wt.%, which makes it a low-grade iron ore.

2.2. Reaction Mechanism Analysis

A combined system comprising a thermogravimetric analysis-differential scanning calorimetry (TGA-DSC) simultaneous thermal analyzer (409PC, NETZSCH, Bavaria, Germany) and an IR spectrometer (FTIR-7600, Bruker, Karlsruhe, Germany) was used to detect the mass changes and gas products of siderite during the magnetization roasting process. The experimental parameters were as follows. The sample mass was 10.0 ± 0.5 mg, the atmosphere was high purity Ar gas, the flow rate was 45.0 mL/min, the heating rates were 10 °C /min, 15 °C /min, 20 °C /min, and 25 °C /min, and the wavenumber range of the FTIR detector was 4000–400 cm−1. A high-temperature and high-pressure diffuse reflectance in-situ analyzer (Specac, Orpington, UK) combined with an IR spectrometer (Spectrum 3, PerkinElmer, Waltham, MA, USA) were used to examine the changes in the physical phase structure of siderite during the magnetization roasting process. The parameters of the online in-situ IR analysis were a temperature range of 25–750 °C, a heating rate of 15 °C/min, a wavenumber range of 4000–400 cm−1, KBr glass as the medium, and a mixed high purity Ar and CO (Ar 99% + CO 1%) atmosphere controlled at a flow rate of 65 mL/min.

2.3. Kinetics Analysis Method

The thermoanalytical kinetic equation for the reaction of solid substances is as follows [21,22]:
dα/dT = Aexp[−E/(RT)]f(α)
where α is the reaction conversion rate; A is the finger front factor of the kinetic equation, s−1; E is the reaction activation energy, kJ/mol; R is the gas constant with a value of 8.314 J/(mol·K); T is the temperature, K; f(α) is the differential form of the mechanism function; and dα/dT is reaction rate.
Equation (1) is the kinetic equation for thermal analysis in differential form. The kinetic equation in integral form is given by Equation (2):
G(α) = Aexp(−E/RT)t
where t is the time, s, and G(α) is the integral form of the mechanism function. The G(α) functions commonly used for solid-phase reactions were taken from the literature [23].
The formula for calculating the reaction conversion α when using thermogravimetric data is [23]
α = (m0mi)/(m0m)
where m0, mi, and m are the masses of the samples at the beginning, during, and at the end of the reaction, respectively.
E and A were calculated and G(α) was determined by fitting the αT data using the Kissinger method and the general integration method [24,25]. The Kissinger equation is as follows [24]:
ln ( β i T pi 2 ) = ln A R E - E R 1 T pi ,   i = 1 , 2 , 3 , 4
where βi is the heating rate, °C/min, and Tpi is the peak temperature in the DTG curve, K.
The general integral method is as follows [25]:
ln [ G ( α ) T 2 ] = ln { A R β E ( 1 - 2 R T E ) } - E R T
For a suitable G(α), ln[G(α)/T2] − 1/T in the above equation is a linear relationship, from which the value of E is obtained from the slope of the line, and the value of A is obtained from the intercept. The kinetic equations of the magnetization roasting of siderite were obtained by substituting E, A, and G(α) into Equation (2).

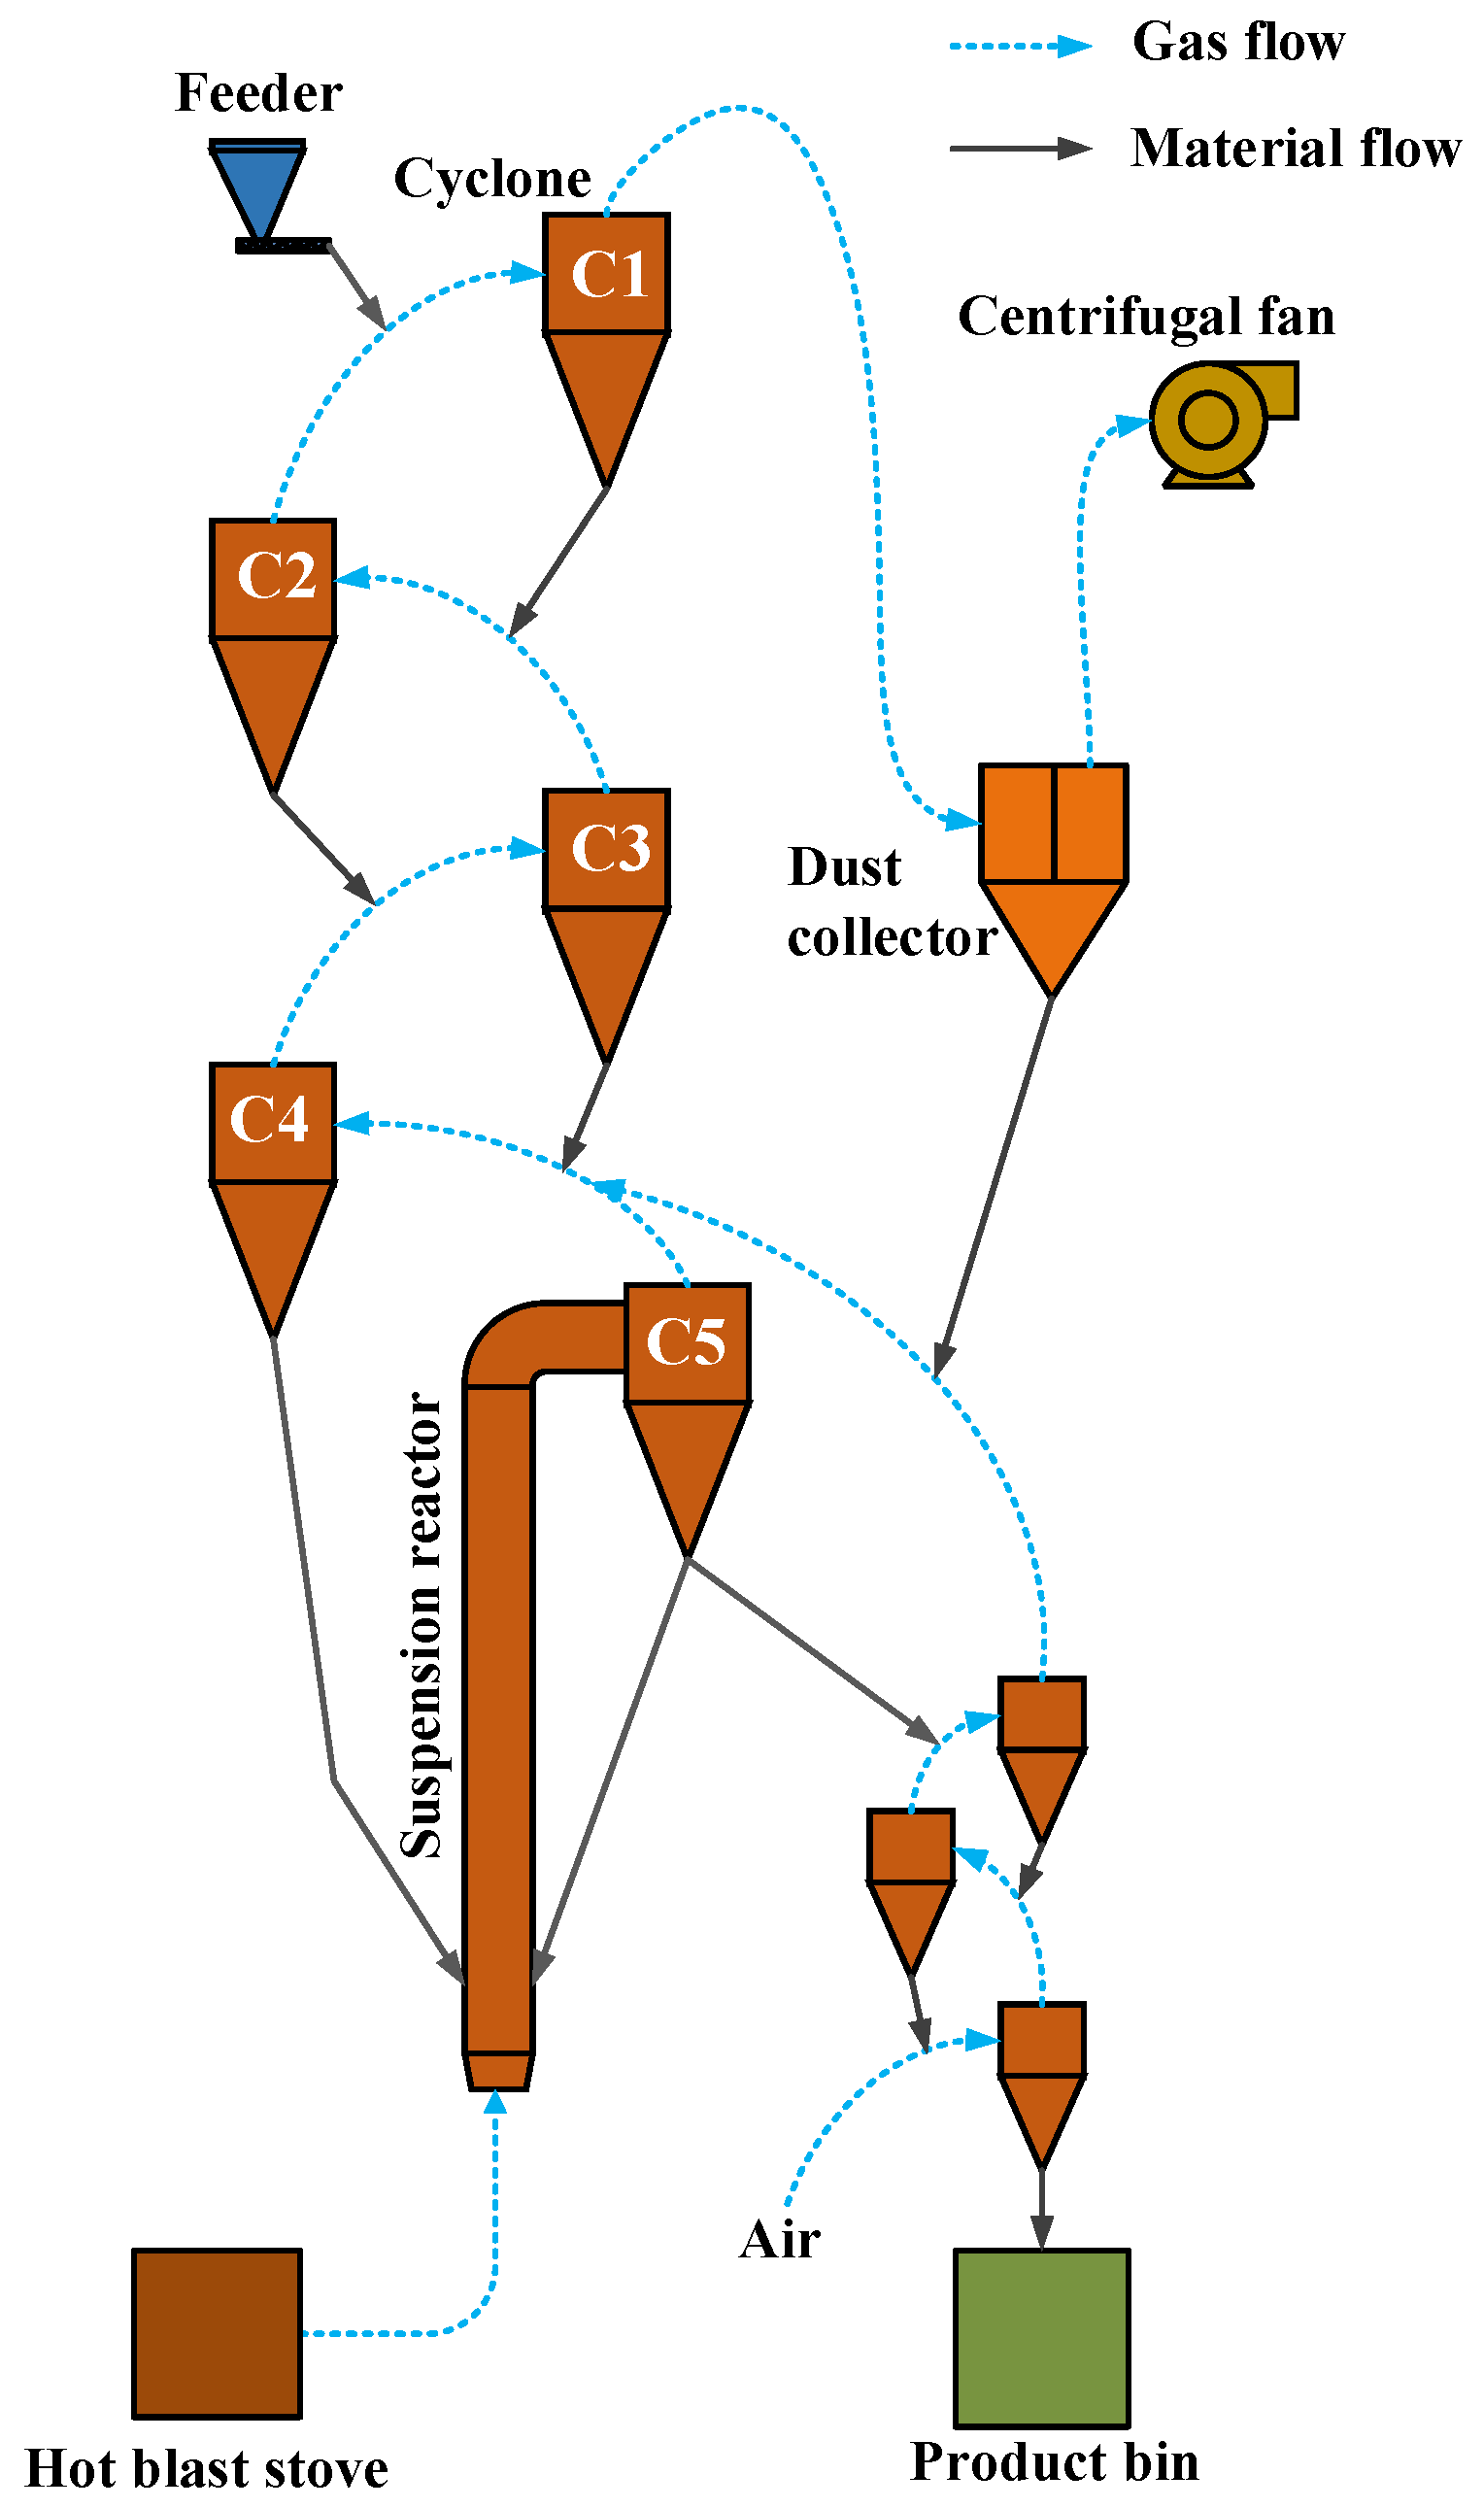
2.4. Conveyor Bed Magnetization Roasting Pilot Test System

The conveyor bed magnetization roasting pilot test system is shown in Figure 2.
In the pilot tests, the controlled roasting temperature was in the range of 600–780 °C (middle furnace temperature), the CO content in the C5 exit gas was 0.8–1.5%, the residence time of the material in the suspension reactor was around 3.5 s, the charge was around 800 kg per hour, and the continuous operation time was 72 h.

2.5. Characterization of the Roasted Ores

XRD analysis was performed on the roasted ore to determine its iron mineral composition. The iron content in various minerals was analyzed by chemical titration analysis. The magnetic conversion rate η was calculated to characterize the magnetization roasting effect:
η = Qm/QTotal × 100%
where Qm is the mass of iron elements in magnetite and QTotal is the total mass of iron elements that can be magnetized. As iron in silicates cannot be magnetized, QTotal is equal to the mass of iron in the roasted ore with the mass of iron in the silicates subtracted. The magnetized roasted ore was subjected to backscattered electron (BSE) imaging and energy-dispersive spectroscopy (EDS) at 750 °C to determine its reasonable dissociation particle size and beneficiation process.

2.6. Magnetic Separation Analysis

The magnetic separation involved a multi-stage magnetic separation process of one roughing, one sweeping, and three cleaning stages. The beneficiation parameters and process are shown in Figure 3.
XRD analysis and chemical titration analysis were conducted on the middling, concentrate, and tailings of the beneficiation. The composition of the iron minerals was identified by XRD analysis, and the iron grade was analyzed by chemical titration. The yield and recovery were also calculated.

3. Results and Discussion

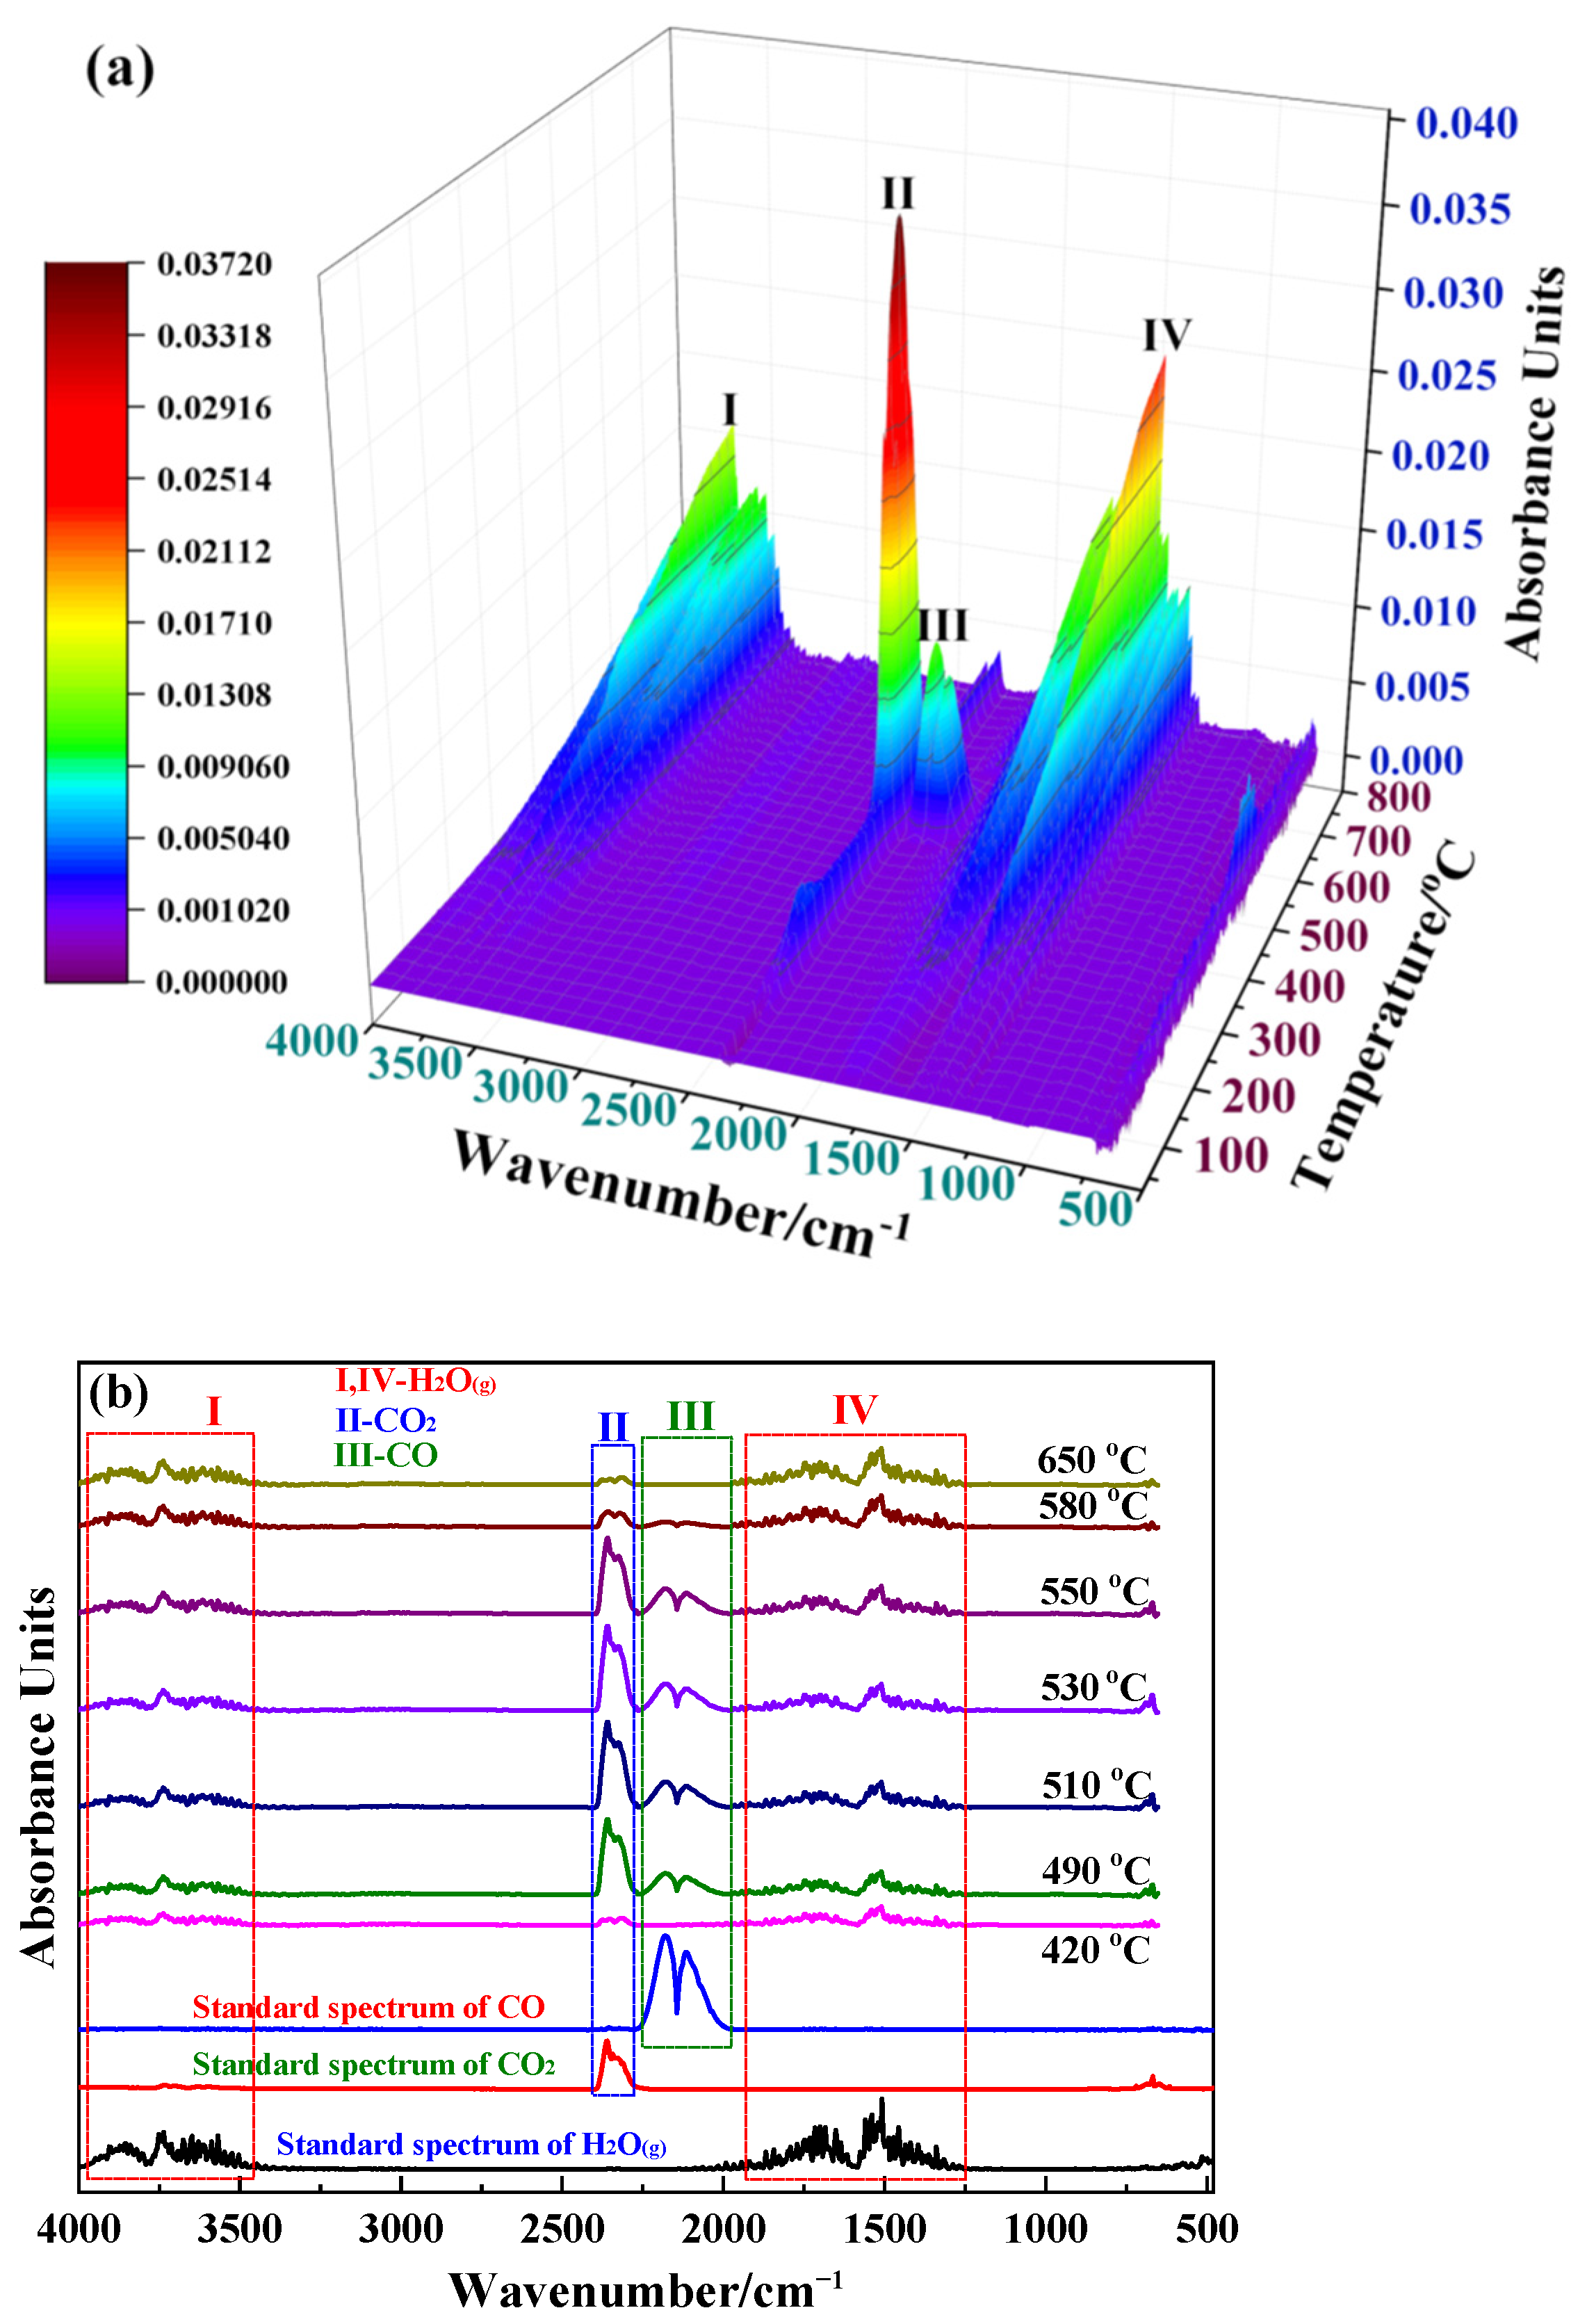
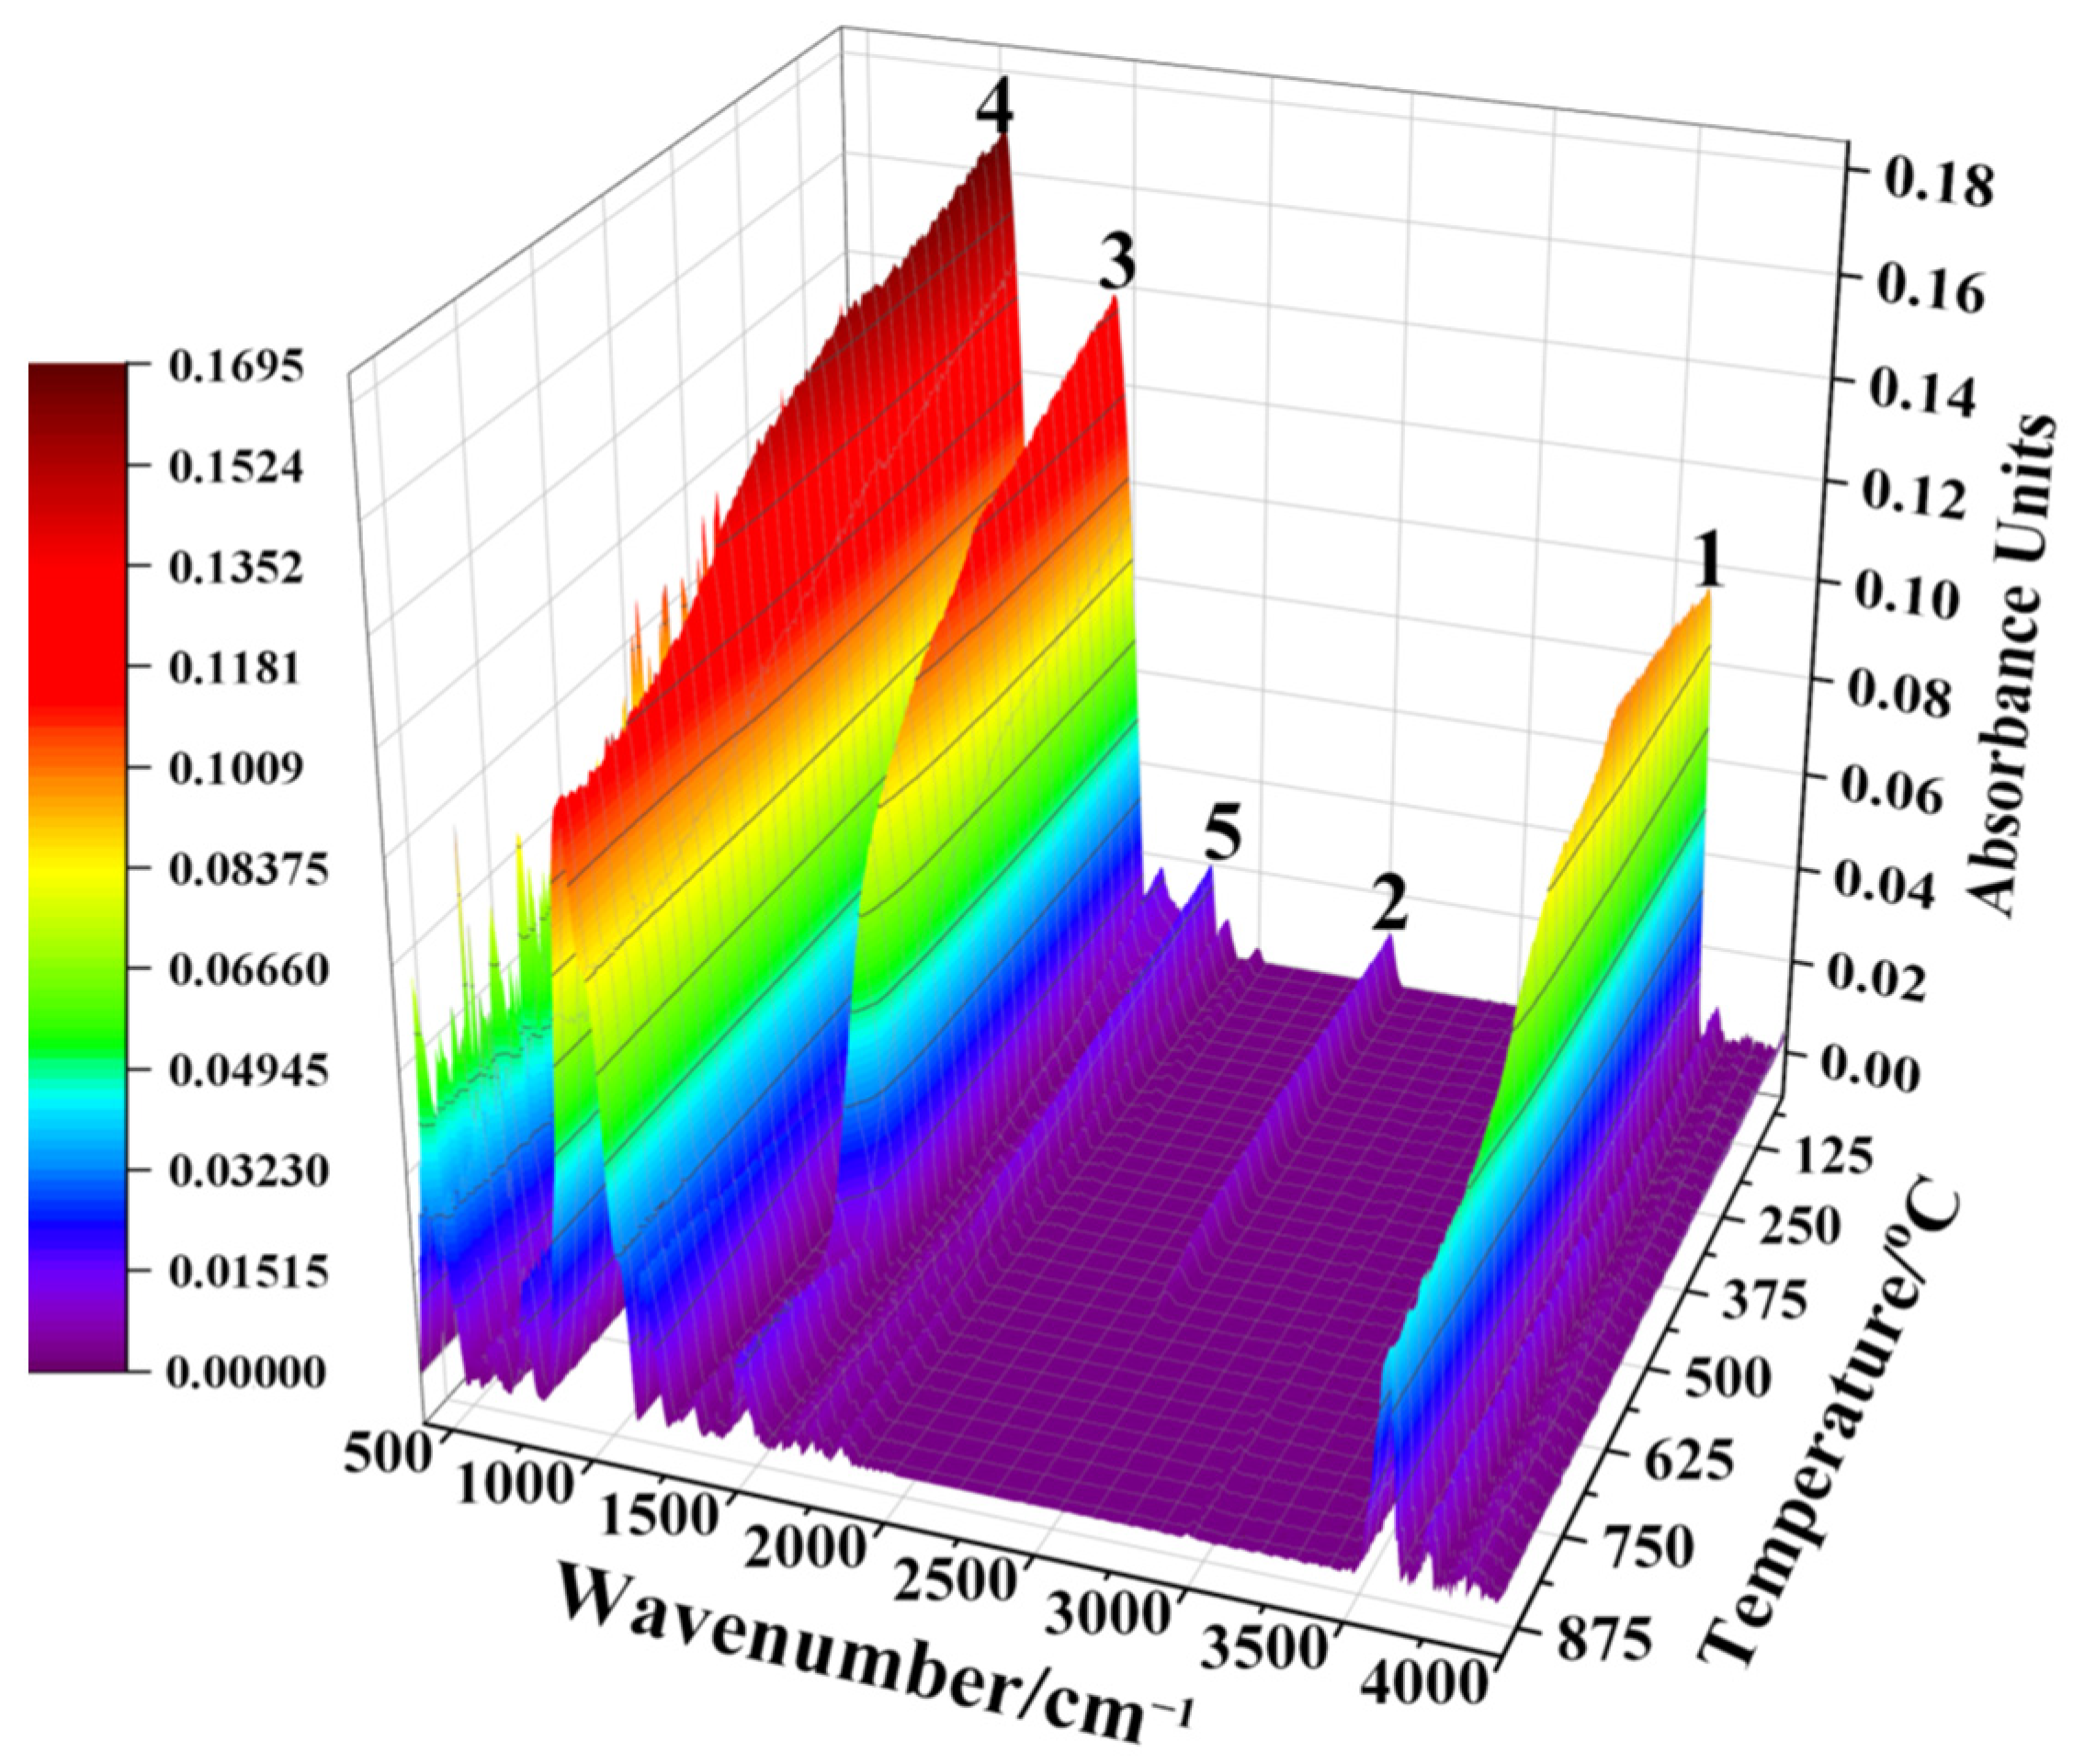
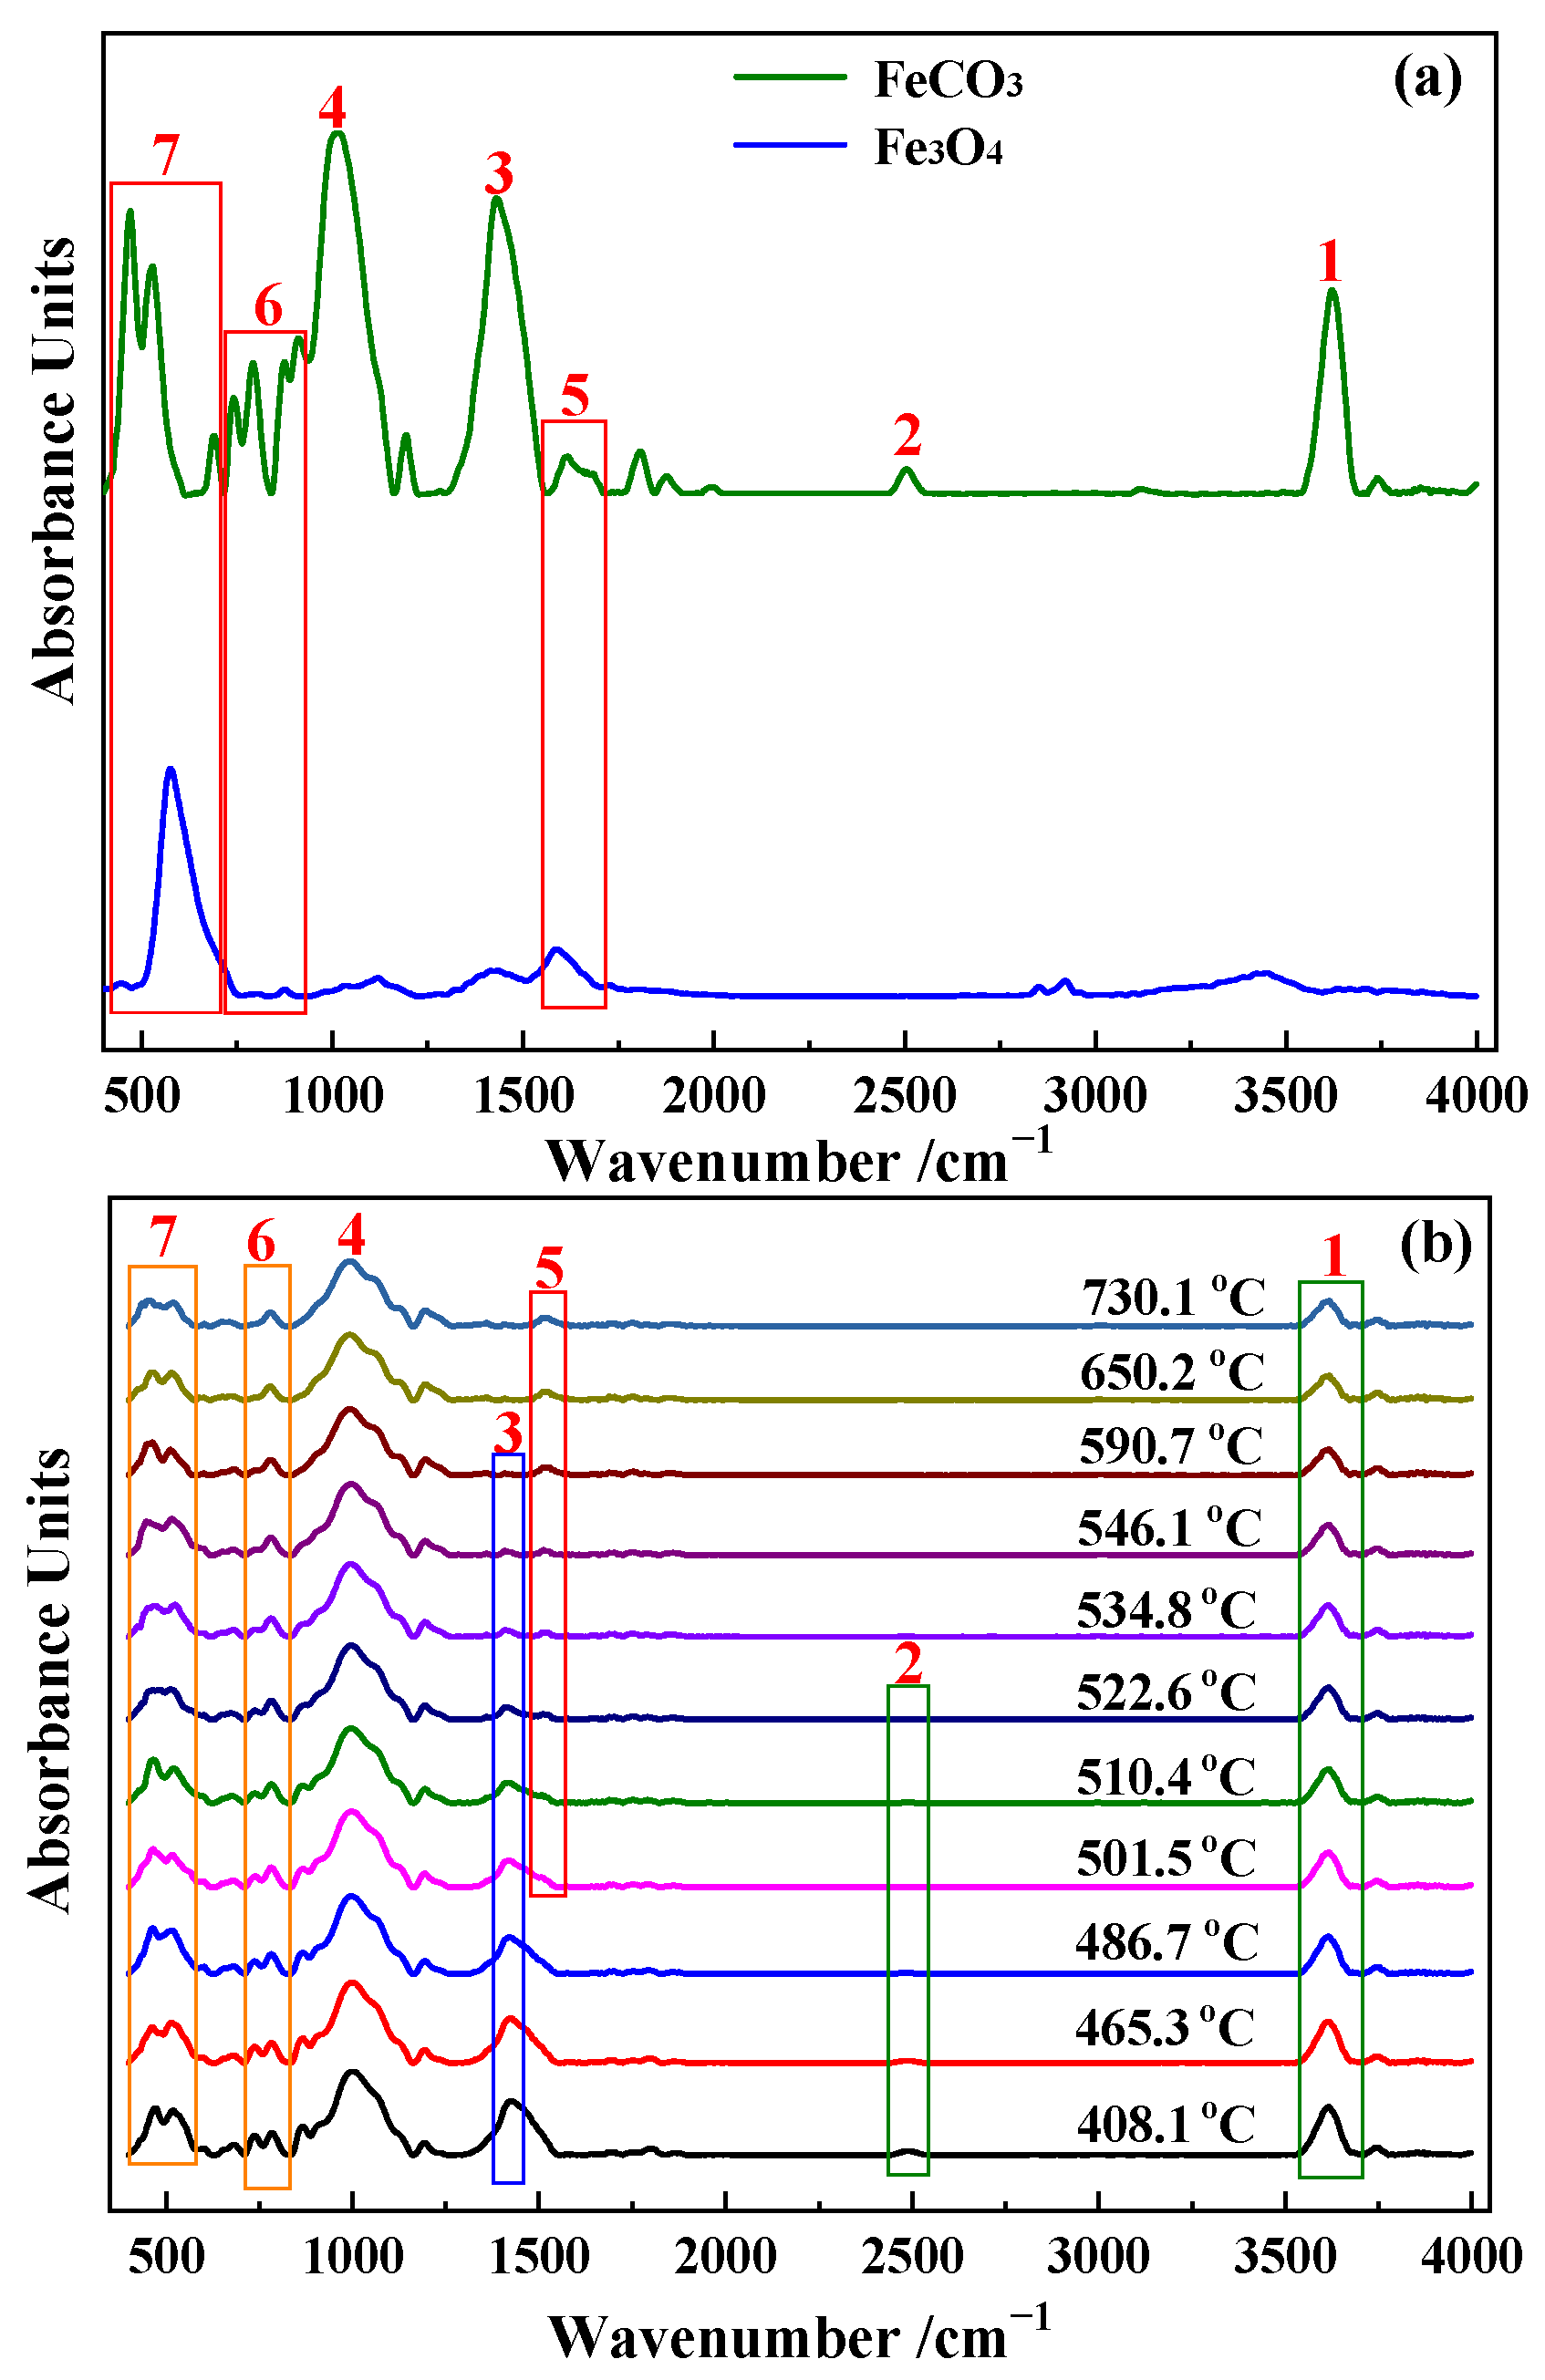
3.1. Reaction Mechanism Analysis

The thermogravimetric analysis (TGA) and differential thermogravimetry (DTG) profiles of the thermal analysis of siderite are shown in Figure 4a,b.
As shown in Figure 4a,b, there are three stages of mass loss of siderite that occur during the magnetization roasting process. The temperature range of the first stage is 90–165 °C with an average mass loss of 0.52 wt.%. The second stage is in the range of 165–364 °C with an average mass loss of 0.98 wt.%. The third stage is the main reaction stage with a temperature range of 364–590 °C, producing an average mass loss of 10.1 wt.%.
The reaction processes were analyzed from the IR data of the gaseous products released from siderite during magnetization roasting. The three-dimensional (3D) IR absorption spectra of the gaseous products recorded at a heating rate of 15 °C/min are shown in Figure 5a. The two-dimensional (2D) infrared absorption spectra resolved from Figure 5a are shown in Figure 5b.
As shown in Figure 5b, the absorption bands of three functional groups, hydroxyl, and two carbon-oxygen groups, are mainly detected in the gaseous products released from the magnetization roasting of siderite. The gas product components corresponding to hydroxyl and carbonyl are H2O(g), CO, and CO2, respectively, assigned by searching the standard spectral library. This shows that peaks I and IV in Figure 5a are the IR absorption bands of H2O(g), peak II is the IR absorption band of CO2, and peak III is the IR absorption band of CO.
Based on the mineral and chemical composition of siderite, it was inferred that the following reactions occur during the magnetization roasting process [2,3,4,26].
FeCO3 → FeO + CO2
3FeO + CO2 → Fe3O4 + CO↑
KAl2(Si3Al)O10(OH)2 → KAl2(Si3Al)O11 + H2O(g)
The gaseous product released in the first stage is H2O(g), the mass loss of which could be a result of the removal of adsorbed water, according to the analysis shown in Figure 4a,b, and Figure 5a. The gaseous products released in the second stage are CO2 and H2O(g). A clear CO2 release process can be observed on peak II in Figure 5a, and the IR absorption intensity of H2O(g) also increases significantly. Based on the mineralogical and chemical composition of siderite, it was inferred that the release of CO2 is due to the decomposition of trace carbonates, while the release of H2O(g) can be mainly attributed to the loss of crystalline water of muscovite. In the third stage, the IR absorption intensity of H2O(g) shown in Figure 5a increases significantly and a strong CO2 release process occurs on peak II. This phase is mainly a decomposition process of siderite and white muscovite. The detection of CO confirms the formation of magnetite during the decomposition of FeCO3, consistent with the literature [10].
The structural transformation of siderite samples in magnetization roasting can be directly characterized using online in-situ IR. The online in-situ 3D IR spectra of the magnetization roasting process of siderite at 15 °C/min are shown in Figure 6.
The composition of mineral materials is very complex, and trace amounts of minerals also produce complex IR absorption bands, therefore making the analysis of in-situ IR spectra very difficult. The most commonly used IR method is the determination of the standard spectra of pure substances, from which characteristic IR absorption bands are determined. The IR absorption spectrum of the pure substance is then used to characterize its structural changes. In this study, IR absorption spectra of a standard sample of magnetite and raw Daxigou siderite ore were measured, with the results shown in Figure 7a. The online in-situ IR absorption spectra of the roasted siderite ore are shown in Figure 7b, with the results in Figure 7a,b used to analyze the reaction characteristics of siderite in the magnetization roasting process.
The IR absorption spectrum of siderite is very complex, as shown in Figure 7a. According to the literature [27], in IR spectra, carbonates typically give rise to signals in the 1600–1300 cm−1 region, Si–O bond peaks are typically observed in the 1200–1100 cm−1 region, hydroxyl group peaks in the 3550–3200 cm−1 and 1100–1000 cm−1 regions, carbonate and silicate peaks in the 800–745 cm−1 region, and iron oxide and silicate peaks are observed in the 1700–1500 cm−1 and 705–400 cm−1. From this, it can be determined that peaks 1 and 2 in Figure 7a can be attributed to the IR absorption bands of hydroxyl groups (free water or water of crystallization); peak 3 is the IR absorption band of carbonate groups; peak 4 can be mainly attributed to the IR absorption band of silicates; and peaks 5, 6, and 7 can mainly be assigned as the absorption bands of iron oxides.
In the magnetization roasting of siderite, the decomposition of FeCO3 and the formation of magnetite are the key reactions. Figure 6 and Figure 7b show that the intensity of the carbonate absorption band marked as peak 3 decreases with a gradual increase in temperature. When the temperature reaches 590.7 °C, absorption band 3 almost completely disappears, indicating the completion of the FeCO3 decomposition, consistent with the TG-DTG results in Figure 4 and FTIR analysis in Figure 5. Peaks 1 and 2 are the absorption bands of hydroxyl groups, which are known to be related to muscovite based on the chemical composition of siderite. A closer observation of the data in Figure 6 shows that peak 1 is actually a merged absorption band with a smaller wavenumber at the top of the peak and a larger wavenumber at the bottom. With the gradual removal of hydroxyl groups, the upper part of the absorption band gradually weakens in intensity and disappears at around 570 °C, while the lower part shows no significant changes. Figure 6 shows that absorption band 2 disappears at around 570 °C, indicating the complete loss of crystal water from muscovite.
The IR absorption bands associated with the formation of magnetite are peaks 5, 6, and 7. As shown in Figure 7a, the peak 5 absorption band of siderite is a double peak, while the absorption band of magnetite is a single peak. Figure 6 shows that the bimodal peak of siderite gradually decreases with increasing temperature and disappears at around 500 °C, while a single peak that gradually increases in intensity starts to appear, indicating the gradual formation of magnetite. From peak 5 in Figure 7b, it can be clearly observed that the absorption band of magnetite starts to form from around 501 °C and gradually increases in intensity. After 590 °C, no further significant changes occur, indicating the completion of the magnetization reaction. The conversion process of siderite to magnetite can also be observed in the absorption band marked as peak 7. The major change is the gradual weakening and broadening of the left peak in the bimodal absorption band of siderite, while the right peak is gradually raised and shifted in the direction of increasing wavenumber. Figure 7a shows that the weakening and broadening of the left peak can be attributed to the decomposition of siderite, while the more intense right peak and its migration to higher wavenumbers is evidence of the increase in the formation of magnetite. Online in-situ IR analysis results indicate that the decomposition of siderite is completed at approximately 590 °C. Magnetite is gradually produced during the decomposition of siderite, and the magnetization reaction is completed simultaneously at approximately 590 °C after the complete decomposition of siderite.

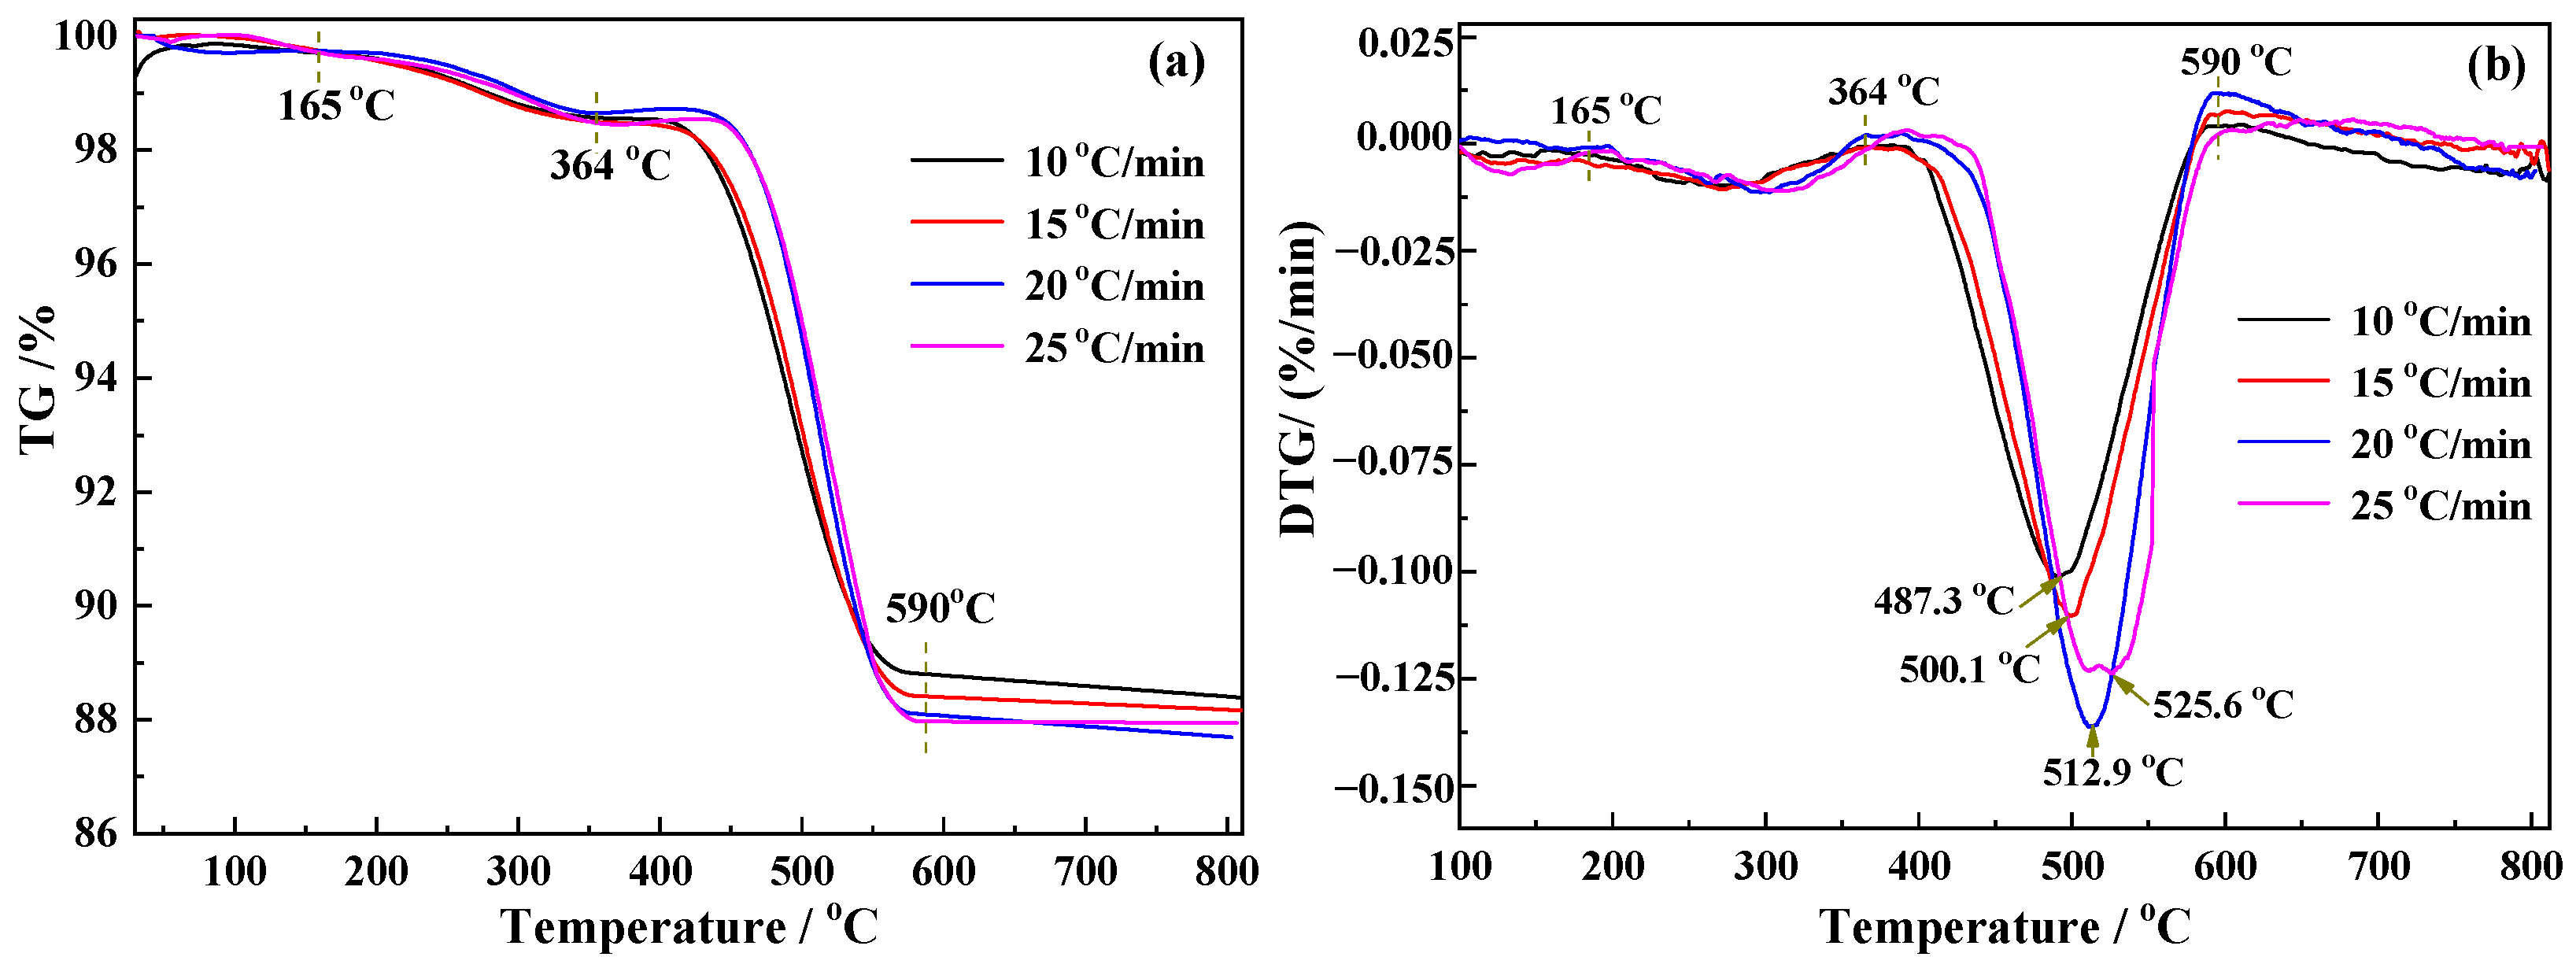
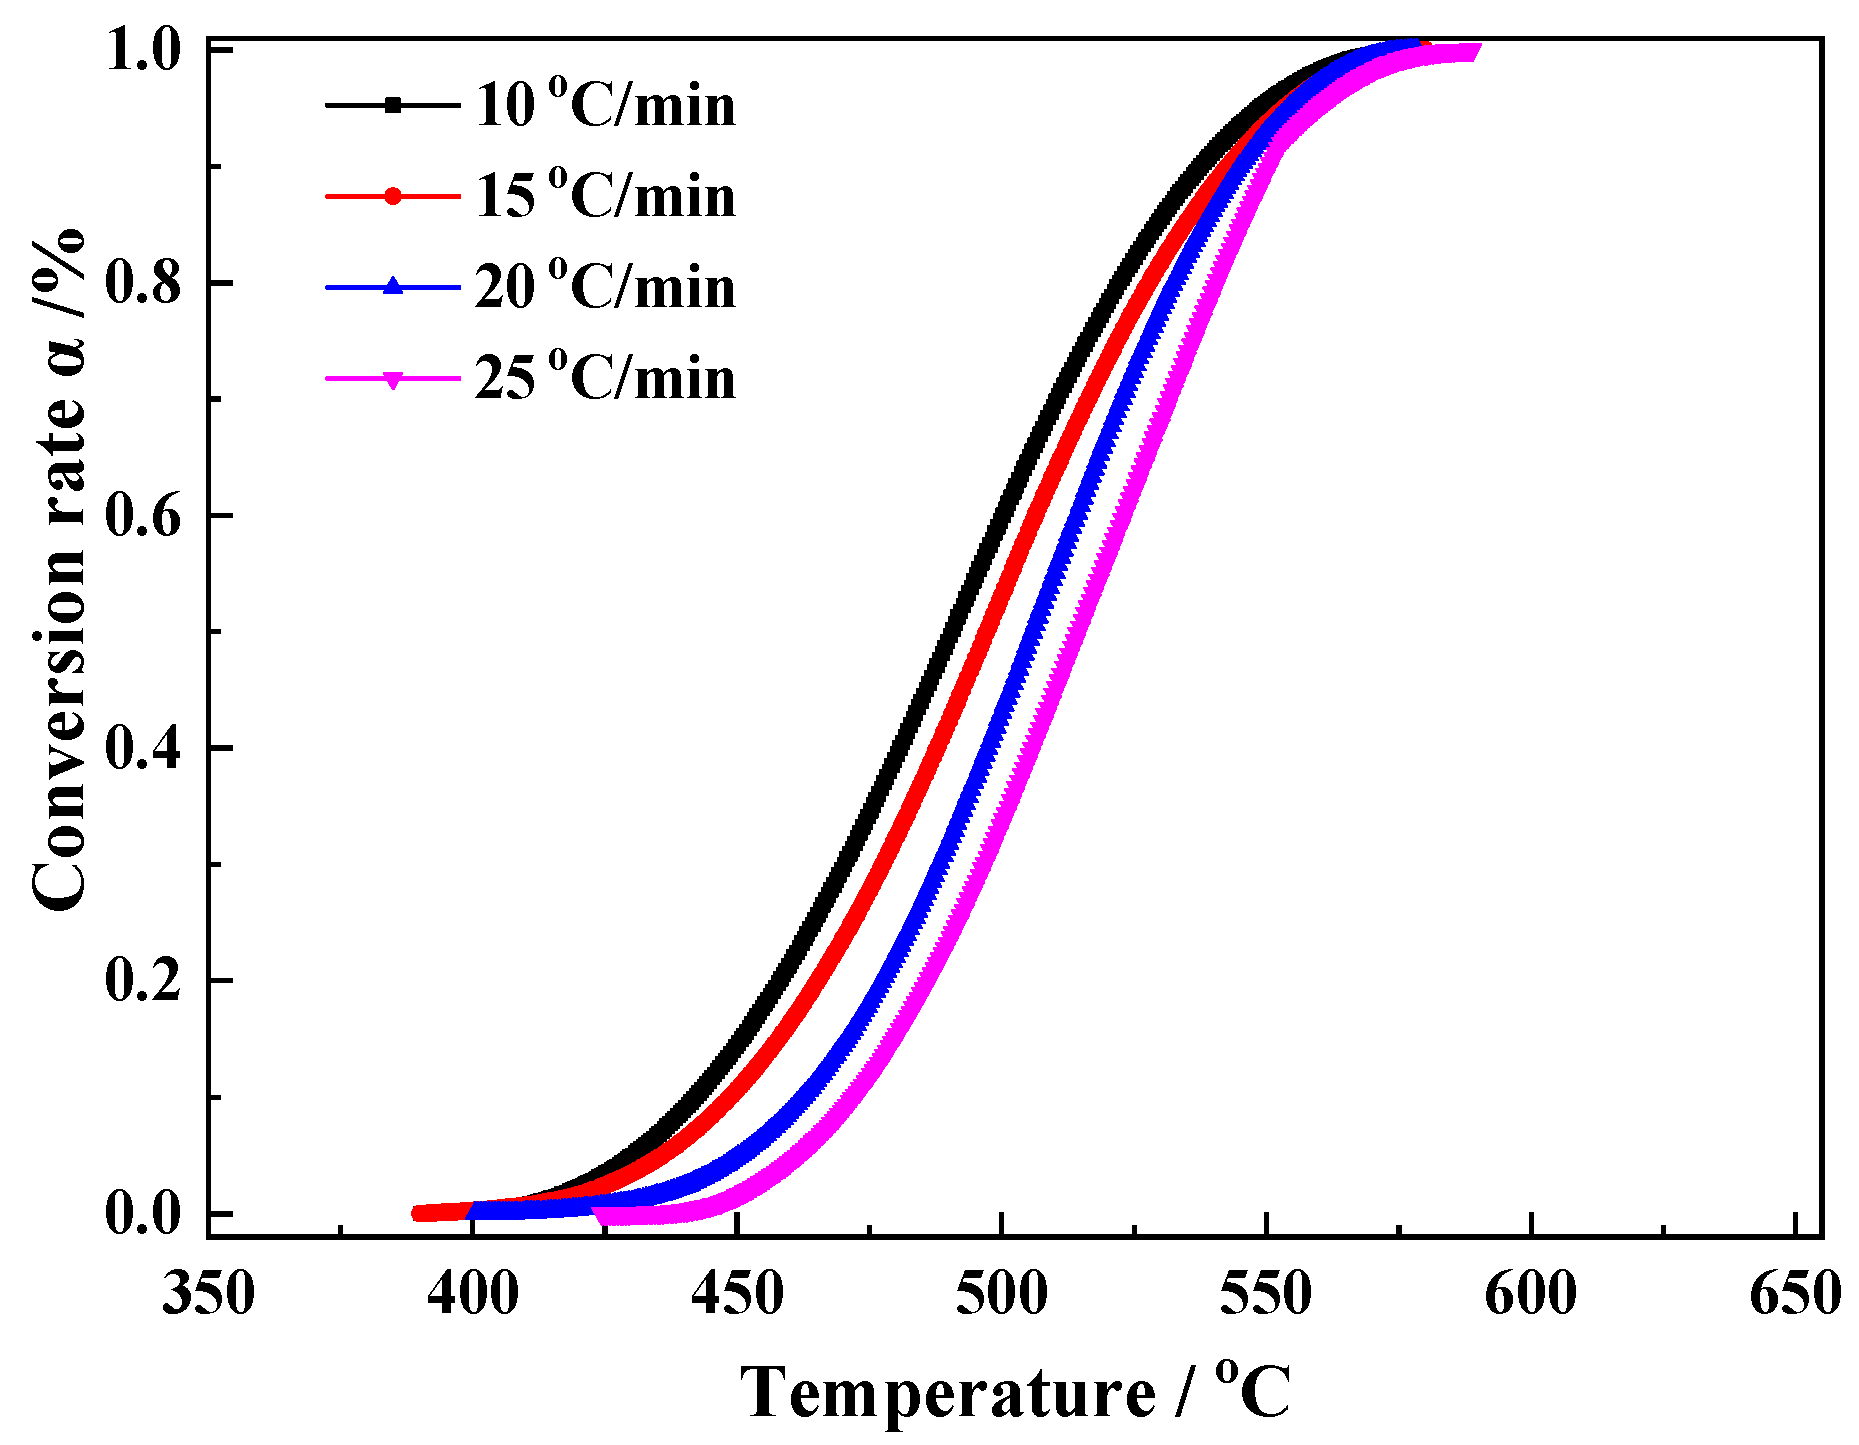
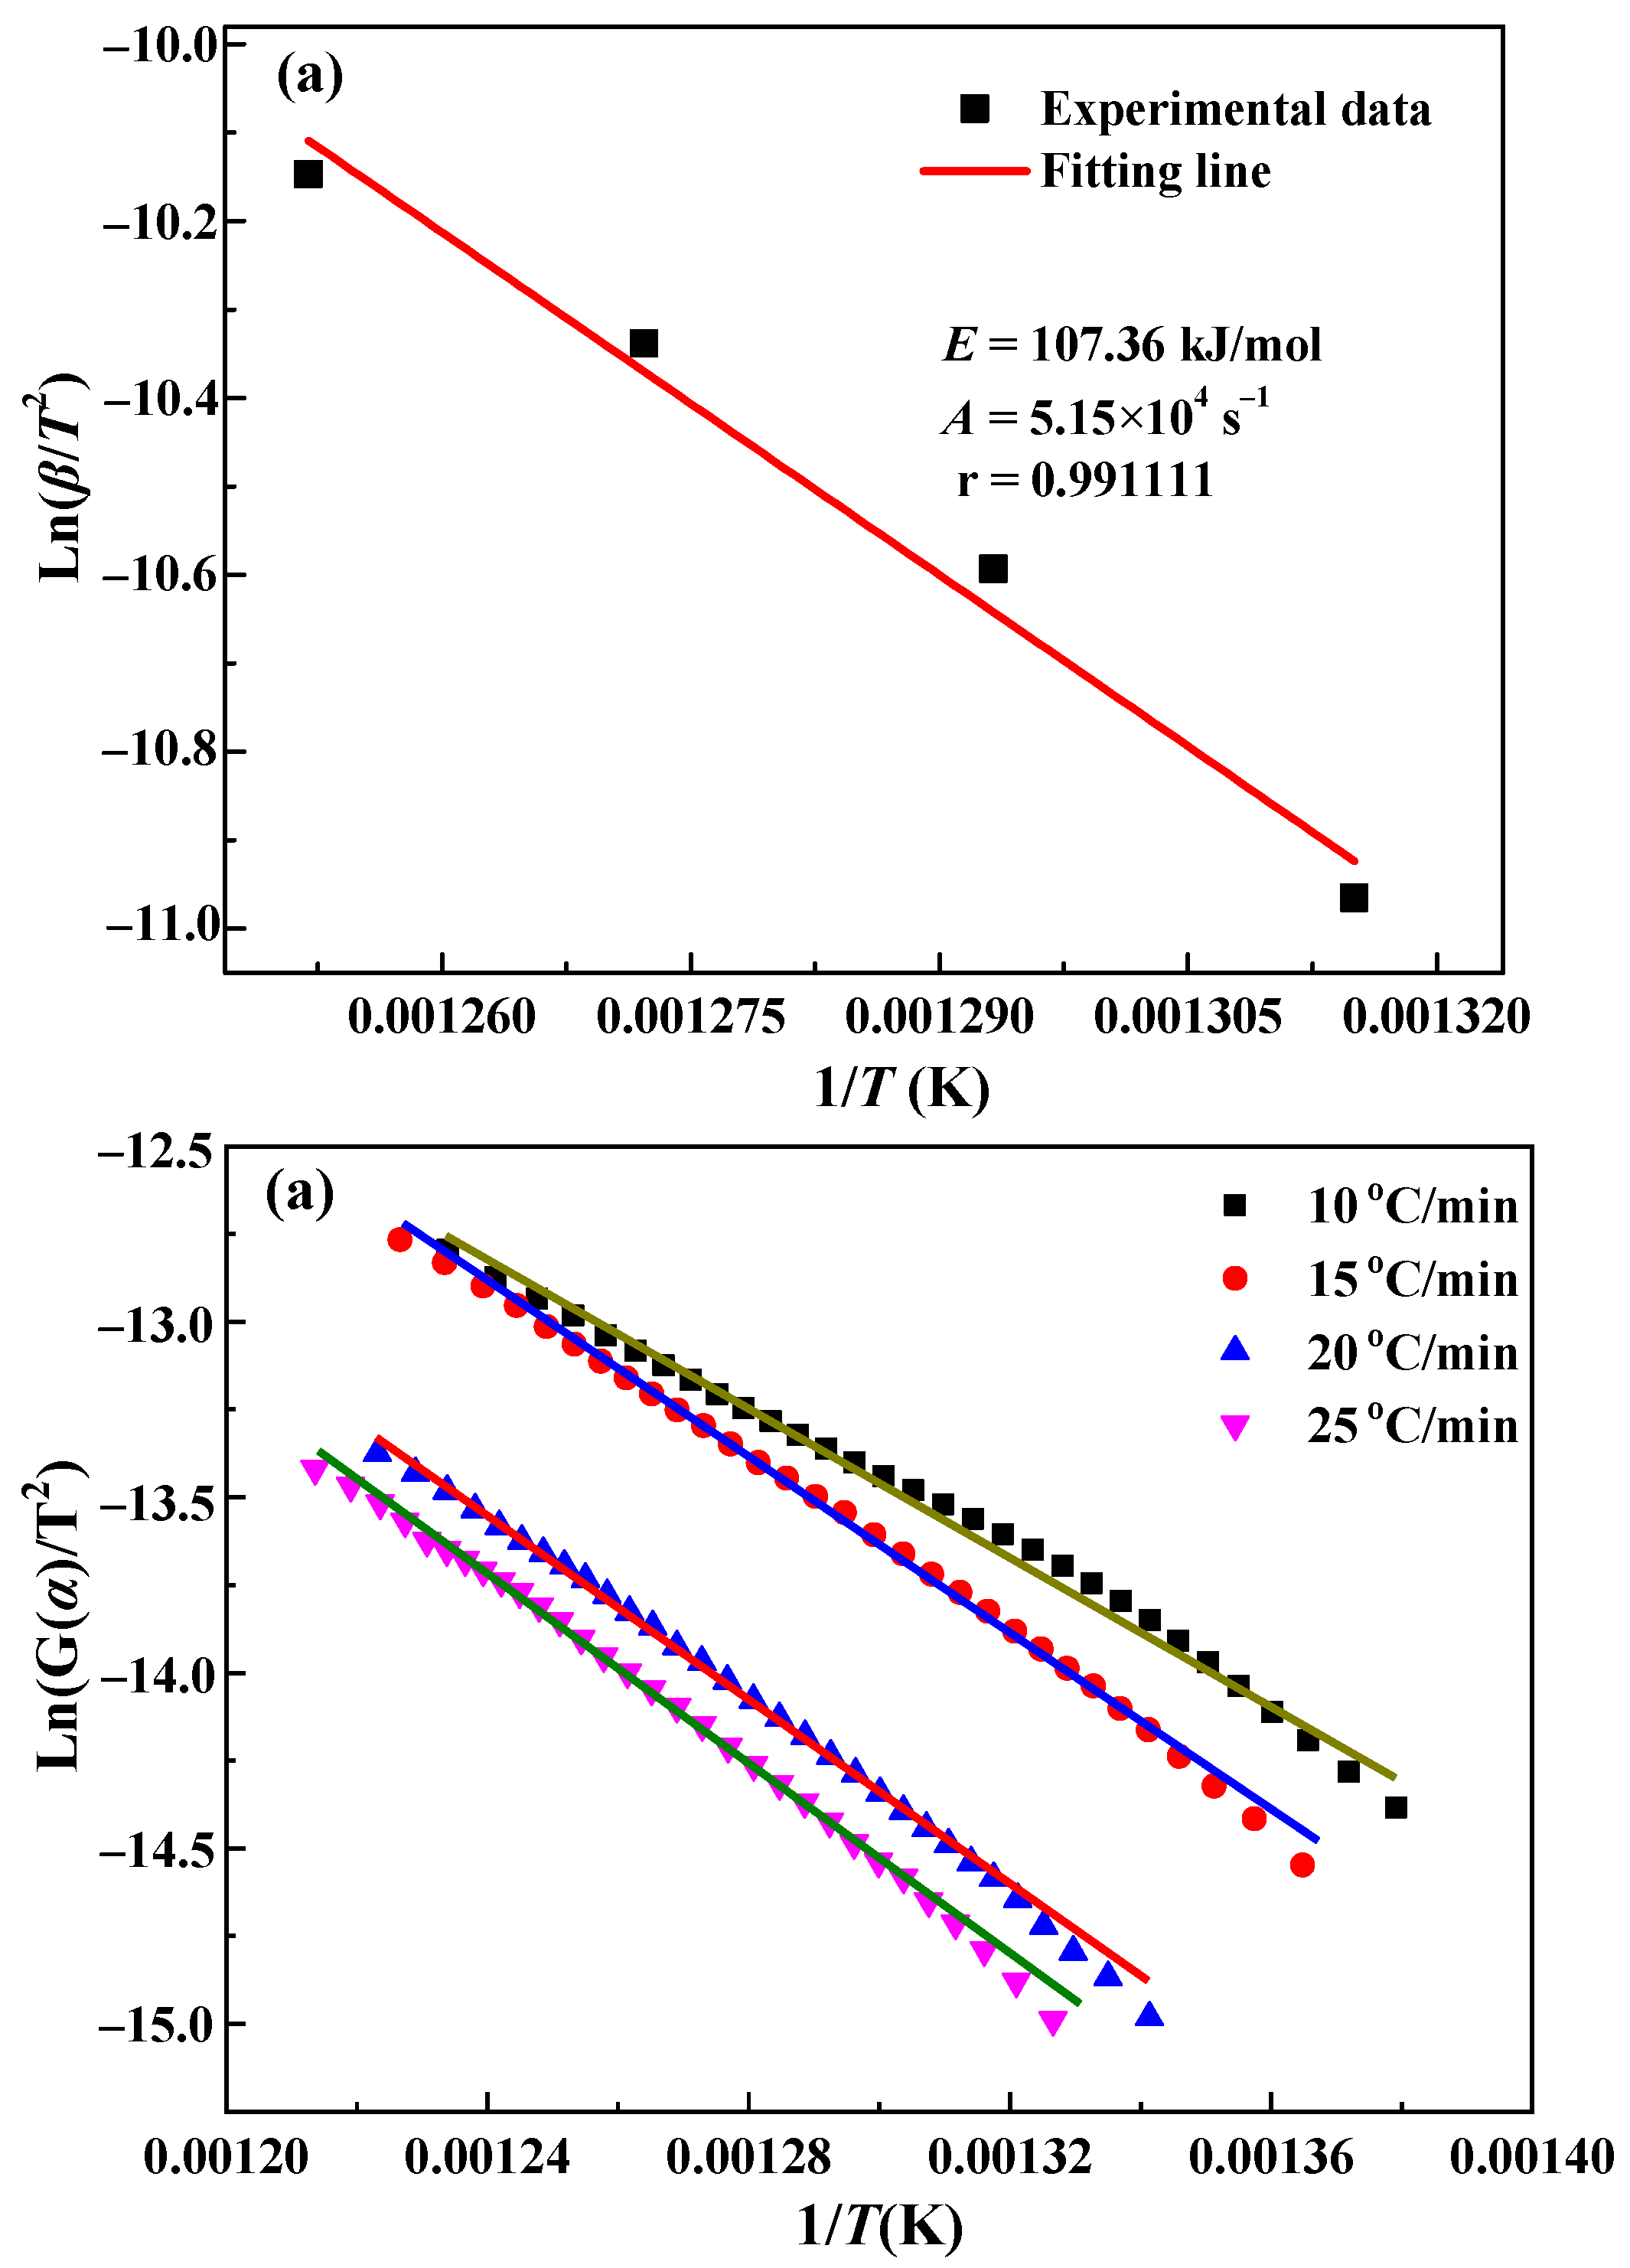
3.2. Kinetics Analysis

The key to the development of the integrated utilization technology of siderite is the kinetics characteristics of the magnetization reaction. Characterization of the magnetization reaction kinetics of siderite is difficult due to the lack of available real-time techniques for the measurement of iron minerals during magnetization roasting. However, the decomposition of FeCO3 in siderite and the formation of magnetite are almost synchronous, so the TG data of FeCO3 decomposition can be used in kinetic calculations. The reaction conversion α can be calculated from the TG data at four heating rates of 10 °C/min, 15 °C/min, 20 °C/min, and 25 °C/min, according to Equation (3), and the graph of αT is plotted in Figure 8.
Reaction kinetics were calculated using the Kissinger and general integral methods. The Kissinger method adopts the peak temperature labeled in Figure 4b for kinetic calculations according to Equation (4). The general integration method uses the αT data shown in Figure 7 to perform a linear fit according to Equation (5), thereby allowing the calculation of the kinetic parameters E, A, and G(α). The 41 G(α) functions listed in the literature were fitted and calculated sequentially [23]. The results show that the highest linearity is observed for mechanism function No. 15. The plots fitted using the Kissinger and general integral methods using function No. 15 are shown in Figure 9a,b, respectively.
The fitting results shown in Figure 9 are listed in full in Table 2.
As shown in Table 2, the linear correlation coefficients, r, for both the Kissinger and general integration methods are >0.99. The relative deviation of the activation energy of the two methods is only 1.23%, indicating that the fitting results are reasonable. The mechanism of mechanism function No. 15 is random nucleation and growth, indicating that the magnetization roasting reaction of siderite is controlled by the nucleation and growth rate of magnetite [23]. The expression of mechanism function No. 15 is as follows.
G ( α ) = [ L n ( 1 α ) ] 3 4
The kinetic equation for the magnetization roasting reaction of siderite is obtained by taking the average value of the general integration method as the final result, as follows:
[ L n ( 1 α ) ] 3 4 = 3.51 × 10 5 e x p ( 106.1 R T ) t
The time required for complete magnetization of siderite at different temperatures can be predicted using the kinetic equations, thus providing basic parameters for process design and reaction control. Table 3 shows the predicted results of the time required for the magnetization of siderite in the range of 600–780 °C using the kinetic Equation (11).
The kinetics predictions show that the times required to complete the magnetization of the siderite are 27.02 s, 12.24 s, 6.02 s, 3.17 s, and 2.22 s for calcination at 600 °C, 650 °C, 700 °C, 750 °C, and 780 °C, respectively. At 700–780 °C, it only took a few seconds to complete the magnetization of siderite, providing a basis for the design of the conveyor bed magnetization roasting reactor.

3.3. Characterization of Roasted Ore

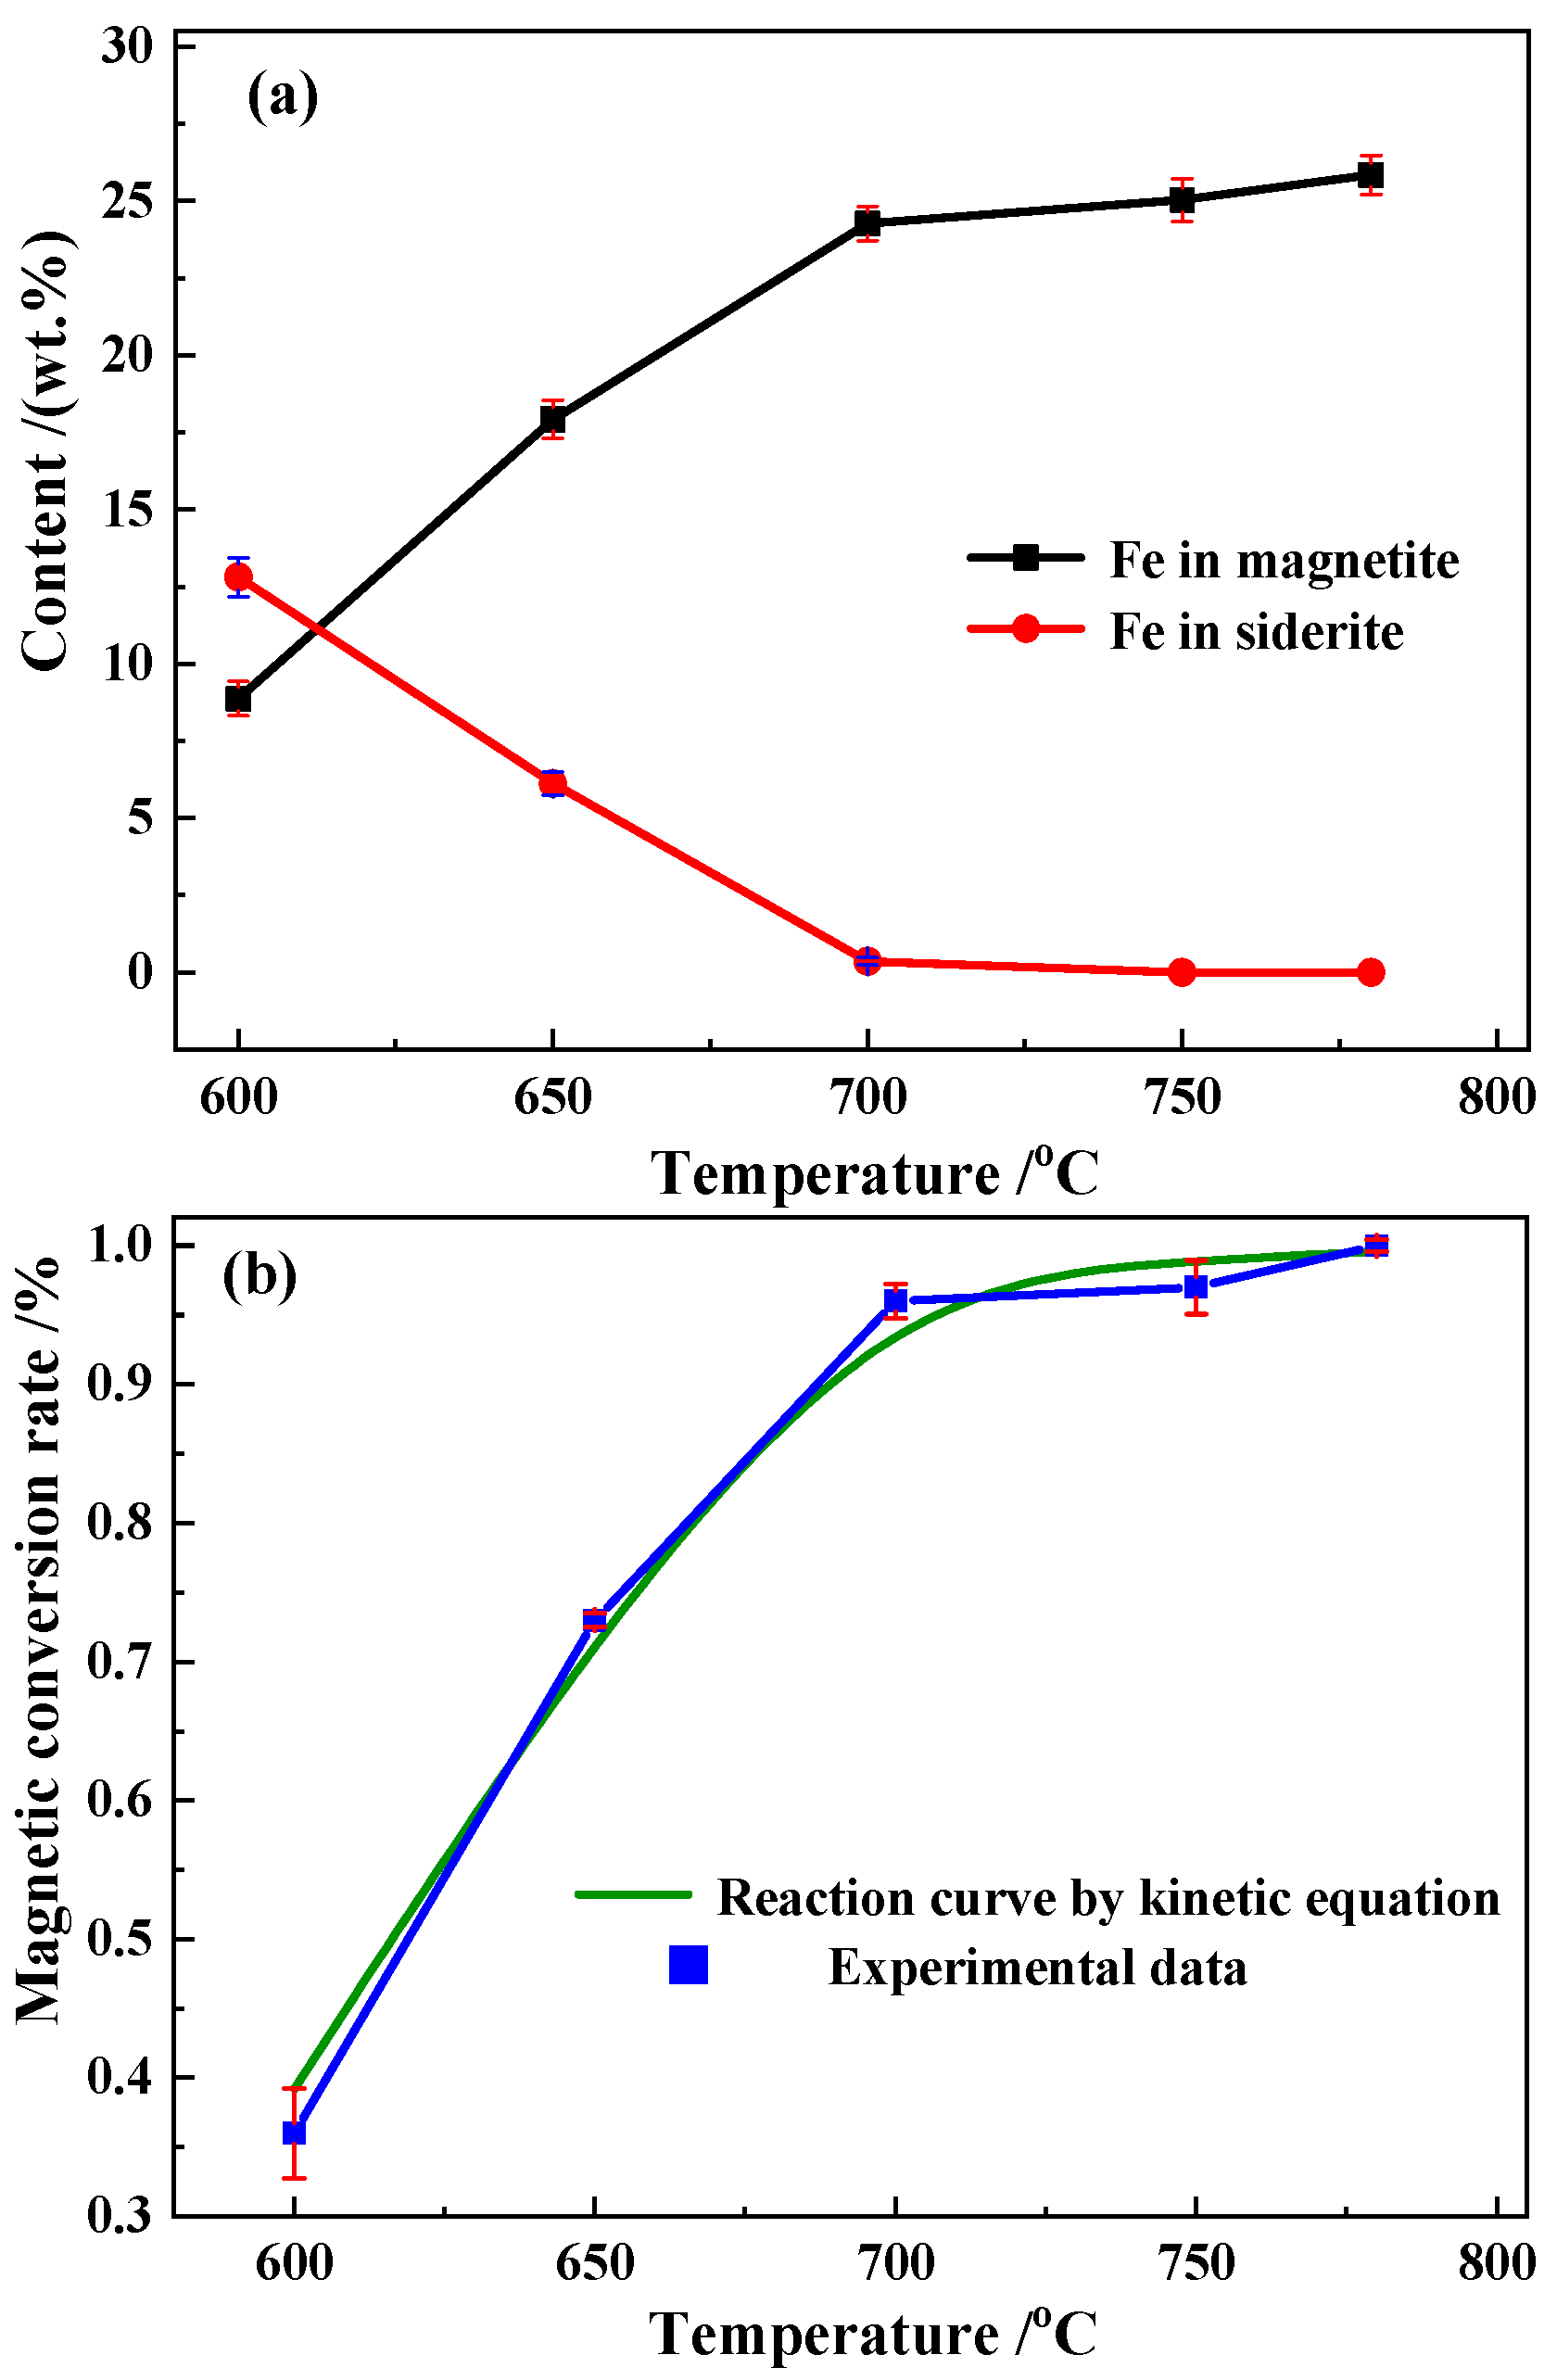
3.3.1. Magnetic Conversion Analysis
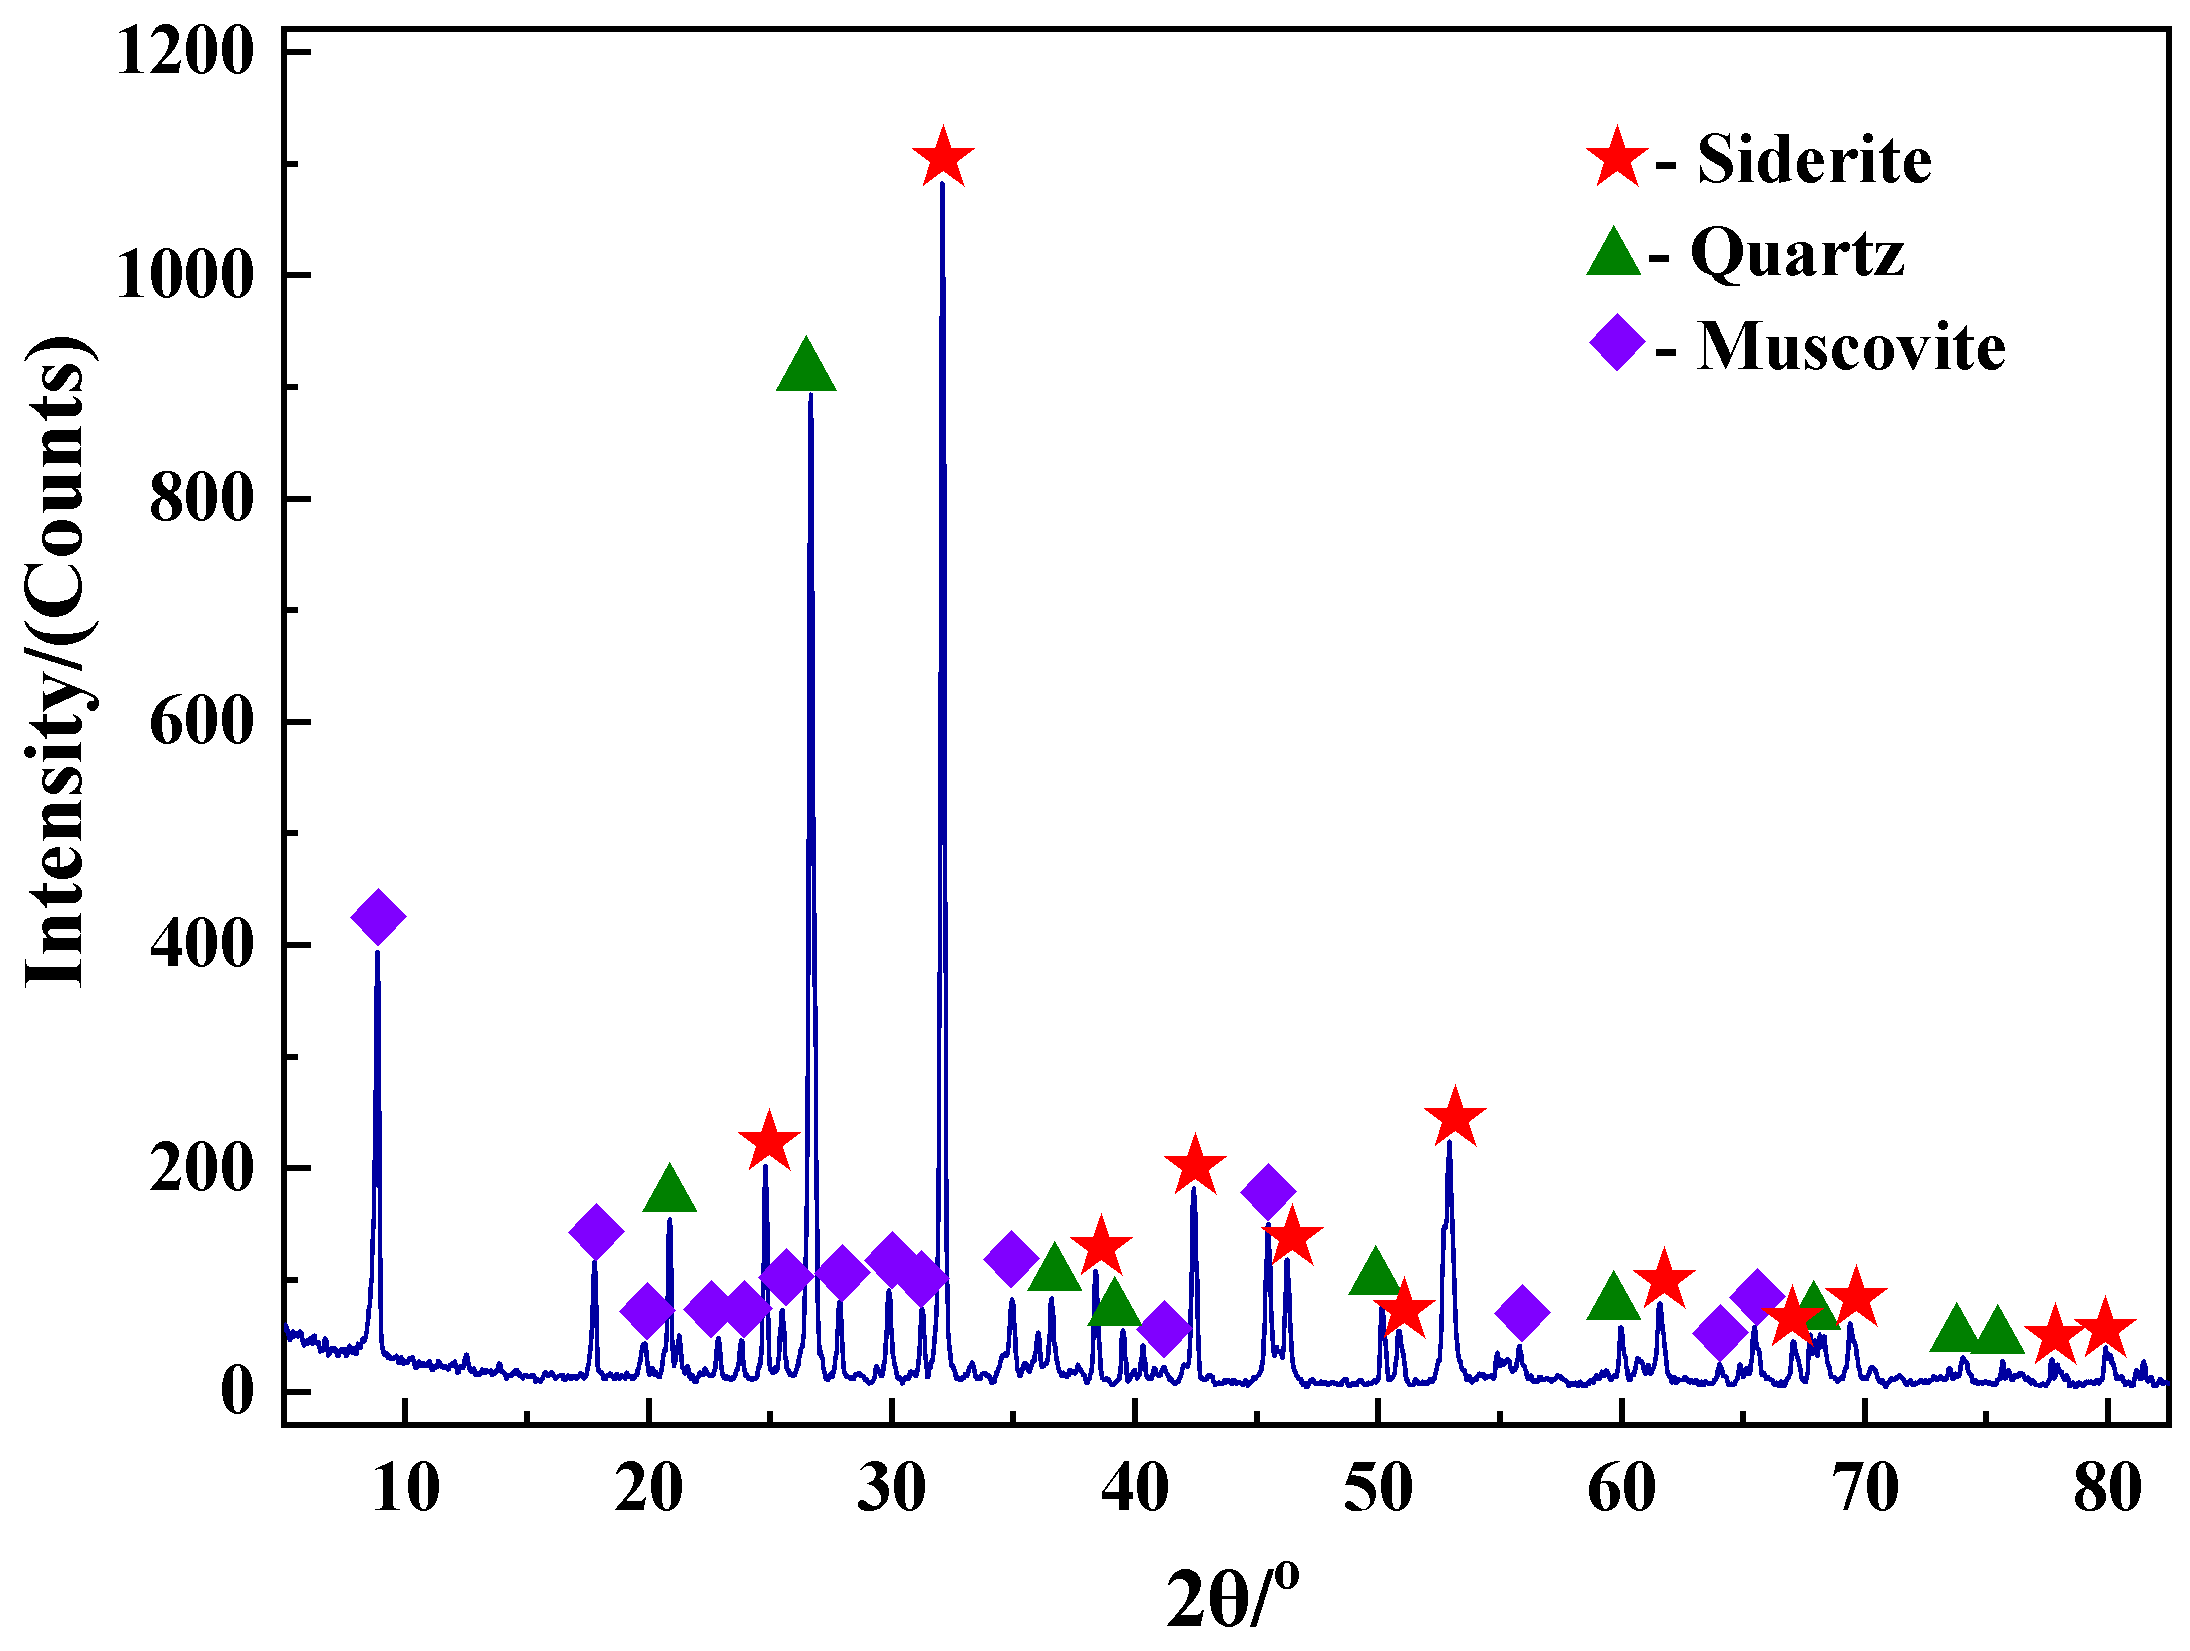
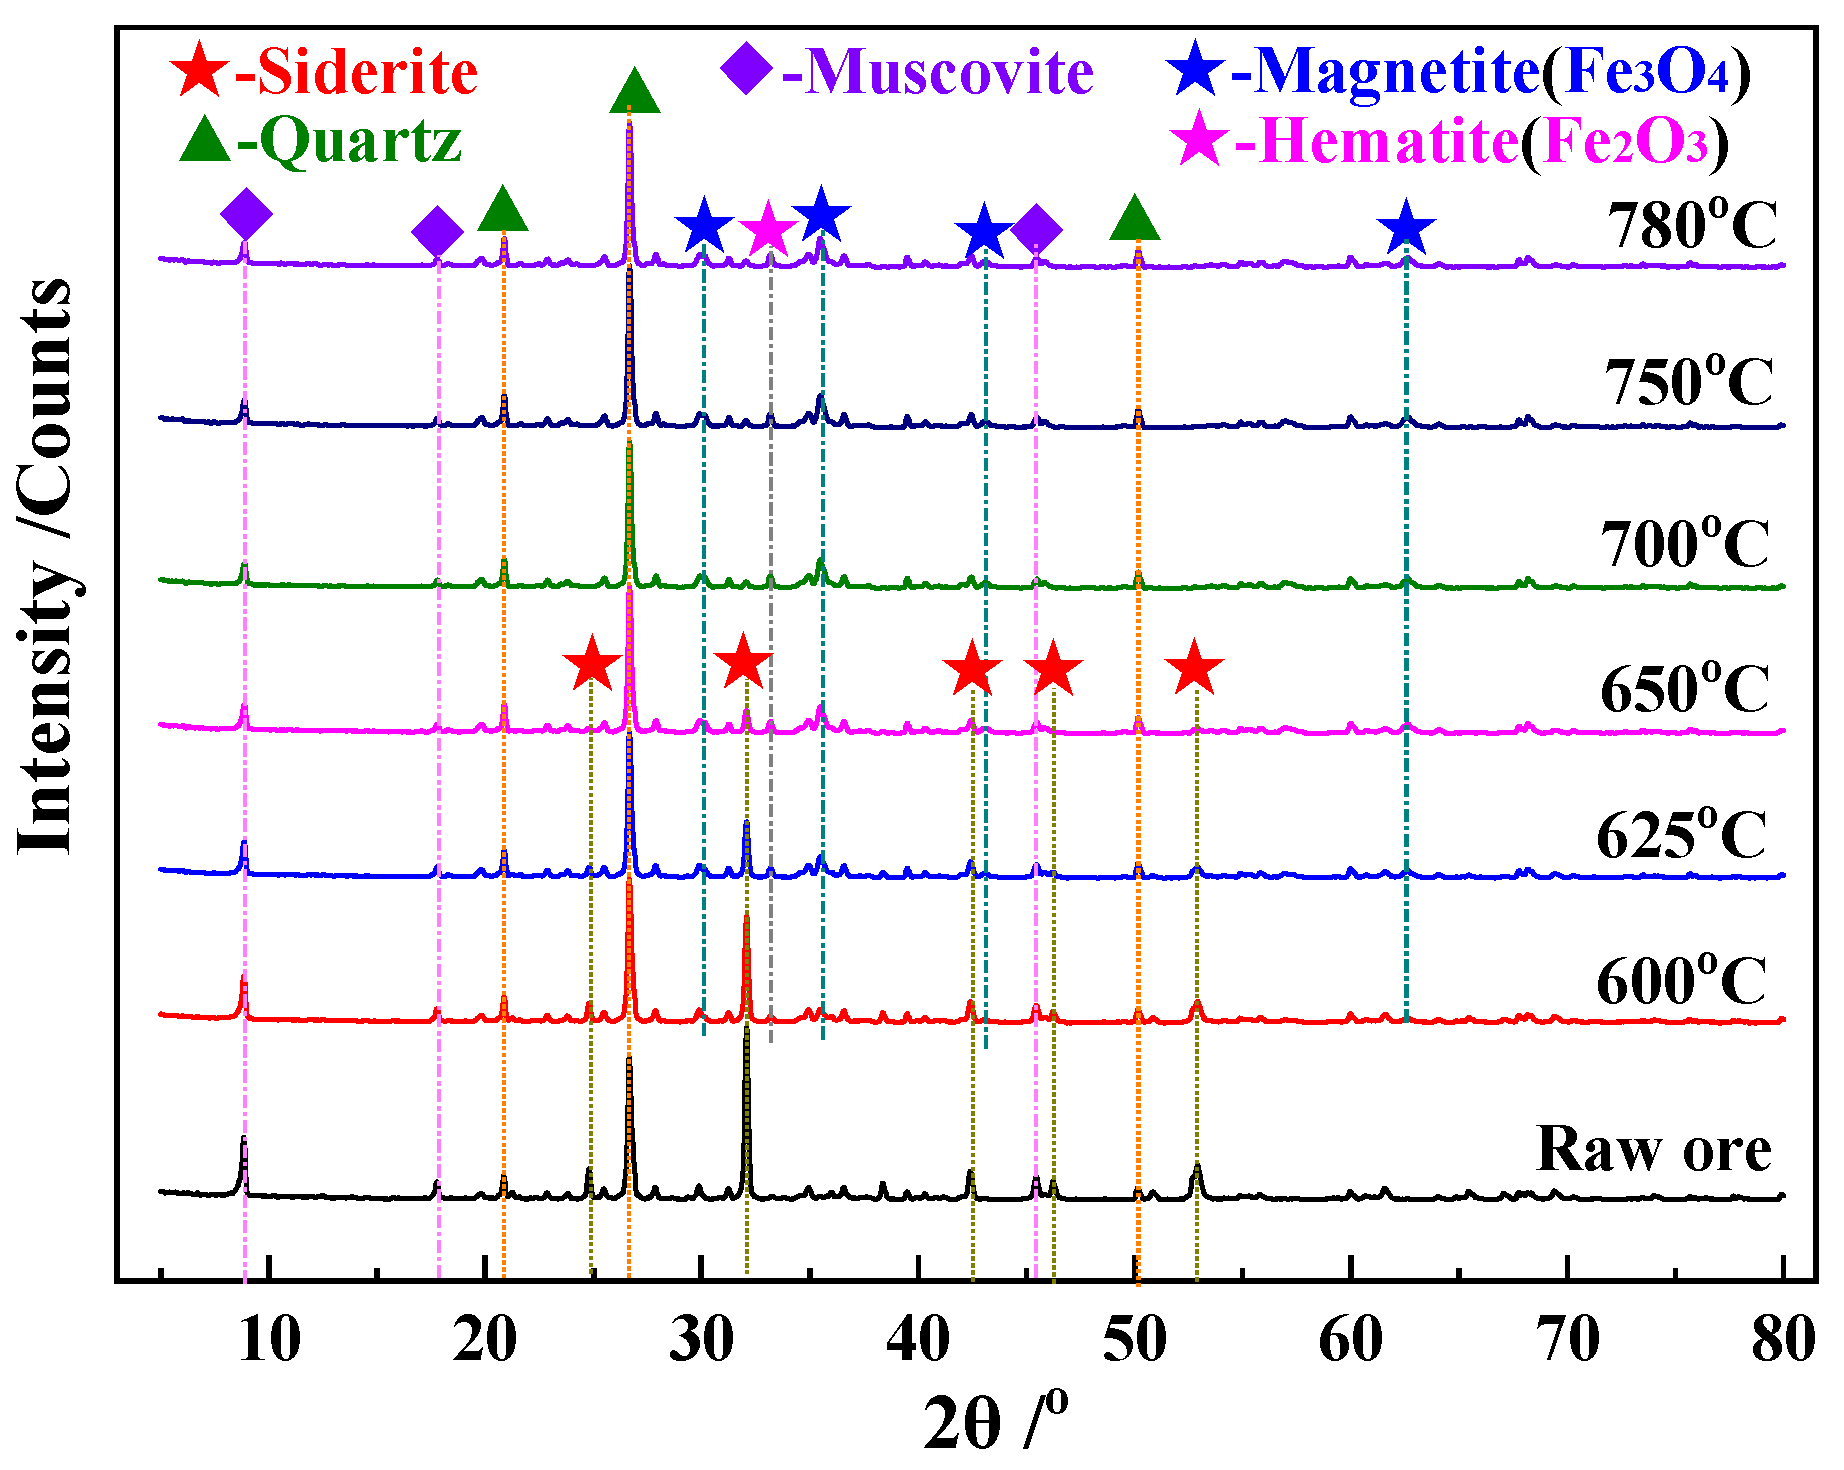
A conveyor bed roasting pilot test system was used for the magnetization roasting of siderite. over a temperature range of 600–780 °C, with an effective residence time of the material in the suspension reactor of around 3.5 s. A total of five temperatures were set for the pilot run of 72 h, with each temperature used for 12 h. Samples were taken every 2 h, with a total of six samples collected at each temperature. The average values of the analytical results of the iron minerals and magnetic conversion of the six roasted ores are listed in Table 4.
As shown in Table 4, the decomposition of FeCO3 in siderite was completed at roasting temperatures of 750 °C and 780 °C, with magnetic conversions of >0.99 within an effective residence time of approximately 3.5 s. The experimental results confirm that the conveyor bed process system is effective for the application of the magnetized roasting of siderite. The use of a three-stage suspension cooling process enables rapid cooling of the roasted ore to <200 °C and prevents the oxidation of magnetite [28,29,30]. The low hematite (magnetite) content of the roasted ore confirmed that the cooling process was effective. Compared to the ore roasted at 780 °C, ore roasted at 750 °C exhibits the highest magnetite grade and is calcined at a lower temperature, representing more optimal conditions.
The changes in FeCO3 and magnetite during the roasting of siderite are shown in Figure 10a. The experimental data of magnetic conversion compared with the predicted kinetics results are shown in Figure 10b.
Figure 10b shows that the kinetically predicted magnetic conversion curves are in agreement with the trends in the experimental data. The deviation of the data was <3.8%, indicating that the kinetic model was reasonable. It was thus, feasible to use the kinetic equations for the parameterized design and production control of the conveyor bed process system.

3.3.2. XRD Analysis

XRD patterns of the roasted ore are shown in Figure 11.
As shown in Figure 11, the FeCO3 in siderite decomposes almost completely at 700 °C, and magnetite starts to be produced in large quantities at 650 °C, with its XRD peak intensity remaining almost unchanged >700 °C. Overall, the results of the XRD analysis are in general agreement with the data presented in Table 4.

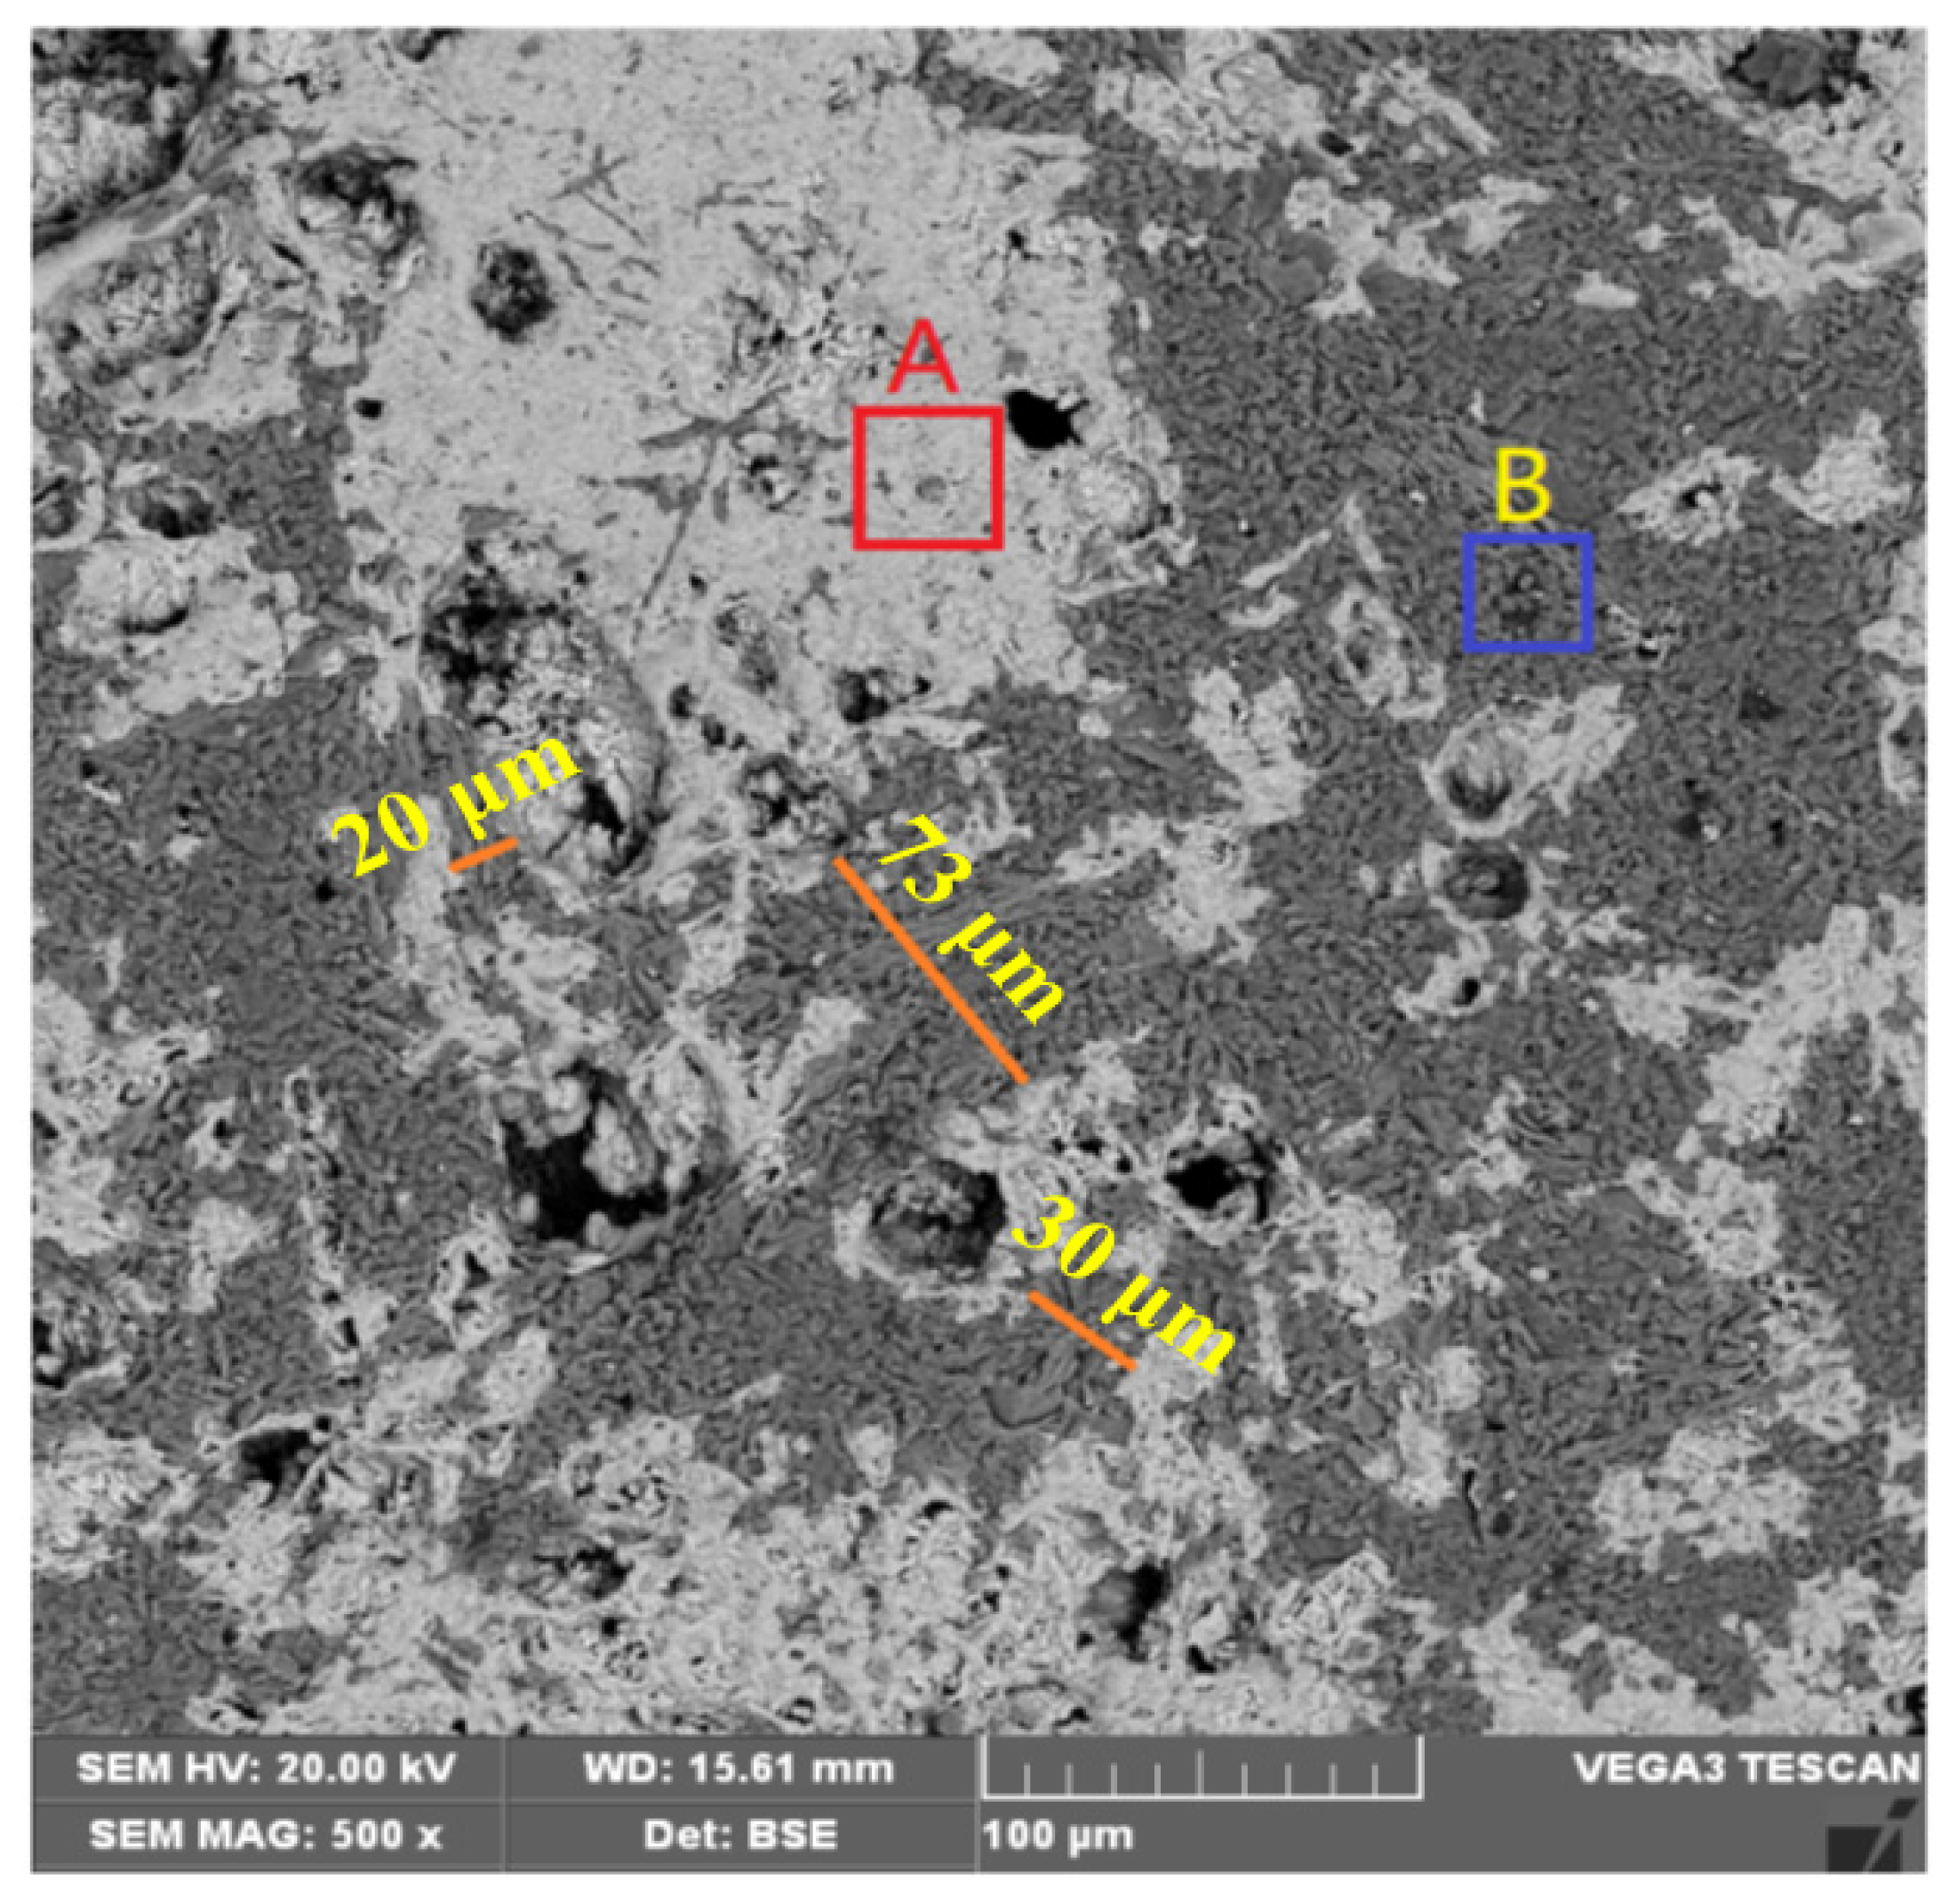
3.3.3. BSE-EDS Analysis

A BSE image of the magnetized ore roasted at 750 °C is shown in Figure 12. The results of the EDS analysis of regions A and B are shown in Table 5.
According to the EDS analysis of Figure 12, region A is dominated by magnetite, with region B dominated by quartz and muscovite. The distribution state of the magnetite and veinstone minerals is more complex. Magnetite distributed in large continuous masses can be well dissociated on a scale of 50–80 μm. However, for magnetite distributed as microfine particles interspersed with veinlets, dissociation needs to occur on a scale of 20–30 μm, therefore necessitating ultra-fine grinding.

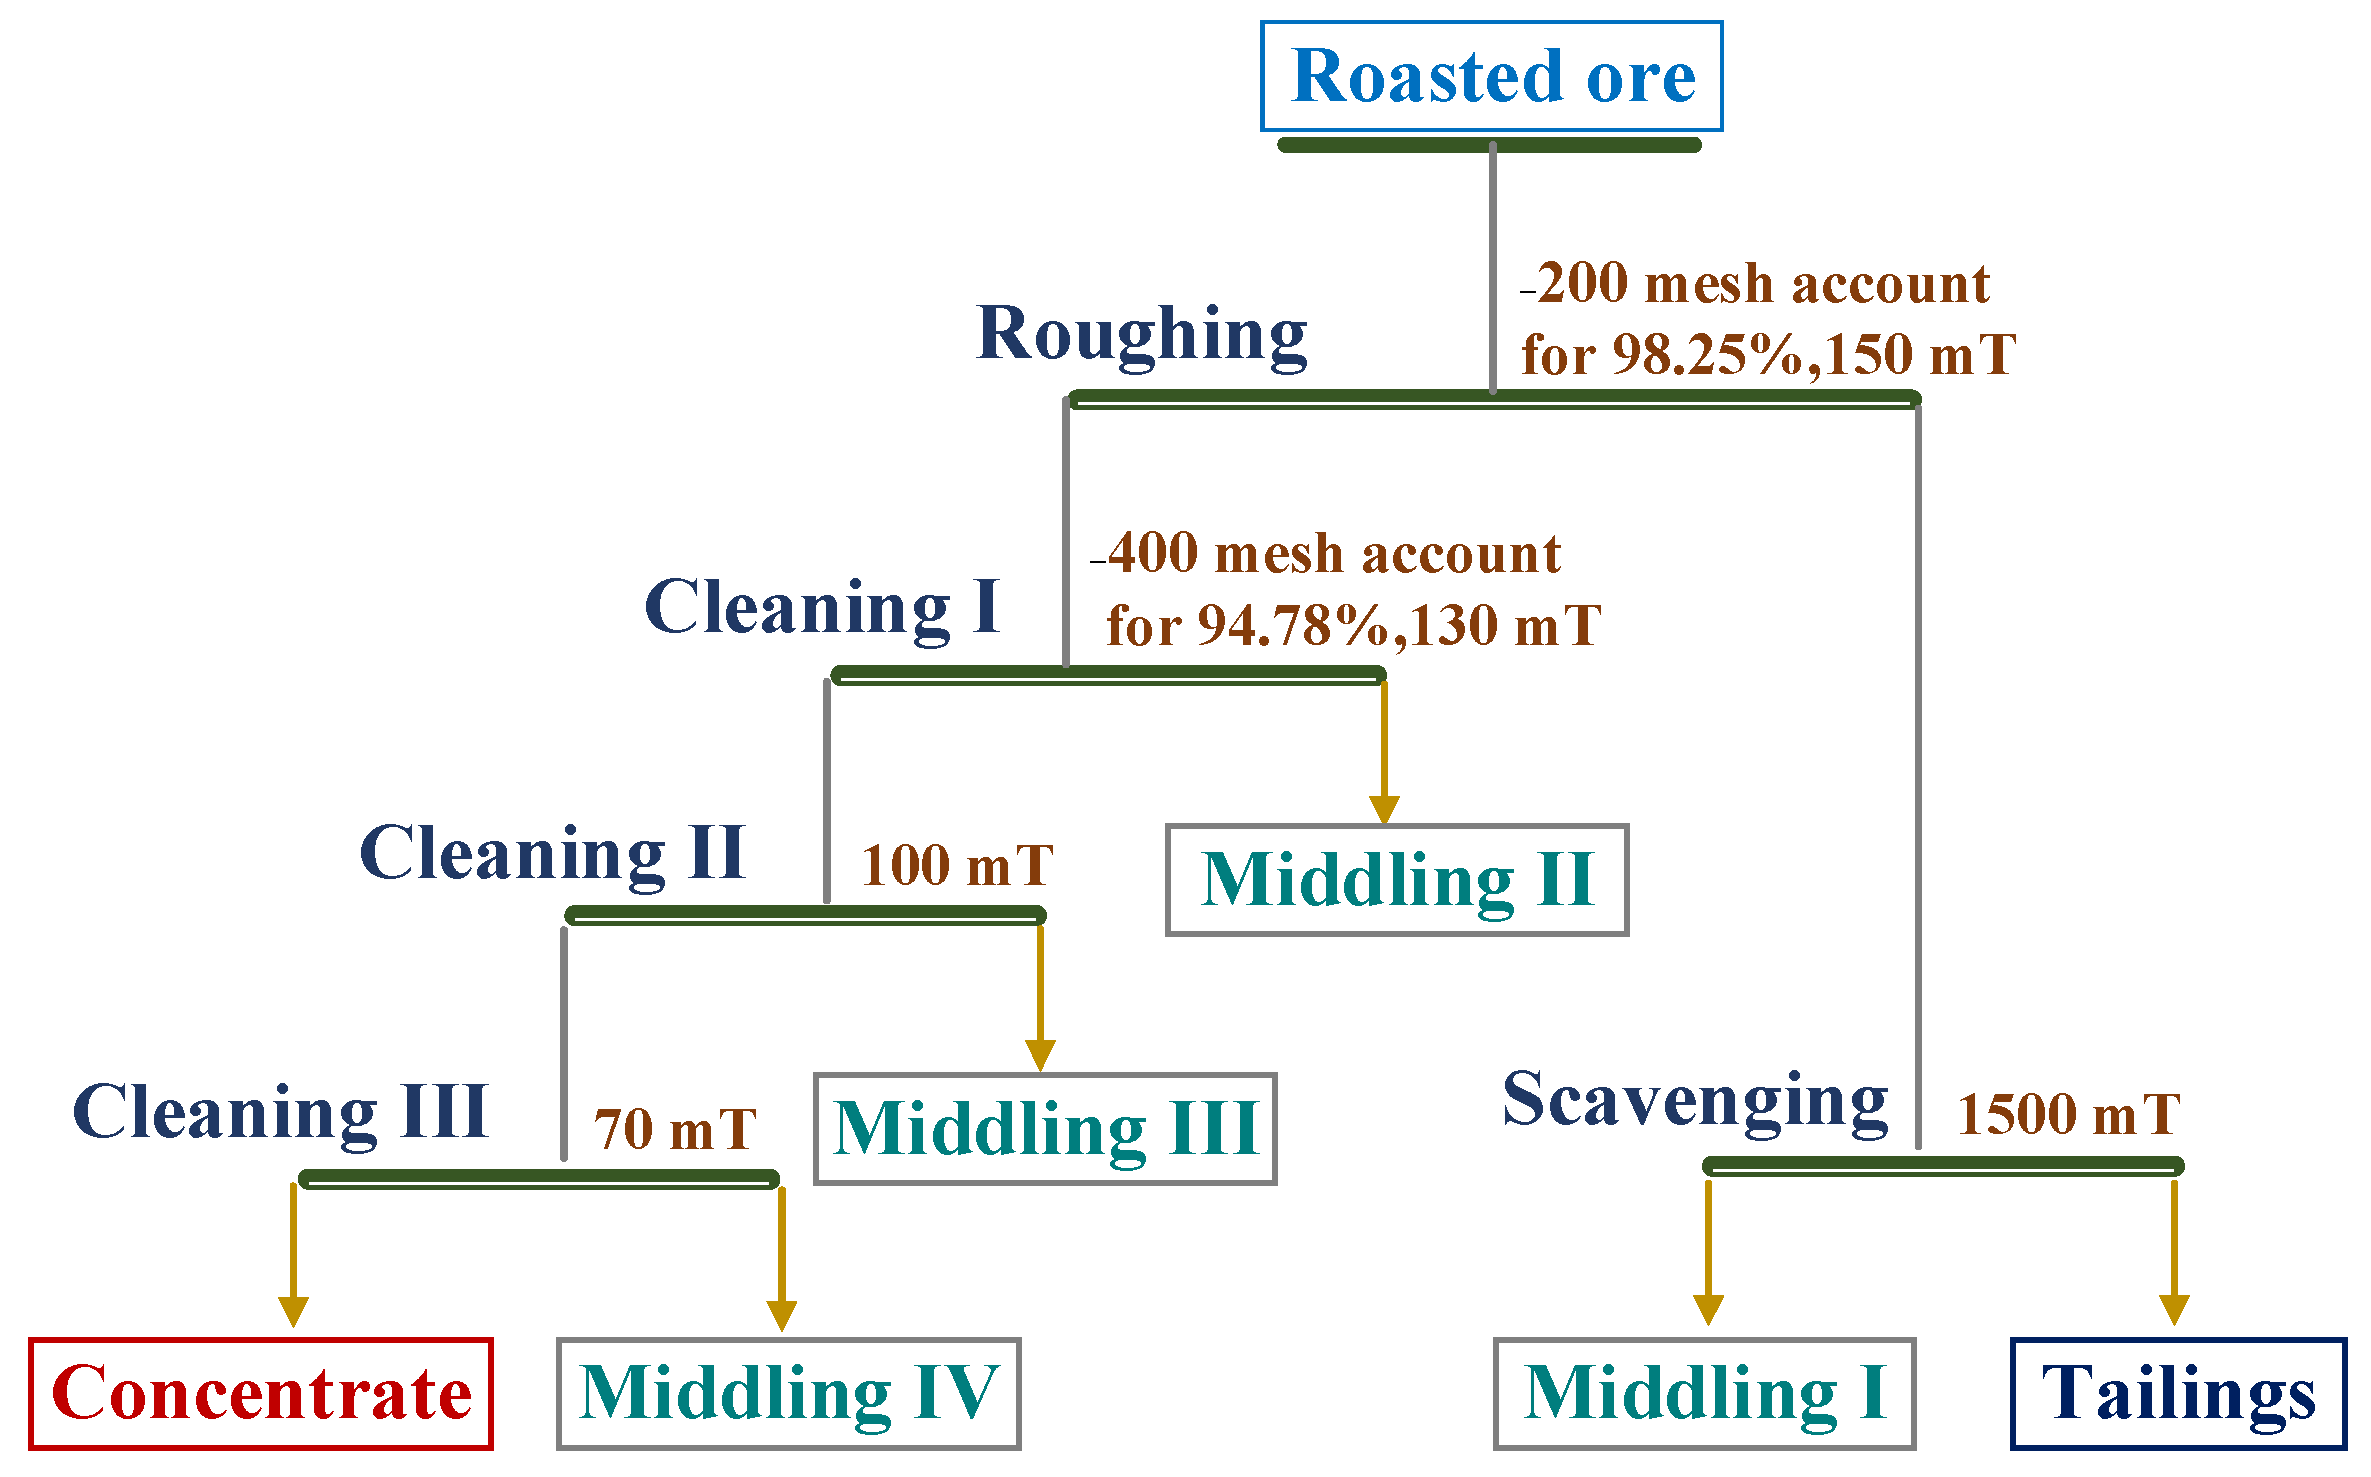
3.4. Magnetic Separation Analysis

The roasted ore produced by the conveyor bed magnetization roasting system at 750 °C was magnetically sorted according to the beneficiation process shown in Figure 3. The products from the beneficiation process were analyzed in terms of their iron grade, recovery, and yield, with the results shown in Table 6.
The final iron grade of the concentrate obtained after the multi-stage magnetic separation process was 62.80 wt.% with a recovery of 68.83%, which meets the requirements of steel smelting, as shown in Table 6. The middling ore III and IV obtained in the beneficiation process can be re-added into the beneficiation process to improve the overall recovery in future applications. The conveyor bed magnetization roasting and magnetic separation processes were used to recover 68.83% Fe from Daxigou siderite ore. The processes are also suitable for the upgrading and utilization of low-grade siderite.

4. Conclusions

(1)
Magnetite was prepared by roasting siderite under an inert and reducing atmosphere, which was almost synchronous with the decomposition of siderite. The reaction mechanism of the magnetization roasting of magnetite was determined to be random nucleation and subsequent growth, with a reaction activation energy of 106.1 kJ/mol.
(2)
Roasted ore with a magnetic conversion of ≥0.99 was obtained using a conveyor bed system at 750 °C and 780 °C for around 3.5 s. Magnetite oxidation was prevented via the adoption of a three-stage suspended state air cooling process. The kinetic model predictions were consistent with the experimental results.
(3)
The conveyor bed magnetization roasting and magnetic separation process were suitable for the upgrading and utilization of low-grade iron ore. For the iron grade of Daxigou siderite with 21.42 wt.% original ore, a concentrate with an iron grade of 62.80 wt.% and a recovery rate of 68.83% was obtained after conducting the conveyor bed magnetization roasting and magnetic separation process.

Author Contributions

Conceptualization, Y.C., S.J. and F.C.; methodology, S.J.; validation, Y.C.; formal analysis, S.J. and B.Z.; investigation, C.Y.; resources, B.Z.; data curation, C.Y.; Writing the manuscript, S.J.; supervision, F.C.; project administration, Y.C. All authors have read and agreed to the published version of the manuscript.

Funding

This research was funded by Shaanxi Provincial Natural Science Basic Research Program (Grant No. 2019JLZ-05) in China.

Institutional Review Board Statement

Not applicable.

Informed Consent Statement

Not applicable.

Data Availability Statement

The data used to support the findings of this study are available from the corresponding author upon request.

Acknowledgments

The authors would like to thank Aiwu Yang, senior engineer of Xi’an Boyan Instrument Analysis and Application Technology Company, for her help in testing and analysis of this paper.

Conflicts of Interest

The authors declare no conflict of interest.

References

  1. Ponomar, V.; Dudchenko, N.; Brik, A. Phase transformations of siderite ore by the thermomagnetic analysis data. J. Magn. Magn. Mater. 2017, 423, 373–378. [Google Scholar] [CrossRef]
  2. Sun, Y.; Zhu, X.; Han, Y.; Li, Y. Green magnetization roasting technology for refractory iron ore using siderite as a reductant. J. Clean. Prod. 2019, 206, 40–50. [Google Scholar] [CrossRef]
  3. Wang, D.; Pan, J.; Zhu, D.; Guo, Z.; Yang, C.; Yuan, Z. An efficient process to upgrade siderite ore by preoxidation-magnetization roasting-magnetic separation-acid leaching. J. Mater. Res. Technol. 2022, 19, 4296–4307. [Google Scholar] [CrossRef]
  4. Zhu, X.; Han, Y.; Sun, Y.; Li, Y.; Wang, H. Siderite as a novel reductant for clean utilization of refractory iron ore. J. Clean. Prod. 2020, 245, 118704. [Google Scholar] [CrossRef]
  5. Ponomar, V.; Dudchenko, N.; Brik, A. Reduction roasting of hematite to magnetite using carbohydrates. Int. J. Miner. Process. 2017, 164, 21–25. [Google Scholar] [CrossRef]
  6. Subhnit, K.; Deepak, N.; Swagat, S. A review on the enrichment of iron values of low-grade Iron ore resources using reduction roasting-magnetic separation. Powder Technol. 2020, 367, 796–808. [Google Scholar]
  7. Rath, S.; Dhawan, N.; Rao, D.; Das, B.; Mishra, B. Beneficiation studies of a difficult to treat iron ore using conventional and microwave roasting. Powder Technol. 2016, 301, 1016–1024. [Google Scholar] [CrossRef]
  8. Zhang, Q.; Sun, Y.; Han, Y.; Li, Y. Pyrolysis behavior of a green and clean reductant for suspension magnetization roasting. J. Clean. Prod. 2020, 268, 122173. [Google Scholar] [CrossRef]
  9. Ponomar, V.; Dudchenko, N.; Brik, A. Synthesis of magnetite powder from the mixture consisting of siderite and hematite iron ores. Miner. Eng. 2018, 122, 277–284. [Google Scholar] [CrossRef]
  10. Zhang, Q.; Sun, Y.; Han, Y.; Li, Y.; Gao, P. Producing magnetite concentrate via self-magnetization roasting in N2 atmosphere: Phase and structure transformation, and extraction kinetics. J. Ind. Eng. Chem. 2021, 104, 571–581. [Google Scholar] [CrossRef]
  11. Zhang, Q.; Sun, Y.; Han, Y.; Gao, P.; Li, Y. Thermal decomposition kinetics of siderite ore during magnetization roasting. Min. Metall. Explor. 2021, 38, 1497–1508. [Google Scholar] [CrossRef]
  12. Kamariah, N.; Kalebic, D.; Xanthopoulos, P.; Blannin, R.; Araujo, F.; Koelewijn, S.; Dehaen, W.; Binnemans, K.; Spooren, J. Conventional versus microwave-assisted roasting of sulfidic tailings: Mineralogical transformation and metal leaching behavior. Miner. Eng. 2022, 183, 107587. [Google Scholar] [CrossRef]
  13. Zhou, W.; Sun, Y.; Han, Y.; Gao, P.; Li, Y. Recycling iron from oolitic hematite via microwave fluidization roasting and magnetic separation. Miner. Eng. 2021, 164, 106851. [Google Scholar] [CrossRef]
  14. Yuan, S.; Xiao, H.; Wang, R.; Li, Y.; Gao, P. Improved iron recovery from low-grade iron ore by efficient suspension magnetization roasting and magnetic separation. Miner. Eng. 2022, 186, 107761. [Google Scholar] [CrossRef]
  15. Tang, Z.; Zhang, Q.; Sun, Y.; Gao, P.; Han, Y. Pilot-scale extraction of iron from flotation tailings via suspension magnetization roasting in a mixture of CO and H2 followed by magnetic separation. Resour. Conserv. Recycl. 2021, 172, 105680. [Google Scholar] [CrossRef]
  16. Zhang, X.; Han, Y.; Sun, Y.; Li, Y. Innovative utilization of refractory iron ore via suspension magnetization roasting: A pilot-scale study. Powder Technol. 2019, 352, 16–24. [Google Scholar] [CrossRef]
  17. Yuan, S.; Ding, H.; Wang, R.; Zhang, Q.; Li, Y.; Gao, P. The mechanism of suspension reduction on Fe enrichment with low-grade carbonate-containing iron ore. Adv. Powder Technol. 2022, 33, 103643. [Google Scholar] [CrossRef]
  18. Coenen, K.; Gallucci, F.; Mezari, B.; Hensen, E.; Van Sint Annaland, M. An in-situ IR study on the adsorption of CO2 and H2O on hydrotalcites. J. CO2 Util. 2018, 24, 228–239. [Google Scholar] [CrossRef]
  19. Song, Y.; Lei, S.; Li, J.; Yin, N.; Zhou, J.; Lan, X. In situ FT-IR analysis of coke formation mechanism during Copyrolysis of low-rank coal and direct coal liquefaction residue. Renew. Energy 2021, 179, 2048–2062. [Google Scholar] [CrossRef]
  20. Ma, W.; Dong, X.; Wang, Y.; He, W.; Zhang, W.; Liang, Y.; Wang, Y.; Fu, W.; Liao, J.; Dong, F. Highly enhanced photocatalytic toluene degradation and in situ FT-IR investigation on designed Sn-doped BiOCl nanosheets. Appl. Surf. Sci. 2022, 578, 152002. [Google Scholar] [CrossRef]
  21. Vyazovkin, S.; Wight, C. Isothermal and nonisothermal kinetics of thermally stimulated reactions of solids. Int. Rev. Phys. Chem. 1998, 3, 407–433. [Google Scholar] [CrossRef]
  22. Budrugeac, P. On the use of the model-free way method for kinetic analysis of thermoanalytical data–advantages and limitations. Thermochim. Acta 2021, 706, 179063. [Google Scholar] [CrossRef]
  23. Hu, R.Z.; Shi, Q.Z. Thermal Analysis Kinetics, 1st ed.; Science Press: Beijing, China, 2001; pp. 127–154. [Google Scholar]
  24. Blaine, R.; Kissinger, H. Homer Kissinger and the Kissinger equation. Thermochim. Acta 2012, 540, 1–6. [Google Scholar] [CrossRef]
  25. Juan, J.; Francisco, P.; Guillermo, R. On the integration of kinetic models using a high-order Taylor series method. J. Chemom. 1992, 6, 231–246. [Google Scholar]
  26. Tokiwai, K.; Nakashima, S. Dehydration kinetics of muscovite by in situ infrared microspectroscopy. Phys. Chem. Miner. 2010, 37, 91–101. [Google Scholar] [CrossRef]
  27. Nakamoto, K. Infrared and Raman Spectra of Inorganic and Coordination Compounds Part A: Theory and Applications in Inorganic Chemistry, 6th ed.; John Wiley & Sons, Inc.: Hoboken, NJ, USA, 2009; pp. 149–299. [Google Scholar]
  28. Zhu, X.; Han, Y.; Sun, Y.; Gao, P.; Li, Y. Magnetite oxidation mechanism of the air-cooling stage for limonite ore magnetization roasting. Miner. Eng. 2022, 186, 107720. [Google Scholar] [CrossRef]
  29. Nunna, V.; Hapugoda, S.; Pownceby, M.; Sparrow, G. Beneficiation of low-grade, goethite-rich iron ore using microwave-assisted magnetizing roasting. Miner. Eng. 2021, 166, 106826. [Google Scholar] [CrossRef]
  30. Ravisankar, V.; Venugopal, R.; Bhat, H. Investigation on beneficiation of goethite-rich iron ores using reduction roasting fol lowed by magnetic separation. Miner. Process. Extr. Metall. 2019, 128, 175–182. [Google Scholar]
Figure 1. XRD pattern of siderite.
Materials 15 06260 g001
Figure 2. Conveyor bed magnetization roasting process system.
Materials 15 06260 g002
Figure 3. Flow chart of the magnetic separation process.
Materials 15 06260 g003
Figure 4. (a) TGA and (b) DTG curves for the roasting of siderite.
Materials 15 06260 g004
Figure 5. (a) 3D and (b) 2D FTIR spectra of the gaseous products.
Materials 15 06260 g005
Figure 6. Online in-situ IR spectra of siderite. 1,2−IR absorption bands of hydroxyl groups; 3−IR absorption band of carbonate groups; 4−IR absorption band of silicates; 5−absorption bands of iron oxides.
Materials 15 06260 g006
Figure 7. Two-dimensional IR of (a) magnetite–siderite and (b) roasted ore.
Materials 15 06260 g007
Figure 8. Conversion rate graph.
Materials 15 06260 g008
Figure 9. Kinetic fitting of the (a) Kissinger and (b) general integration methods.
Materials 15 06260 g009
Figure 10. (a) Magnetite and (b) magnetic conversion curves.
Materials 15 06260 g010
Figure 11. XRD patterns of the roasted ore recorded at different temperatures.
Materials 15 06260 g011
Figure 12. BSE image of the roasted ore.
Materials 15 06260 g012
Table 1. Chemical composition of siderite /(wt.%).
Al2O3SiO2Fe2O3CaOMgOMnOK2OSO3Mass lossTFe
11.1836.8240.120.811.950.692.600.3811.6321.42
Table 2. Results of the fitting of the reaction kinetics.
Methodβ/(°C/min)E/(kJ/mol)Ar
General integral method1098.17.58 × 1040.995680
15103.42.35 × 1050.995052
20108.83.58 × 1050.995351
30114.07.37 × 1050.997411
Average106.13.51 × 1050.995874
Kissinger method-107.45.15 × 1050.991111
Table 3. Prediction of the time required for siderite magnetization using the kinetic equations.
Temperature /(°C)α = 0.80α = 0.90α = 0.95α = 0.98α = 0.999
6009.06 11.85 14.44 17.64 27.02
6504.11 5.37 6.54 7.99 12.24
7002.02 2.64 3.22 3.93 6.02
7501.06 1.39 1.69 2.07 3.17
7800.75 0.97 1.19 1.45 2.22
Table 4. Results of the analysis of the iron minerals and magnetic conversion of roasted ore.
Temperature
(°C)
Fe in Magnetite
(wt.%)
Fe in Siderite
(wt.%)
Fe in Hematite
(wt.%)
Fe in Silicate
(wt.%)
Fe in Sulfide
(wt.%)
Total
(wt.%)
Standard DeviationMagnetic Conversion Rate (%)
Raw ore0.2119.580.840.560.2321.42 0.02990.0
6008.8712.810.760.590.1823.21 0.02940.39
65017.926.120.560.630.1225.35 0.02580.72
70024.270.350.320.640.0225.60 0.02750.97
75025.8300.270.64026.74 0.03210.99
78025.7500.110.62026.48 0.03271.00
Table 5. EDS analysis of regions A and B (in Figure 12).
Region ARegion B
ElementMass Percentage (%)Atomic Percentage (%)ElementMass Percentage (%)Atomic Percentage (%)
O26.8149.52O43.0657.93
Fe62.632.84Si48.2536.97
Si5.155.42Fe3.231.24
Mg0.871.05K2.031.12
Ca0.300.22Al3.432.74
Table 6. Analysis results of the iron grade, recovery, and yield.
Product TypeYield (%)Iron Grade (wt.%)Iron Recovery (%)
Concentrate28.7962.8068.83
Middling IV2.7658.046.10
Middling III2.2244.703.78
Middling II13.9012.826.78
Middling I22.9212.9711.32
Tailings29.412.853.19
Roasted ore100.0026.32100
Note: the data in Table 6 are the averages of parallel samples.
Publisher’s Note: MDPI stays neutral with regard to jurisdictional claims in published maps and institutional affiliations.

