
Effect of Deep Cryogenic Time on Martensite Multi-Level Microstructures and Mechanical Properties in AISI M35 High-Speed Steel

Abstract
:
1. Introduction
2. Experimental Details
3. Results
3.1. Mechanical Properties
3.2. Microstructure Characteristics
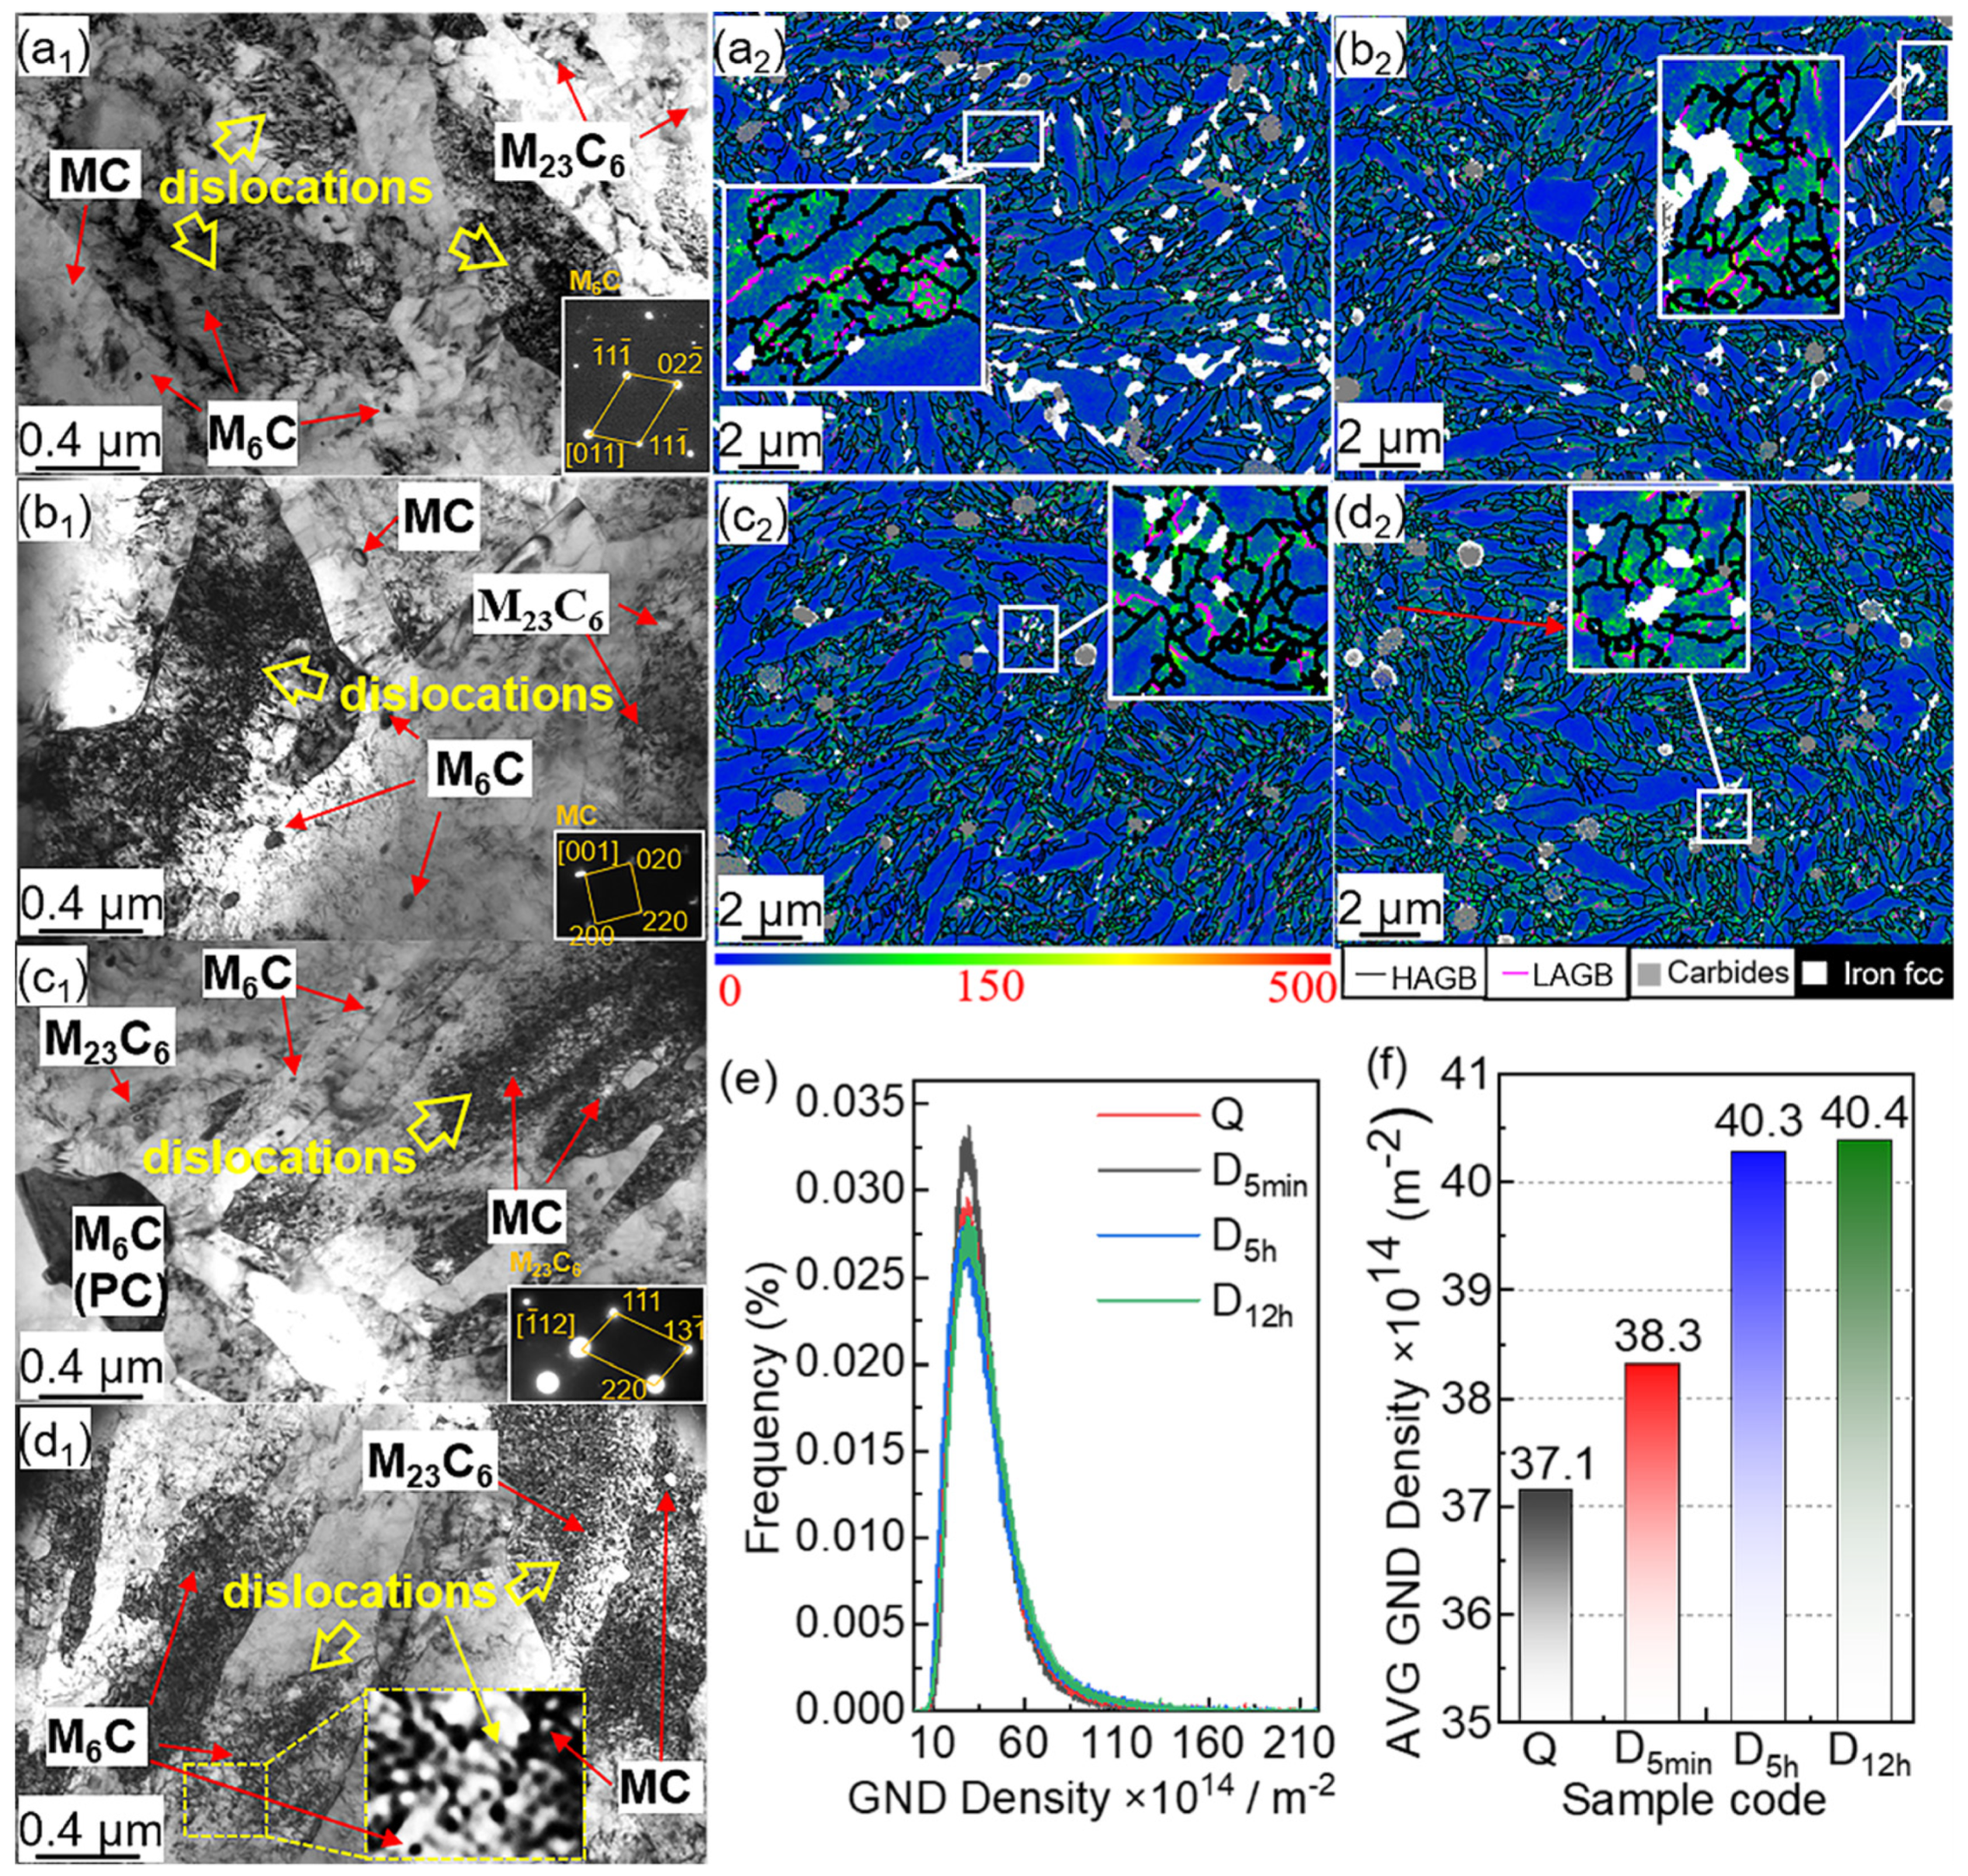
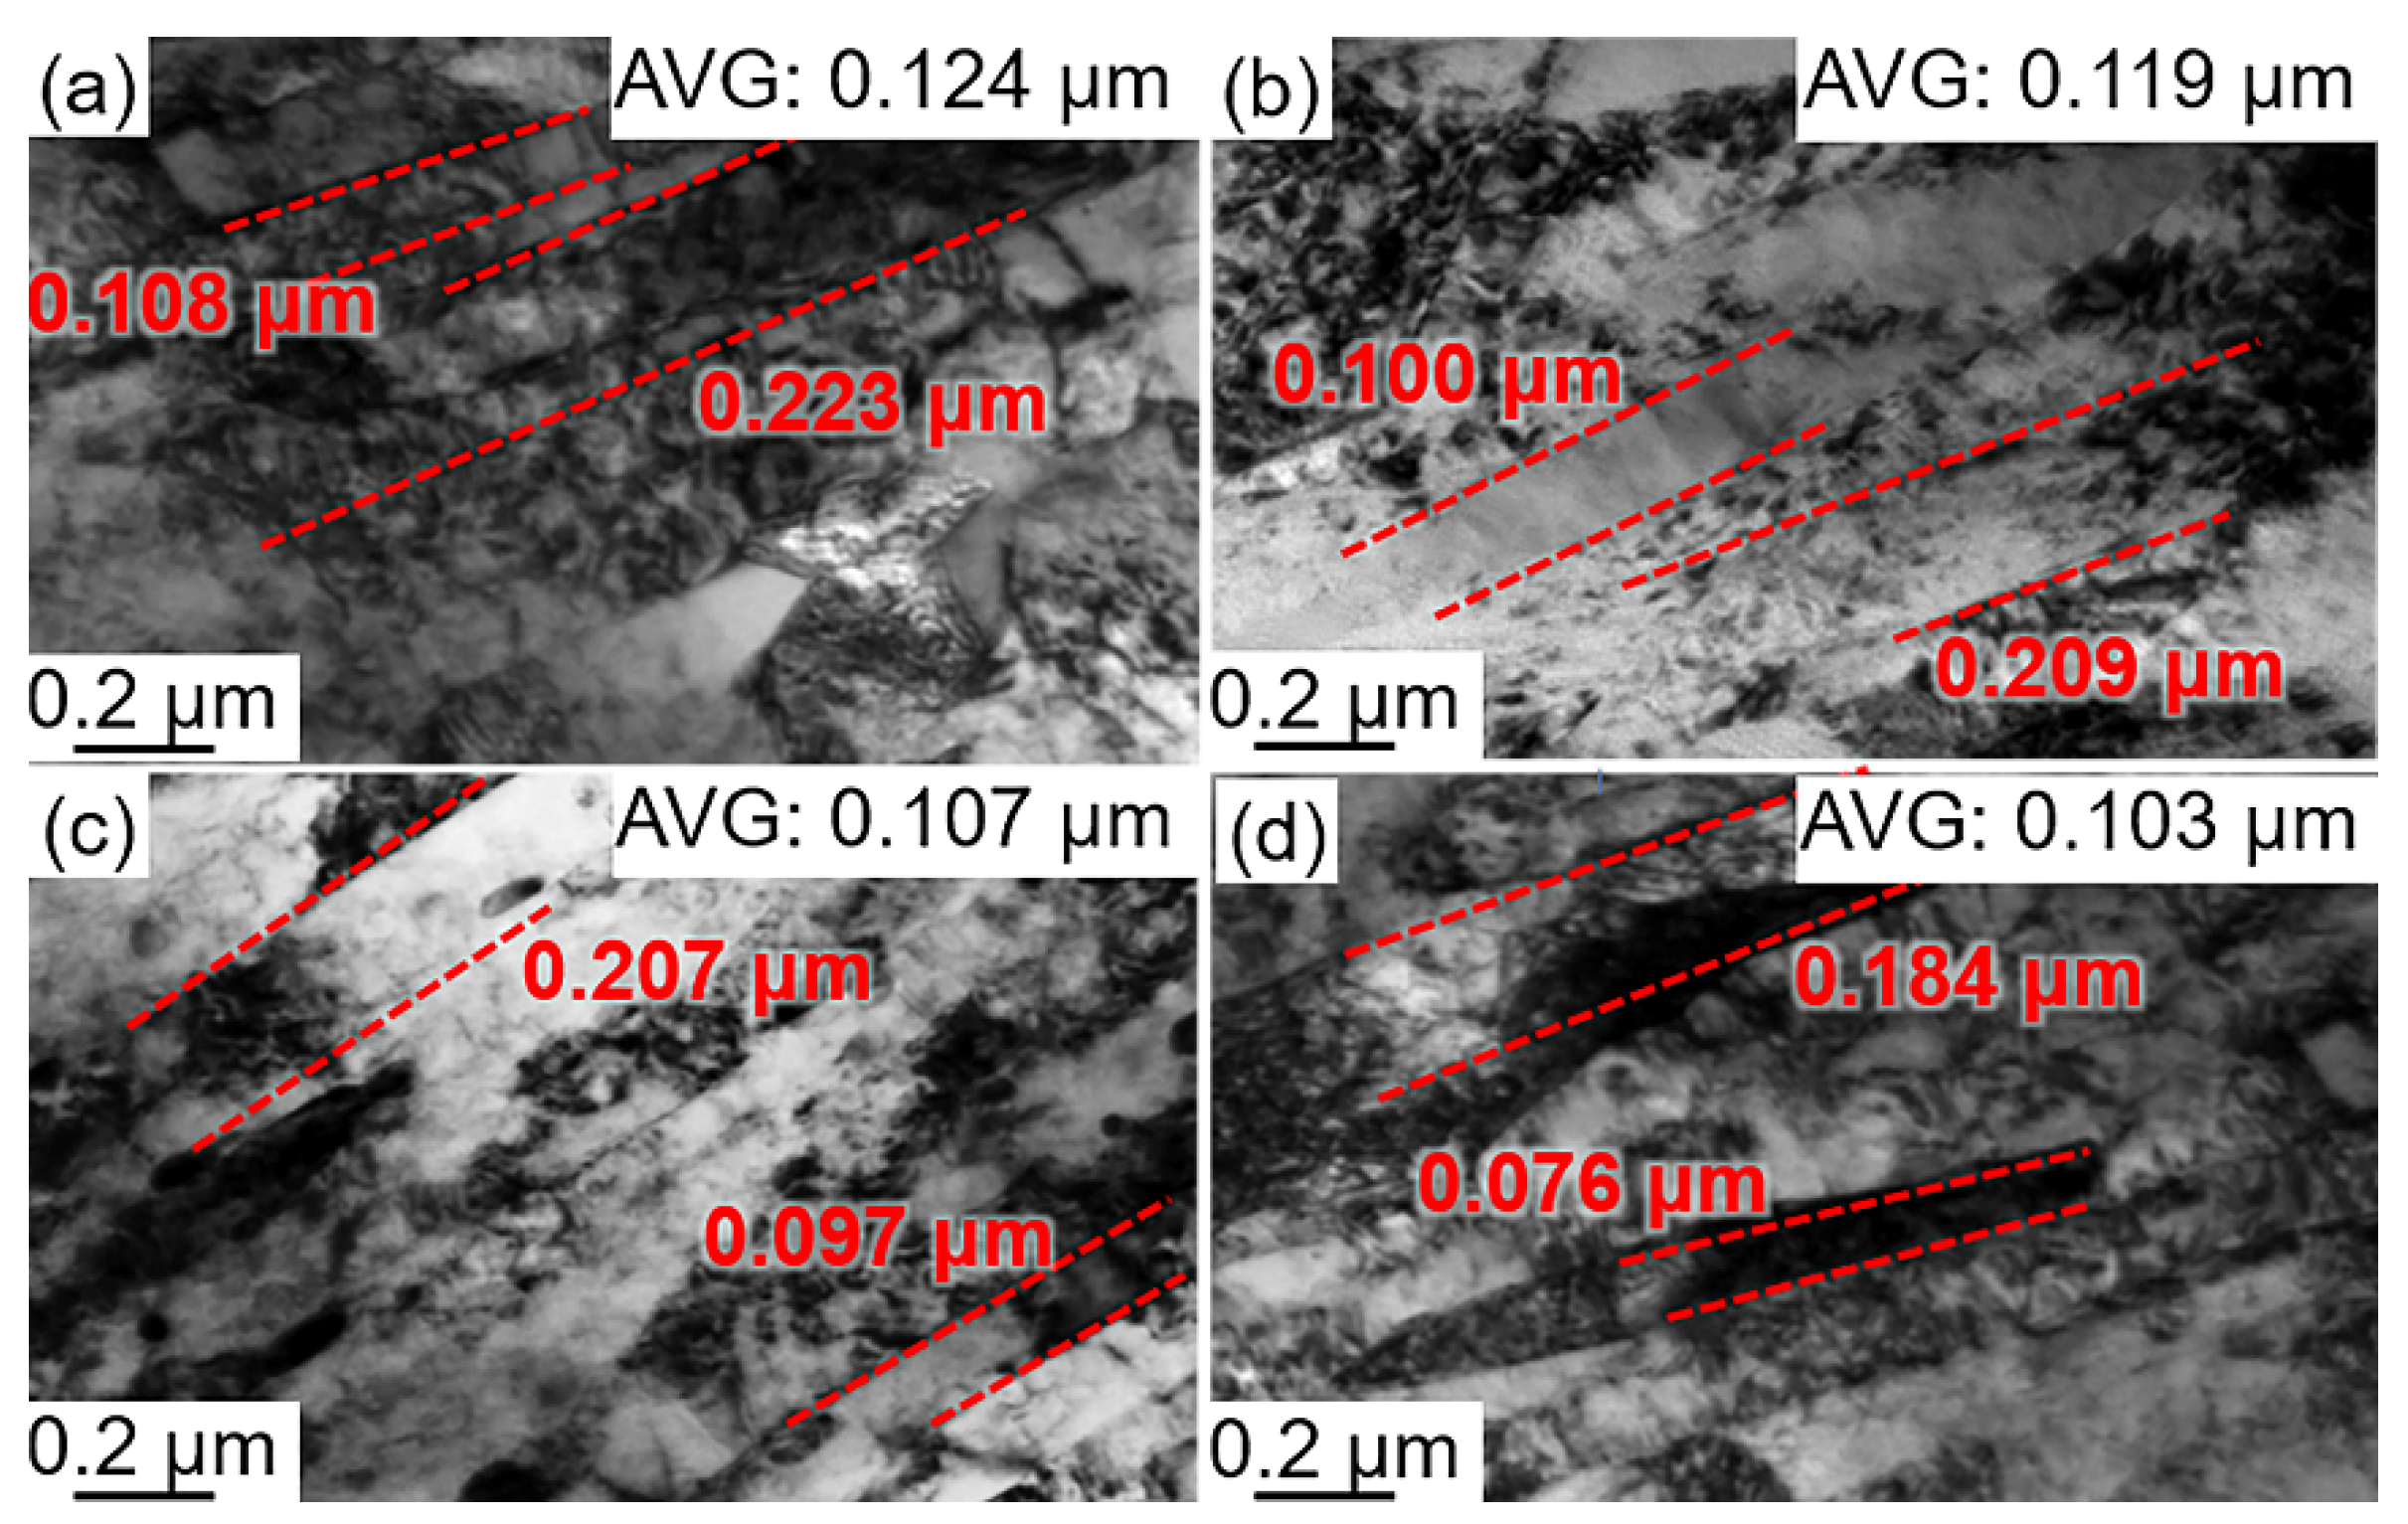
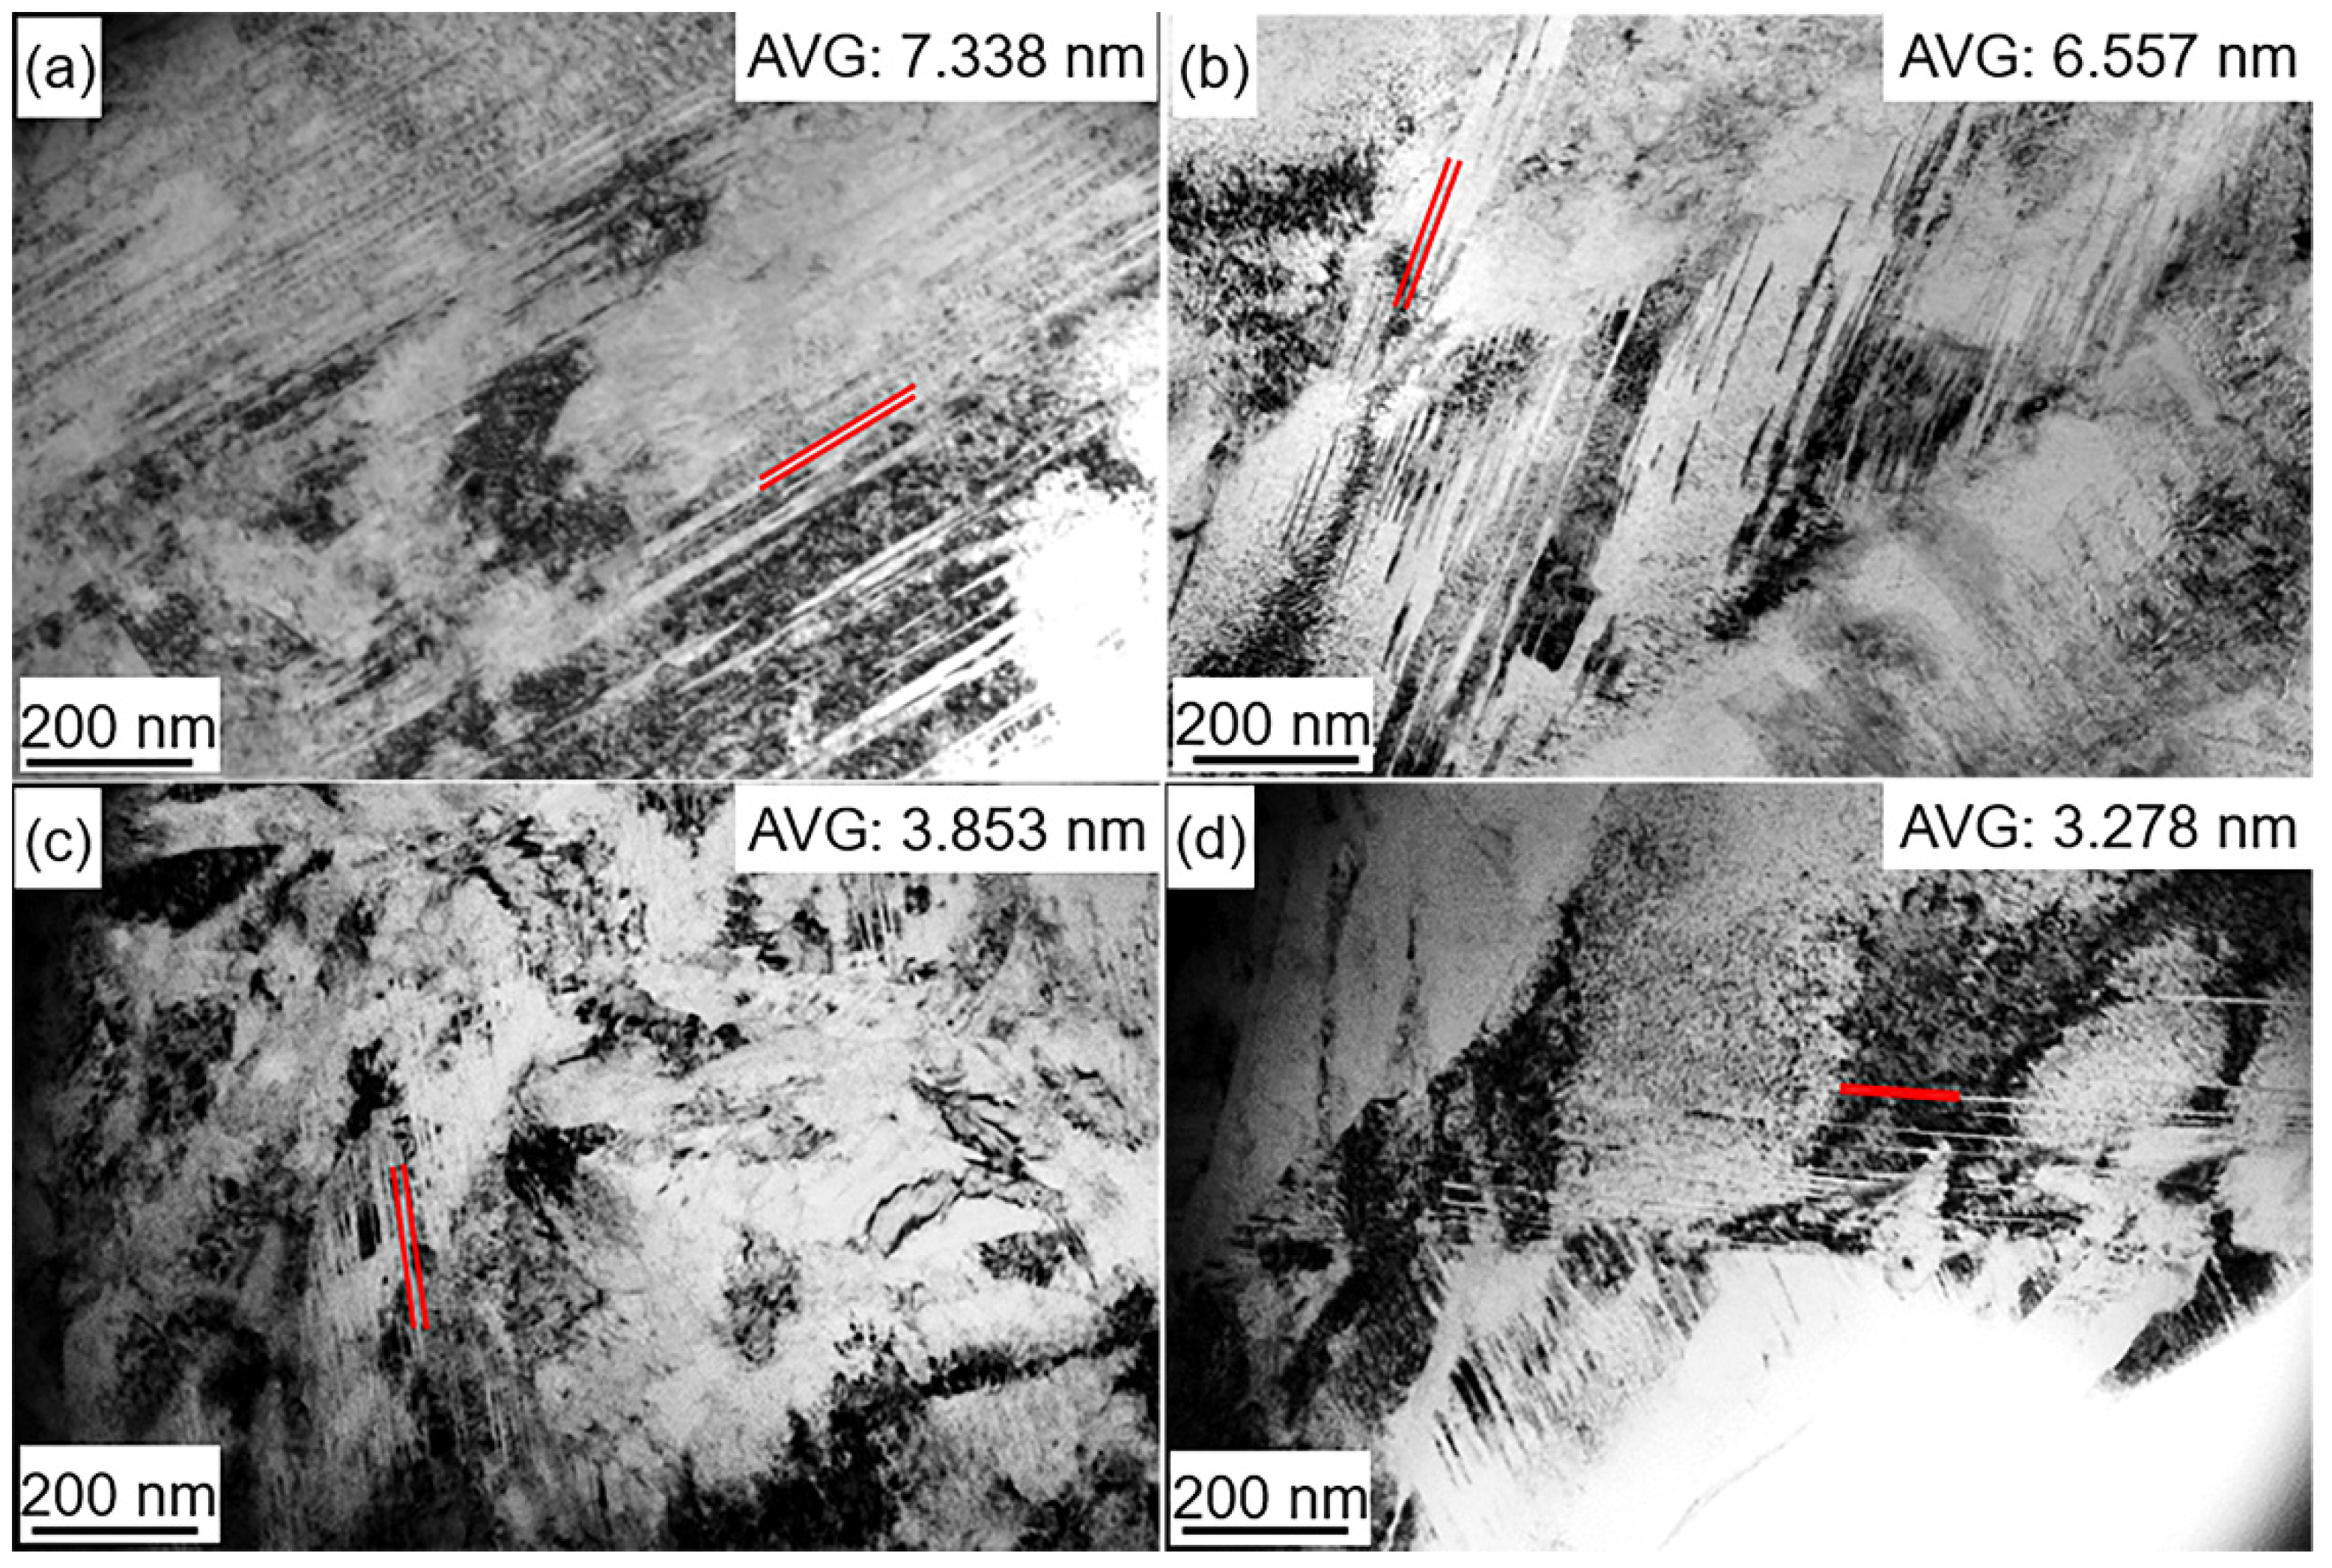
3.3. Dislocation and Martensite Multi-Level Microstructure Size
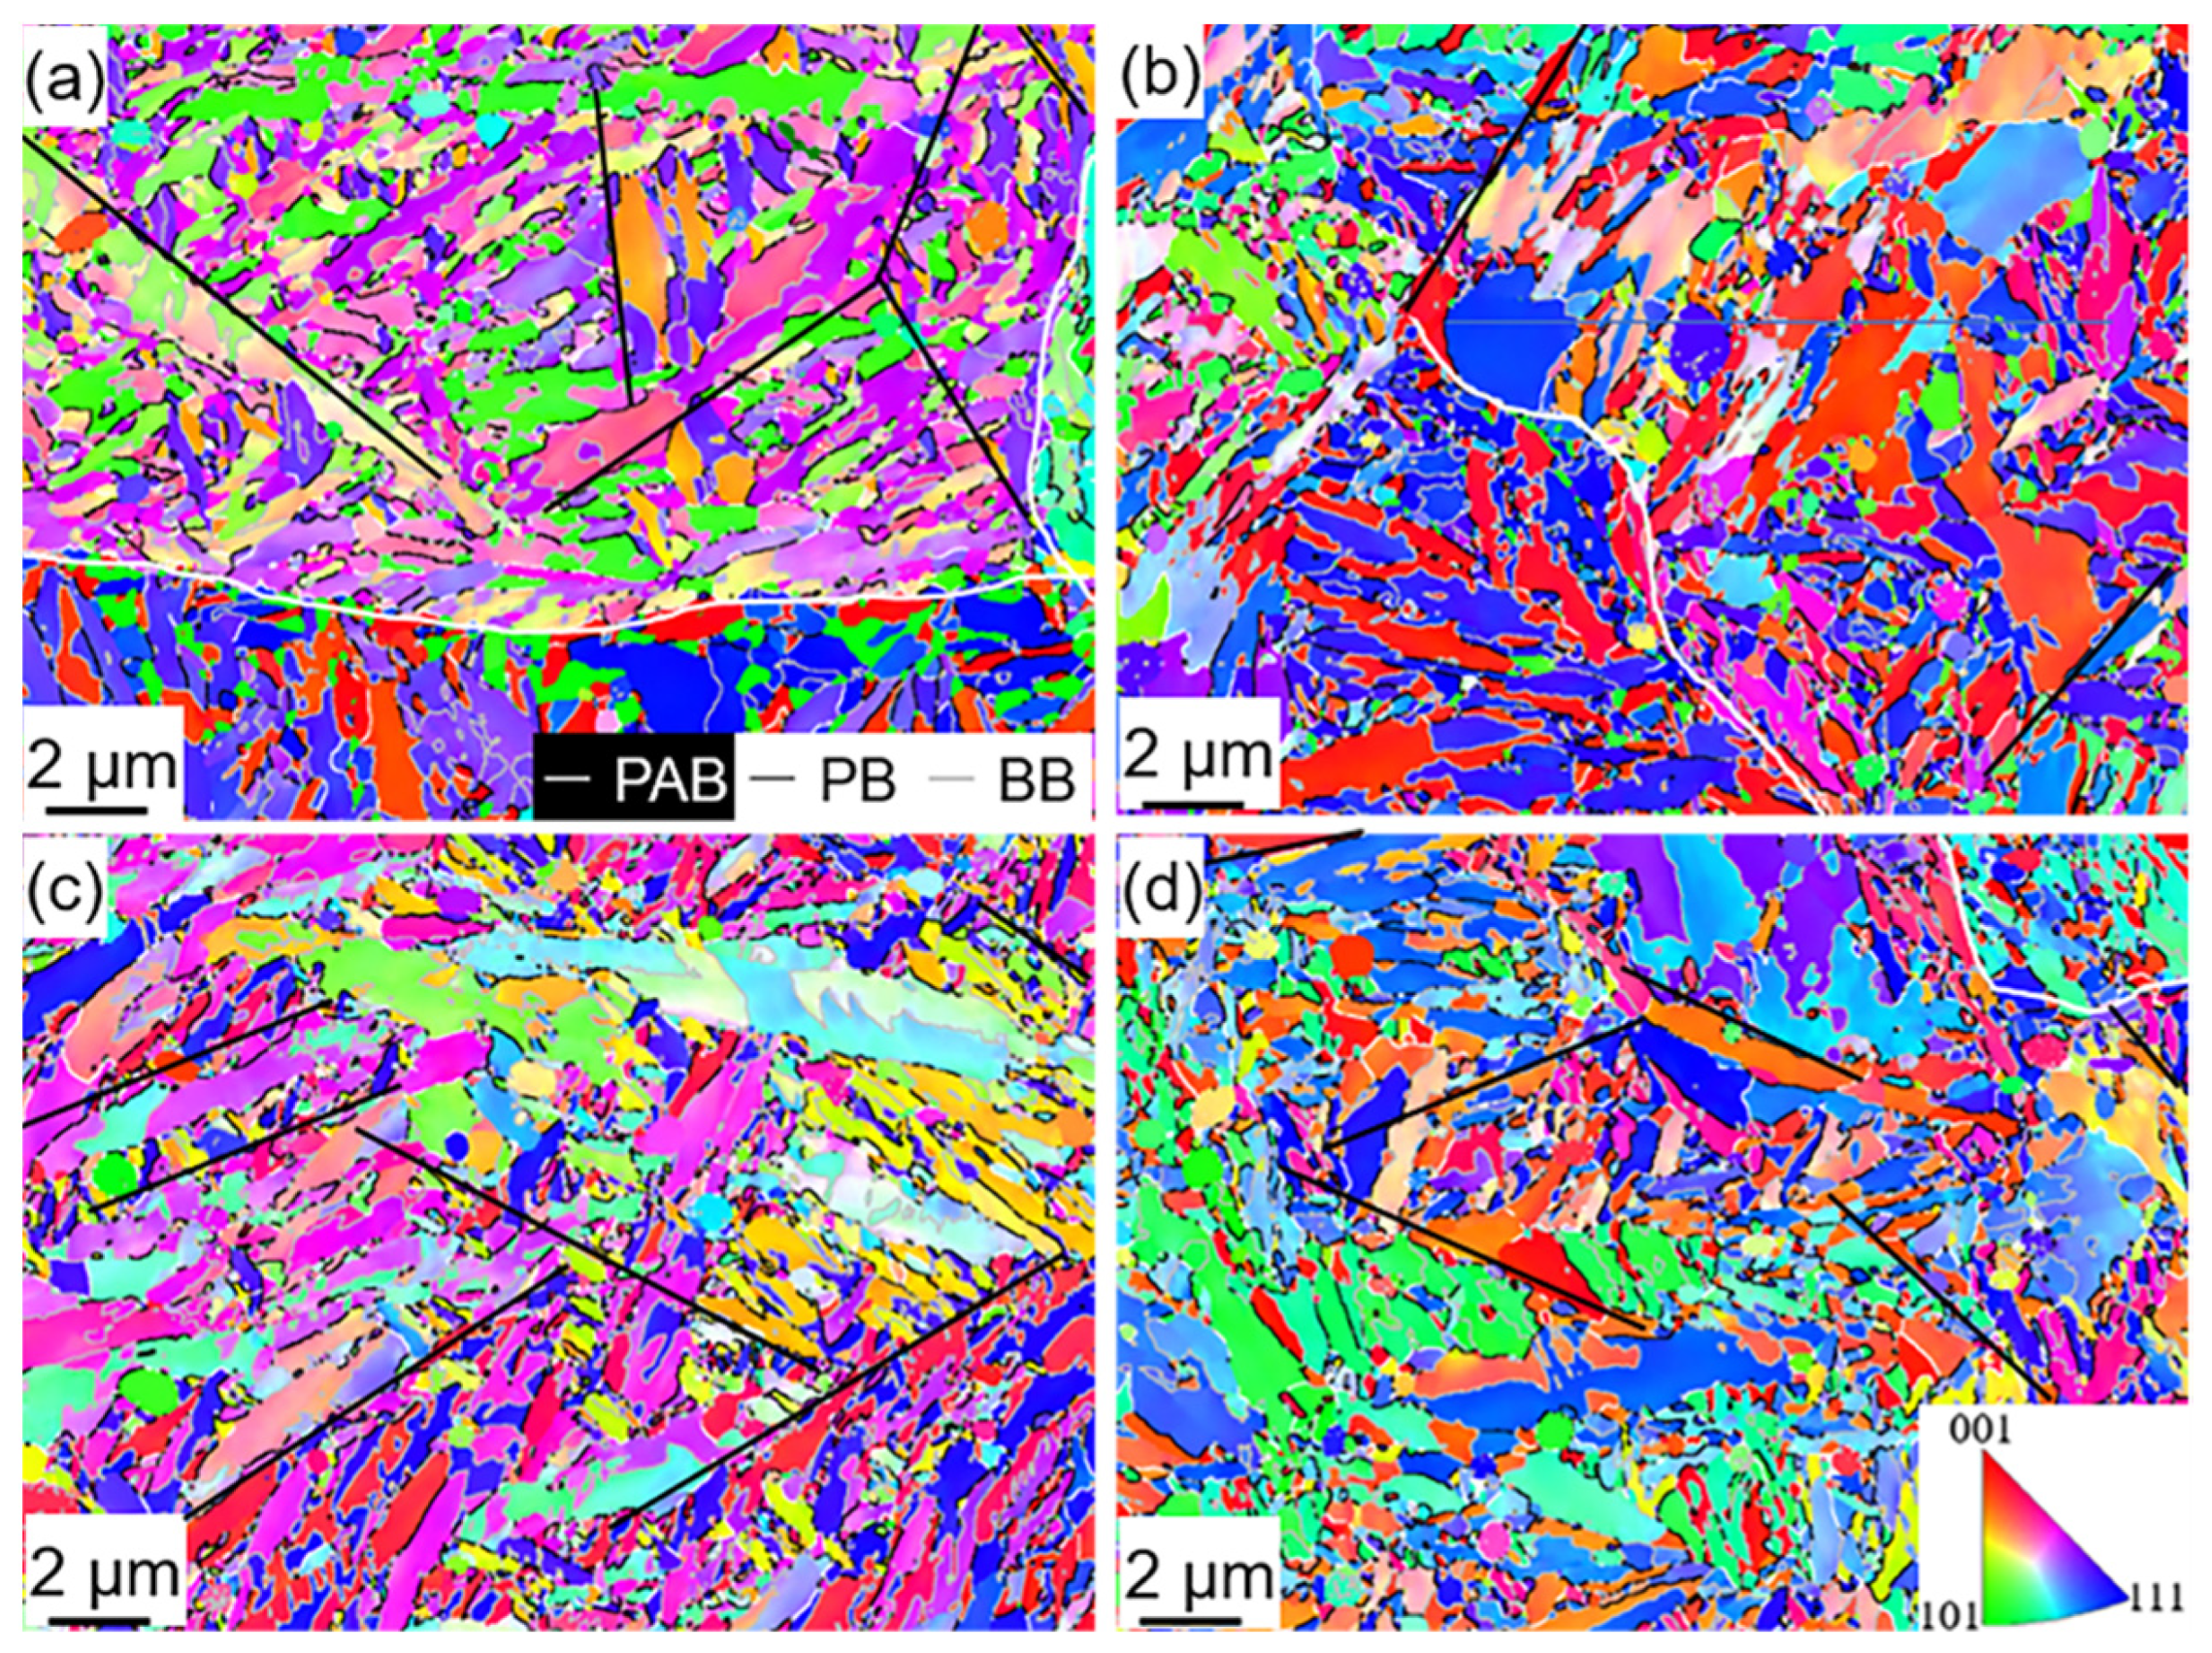
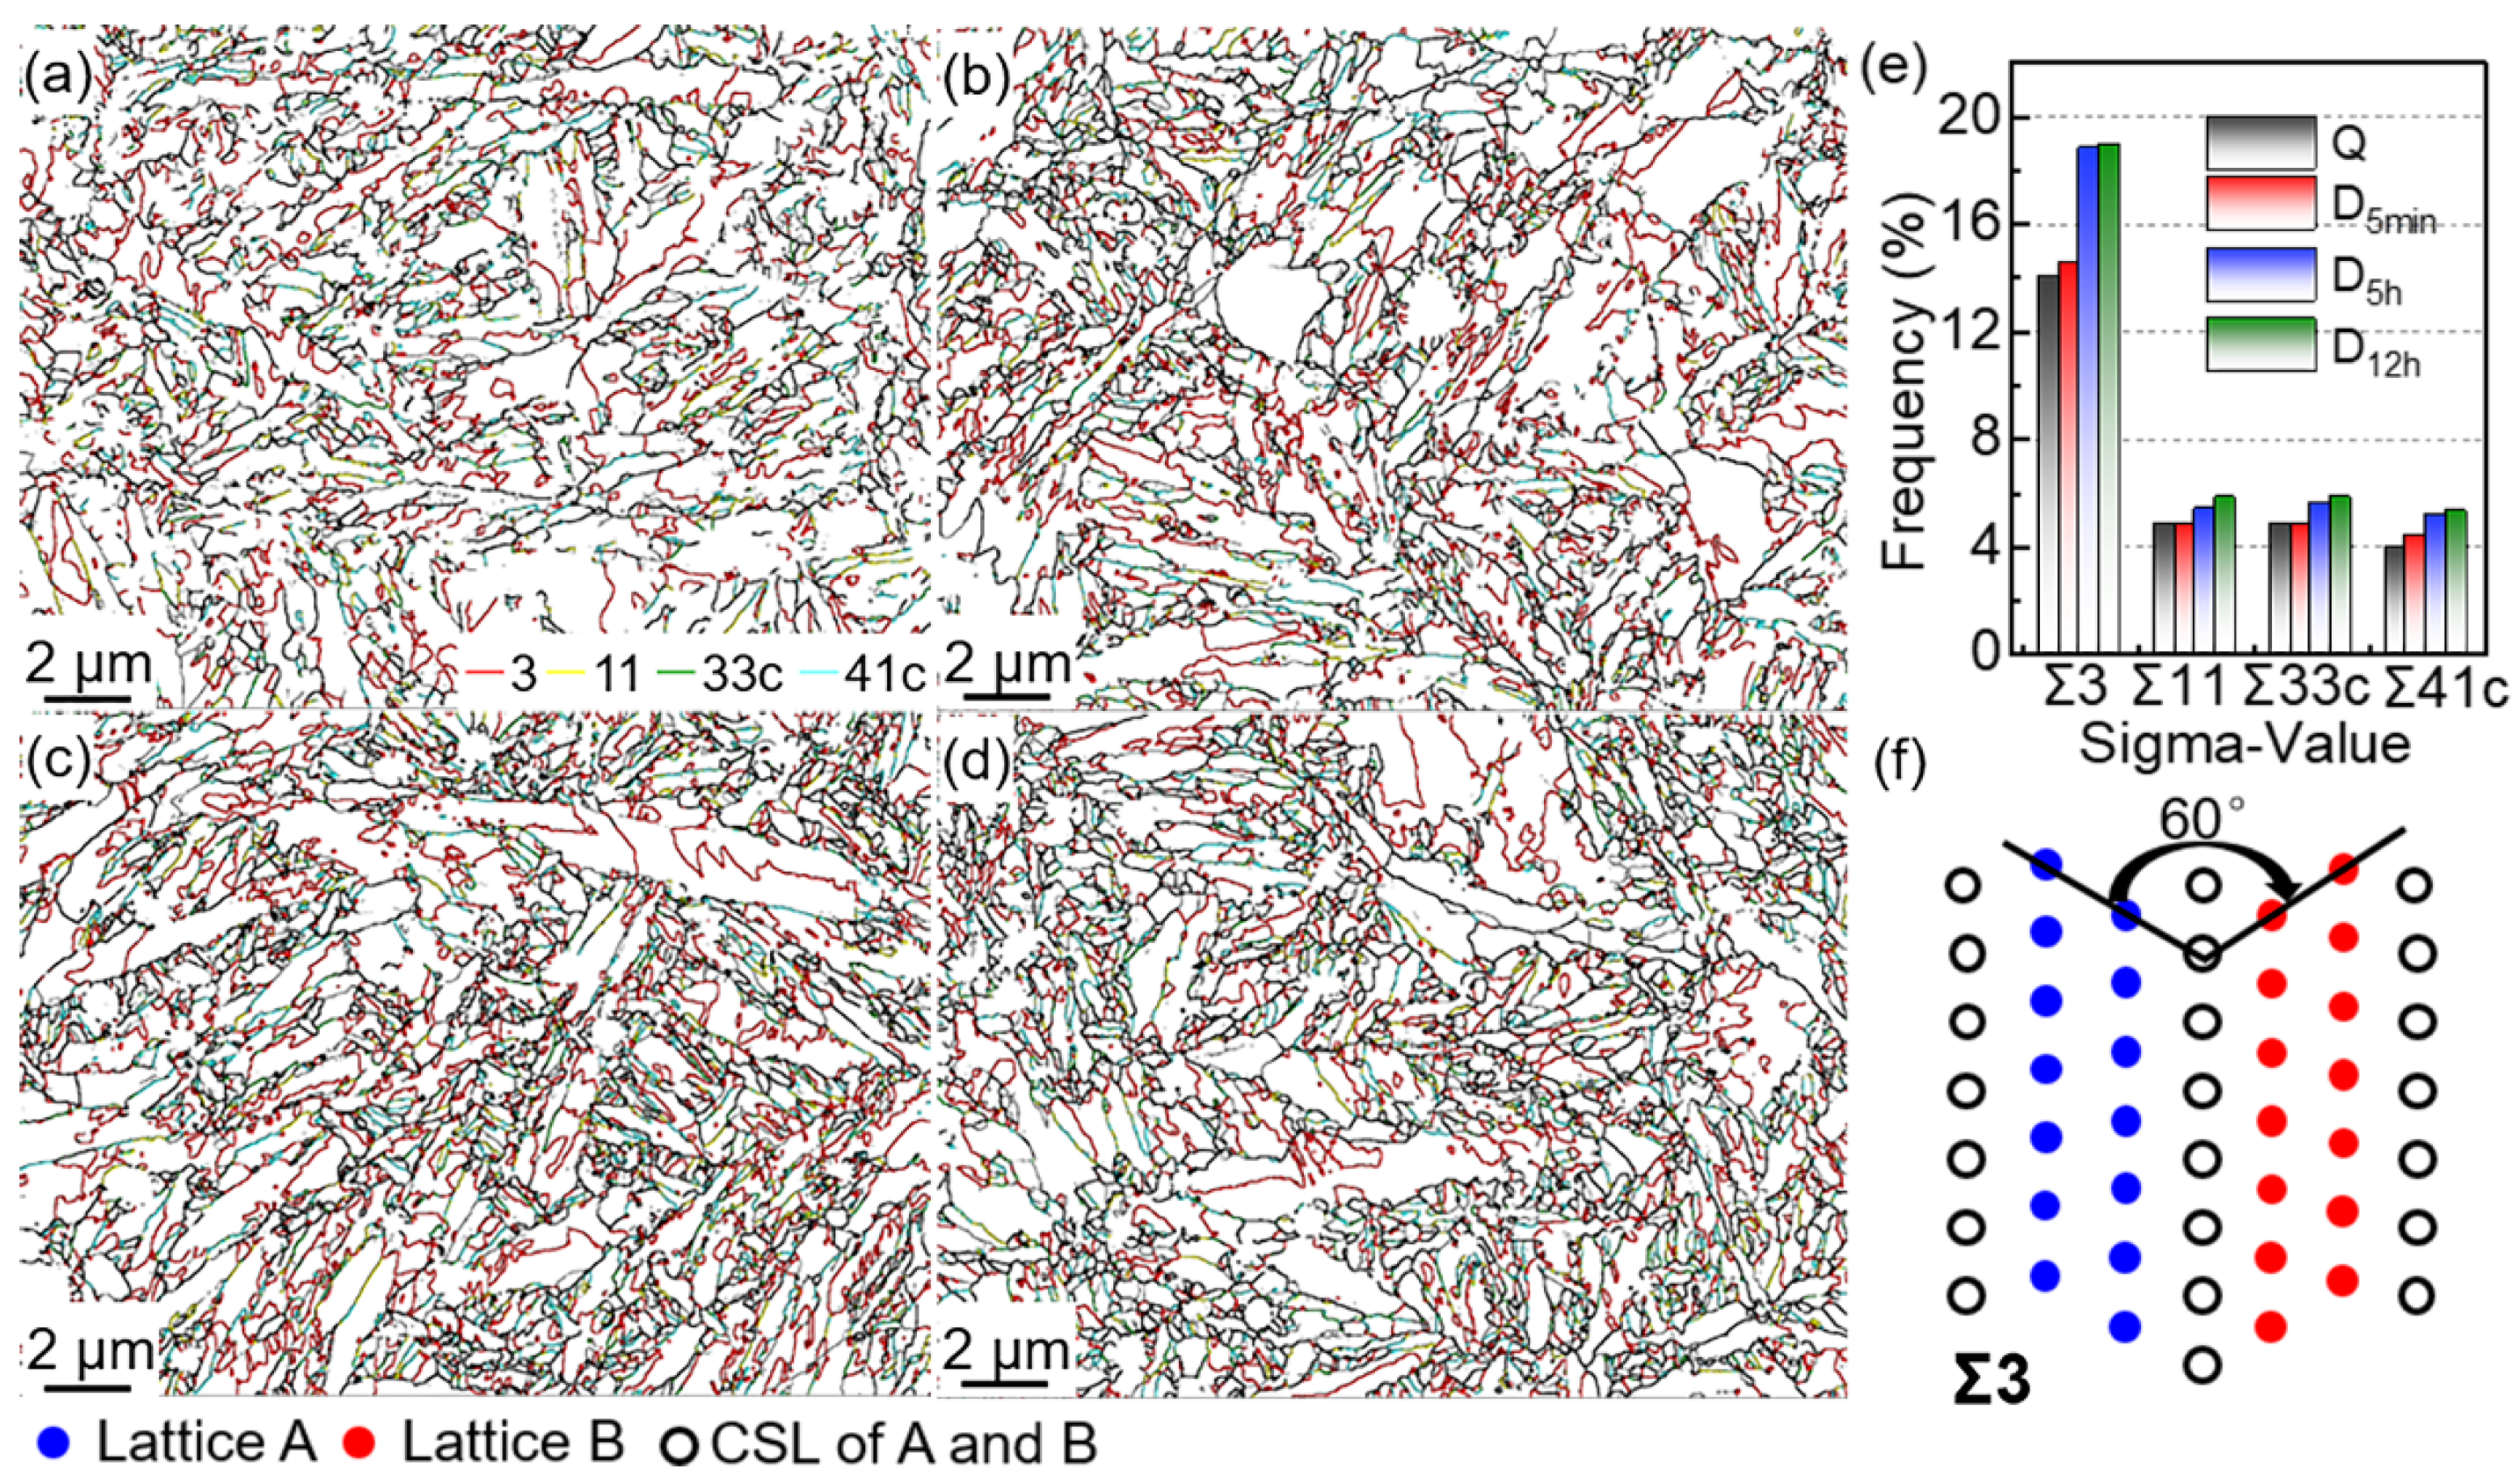
3.4. Martensite Boundaries
4. Discussion
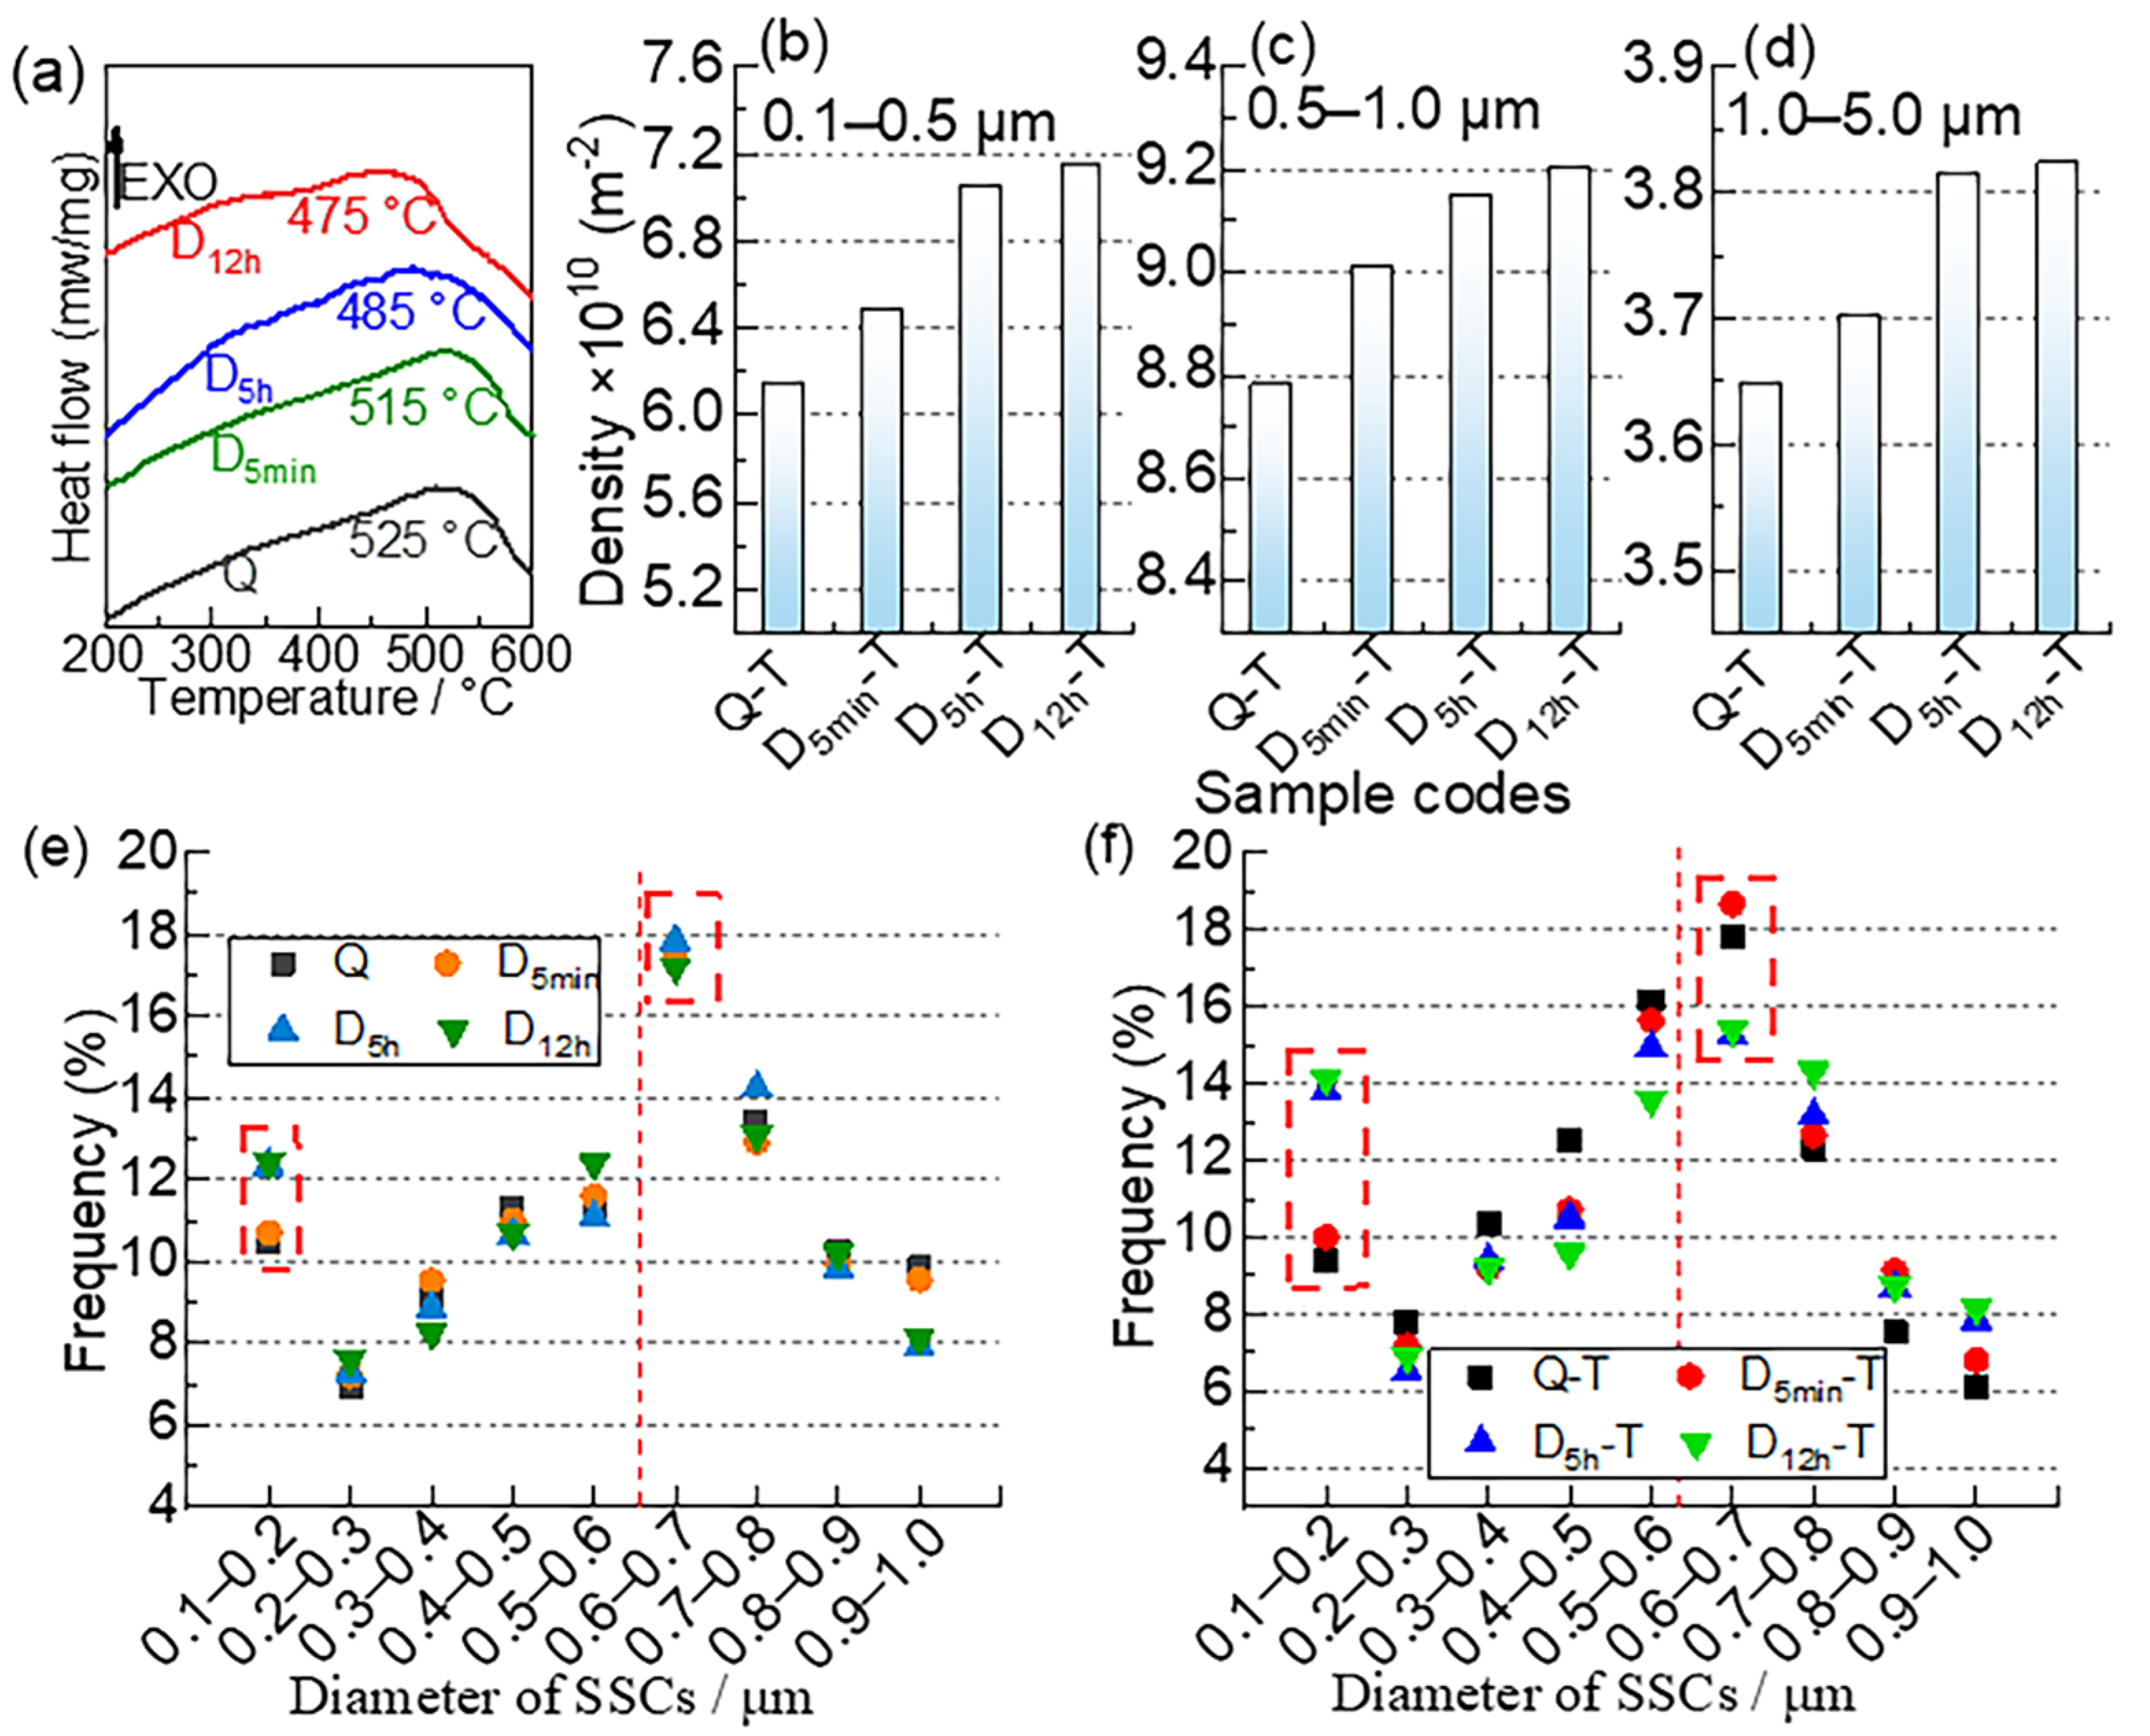
4.1. Effect of Microstructures Evolution on SCs Precipitation
4.2. Effect of Martensite Multi-Level Microstructures on Mechanical Properties
5. Conclusions
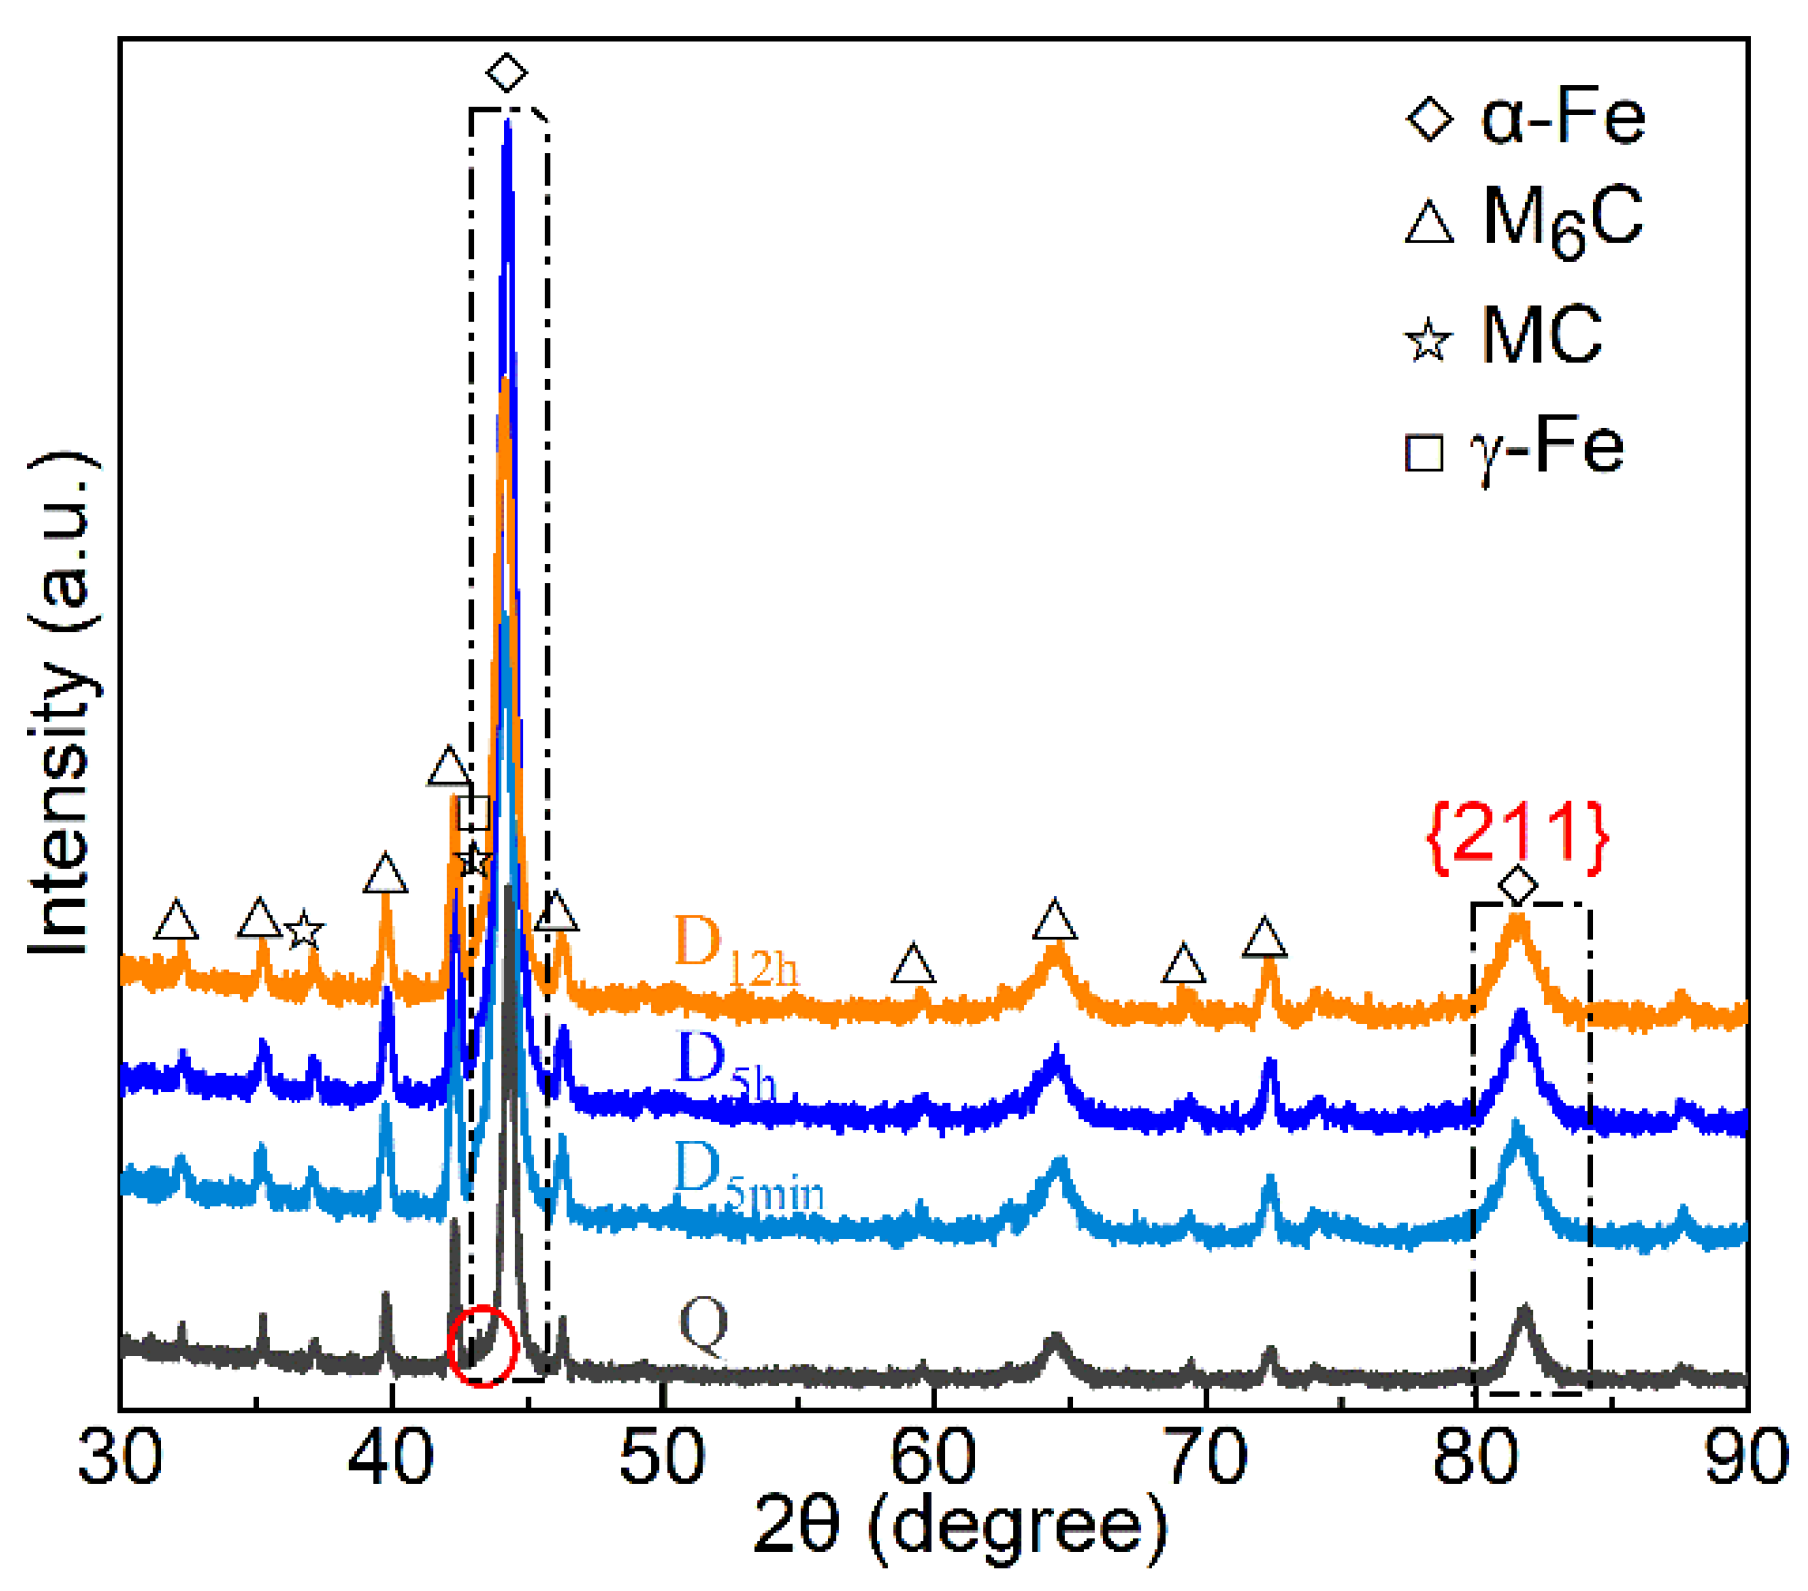
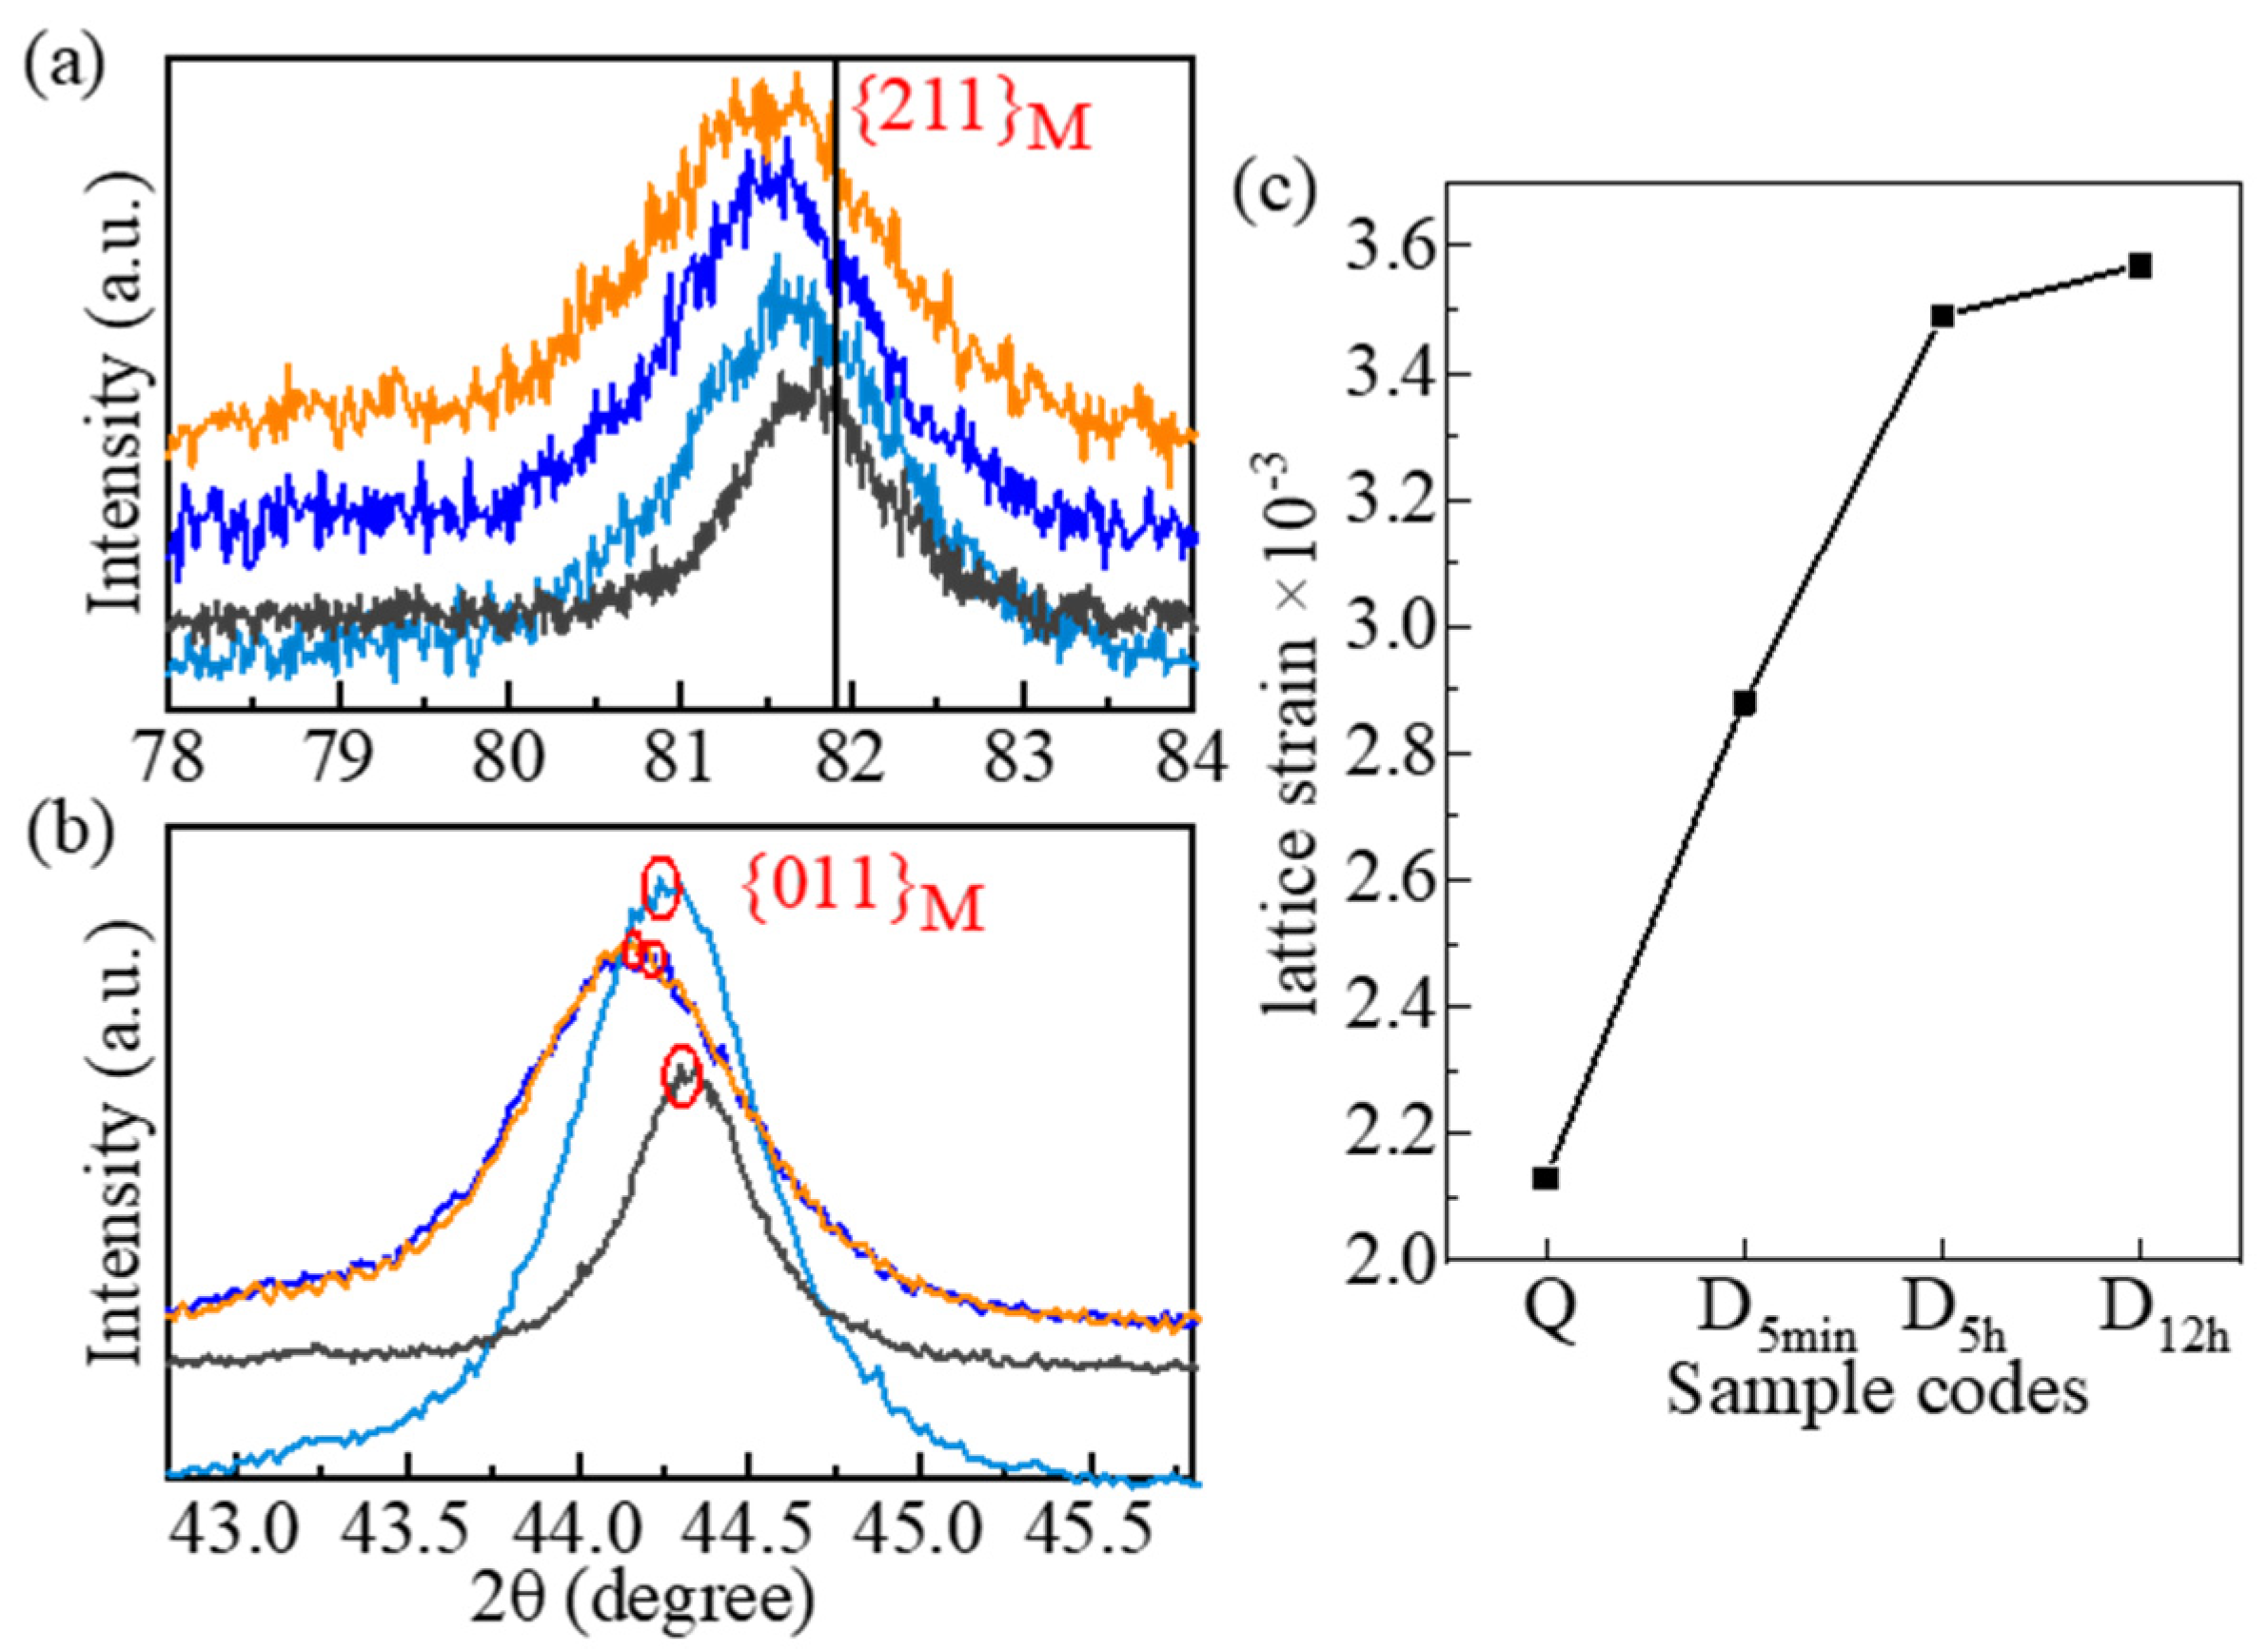
- The transformation of RA and the high plastic deformation that occurs during the DCT process increase the martensitic lattice strain and dislocations, reducing the temperature of carbide precipitation. The effect of DCT soaking time on the SCs precipitation of the DCT samples is limited. However, the increase in deep cryogenic time notably promotes the precipitation of fine carbides in tempered samples when the time is less than 5 h.
- The rise in DCT processing time has a remarkable refinement of the martensite multi-level microstructures (including db and dl) due to the formation of numerous fresh martensite and martensitic laths. However, DCT immersion time has a limited effect on the martensite multi-level microstructures when the DCT processing time is longer than 5 h. The addition of dislocations and LAGBs promotes the generation of new boundaries (BBs and LBs), contributing to the impact toughness of tempered samples.
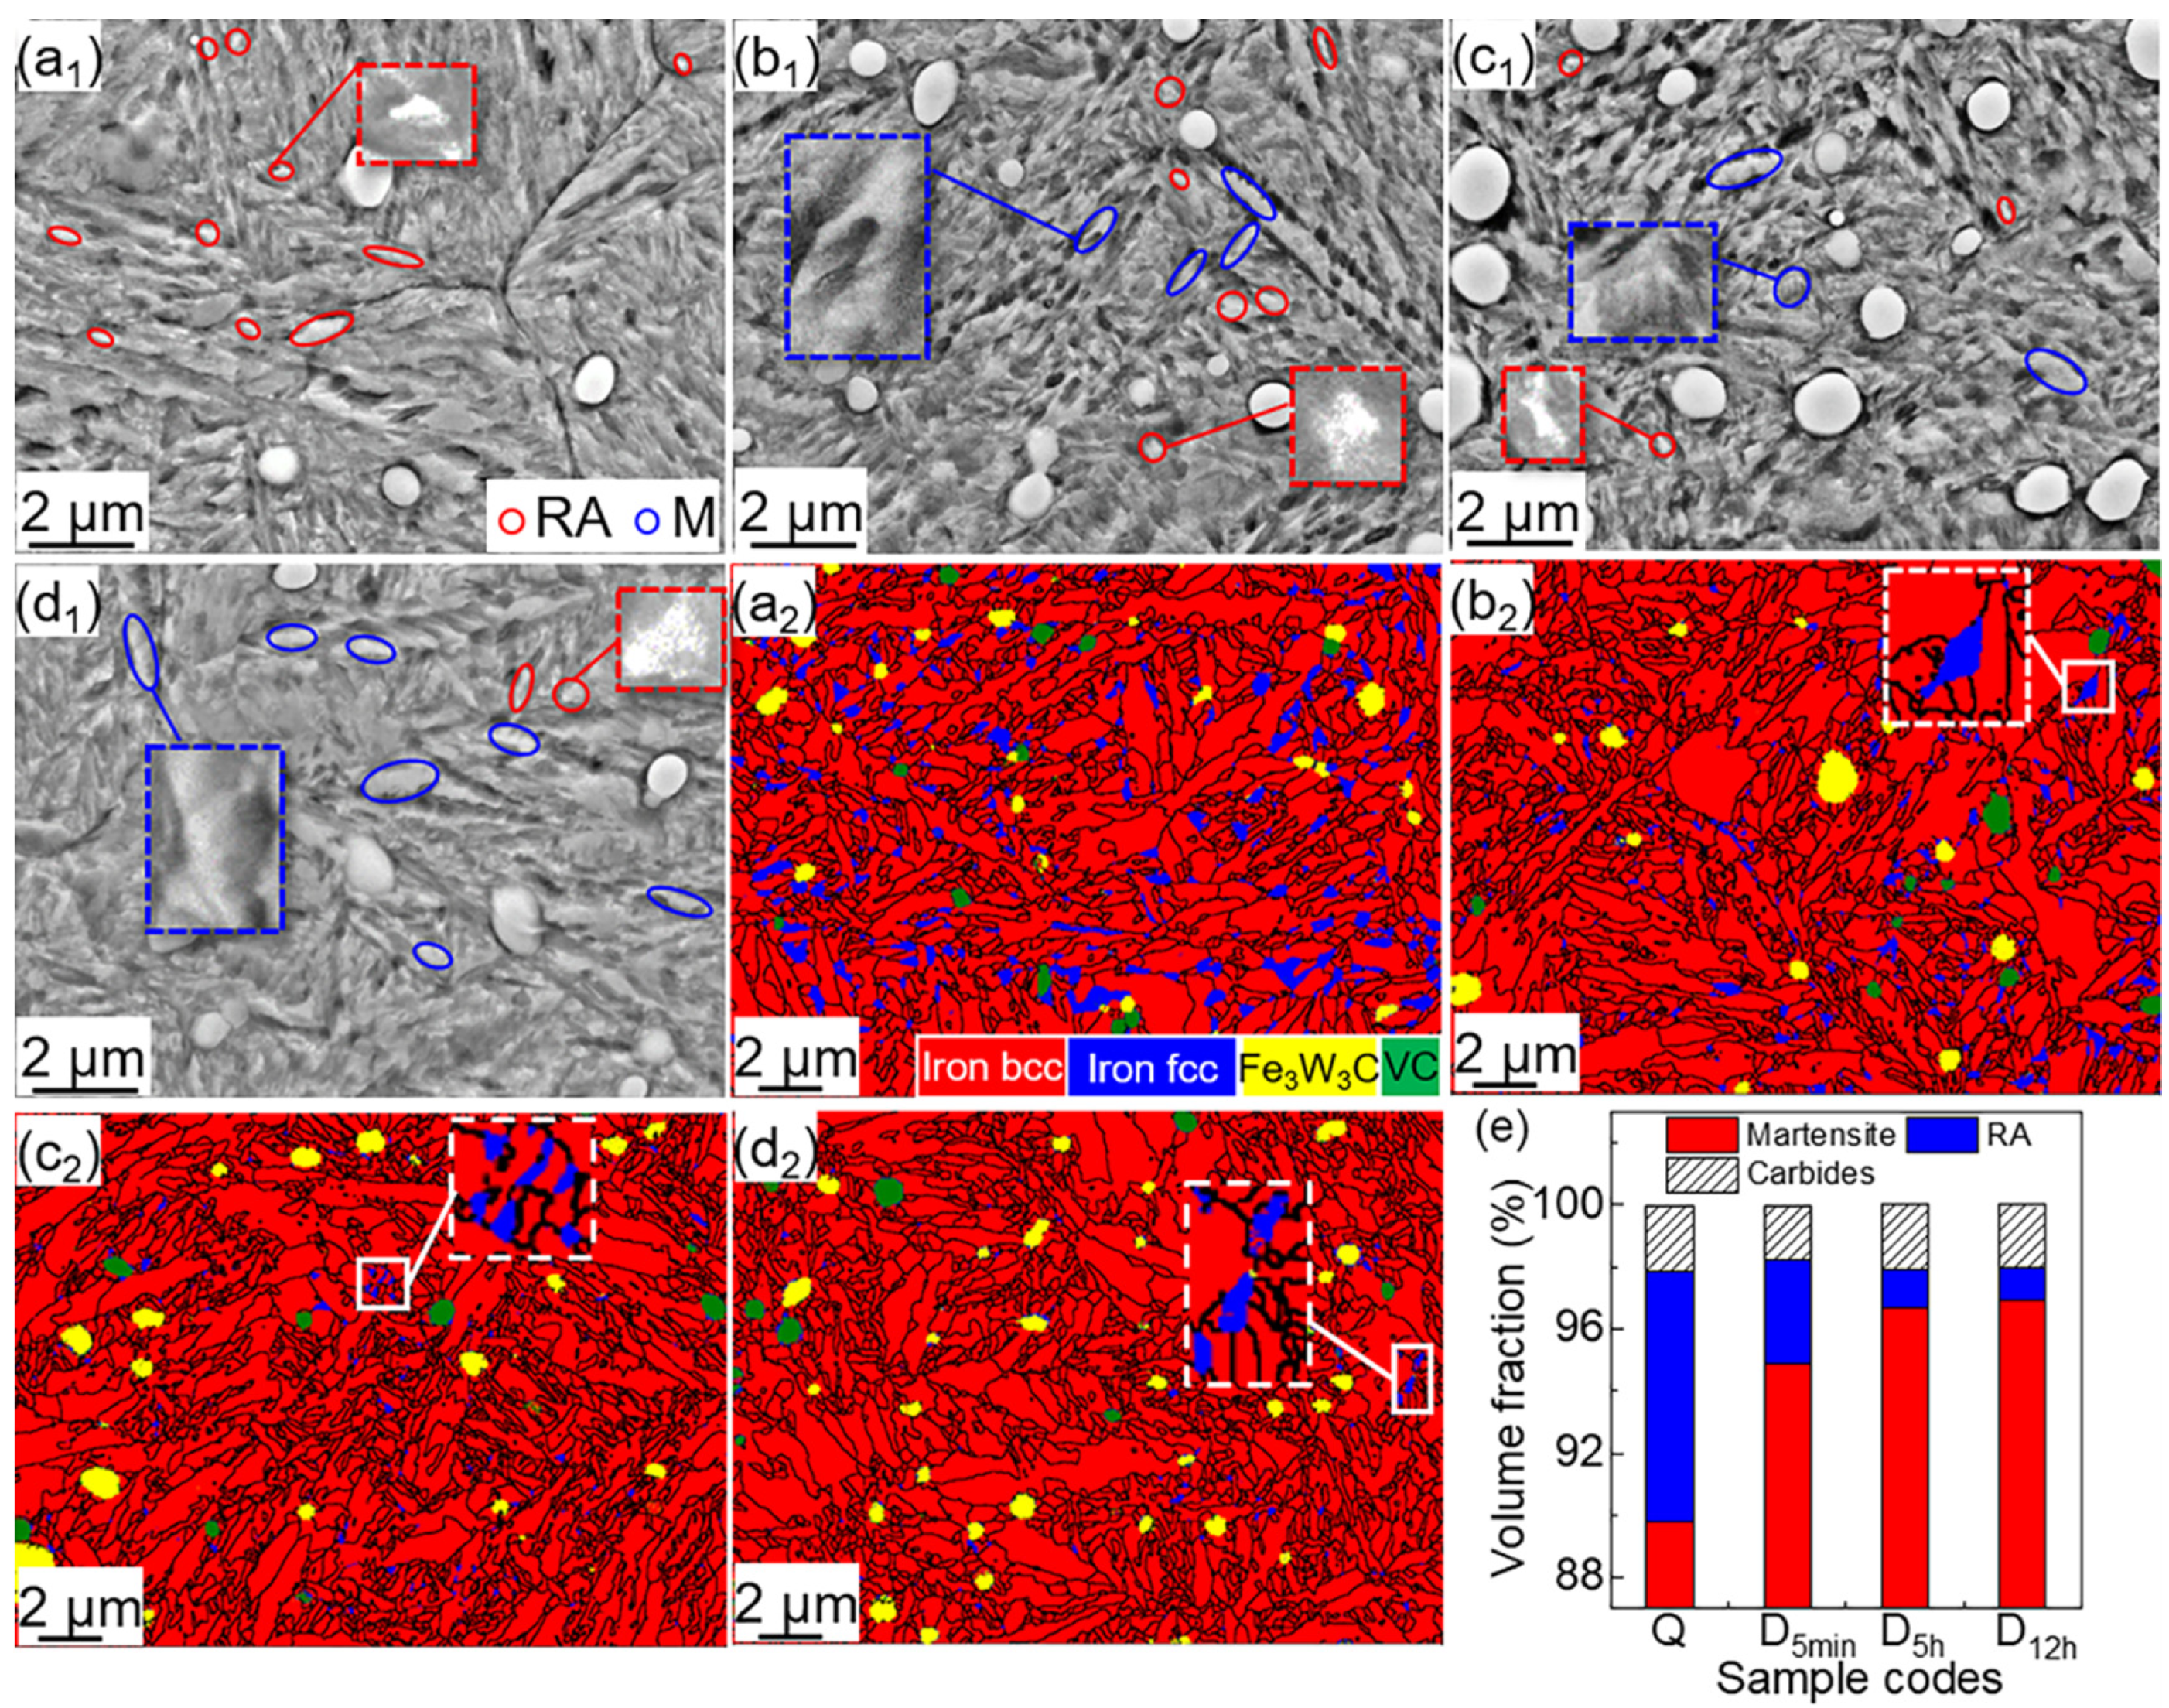
- The hardness of untempered samples that were deep- deep cryogenically treated for more than 5 h was ~900 HV1, improved by ~44 HV1 compared to the Q samples because of the transformation of RA and the increase in dislocation. The hardness in D5h-T is 867.05 HV1, which rose by ~22 HV1 more than that in Q-T, due to the precipitation of the SCs. Moreover, the impact toughness in D5h-T is 2.45 MJ·m−2, which is 32.4% higher than Q-T, owing to the refinement of M multi-level microstructures and the massive precipitation of SCs (especially the SSCs). When the DCT processing time is higher than 5 h, the increase in DCT immersion time has little effect on the other properties (Vickers hardness and impact toughness) of the selected steel.
Author Contributions
Funding
Institutional Review Board Statement
Informed Consent Statement
Data Availability Statement
Conflicts of Interest
References
- Chaus, A.S.; Bračík, M.; Sahul, M.; Dománková, M. Microstructure and properties of M2 high-speed steel cast by the gravity and vacuum investment casting. Vacuum 2019, 162, 183–198. [Google Scholar] [CrossRef]
- Jiao, W.C.; Li, H.-B.; Feng, H.; Wang, H.-J.; Jiang, Z.-H.; Wu, W. High-temperature annealing significantly enhances intrinsic hot workability of the as-cast high-nitrogen M42 high-speed steel. Metall. Mater. Trans. A 2022, 53, 2426–2451. [Google Scholar] [CrossRef]
- Peng, H.; Hu, L.; Li, L.; Zhang, L.; Zhang, X. Evolution of the microstructure and mechanical properties of powder metallurgical high-speed steel S390 after heat treatment. J. Alloys Compd. 2018, 740, 766–773. [Google Scholar] [CrossRef]
- Qu, M.; Wang, Z.; Li, H.; Lv, Z.; Sun, S.; Fu, W. Effects of mischmetal addition on phase transformation and as-cast microstructure characteristics of M2 high-speed steel. J. Rare Earths 2013, 31, 628–633. [Google Scholar] [CrossRef]
- Xiao, L.; Li, S.; Xu, J.; Zhao, Z.; Xiang, H.; Bao, X.; Piao, S.; Peng, Z.; Pan, L.; Liang, X.; et al. Failure mechanism and improvement process of preparing carbide coating on high speed steel by thermal diffusion reaction. Surf. Coat. Technol. 2020, 404, 126398. [Google Scholar] [CrossRef]
- Martins, P.S.; Gonçalves Carneiro, J.R.; Ba, E.C.T.; Vieira, V.F. Study on roughness and form errors linked with tool wear in the drilling process of an Al-Si alloy under high cutting speed using coated diamond-like carbon high-speed steel drill bits. J. Manuf. Process. 2021, 62, 711–719. [Google Scholar] [CrossRef]
- Gsellmann, M.; Klünsner, T.; Mitterer, C.; Krobath, M.; Wurmshuber, M.; Leitner, H.; Ecker, W.; Marsoner, S.; Maier-Kiener, V.; Kiener, D.; et al. Strength ranking for interfaces between a TiN hard coating and microstructural constituents of high speed steel determined by micromechanical testing. Mater. Des. 2021, 204, 109690. [Google Scholar] [CrossRef]
- Pan, Y.; Pi, Z.; Liu, B.; Xu, W.; Zhang, C.; Qu, X.; Lu, X. Influence of heat treatment on the microstructural evolution and mechanical properties of W6Mo5Cr4V2Co5Nb (825 K) high speed steel. Mater. Sci. Eng. A 2020, 787, 139480. [Google Scholar] [CrossRef]
- Akıncıoğlu, G. Investigation of the effect of cryogenic treatment cubic boron nitride turning insert tools. J. Mater. Eng. Perform. 2021, 30, 1280–1288. [Google Scholar] [CrossRef]
- Ďurica, J.; Ptačinová, J.; Dománková, M.; Čaplovič, L.; Čaplovičová, M.; Hrušovská, L.; Malovcová, V.; Jurči, P. Changes in microstructure of ledeburitic tool steel due to vacuum austenitizing and quenching, sub-zero treatments at −140 °C and tempering. Vacuum 2019, 170, 108977. [Google Scholar] [CrossRef]
- Li, J.; Min, Y.; Wang, P.; Cai, X.; Wu, X. Analysis of distortion mechanism of a cold Work tool steel during quenching and deep cryogenic treatment. Met. Mater.-Int. 2018, 25, 546–558. [Google Scholar] [CrossRef]
- Bai, X.; Zheng, L.; Cui, J.; Wu, S.; Song, R.; Xie, D.; Wang, D.; Li, H. Effect of cryogenic treatment on microstructure and mechanical properties of 0Cr12Mn5Ni4Mo3Al steel. J. Mater. Eng. Perform. 2017, 26, 5079–5084. [Google Scholar] [CrossRef]
- Jovičević-Klug, P.; Podgornik, B. Comparative study of conventional and deep cryogenic treatment of AISI M3:2 (EN 1.3395) high-speed steel. J. Mater. Res. Technol. 2020, 9, 13118–13127. [Google Scholar] [CrossRef]
- Katoch, S.; Singh, V.; Sehgal, R. Mechanical properties and microstructure evaluation of differently cryogenically treated AISI-H11 steel. Int. J. Steel Struct. 2019, 19, 1381–1392. [Google Scholar] [CrossRef]
- Jovičević-Klug, M.; Jovičević-Klug, P.; Kranjec, T.; Podgornik, B. Cross-effect of surface finishing and deep cryogenic treatment on corrosion resistance of AISI M35 steel. J. Mater. Res. Technol. 2021, 14, 2365–2381. [Google Scholar] [CrossRef]
- Shinde, T.; Pruncu, C.; Dhokey, N.B.; Parau, A.C.; Vladescu, A. Effect of deep cryogenic treatment on corrosion behavior of AISI H13 die Steel. Materials 2021, 14, 1317790. [Google Scholar] [CrossRef]
- Hariharan, K.B.; Saravanan, S.; Parkunam, N. Life time improvement of D7 tool steel by cryogenic treatment. Mater. Today Proc. 2020, 21, 619–621. [Google Scholar] [CrossRef]
- Kumar, T.V.; Thirumurugan, R.; Viswanath, B. Influence of cryogenic treatment on the metallurgy of ferrous alloys: A review. Mater. Manuf. Processes 2017, 32, 1789–1805. [Google Scholar] [CrossRef]
- Priyadarshini, M.; Behera, A.; Biswas, C.K. Effect of sub-zero temperatures on wear resistance of AISI P20 tool steel. J. Braz. Soc. Mech. Sci. Eng. 2020, 42, 212. [Google Scholar] [CrossRef]
- Özbek, N.A. Effects of cryogenic treatment types on the performance of coated tungsten tools in the turning of AISI H11 steel. J. Mater. Res. Technol. 2020, 9, 9442–9456. [Google Scholar] [CrossRef]
- Lyu, C.; Zhou, J.; Zhang, X.; Yao, Y.; Zhang, Y. Effect of heat treatment on microstructure and impact toughness of a Tungsten-Molybdenum powder metallurgical high-speed steel. Mater. Sci. Eng. A 2021, 815, 141268. [Google Scholar] [CrossRef]
- Fan, S.; Hao, H.; Meng, L.; Zhang, X. Effect of deep cryogenic treatment parameters on martensite multi-level microstructures and properties in a lath martensite/ferrite dual-phase steel. Mater. Sci. Eng. A 2021, 810, 141022. [Google Scholar] [CrossRef]
- Moshtaghi, M.; Safyari, M. Temperature mitigates the hydrogen embrittlement sensitivity of martensitic steels in slow strain rates. Vacuum 2022, 202, 11187. [Google Scholar] [CrossRef]
- Jun, L.Z.; Chang, S.J.; Hang, S.; Hua, D.Y.; Fu, Y.C.; Xing, Z. Effect of substructure on toughness of lath martensite/bainite mixed structure in low-carbon steels. J. Iron Steel Res. Int. 2010, 17, 40–48. [Google Scholar]
- Swarr, T.; Krauss, G. The effect of structure on the deformation of as-quenched and tempered martensite in a Fe-0.2 pct C alloy. Metall. Trans. A 1976, 7, 41–48. [Google Scholar] [CrossRef]
- Long, S.L.; Liang, Y.L.; Jiang, Y.; Liang, Y.; Ming, Y.; Yi, Y.L. Effect of quenching temperature on martensite multi-level microstructures and properties of strength and toughness in 20CrNi2Mo steel. Mater. Sci. Eng. A 2016, 676, 38–47. [Google Scholar] [CrossRef]
- Cardoso, P.H.S.; Israel, C.L.; da Silva, M.B.; Klein, G.A.; Soccol, L. Effects of deep cryogenic treatment on microstructure, impact toughness and wear resistance of an AISI D6 tool steel. Wear 2020, 456–457, 203382. [Google Scholar] [CrossRef]
- Fantineli, D.G.; Parcianello, C.T.; Rosendo, T.S.; Reguly, A.; Tier, M.D. Effect of heat and cryogenic treatment on wear and toughness of HSS AISI M2. J. Mater. Res. Technol. 2020, 9, 12354–12363. [Google Scholar] [CrossRef]
- Xu, G.; Huang, P.; Wei, Z.; Feng, Z.; Zu, G. Microstructural variations and mechanical properties of deep cryogenic treated AISI M35 high-speed steel tempered at various temperatures. J. Mater. Res. Technol. 2022, 17, 3371–3383. [Google Scholar] [CrossRef]
- Das, D.; Dutta, A.K.; Ray, K.K. Sub-zero treatments of AISI D2 steel: Part II. Wear behavior. Mater. Sci. Eng. A 2010, 527, 2194–2206. [Google Scholar] [CrossRef]
- Peng, H.; Hu, L.; Ngai, T.; Li, L.; Zhang, X.; Xie, H.; Gong, W. Effects of austenitizing temperature on microstructure and mechanical property of a 4-GPa-grade PM high-speed steel. Mater. Sci. Eng. A 2018, 719, 21–26. [Google Scholar] [CrossRef]
- Chaus, A.S.; Sahul, M. On origin of delta eutectoid carbide in M2 high-speed steel and its behaviour at high temperature. Mater. Lett. 2019, 256, 126605. [Google Scholar] [CrossRef]
- Kurdjumov, G.V. Martensite crystal lattice, mechanism of austenite-martensite transformation and behavior of carbon atoms in martensite. Metall. Trans. A 1976, 74, 999–1011. [Google Scholar]
- Villa, M.; Pantleon, K.; Somers, M.A.J. Evolution of compressive strains in retained austenite during sub-zero celsius martensite formation and tempering. Acta Mater. 2014, 65, 383–392. [Google Scholar] [CrossRef]
- Akhiani, H.; Nezakat, M.; Sanayei, M.; Szpunar, J. The effect of thermo-mechanical processing on grain boundary character distribution in Incoloy 800H/HT. Mater. Sci. Eng. A 2015, 626, 51–60. [Google Scholar] [CrossRef]
- Gale, W.F.; Totemeier, T.C. Smithells Metals Reference Book, 8th ed.; Elsevier Butterworth-Heinemann: Oxford, UK, 2004. [Google Scholar]
- Kumar, S.; Nagraj, M.; Bongale, A.; Khedkar, N. Deep cryogenic treatment of AISI M2 tool steel and optimisation of its wear characteristics using taguchi‘s approach. Arab. J. Sci. Eng. 2018, 43, 4917–4929. [Google Scholar] [CrossRef]
- Li, S.; Min, N.; Li, J.; Wu, X.; Li, C.; Tang, L. Experimental verification of segregation of carbon and precipitation of carbides due to deep cryogenic treatment for tool steel by internal friction method. Mater. Sci. Eng. A 2013, 575, 51–60. [Google Scholar] [CrossRef]
- Xu, X.; Ren, X.; Hou, H.; Luo, X. Effects of cryogenic and annealing treatment on microstructure and properties of friction stir welded TA15 joints. Mater. Sci. Eng. A 2021, 804, 140750. [Google Scholar] [CrossRef]
- Yan, Z.; Liu, K.; Eckert, J. Effect of tempering and deep cryogenic treatment on microstructure and mechanical properties of Cr–Mo–V–Ni steel. Mater. Sci. Eng. A 2020, 787, 139520. [Google Scholar] [CrossRef]
- Jurči, P.; Ďurica, J.; Dlouhý, I.; Horník, J.; Planieta, R.; Kralovič, D. Application of −140 °C sub-zero treatment for Cr-V ledeburitic steel service performance improvement. Metall. Mater. Trans. A 2019, 50, 2413–2434. [Google Scholar] [CrossRef]
- Shi, Z.M.; Gong, W.; Tomota, Y.; Harjo, S.; Li, J.; Chi, B.; Pu, J. Study of tempering behavior of lath martensite using in situ neutron diffraction. Mater. Charact. 2015, 107, 29–32. [Google Scholar] [CrossRef]
- Li, S.; Yuan, X.; Jiang, W.; Sun, H.; Li, J.; Zhao, K.; Yang, M. Effects of heat treatment influencing factors on microstructure and mechanical properties of a low-carbon martensitic stainless bearing steel. Mater. Sci. Eng. A 2014, 605, 229–235. [Google Scholar] [CrossRef]
- Sarkari Khorrami, M.; Mostafaei, M.A.; Pouraliakbar, H.; Kokabi, A.H. Study on microstructure and mechanical characteristics of low-carbon steel and ferritic stainless steel joints. Mater. Sci. Eng. A 2014, 608, 35–45. [Google Scholar] [CrossRef]
- Weng, Z.; Gu, K.; Wang, K.; Liu, X.; Wang, J. The reinforcement role of deep cryogenic treatment on the strength and toughness of alloy structural steel. Mater. Sci. Eng. A 2020, 772, 138698. [Google Scholar] [CrossRef]
- Tummalapalli, M.K.; Szpunar, J.A.; Prasad, A.; Bichler, L. EBSD studies on microstructure and crystallographic orientation of UO2-Mo composite fuels. Nucl. Eng. and Technol. 2021, 53, 4052–4059. [Google Scholar] [CrossRef]


| Parameters | Element (wt %) | ||||||||
|---|---|---|---|---|---|---|---|---|---|
| C | W | Mo | V | Cr | Co | S | P | Fe | |
| Selected steel | 0.92 | 5.97 | 5.13 | 1.84 | 3.82 | 5.00 | 0.03 | 0.03 | Balance |
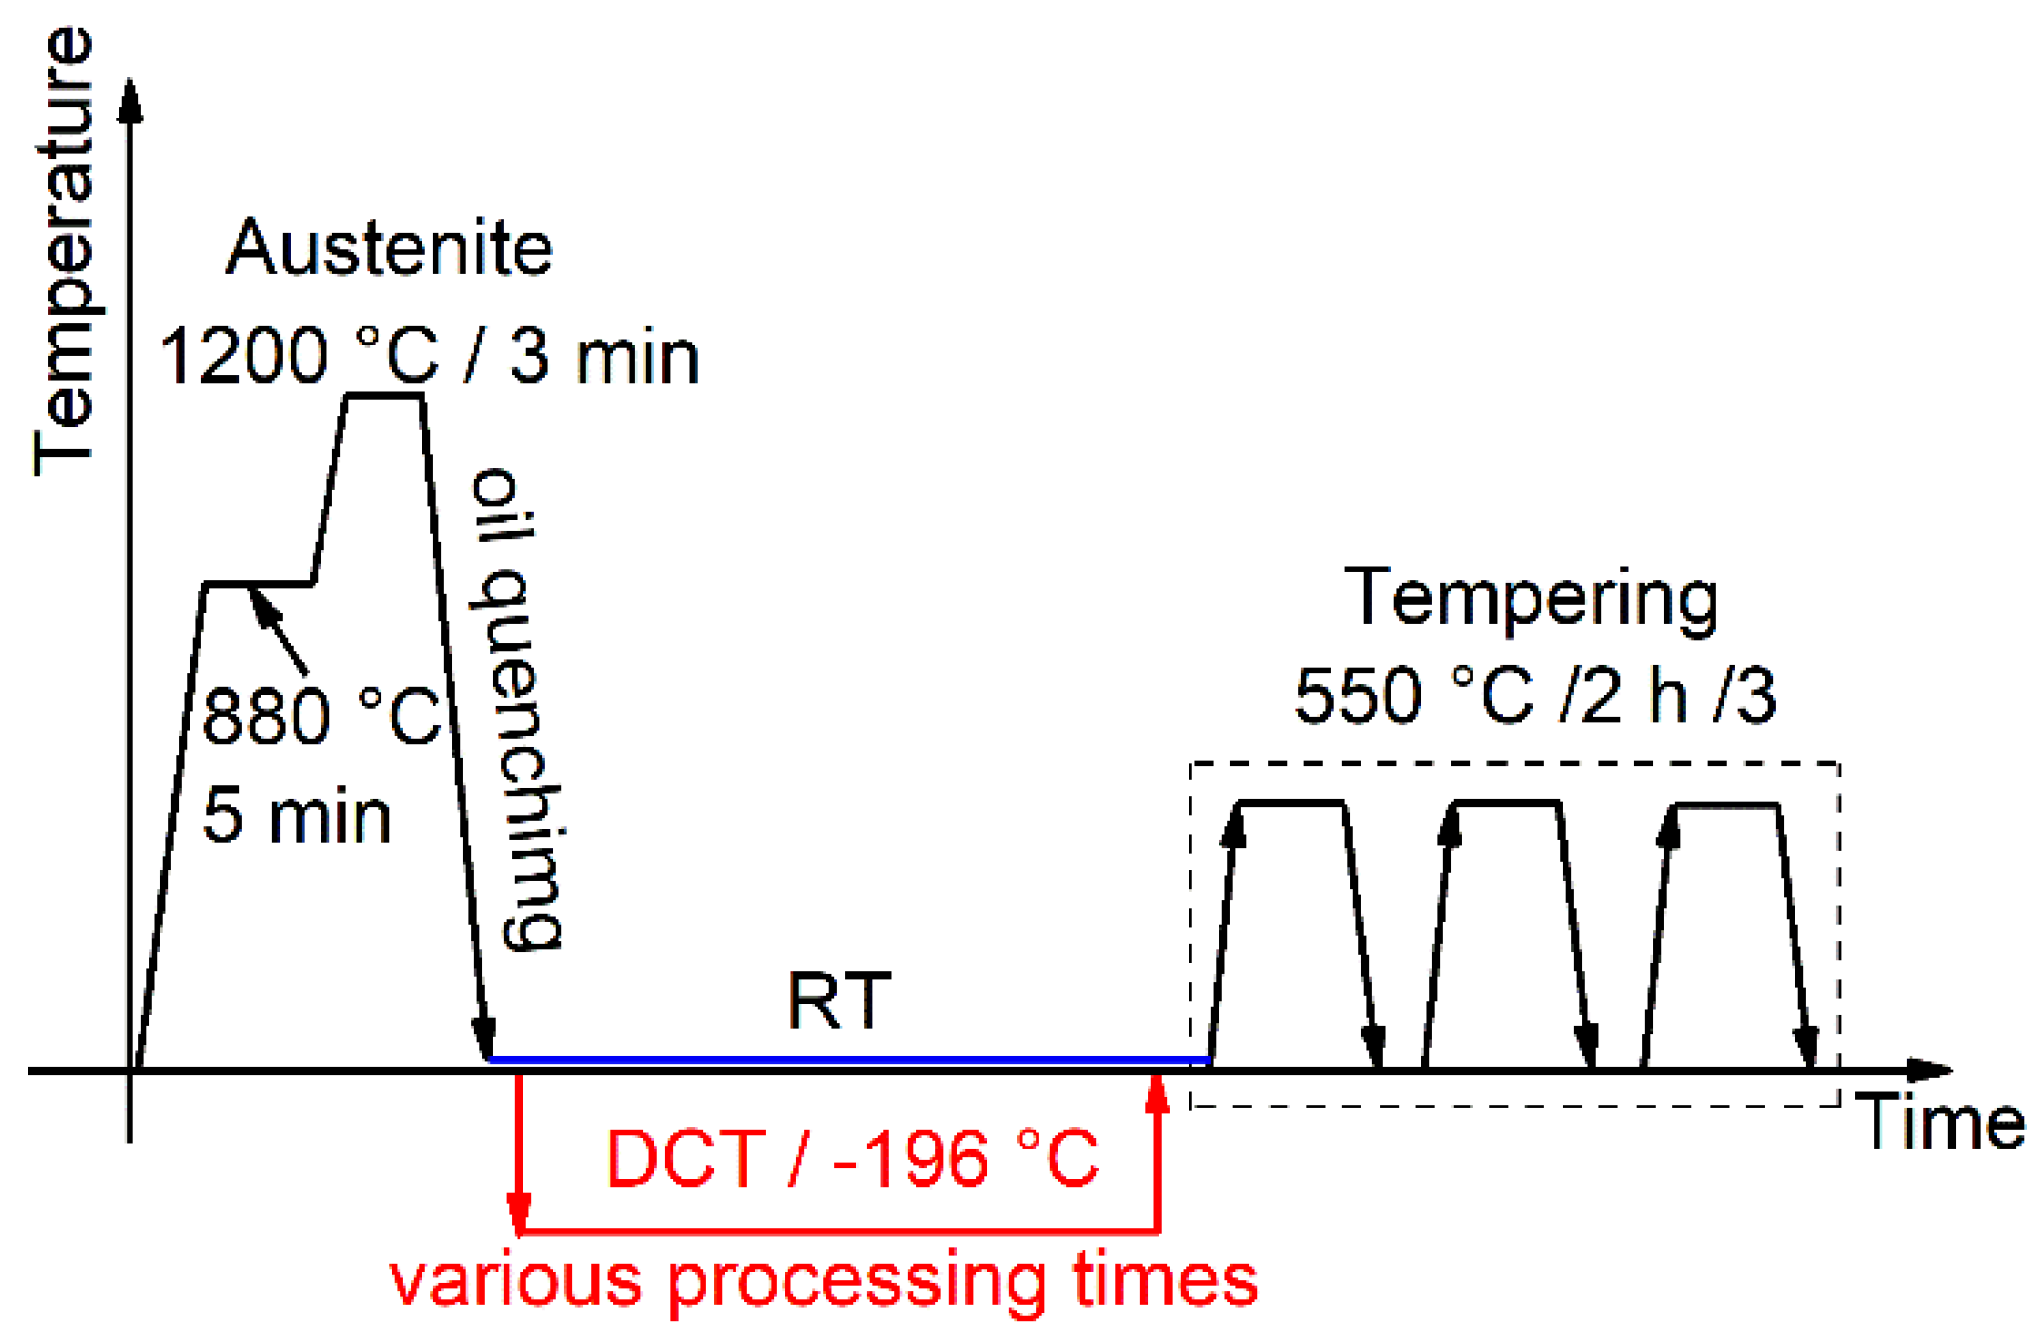
| Groups | Detail of Treatment | Sample Codes |
|---|---|---|
| 1 | Quenching | Q |
| 2 | Quenching + tempering (550 °C × 2 h × 3) | Q-T |
| 3 | Quenching + DCT (x min/h) | Dxmin/h |
| 4 | Quenching + DCT (x min/h) + tempering (550 °C × 2 h × 3) | Dxmin/h-T |
| Groups | Tetragonality (c/a) | Carbon Concentration (Cc)/ wt % |
|---|---|---|
| Q | 1.001482 | 0.032 |
| D5min | 1.004918 | 0.107 |
| D5h | 1.005337 | 0.115 |
| D12h | 1.005473 | 0.119 |
| Size/μm | Q | D5min | D5h | D12h |
|---|---|---|---|---|
| db | 1.135 | 1.106 | 1.028 | 1.021 |
| dl | 0.124 | 0.119 | 0.107 | 0.103 |
Publisher’s Note: MDPI stays neutral with regard to jurisdictional claims in published maps and institutional affiliations. |
© 2022 by the authors. Licensee MDPI, Basel, Switzerland. This article is an open access article distributed under the terms and conditions of the Creative Commons Attribution (CC BY) license (https://creativecommons.org/licenses/by/4.0/).
Share and Cite
Xu, G.; Huang, P.; Feng, Z.; Wei, Z.; Zu, G. Effect of Deep Cryogenic Time on Martensite Multi-Level Microstructures and Mechanical Properties in AISI M35 High-Speed Steel. Materials 2022, 15, 6618. https://doi.org/10.3390/ma15196618
Xu G, Huang P, Feng Z, Wei Z, Zu G. Effect of Deep Cryogenic Time on Martensite Multi-Level Microstructures and Mechanical Properties in AISI M35 High-Speed Steel. Materials. 2022; 15(19):6618. https://doi.org/10.3390/ma15196618
Chicago/Turabian StyleXu, Guili, Peng Huang, Zhanhao Feng, Zhenxiong Wei, and Guoyin Zu. 2022. "Effect of Deep Cryogenic Time on Martensite Multi-Level Microstructures and Mechanical Properties in AISI M35 High-Speed Steel" Materials 15, no. 19: 6618. https://doi.org/10.3390/ma15196618
APA StyleXu, G., Huang, P., Feng, Z., Wei, Z., & Zu, G. (2022). Effect of Deep Cryogenic Time on Martensite Multi-Level Microstructures and Mechanical Properties in AISI M35 High-Speed Steel. Materials, 15(19), 6618. https://doi.org/10.3390/ma15196618