
Effects of Limestone Powder on the Early Hydration Behavior of Ye’elimite: Experimental Research and Thermodynamic Modelling

Abstract
:1. Introduction
2. Materials and Methods
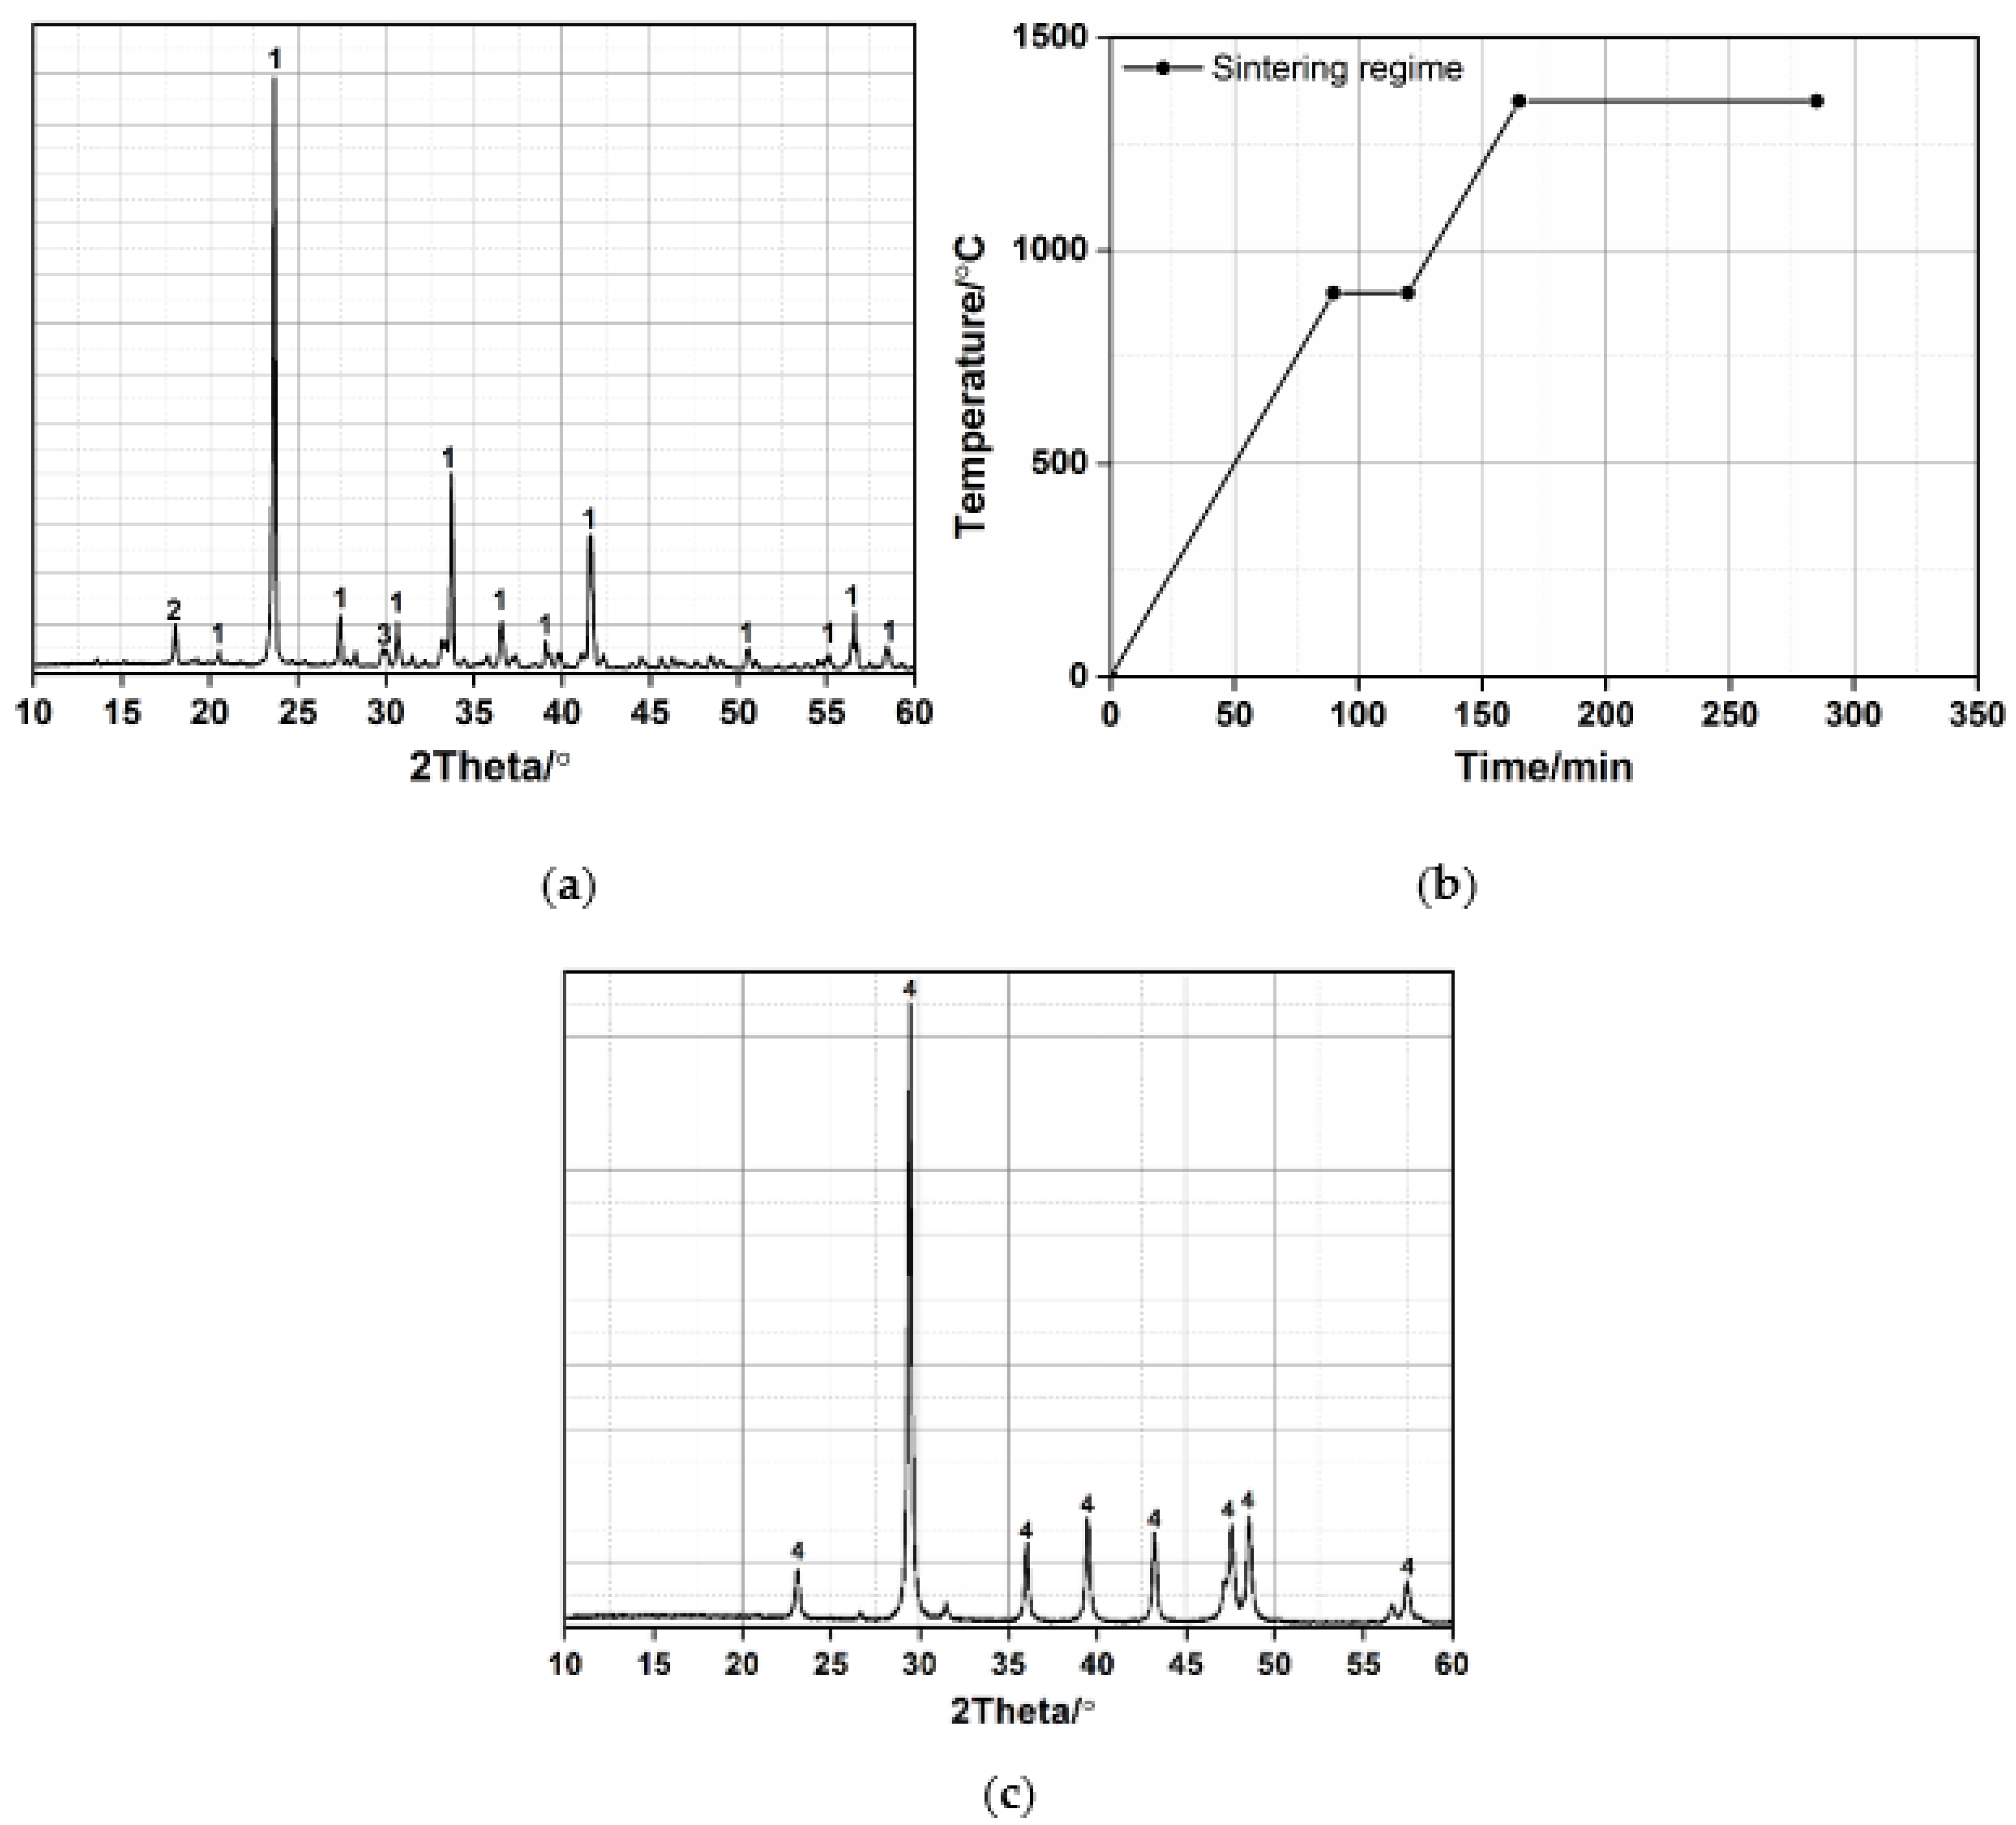
2.1. Materials
2.2. Experimental Procedure
2.3. Experimental Test
2.3.1. Isothermal Calorimetry
2.3.2. X-ray Diffraction
2.3.3. Chemical Shrinkage Test
2.3.4. Thermodynamic Modelling Analysis
3. Results and Discussions
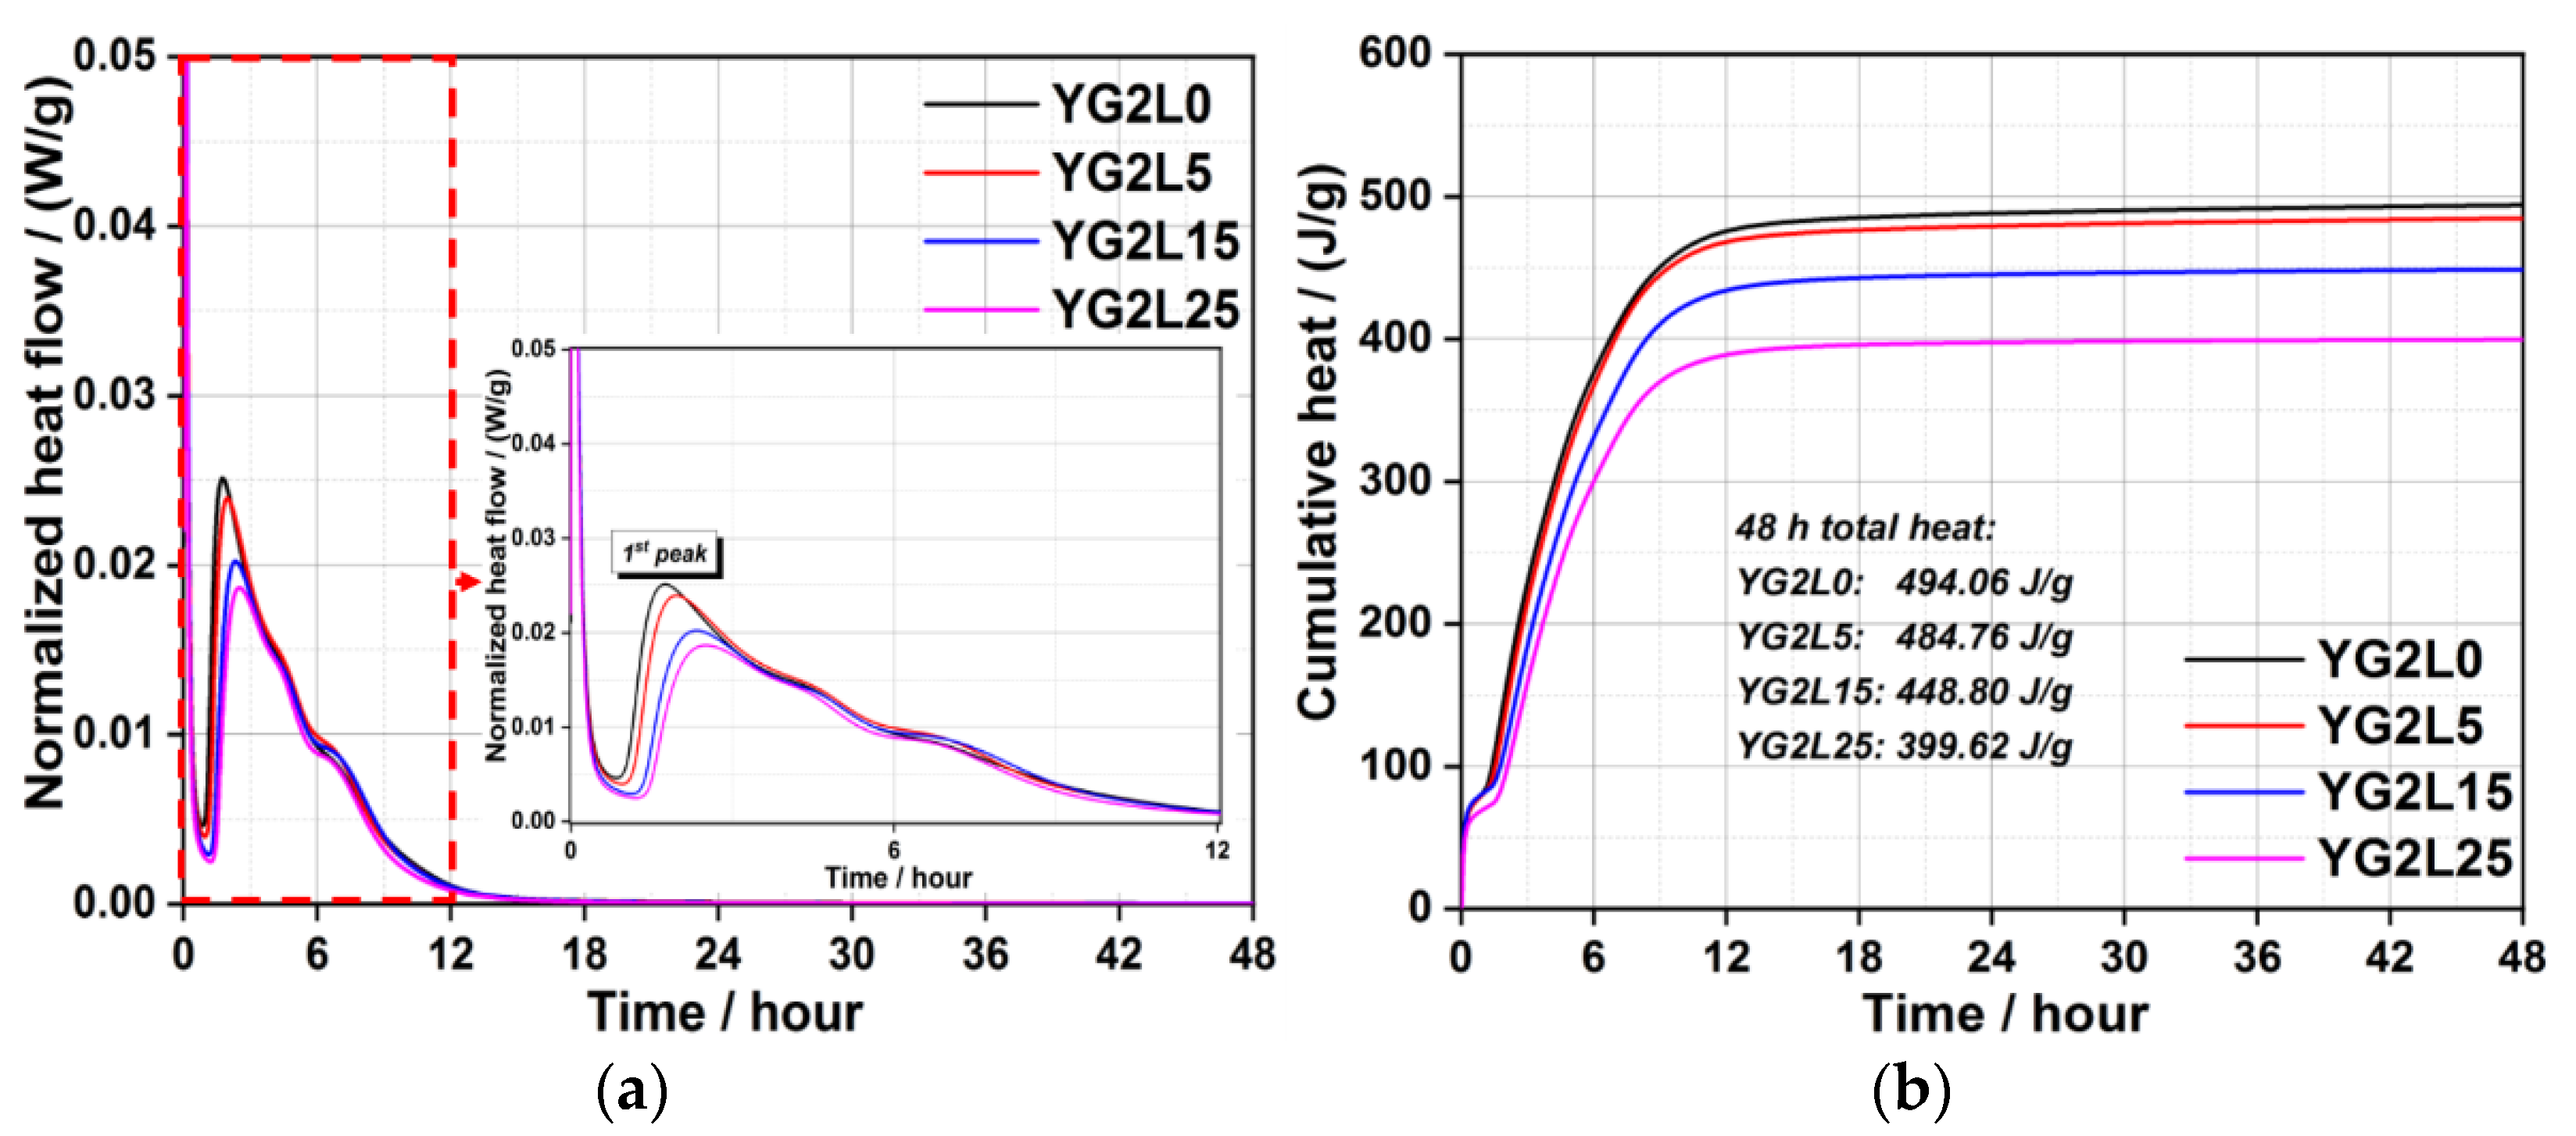
3.1. Hydration Kinetics
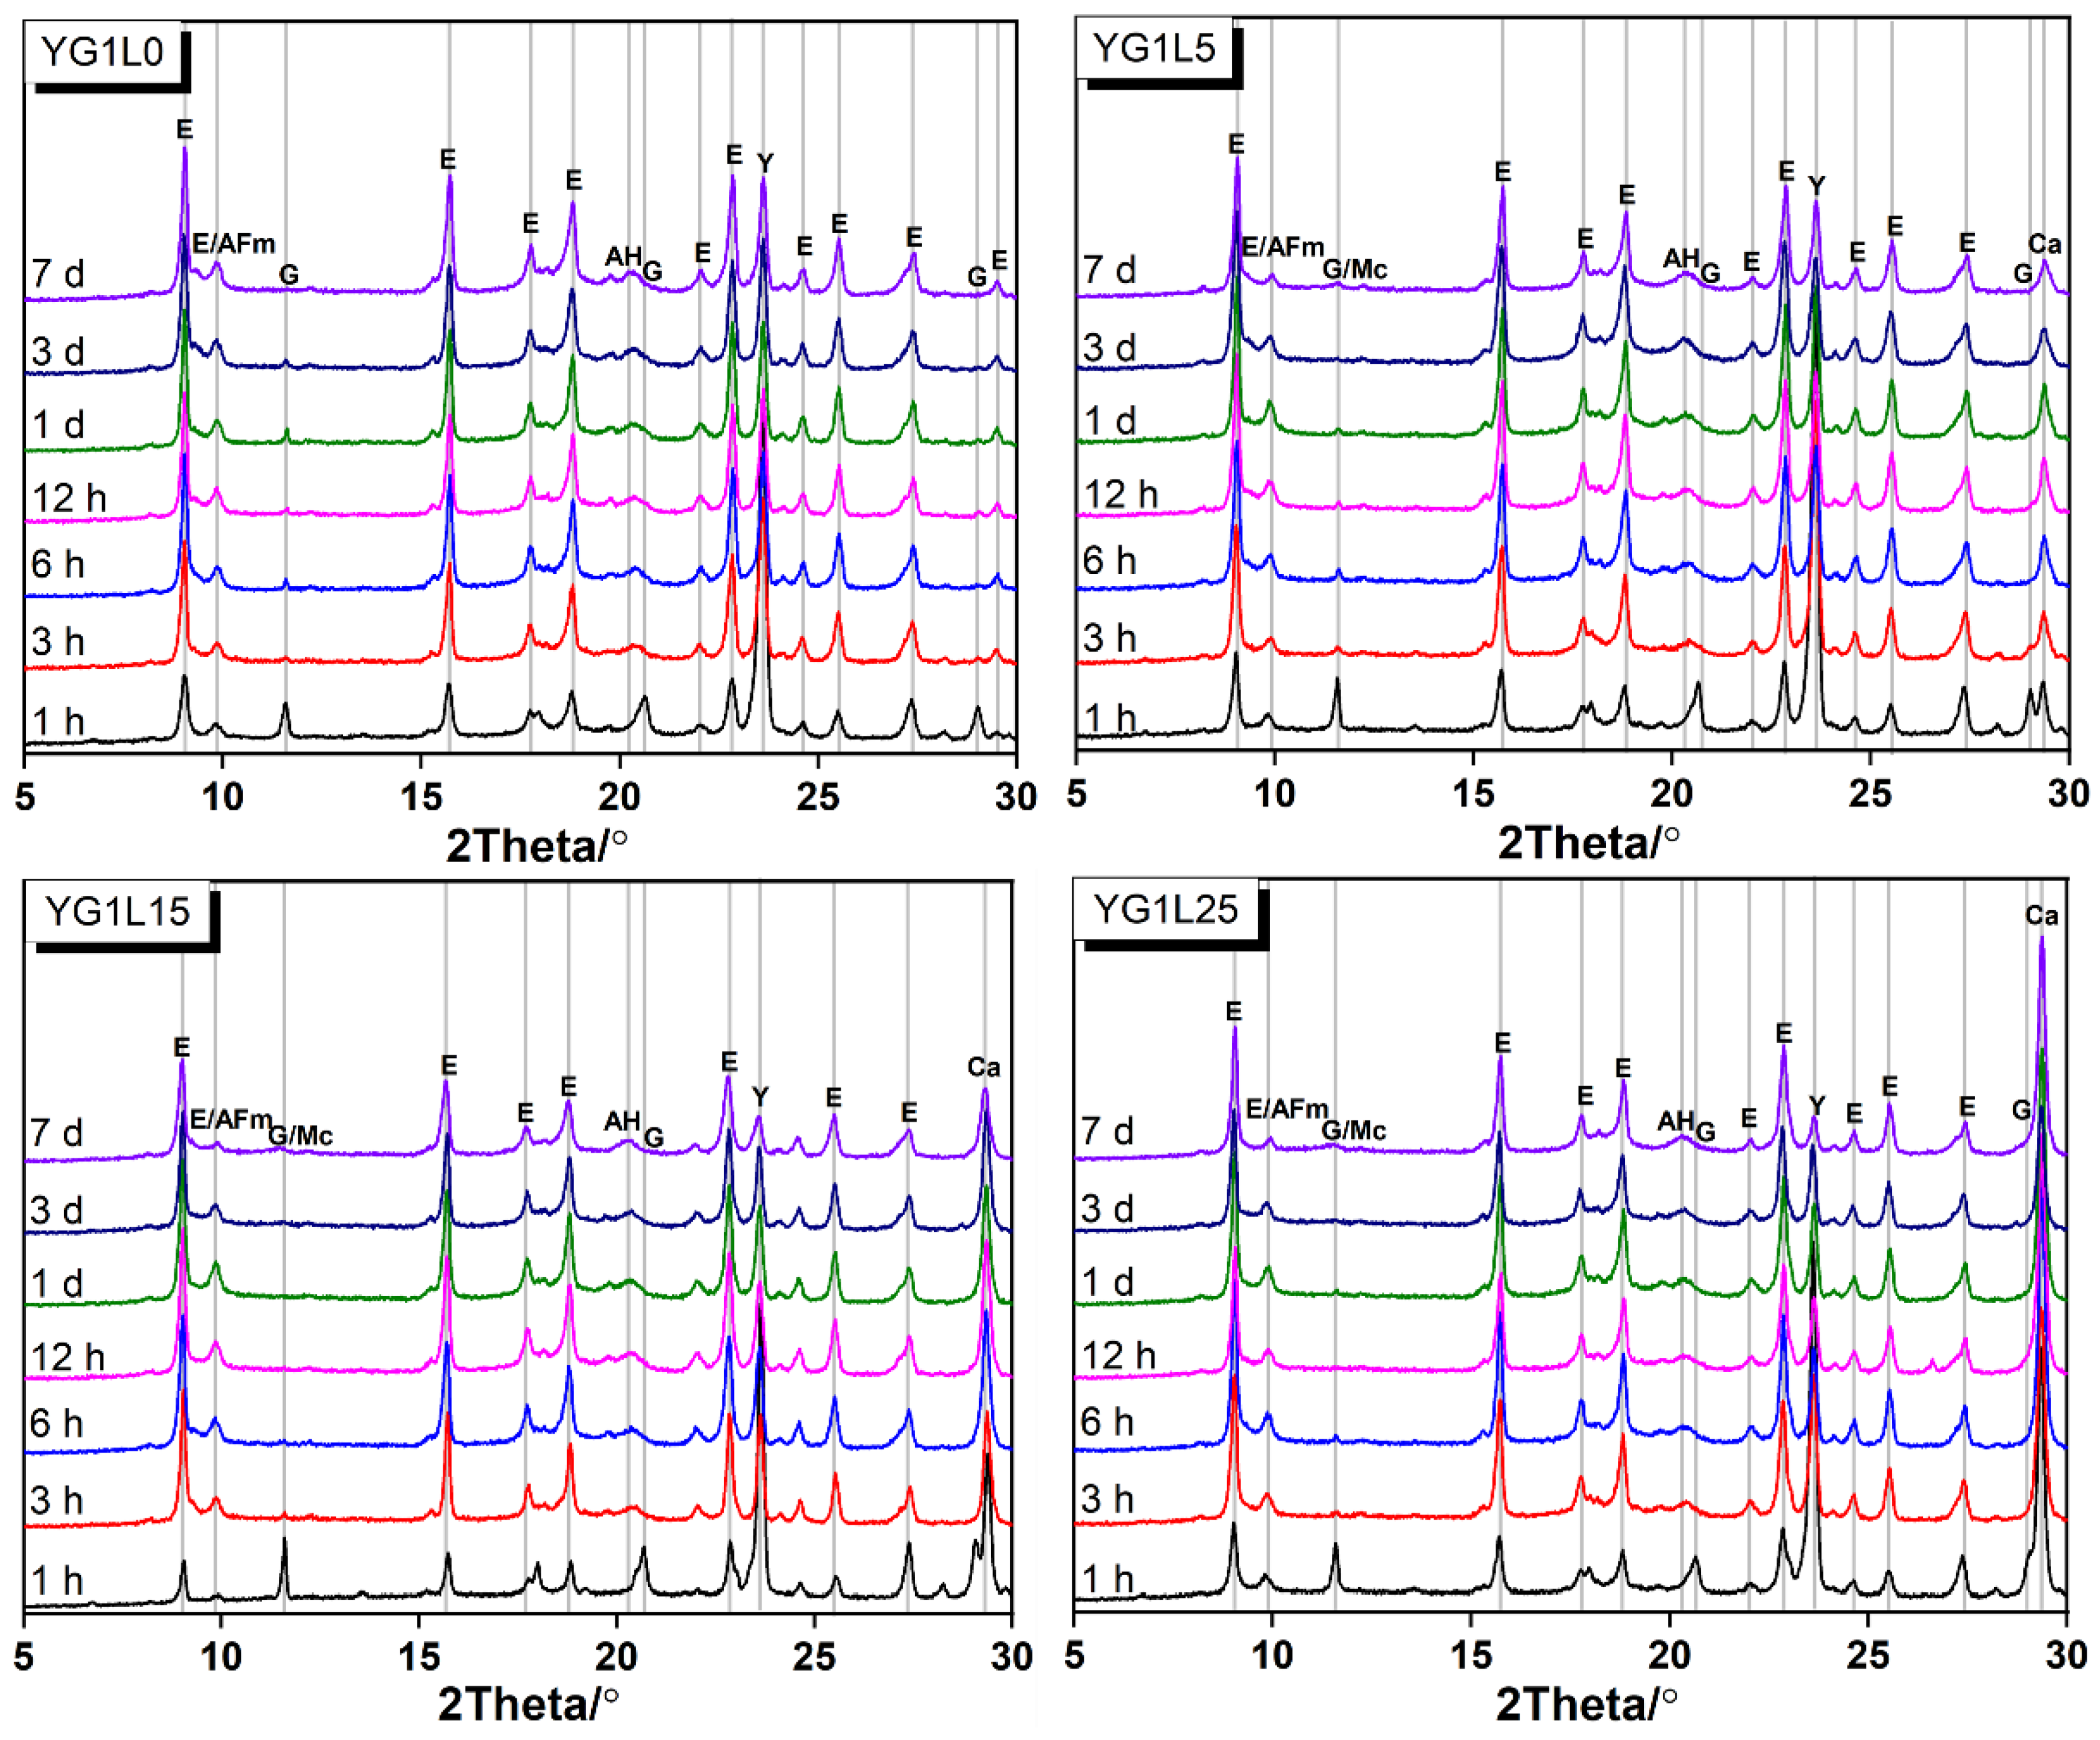
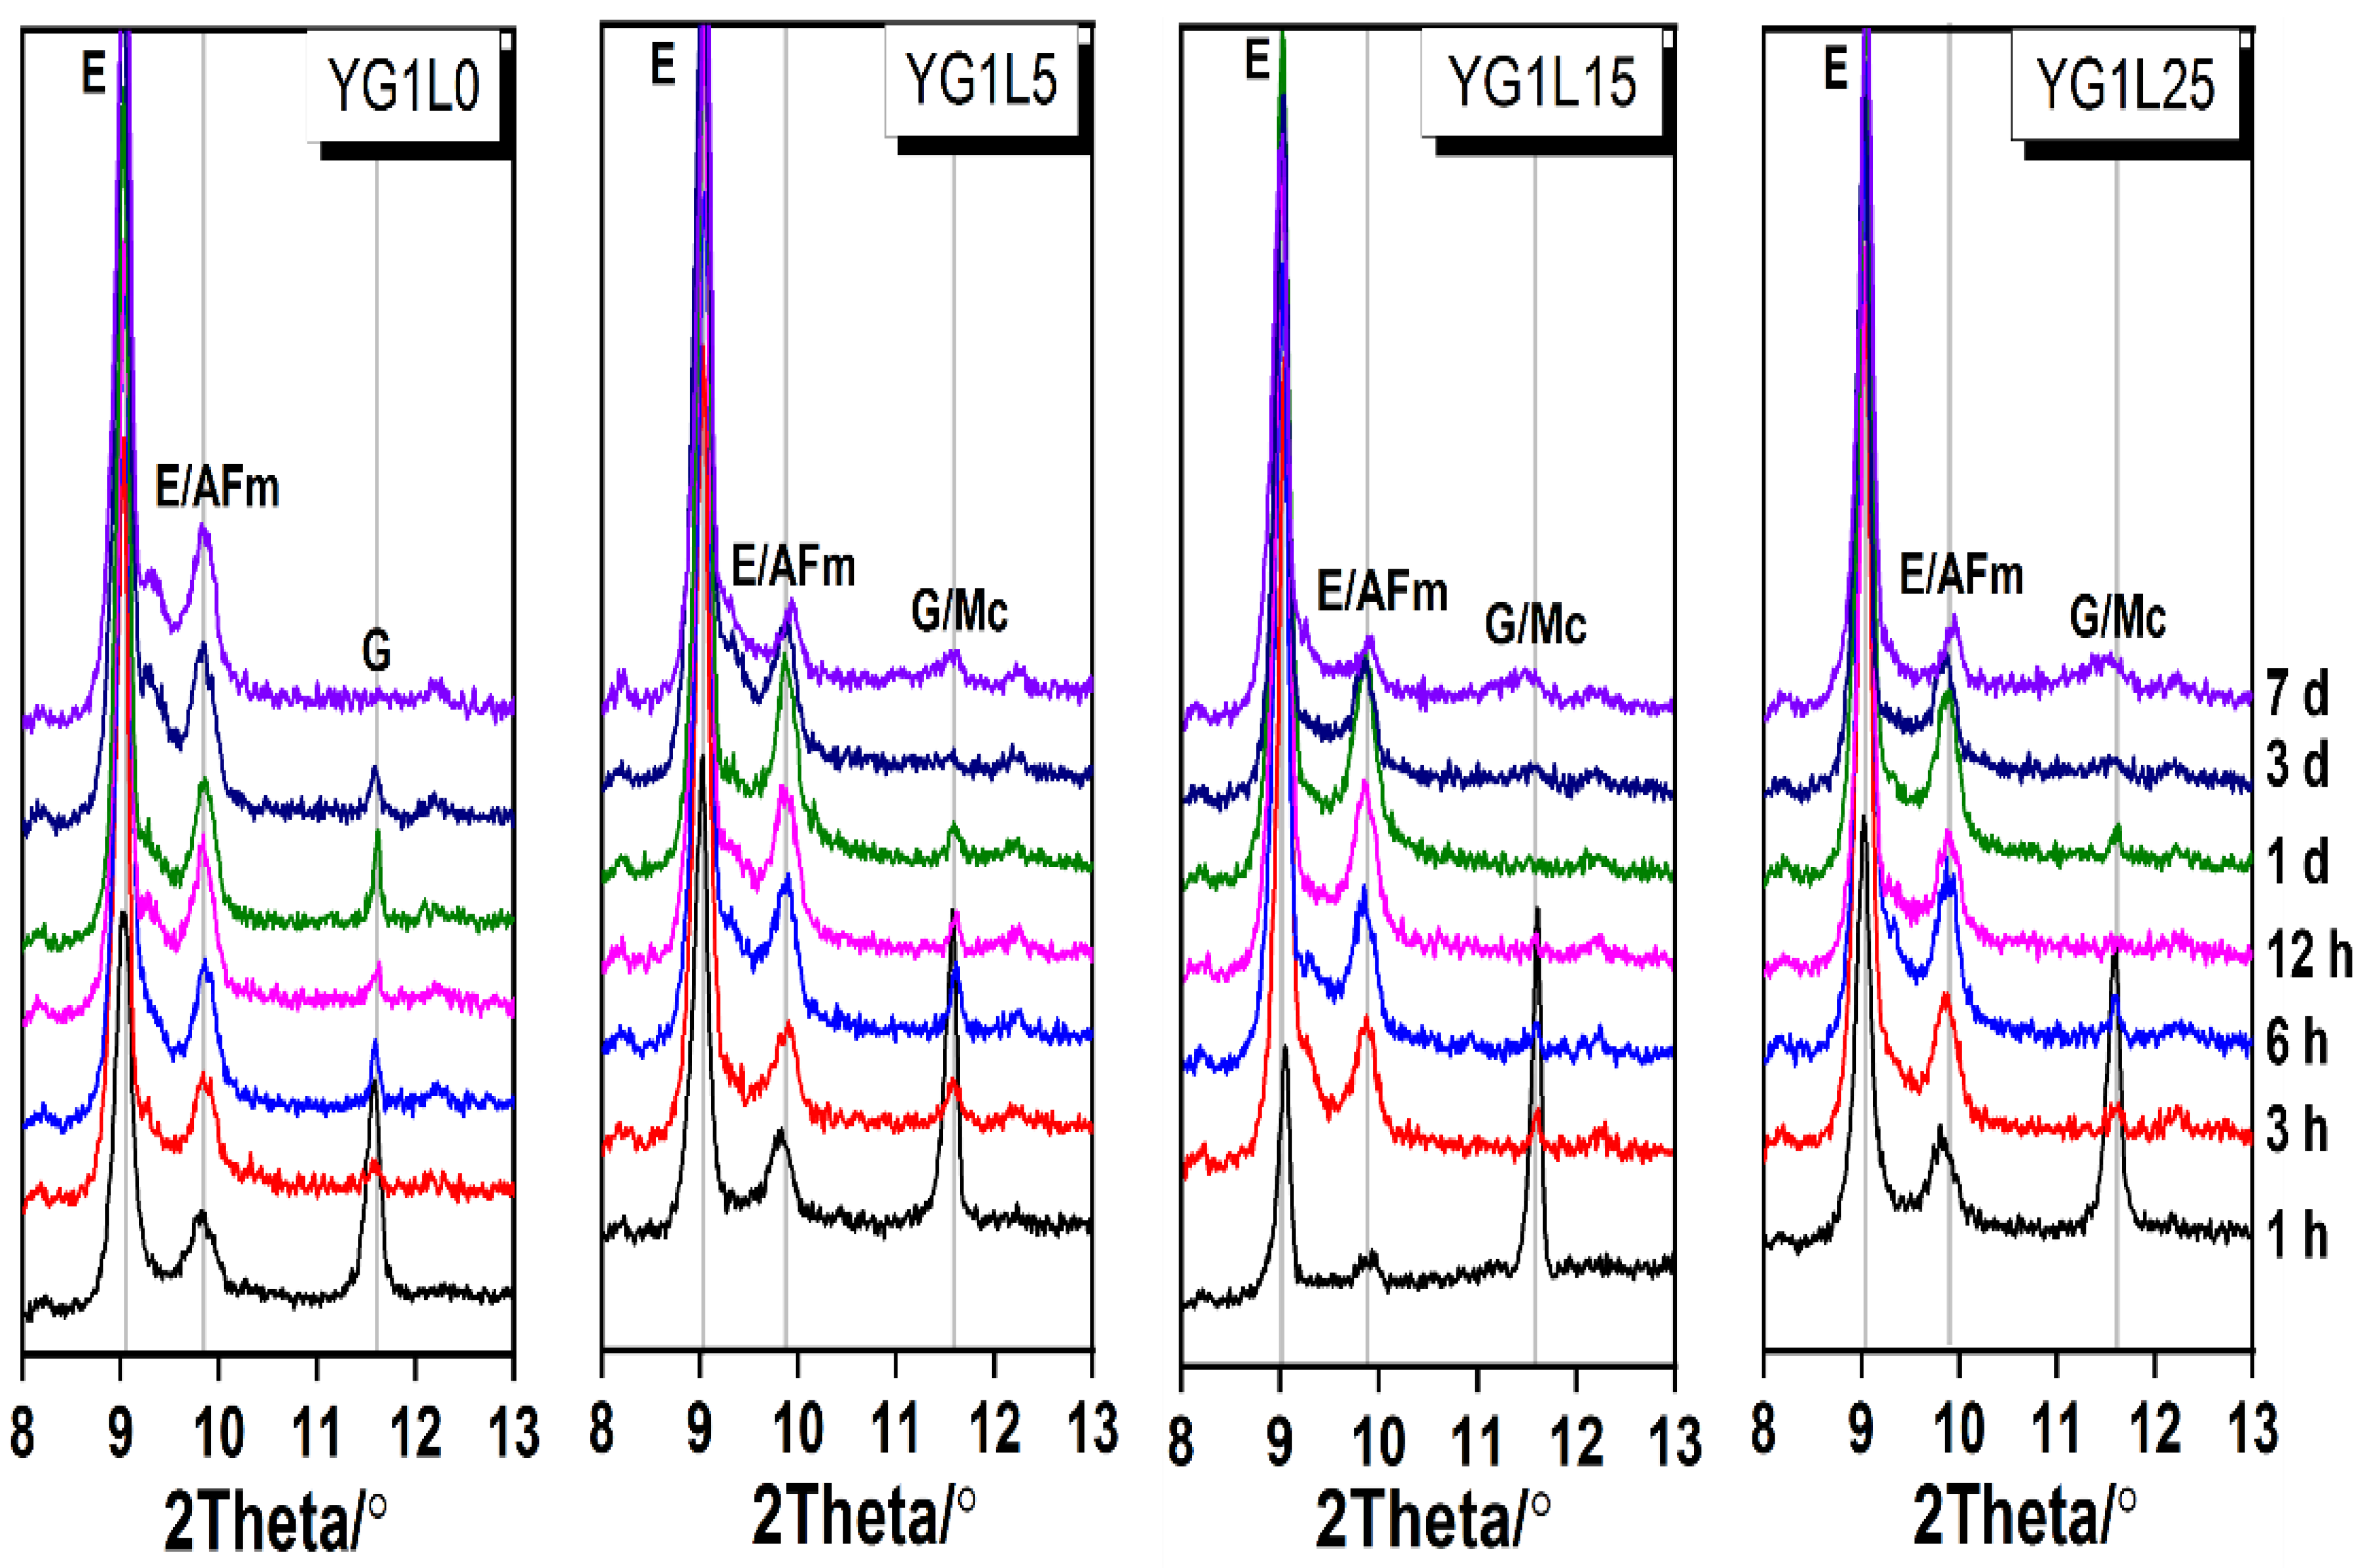
3.2. XRD Analysis
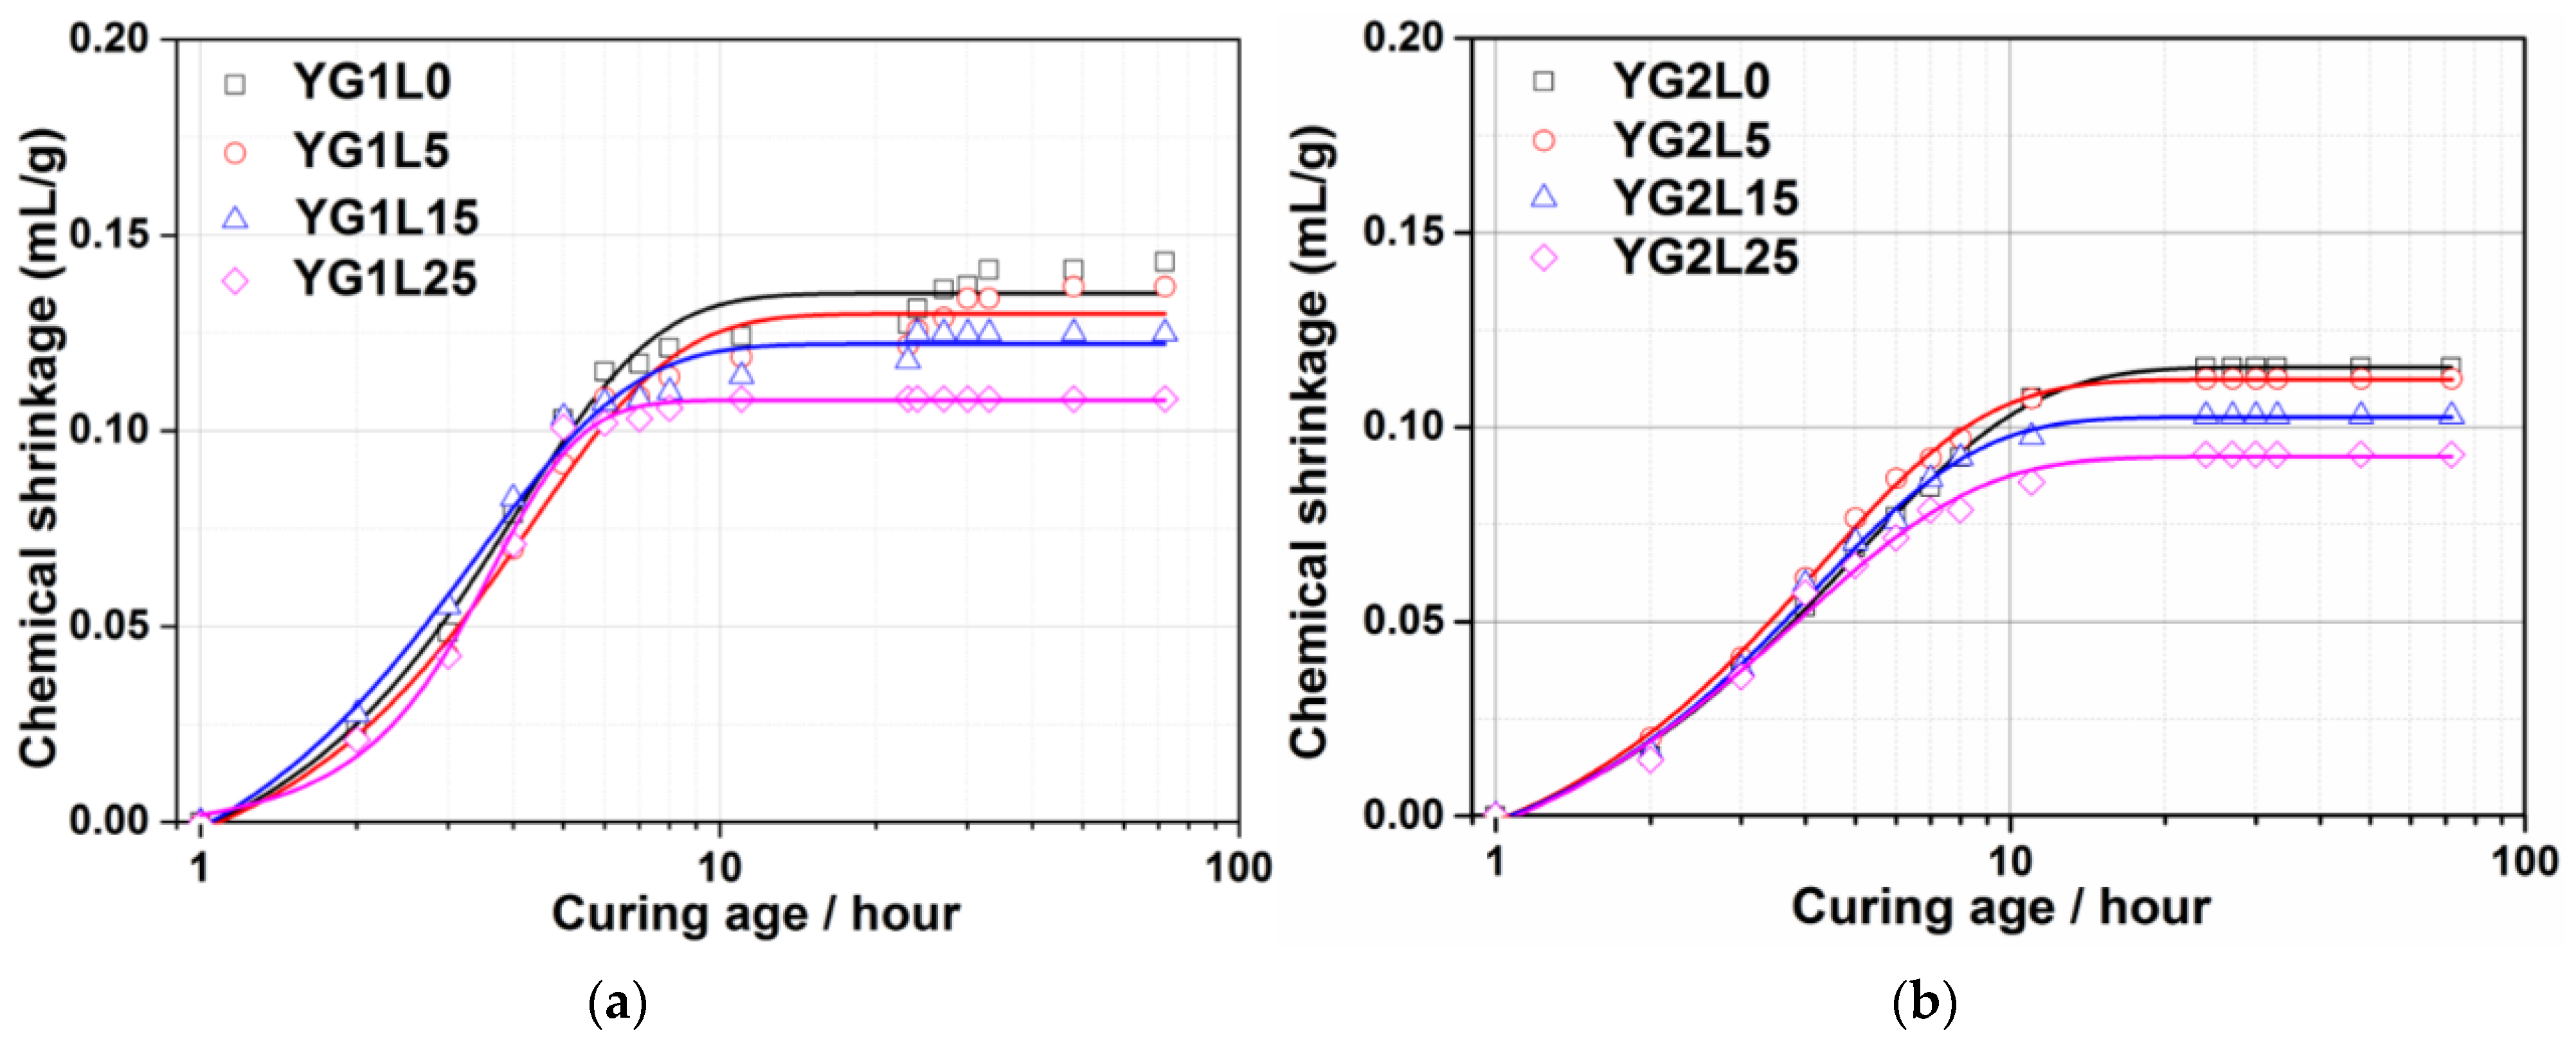
3.3. Chemical Shrinkage
3.4. Thermodynamic Modelling
4. Conclusions
- (1)
- The systems with 5 wt.% LP have a comparable hydration heat evolution with LP-free systems.
- (2)
- LP can retard the formation of the AFm phase, especially when the LP content is 25 wt.%.
- (3)
- The formation of Mc is highly related to the M-value of system. When the M-value is 1, LP can participate in the hydration reaction to produce Mc; when the M-value is 2, LP cannot participate in the hydration reaction. Hc is not found in all systems.
- (4)
- LP can reduce the total CS of all systems regardless of M-value. The level-off time shortens with the increase of LP dosage, especially when the LP content is 25 wt.%.
- (5)
- Mc is no longer generated in all systems when the M-value exceeds 1.27, according to the thermodynamic modelling results. The content of AFm decreases with the increase of the M value and LP dosage. Excess LP always exists in the systems containing 15 wt.% and 25 wt.% LP.
Author Contributions
Funding
Acknowledgments
Conflicts of Interest
References
- OECD/IEA, CSI. Technology Road Map Low-Carbon Transition in the Cement Industry; IEA: Paris, France, 2018. [Google Scholar]
- van Deventer, J.S.J.; White, C.E.; Myers, R.J. A Roadmap for Production of Cement and Concrete with Low-CO2 Emissions. Waste Biomass Valori. 2020, 12, 4745–4775. [Google Scholar] [CrossRef]
- Liu, Y.; Xu, Y.; Geng, C. Sulfoaluminate Cement: An Alternative to Portland Cement. Adv. Cem. Res. 2011, 368–373, 478–484. [Google Scholar] [CrossRef]
- Shi, C.; Qu, B.; Provis, J.L. Recent progress in low-carbon binders. Cem. Concr. Res. 2019, 122, 227–250. [Google Scholar] [CrossRef]
- Diao, J.; Xin, Z.; Zhang, Q. Production and Application of Calcium Sulphoaluminate Cement; China Building Materials Industry Press: Beijing, China, 2006. [Google Scholar]
- Provis, J.L. Alkali-activated materials. Cem. Concr. Res. 2018, 114, 40–48. [Google Scholar] [CrossRef]
- Nergis, D.D.B.; Abdullah, M.M.A.B.; Vizureanu, P.; Tahir, M.F.M. Geopolymers and Their Uses: Review. IOP Conf. Ser. Mater. Sci. Eng. 2018, 374, 012019. [Google Scholar] [CrossRef]
- Yoon, H.N.; Seo, J.; Kim, S.; Lee, H.K.; Park, S. Hydration of calcium sulfoaluminate cement blended with blast-furnace slag. Constr. Build. Mater. 2021, 268, 121214. [Google Scholar] [CrossRef]
- Sharp, J.H.; Lawrencef, C.D.; Yang, R. Calcium sulfoaluminate cements-low-energy cements, special cements or what? Adv. Cem. Res. 1999, 11, 3–13. [Google Scholar] [CrossRef]
- Živica, V.R. Properties of blended sulfoaluminate belite cement. Constr. Build Mater 2000, 14, 433–437. [Google Scholar] [CrossRef]
- Quillin, K. Performance of belite–sulfoaluminate cements. Cem. Concr. Res. 2001, 31, 1341–1349. [Google Scholar] [CrossRef]
- Ma, J.; Wang, H.N.; Yu, Z.Q.; Shi, H.; Wu, Q.; Shen, X. A systematic review on durability of calcium sulphoaluminate cement-based materials in chloride environment. J. Sustain. Cem. Based 2022, 1–12. [Google Scholar] [CrossRef]
- Aranda, M.A.G.; de la Torre, A.G. 18-Sulfoaluminate cement. In Eco-Efficient Concrete; Pacheco-Torgal, F., Jalali, S., Labrincha, J., John, V.M., Eds.; Woodhead Publishing: Sawston, UK, 2013; pp. 488–522. [Google Scholar]
- Zhang, P.; Chen, Y.; Shi, L. Research on the crystal structure of C4A3$. J. China Build. Mater. Acad. 1991, 3, 10–18. [Google Scholar]
- Hargis, C.; Moon, J.; Lothenbach, B.; Winnefeld, F.; Wenk, H.-R.; Monteiro, P. Calcium Sulfoaluminate Sodalite (Ca4Al6O12SO4) Crystal Structure Evaluation and Bulk Modulus Determination. J. Am. Ceram. Soc. 2014, 97, 892–898. [Google Scholar] [CrossRef]
- Allevi, S.; Marchi, M.; Scotti, F.; Bertini, S.; Cosentino, C. Hydration of calcium sulphoaluminate clinker with additions of different calcium sulphate sources. Mater. Struct. 2015, 49, 453–466. [Google Scholar] [CrossRef]
- Winnefeld, F.; Barlag, S. Calorimetric and thermogravimetric study on the influence of calcium sulfate on the hydration of ye’elimite. J. Therm. Anal. Calorim. 2009, 101, 949–957. [Google Scholar] [CrossRef]
- Marchi, M.; Costa, U. Influence of the calcium sulphate and w/c ratio on the hydration of calcium sulfoaluminate cement. In Proceedings of the 13th International Congress on the Chemistry of Cement, Madrid, Spain, 3 July 2011. [Google Scholar]
- Hargis, C.W.; Lothenbach, B.; Müller, C.J.; Winnefeld, F. Carbonation of calcium sulfoaluminate mortars. Cem. Concr. Compos. 2017, 80, 123–134. [Google Scholar] [CrossRef]
- Hargis, C.W.; Lothenbach, B.; Müller, C.J.; Winnefeld, F. Further insights into calcium sulfoaluminate cement expansion. Adv. Cem. Res. 2018, 31, 160–177. [Google Scholar] [CrossRef]
- Martin, L.H.J.; Winnefeld, F.; Müller, C.J.; Lothenbach, B. Contribution of limestone to the hydration of calcium sulfoaluminate cement. Cem. Concr. Compos. 2015, 62, 204–211. [Google Scholar] [CrossRef]
- Jeong, Y.; Hargis, C.W.; Chun, S.; Moon, J. Effect of Calcium Carbonate Fineness on Calcium Sulfoaluminate-Belite Cement. Materials 2017, 10, 900. [Google Scholar] [CrossRef]
- Ma, J.; Yu, Z.; Ni, C.; Shi, H.; Shen, X. Effects of limestone powder on the hydration and microstructure development of calcium sulphoaluminate cement under long-term curing. Constr. Build Mater. 2019, 199, 688–695. [Google Scholar] [CrossRef]
- Hargis, C.W.; Telesca, A.; Monteiro, P.J.M. Calcium sulfoaluminate (Ye’elimite) hydration in the presence of gypsum, calcite, and vaterite. Cem. Concr. Res. 2014, 65, 15–20. [Google Scholar] [CrossRef]
- Pelletier-Chaignat, L.; Winnefeld, F.; Lothenbach, B.; Müller, C.J. Beneficial use of limestone filler with calcium sulphoaluminate cement. Constr. Build Mater. 2012, 26, 619–627. [Google Scholar] [CrossRef]
- Bonavetti, V.L.; Rahhal, V.F.; Irassar, F.E. Studies on the carboaluminate formation in limestone filler-blended cements. Cem. Concr. Res. 2001, 31, 853–859. [Google Scholar] [CrossRef]
- Runcevski, T.; Dinnebier, R.E.; Magdysyuk, O.V.; Pollmann, H. Crystal structures of calcium hemicarboaluminate and carbonated calcium hemicarboaluminate from synchrotron powder diffraction data. Acta Crystallogr. Sect. B 2012, 68, 493–500. [Google Scholar] [CrossRef]
- Baquerizo, L.G.; Matschei, T.; Scrivener, K.L.; Saeidpour, M.; Wadsö, L. Hydration states of AFm cement phases. Cem. Concr. Res. 2015, 73, 143–157. [Google Scholar] [CrossRef]
- Kulik, D.A.; Wagner, T.; Dmytrieva, S.V.; Kosakowski, G.; Hingerl, F.F.; Chudnenko, K.V.; Berner, U.R. GEM-Selektor geochemical modeling package: Revised algorithm and GEMS3K numerical kernel for coupled simulation codes. Comput. Geosci. 2013, 17, 1–24. [Google Scholar] [CrossRef]
- Wagner, T.; Kulik, D.A.; Hingerl, F.F.; Dmytrieva, S.V. GEM-Selektor geochemical modeling package: TSolMod library and data interface for multicomponent phase models. Can. Mineral. 2012, 50, 1173–1195. [Google Scholar] [CrossRef]
- Hummel, W.; Berner, U.; Curti, E.; Pearson, F.J.; Thoenen, T. Nagra/PSI Chemical Thermodynamic Data Base 01/01. Radiochim. Acta 2002, 90, 805–813. [Google Scholar] [CrossRef]
- Matschei, T.; Lothenbach, B.; Glasser, F.P. Thermodynamic properties of Portland cement hydrates in the system CaO-Al2O3-SiO2-CaSO4-CaCO3-H2O. Cem. Concr. Res. 2007, 37, 1379–1410. [Google Scholar] [CrossRef]
- Lothenbach, B.; Pelletier-Chaignat, L.; Winnefeld, F. Stability in the system CaO-Al2O3-H2O. Cem. Concr. Res. 2012, 42, 1621–1634. [Google Scholar] [CrossRef]
- Lothenbach, B.; Matschei, T.; Möschner, G.; Glasser, F.P. Thermodynamic modelling of the effect of temperature on the hydration and porosity of Portland cement. Cem. Concr. Res. 2008, 38, 1–18. [Google Scholar] [CrossRef]
- Lothenbach, B.; Winnefeld, F. Thermodynamic modelling of the hydration of Portland cement. Cem. Concr. Res. 2006, 36, 209–226. [Google Scholar] [CrossRef]
- Helgeson, H.C.; Kirkham, D.H.; Flowers, G.C. Theoretical prediction of the thermodynamic behavior of aqueous electrolytes by high pressures and temperatures; IV, Calculation of activity coefficients, osmotic coefficients, and apparent molal and standard and relative partial molal properties to 600 degrees C and 5kb. Am. J. Sci. 1981, 281, 1249–1516. [Google Scholar]
- Wang, D.H.; Shi, C.J.; Farzadnia, N.; Shi, Z.; Jia, H.; Ou, Z. A review on use of limestone powder in cement-based materials: Mechanism, hydration and microstructures. Constr. Build. Mater. 2018, 181, 659–672. [Google Scholar] [CrossRef]
- Lothenbach, B.; le Saout, G.; Gallucci, E.; Scrivener, K. Influence of limestone on the hydration of Portland cements. Cem. Concr. Res. 2008, 38, 848–860. [Google Scholar] [CrossRef]
- Winnefeld, F.; Lothenbach, B. Hydration of calcium sulfoaluminate cements–Experimental findings and thermodynamic modelling. Cem. Concr. Res. 2010, 40, 1239–1247. [Google Scholar] [CrossRef]
- Bullerjahn, F. Characterisation and Hydration of Ye’elimite Containing Cements; EPFL: Vaud, Switzerland, 2018. [Google Scholar]
- Lothenbach, B. Thermodynamic equilibrium calculations in cementitious systems. Mater. Struct. 2010, 43, 1413–1433. [Google Scholar] [CrossRef]
- Zajac, M.; Skocek, J.; Bullerjahn, F.; Lothenbach, B.; Scrivener, K.; Haha, M.B. Early hydration of ye’elimite: Insght from thermodynamic modelling. Cem. Concr. Res. 2019, 120, 152–163. [Google Scholar] [CrossRef]


| Oxides | CaO | SiO2 | Al2O3 | SO3 | Fe2O3 | MgO | K2O | Na2O | LOI |
|---|---|---|---|---|---|---|---|---|---|
| wt.% | 55.34 | 0.68 | 0.09 | 0.017 | 0.09 | 0.22 | 0.004 | 0.002 | 43.5 |
| Number | M-Value | Water/Binder | Proportion/wt.% | ||
|---|---|---|---|---|---|
| CaSO4·2H2O | Limestone Powder | ||||
| YG1L0 | 1 | 1 | 78.0 | 22.0 | 0 |
| YG1L5 | 74.1 | 20.9 | 5.0 | ||
| YG1L15 | 66.3 | 18.7 | 15.0 | ||
| YG1L25 | 58.5 | 16.5 | 25.0 | ||
| YG2L0 | 2 | 63.9 | 36.1 | 0 | |
| YG2L5 | 60.7 | 34.3 | 5.0 | ||
| YG2L15 | 54.3 | 30.7 | 15.0 | ||
| YG2L25 | 47.9 | 27.1 | 25.0 | ||
Publisher’s Note: MDPI stays neutral with regard to jurisdictional claims in published maps and institutional affiliations. |
© 2022 by the authors. Licensee MDPI, Basel, Switzerland. This article is an open access article distributed under the terms and conditions of the Creative Commons Attribution (CC BY) license (https://creativecommons.org/licenses/by/4.0/).
Share and Cite
Ma, J.; Wang, T.; Shi, H.; Yu, Z.; Shen, X. Effects of Limestone Powder on the Early Hydration Behavior of Ye’elimite: Experimental Research and Thermodynamic Modelling. Materials 2022, 15, 6645. https://doi.org/10.3390/ma15196645
Ma J, Wang T, Shi H, Yu Z, Shen X. Effects of Limestone Powder on the Early Hydration Behavior of Ye’elimite: Experimental Research and Thermodynamic Modelling. Materials. 2022; 15(19):6645. https://doi.org/10.3390/ma15196645
Chicago/Turabian StyleMa, Jian, Ting Wang, Hu Shi, Zhuqing Yu, and Xiaodong Shen. 2022. "Effects of Limestone Powder on the Early Hydration Behavior of Ye’elimite: Experimental Research and Thermodynamic Modelling" Materials 15, no. 19: 6645. https://doi.org/10.3390/ma15196645
APA StyleMa, J., Wang, T., Shi, H., Yu, Z., & Shen, X. (2022). Effects of Limestone Powder on the Early Hydration Behavior of Ye’elimite: Experimental Research and Thermodynamic Modelling. Materials, 15(19), 6645. https://doi.org/10.3390/ma15196645