
Analysis of the Effect of Carbonation Rate on the Concrete Water Reservoir Structures According to Applied Waterproofing/Anticorrosive Methods


Abstract
:1. Introduction
2. Materials and Methods
2.1. Water Supply Reservoir Specifications
2.2. Assessment of Carbonation Depth
3. Results and Discussion
3.1. Carbonation Depth Measurement Results
3.2. Carbonation Depth Analysis
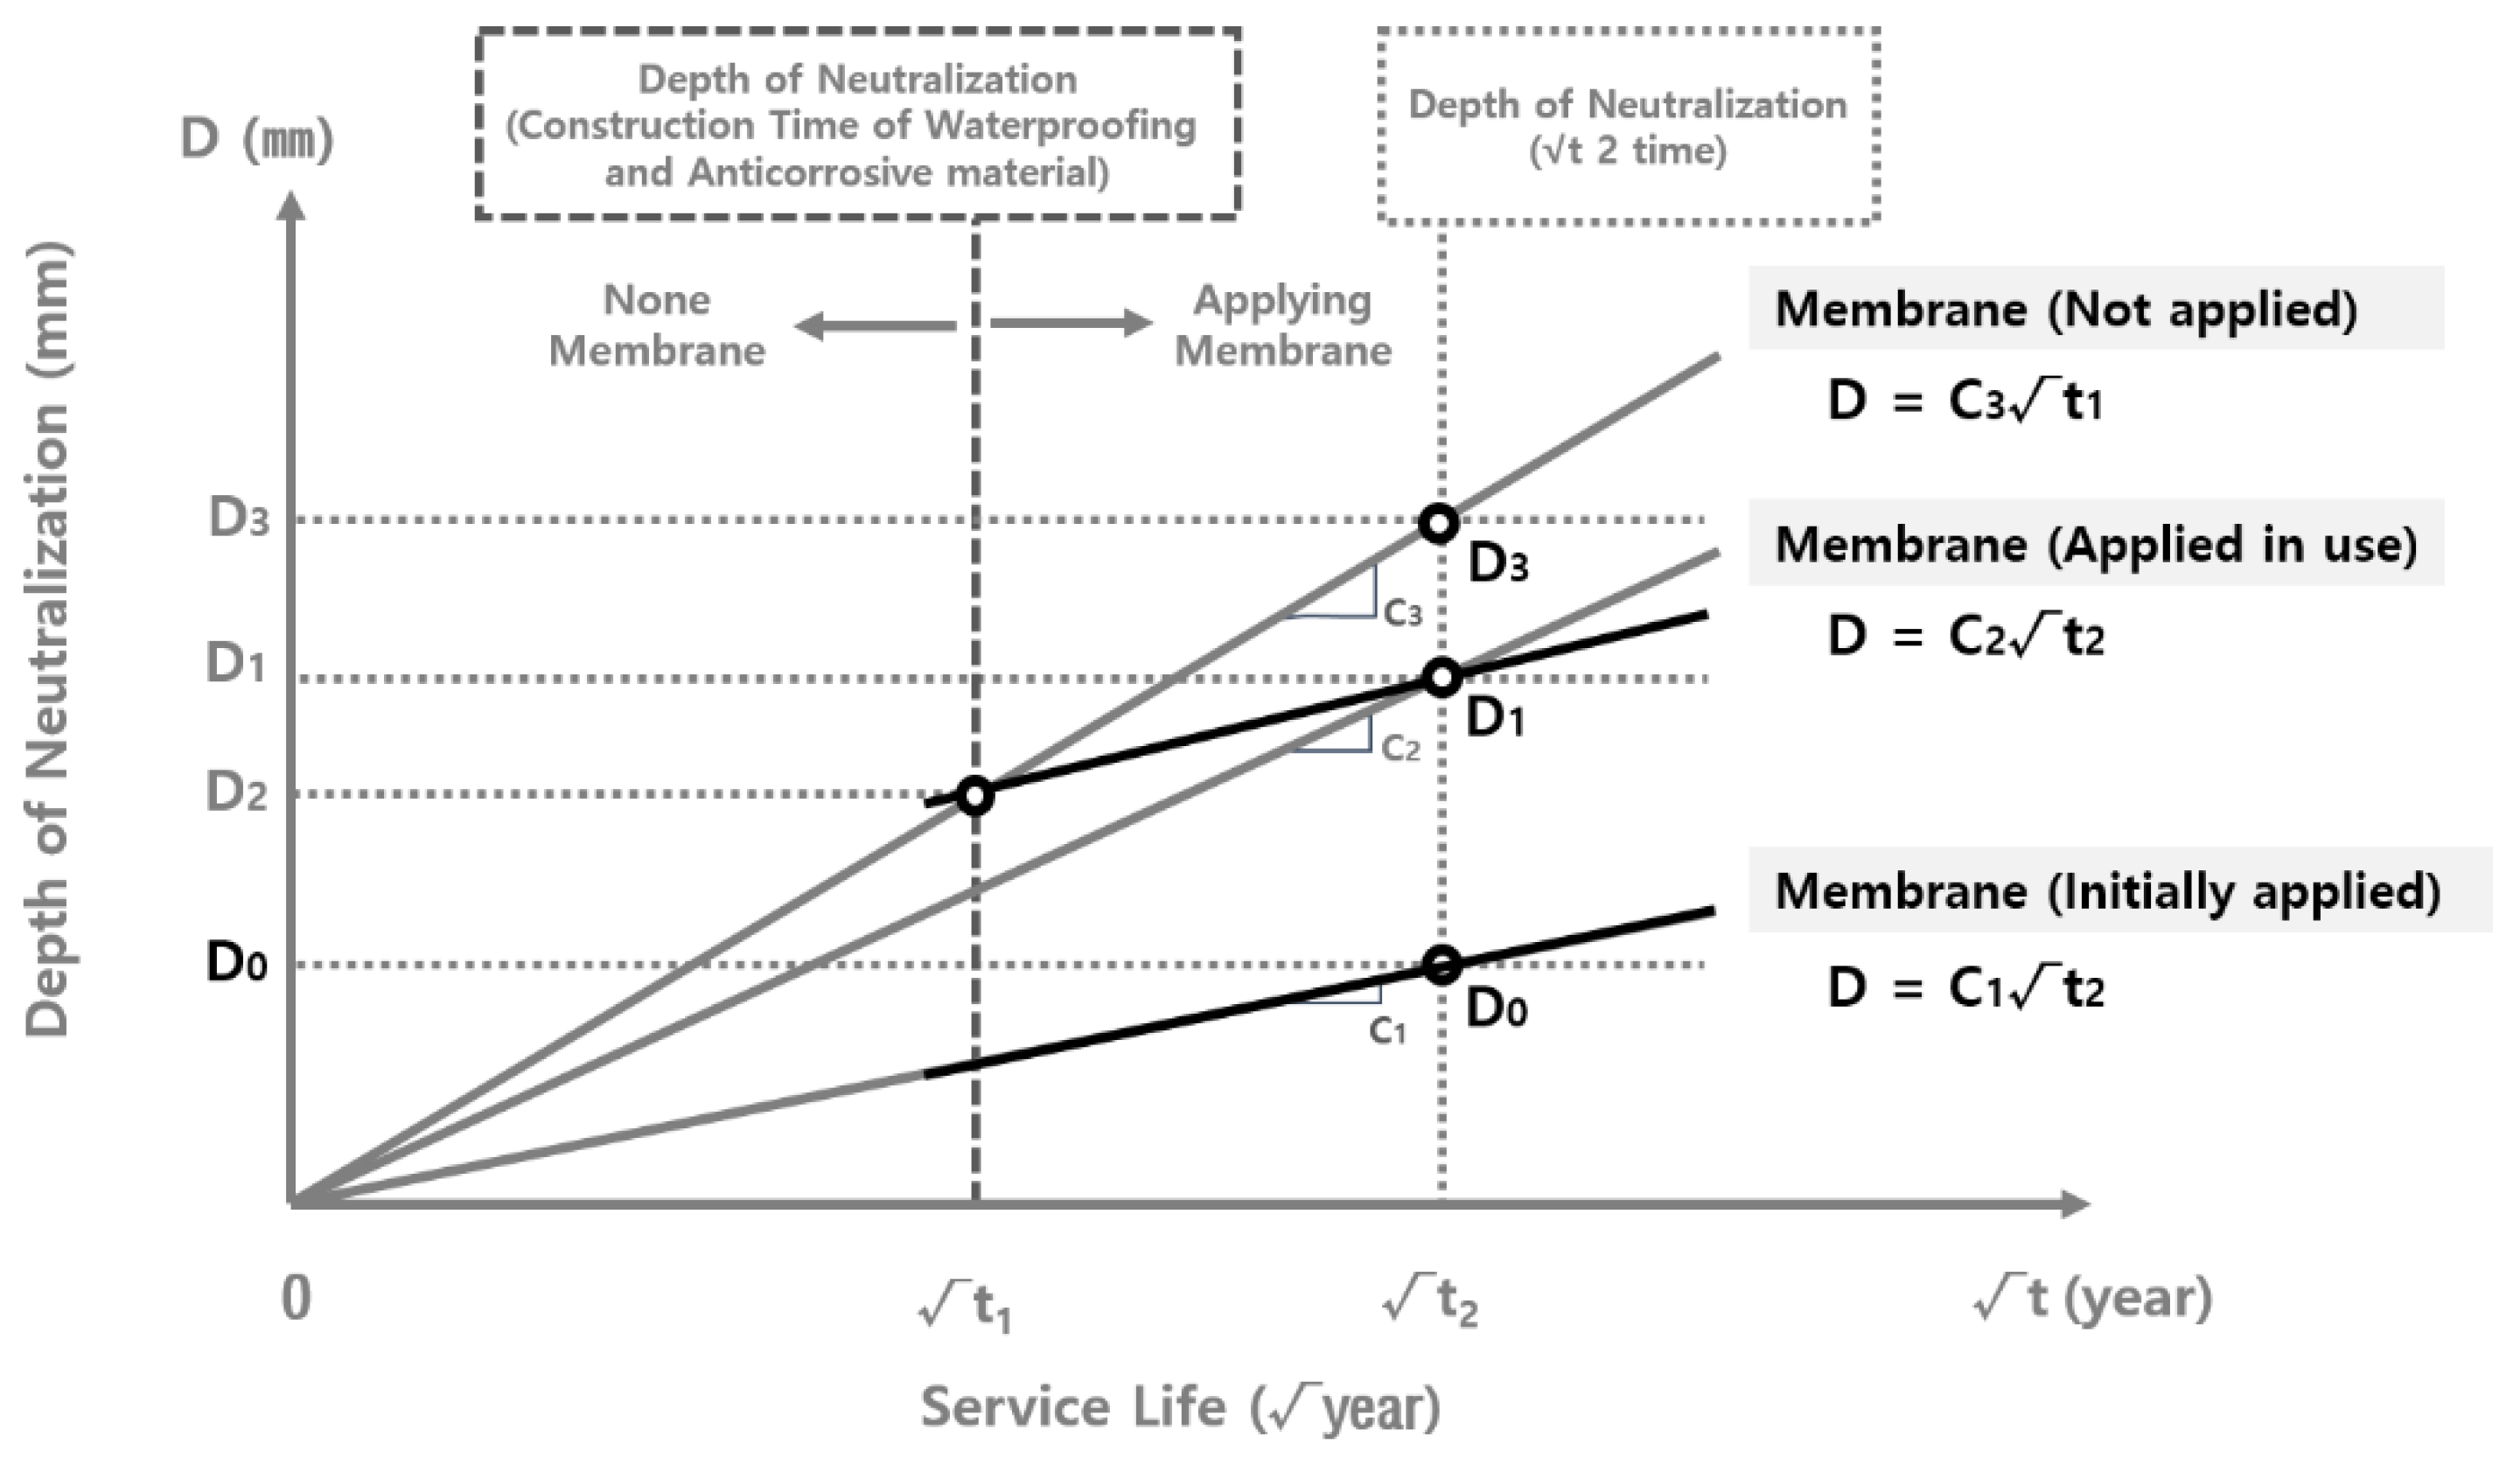
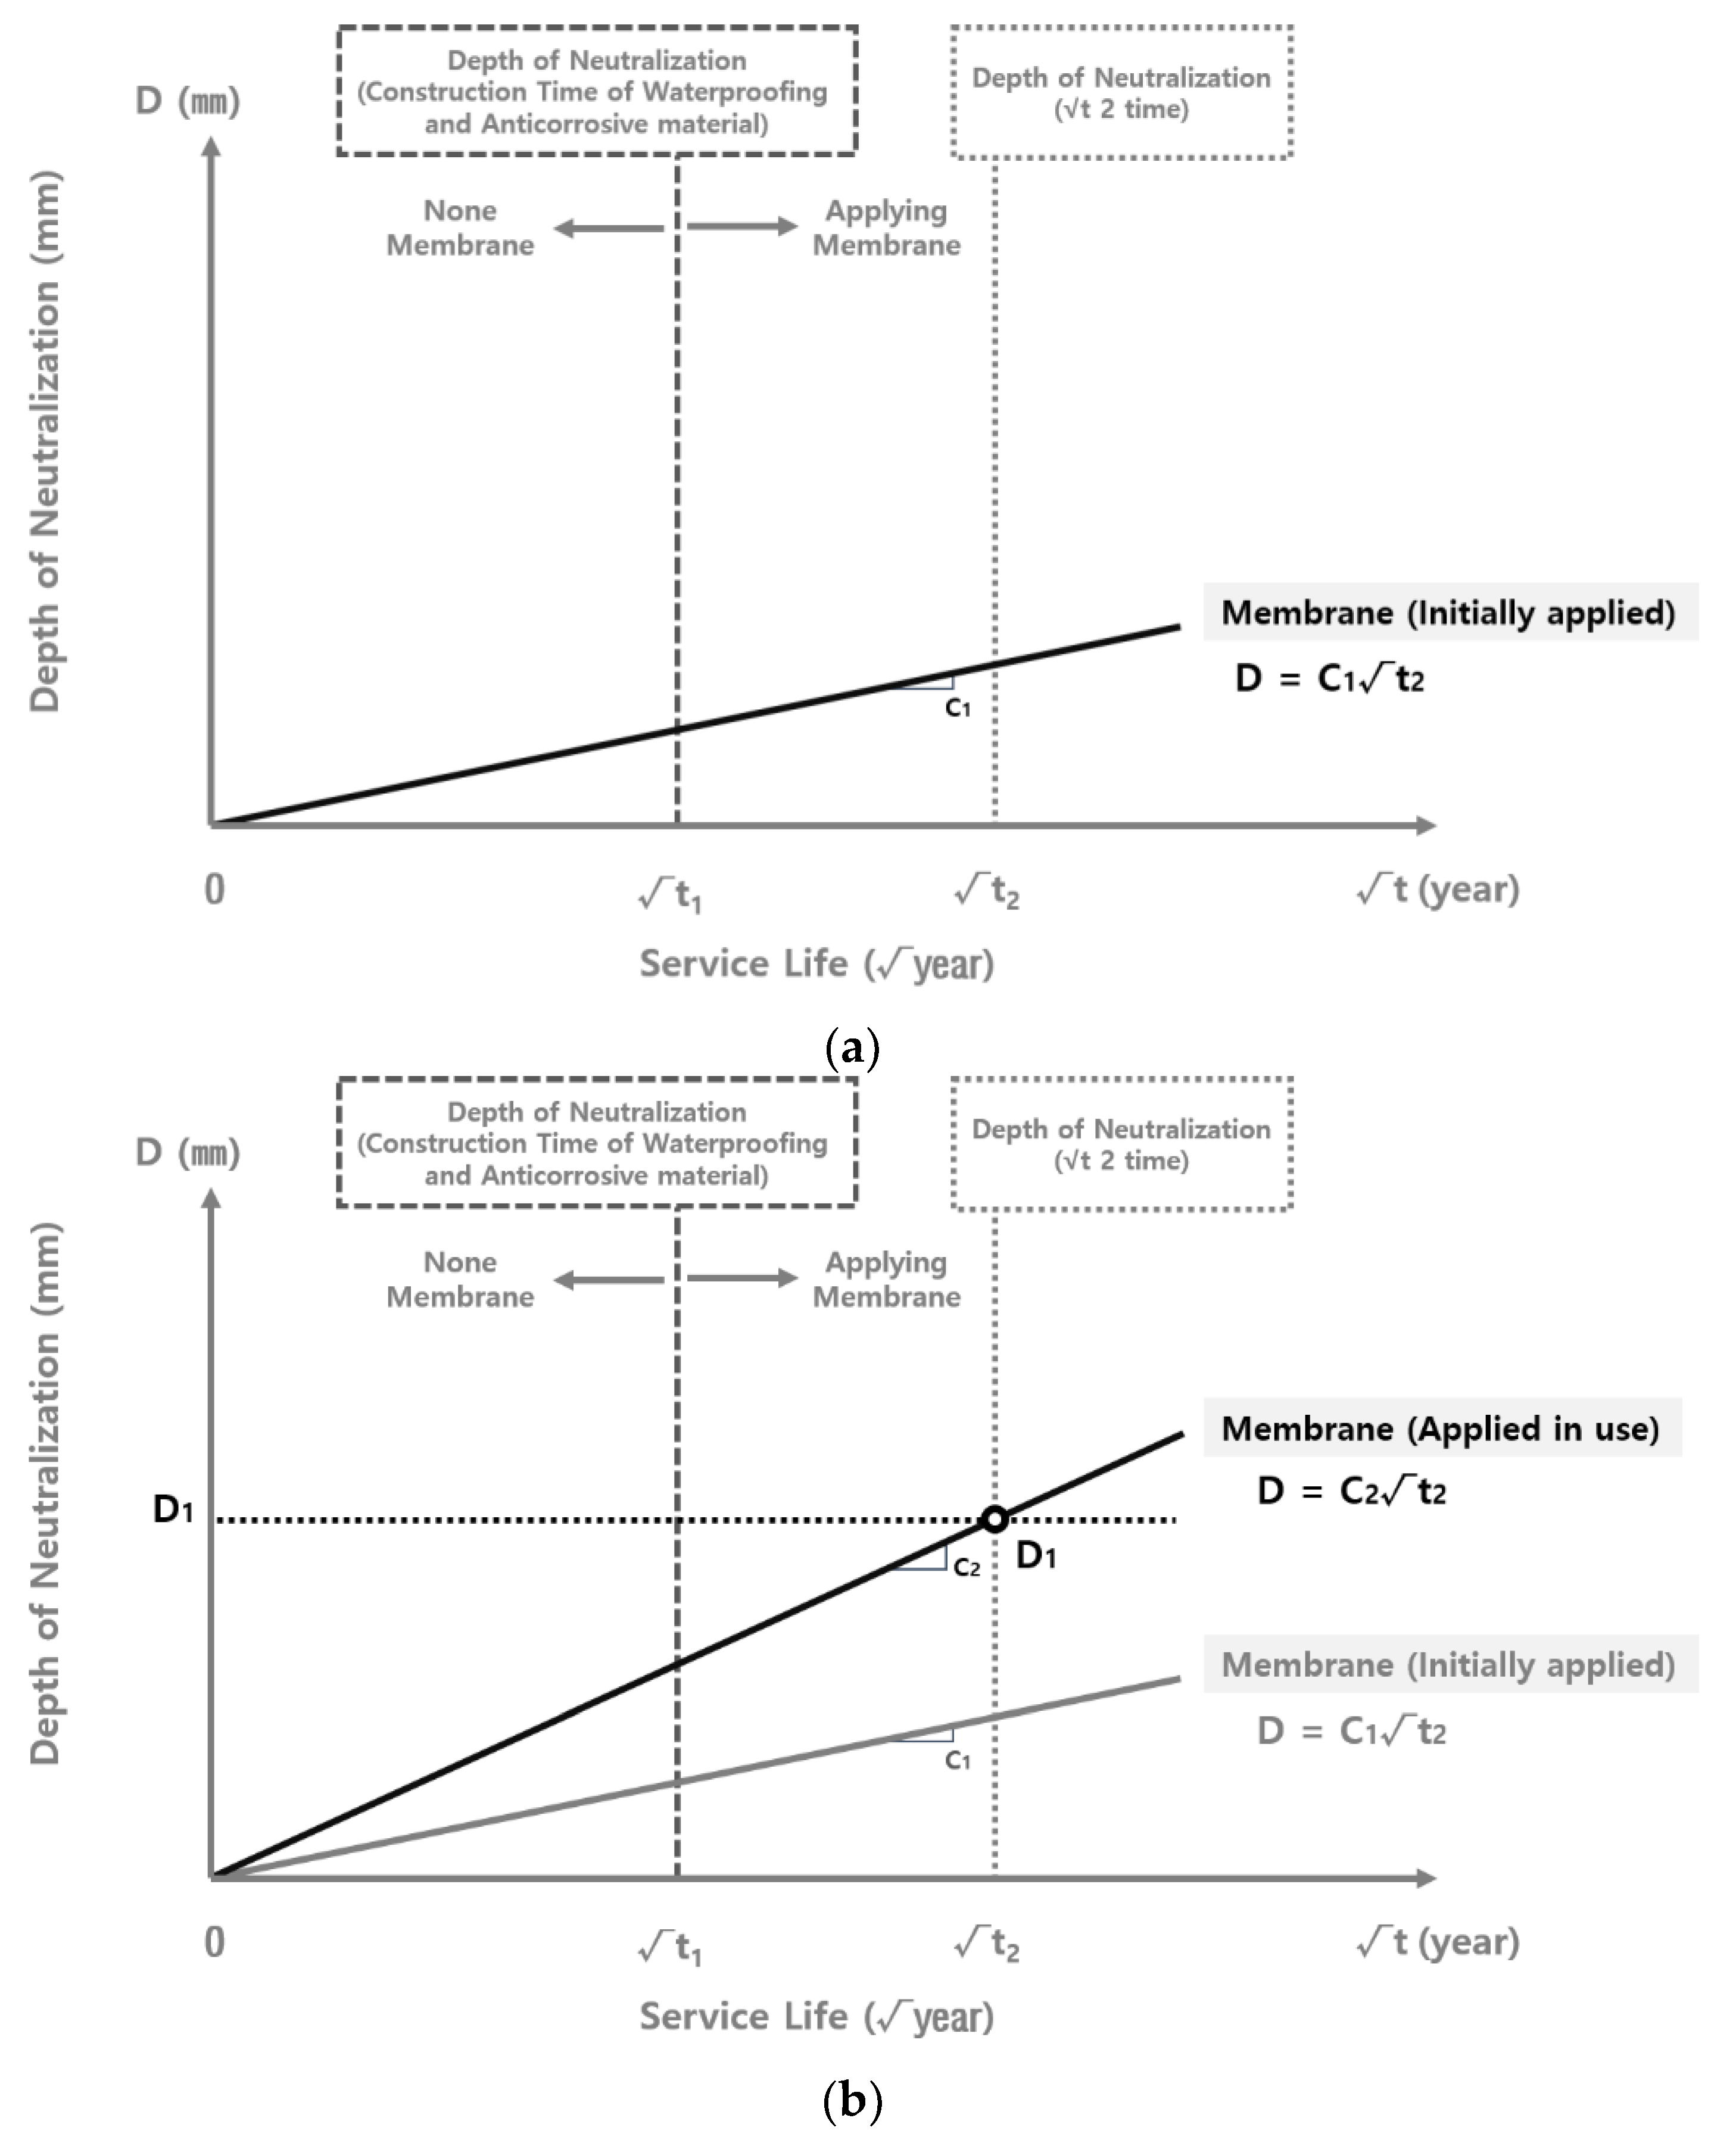
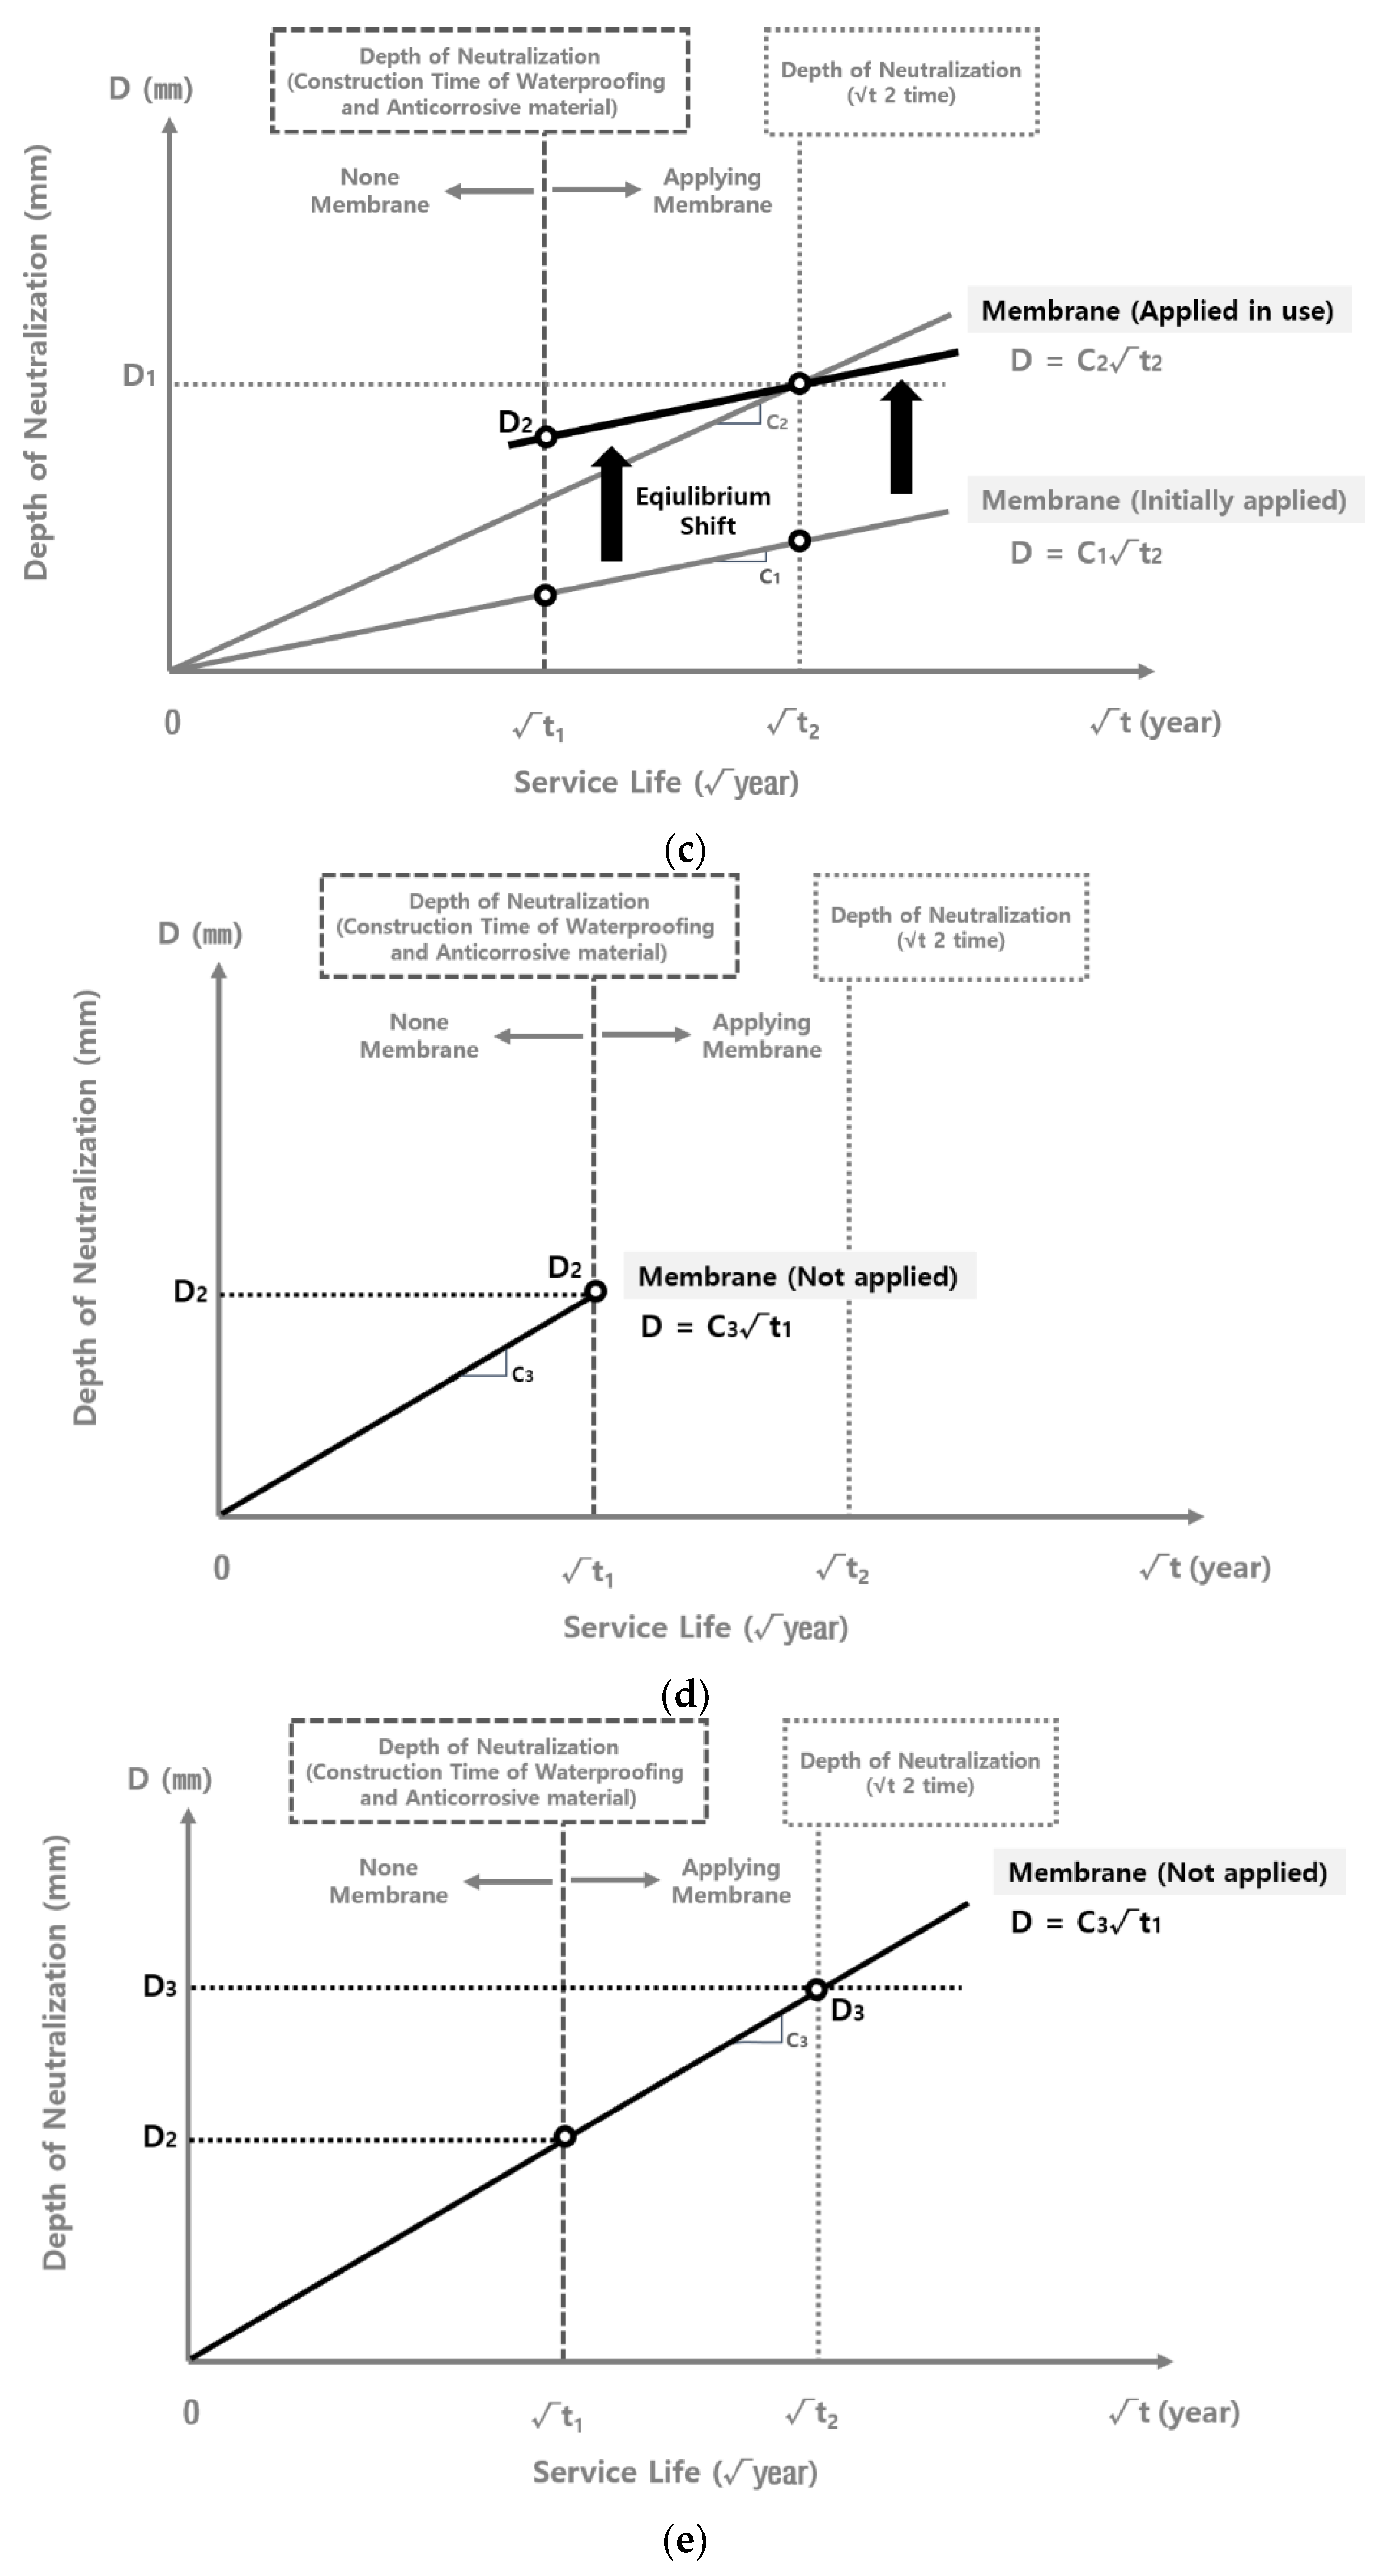
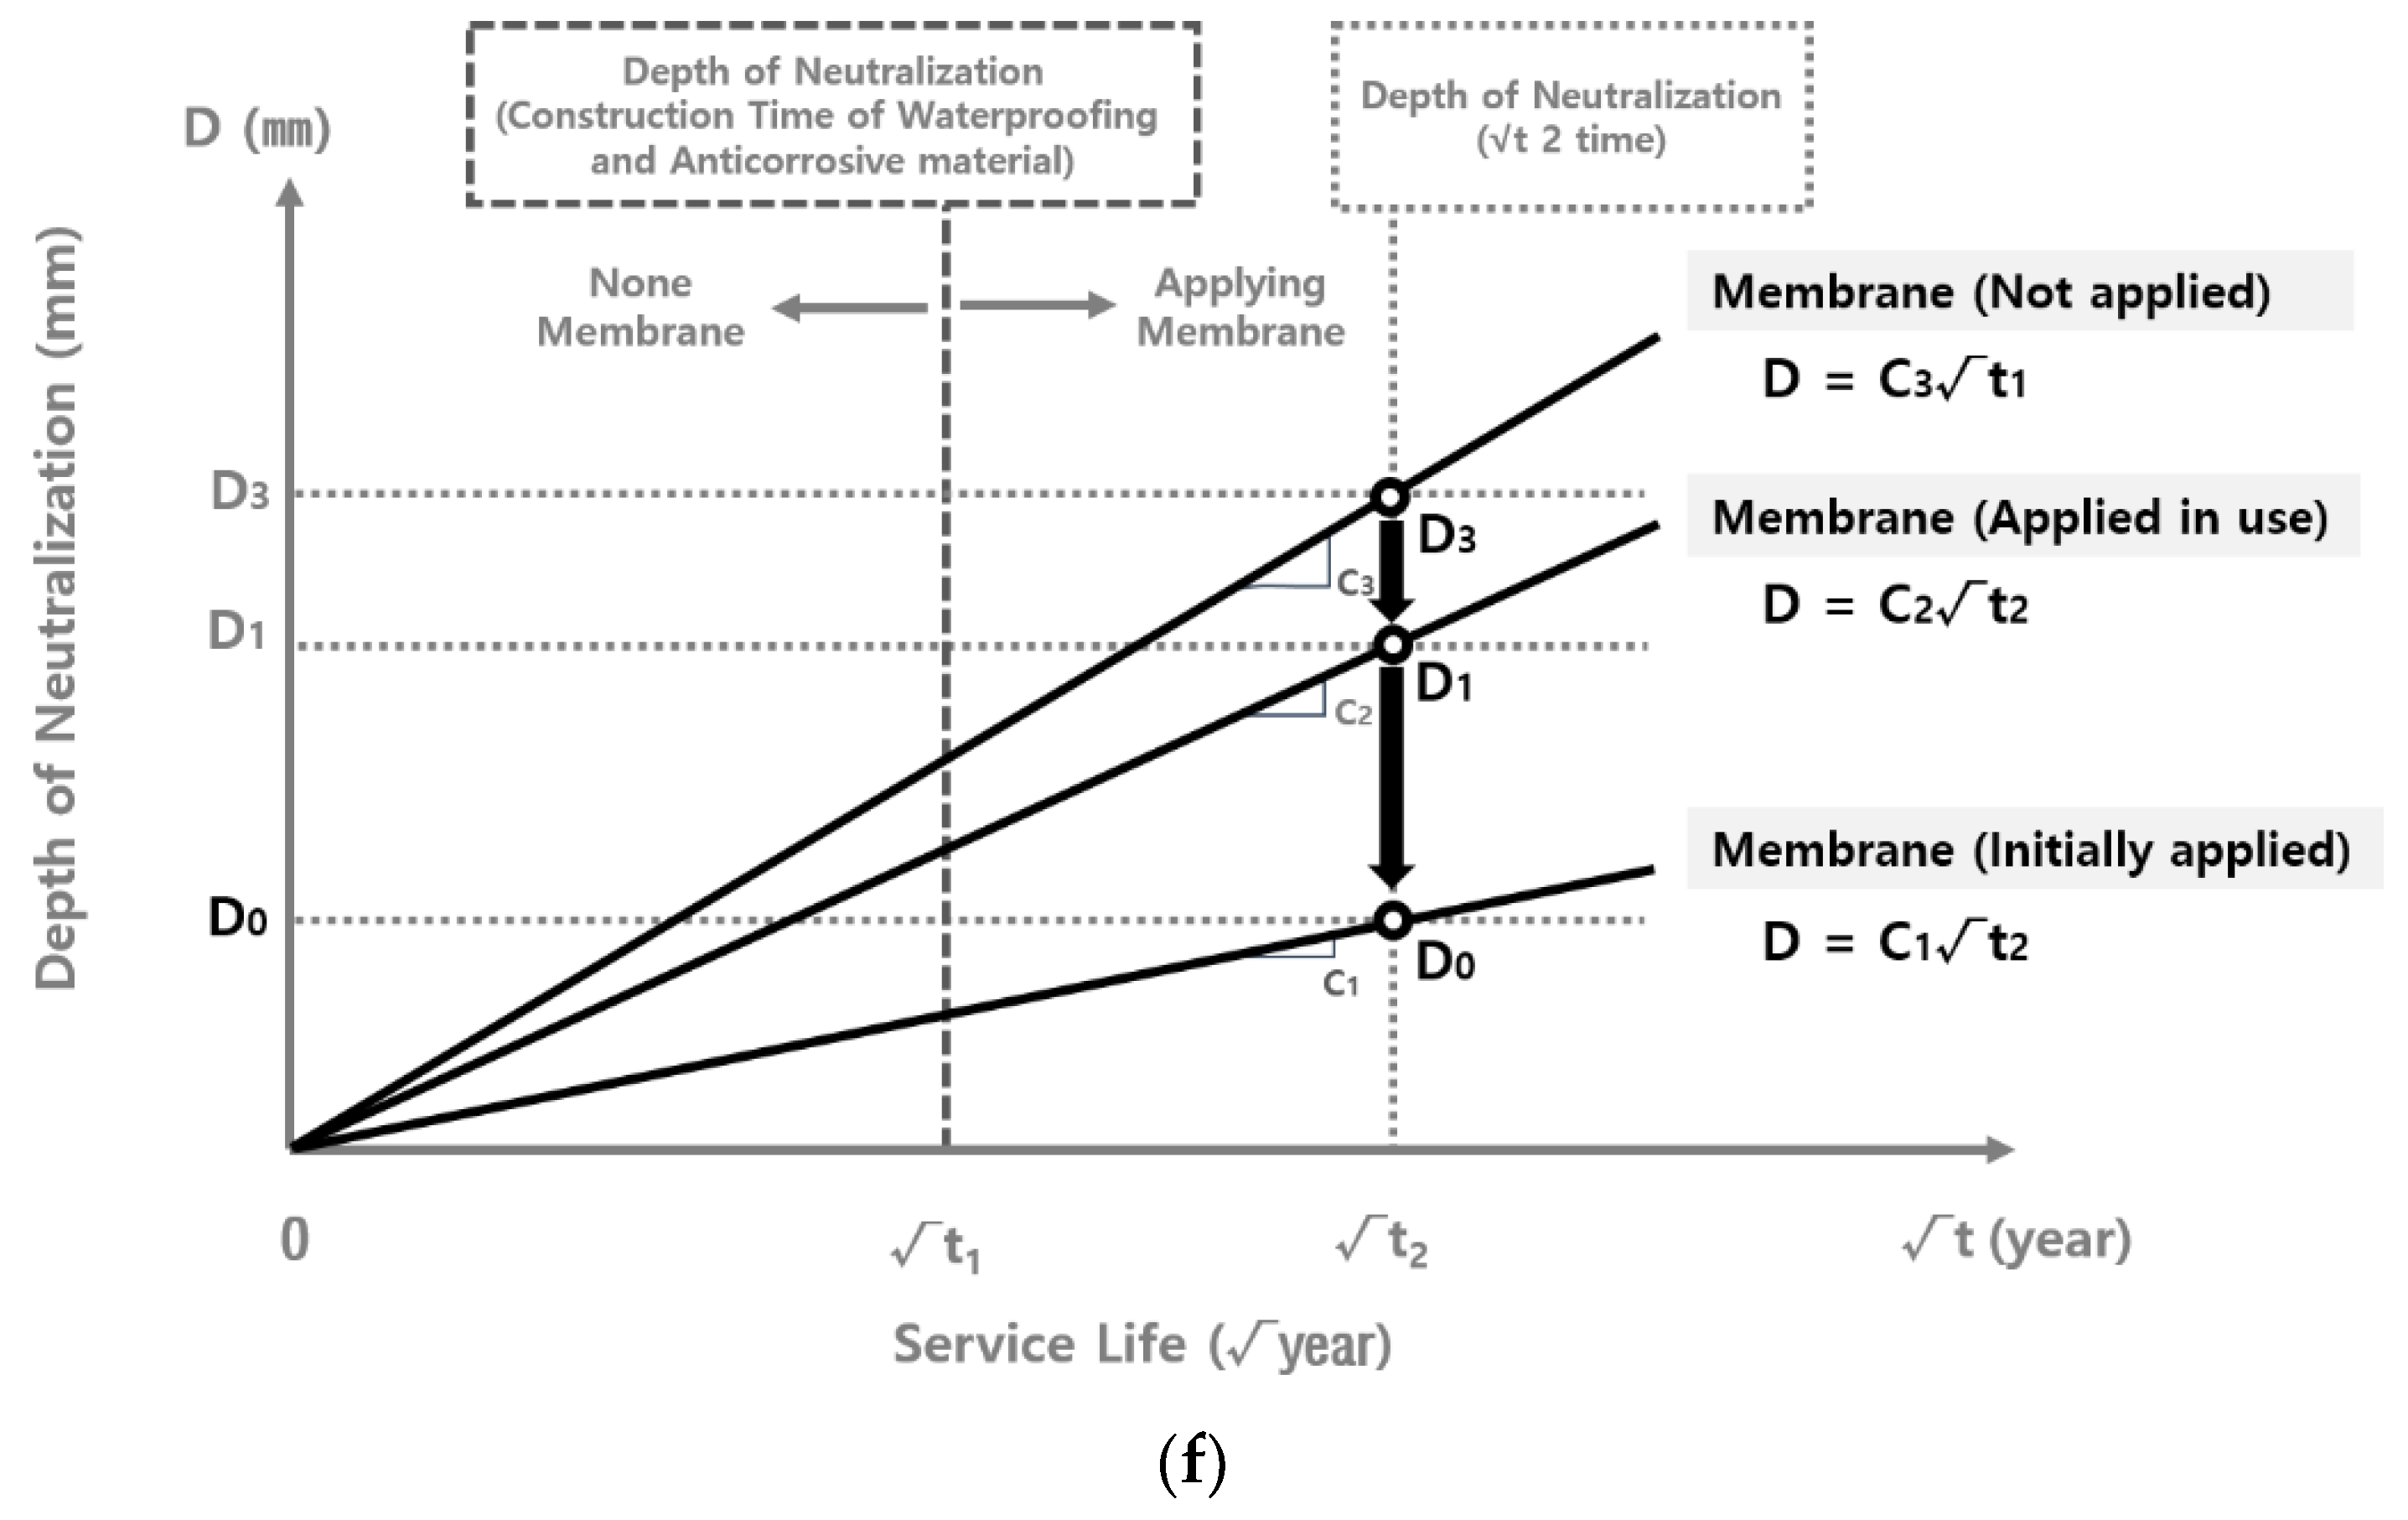
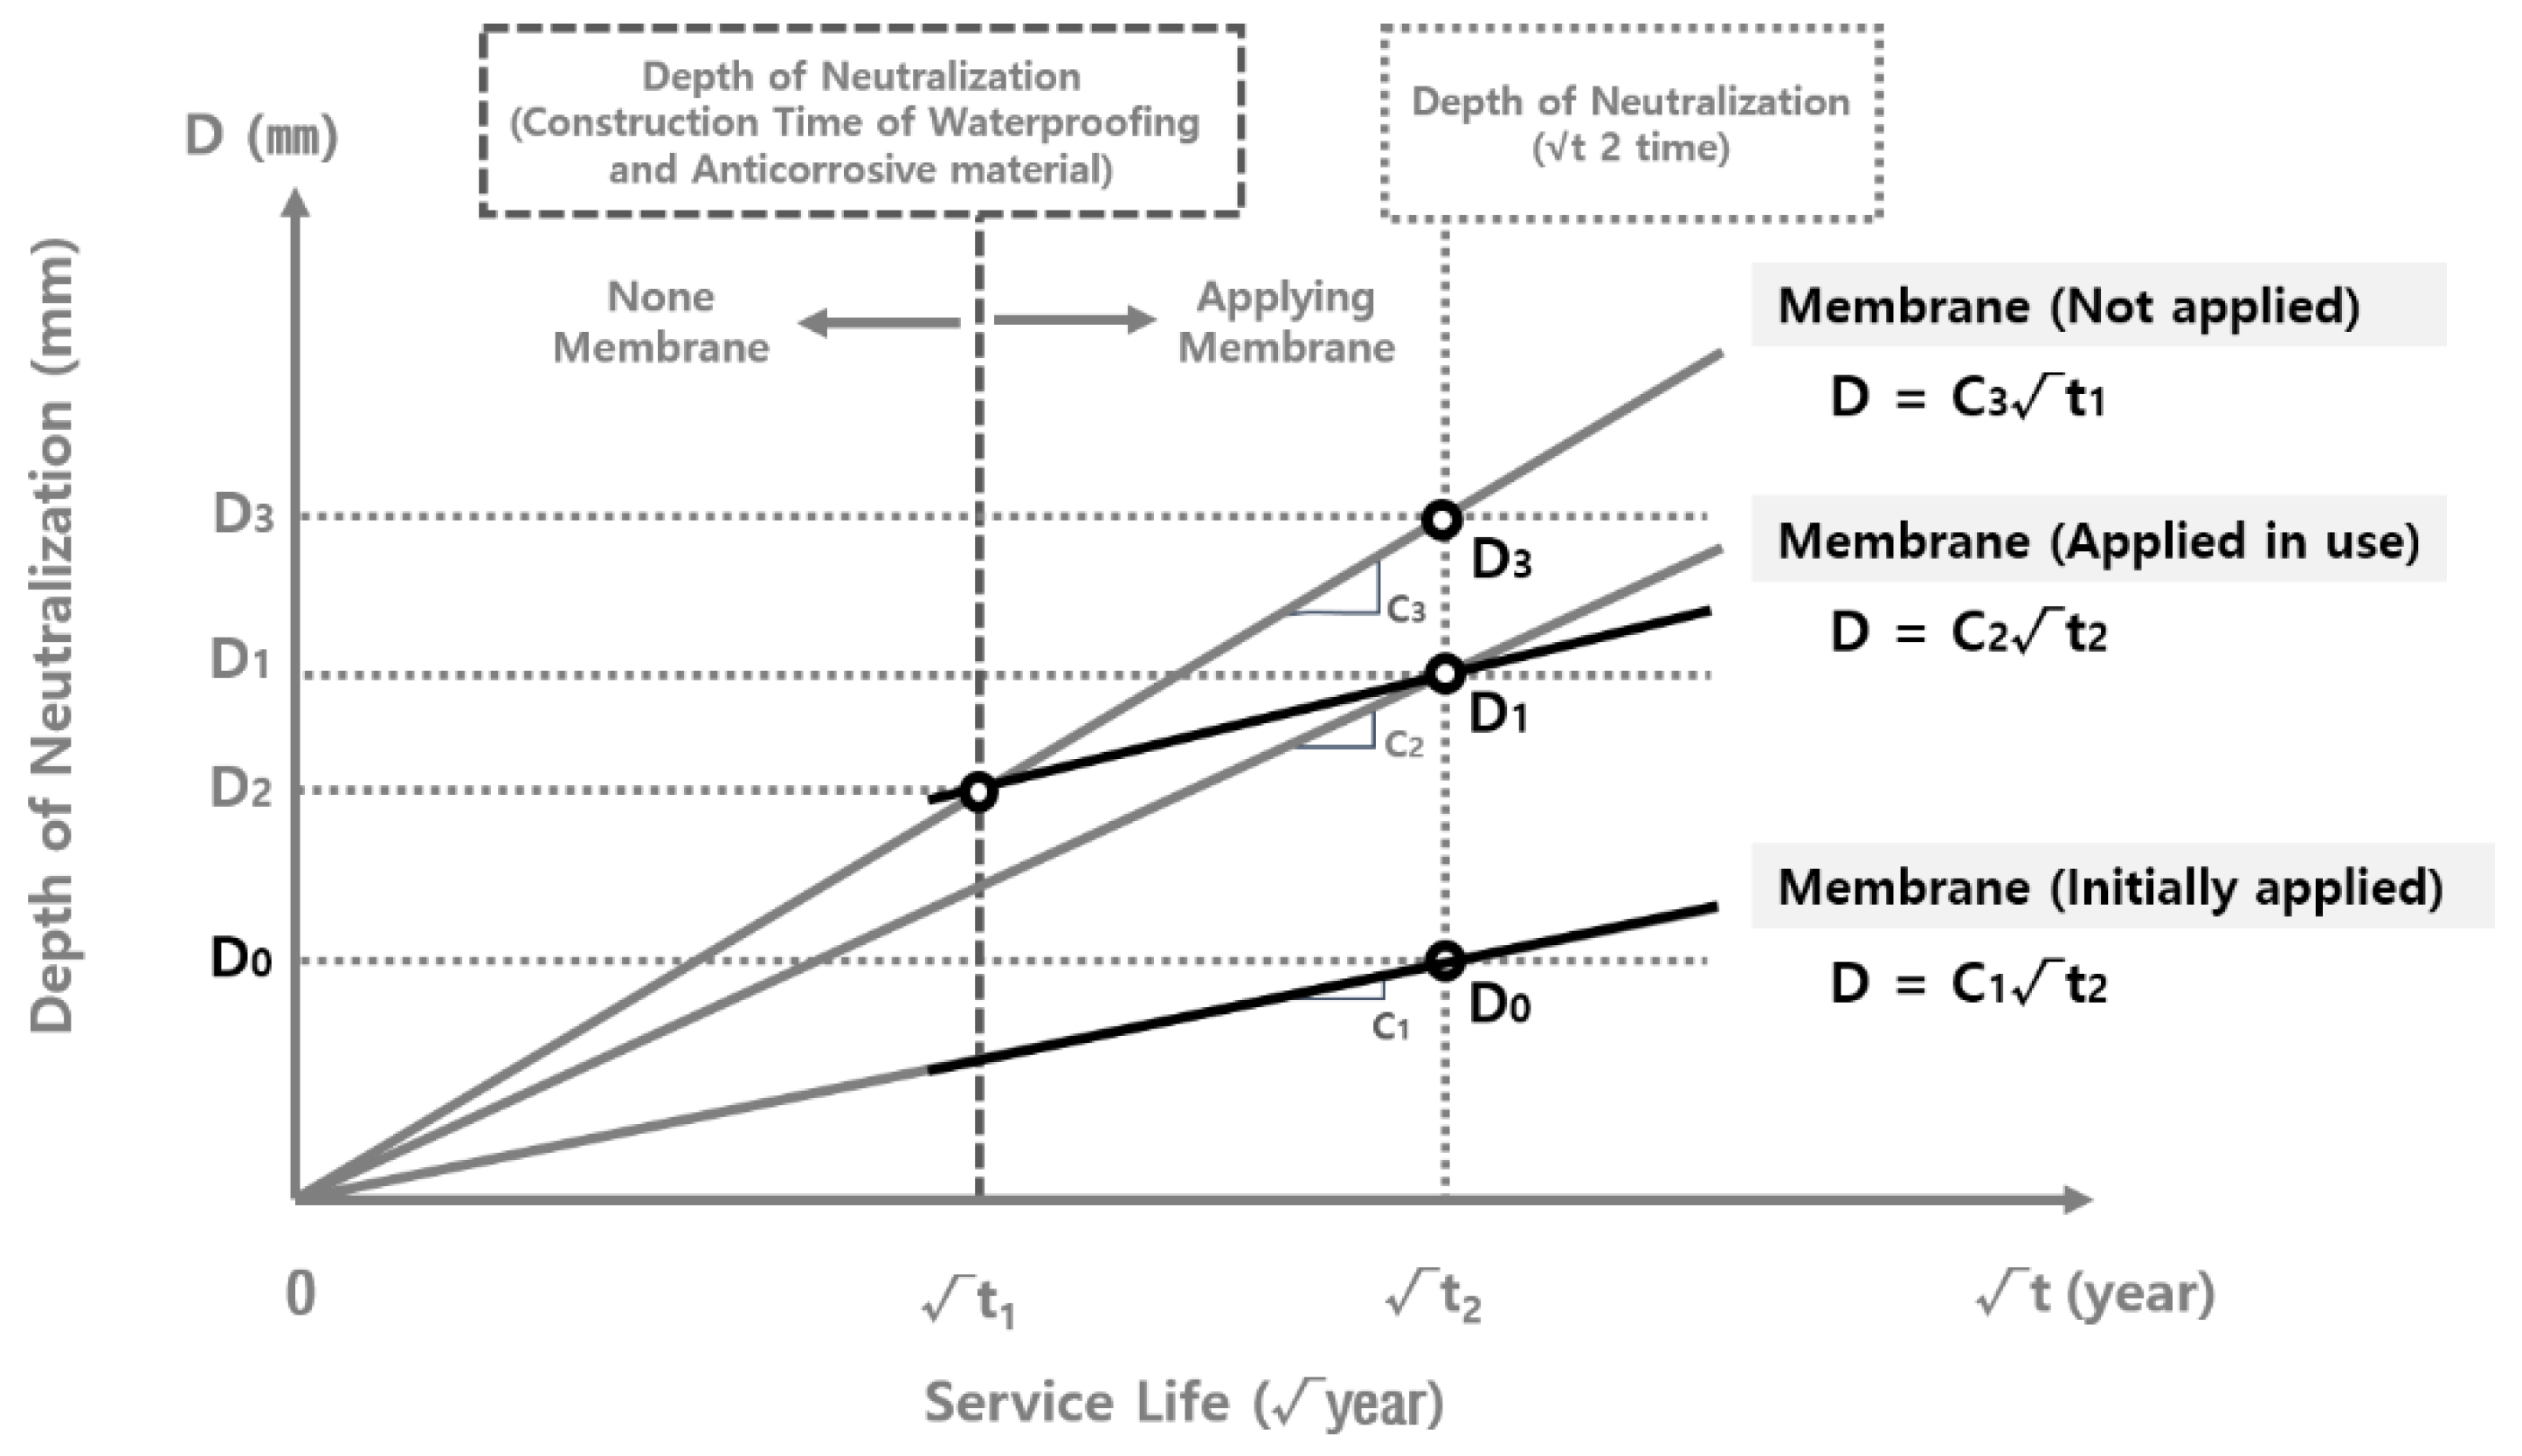
3.2.1. Mechanism of Correlation Analysis on Changes in Carbonation Depth Due to the Application of Waterproofing and Anticorrosive Methods
3.2.2. Mechanism of Correlation Analysis on Changes in Carbonation Depth Due to the Application of Waterproofing and Anticorrosive Methods
- Theoretical formula: xc(t) = Ac, where Ac is the neutralization rate coefficient (mm/), and t is the year
- k1: Neutralization rate constant 17.2 mm/
- α1: Coefficient according to the types of aggregates used in concrete
- α2: Coefficients according to the types of cement
- α3 = w/c − 0.38: Coefficient according to water–cement ratio
- β1 = 0.017T + 0.48β1: Coefficient according to the temperature, where T is the average temperature (°C) of the region
- β2: Coefficient according to humidity
- Wet environment: β2 = kw (kw is coefficient for wet environment, which is assumed to be 0.2)
- β3 =: Coefficient according to carbon dioxide concentration
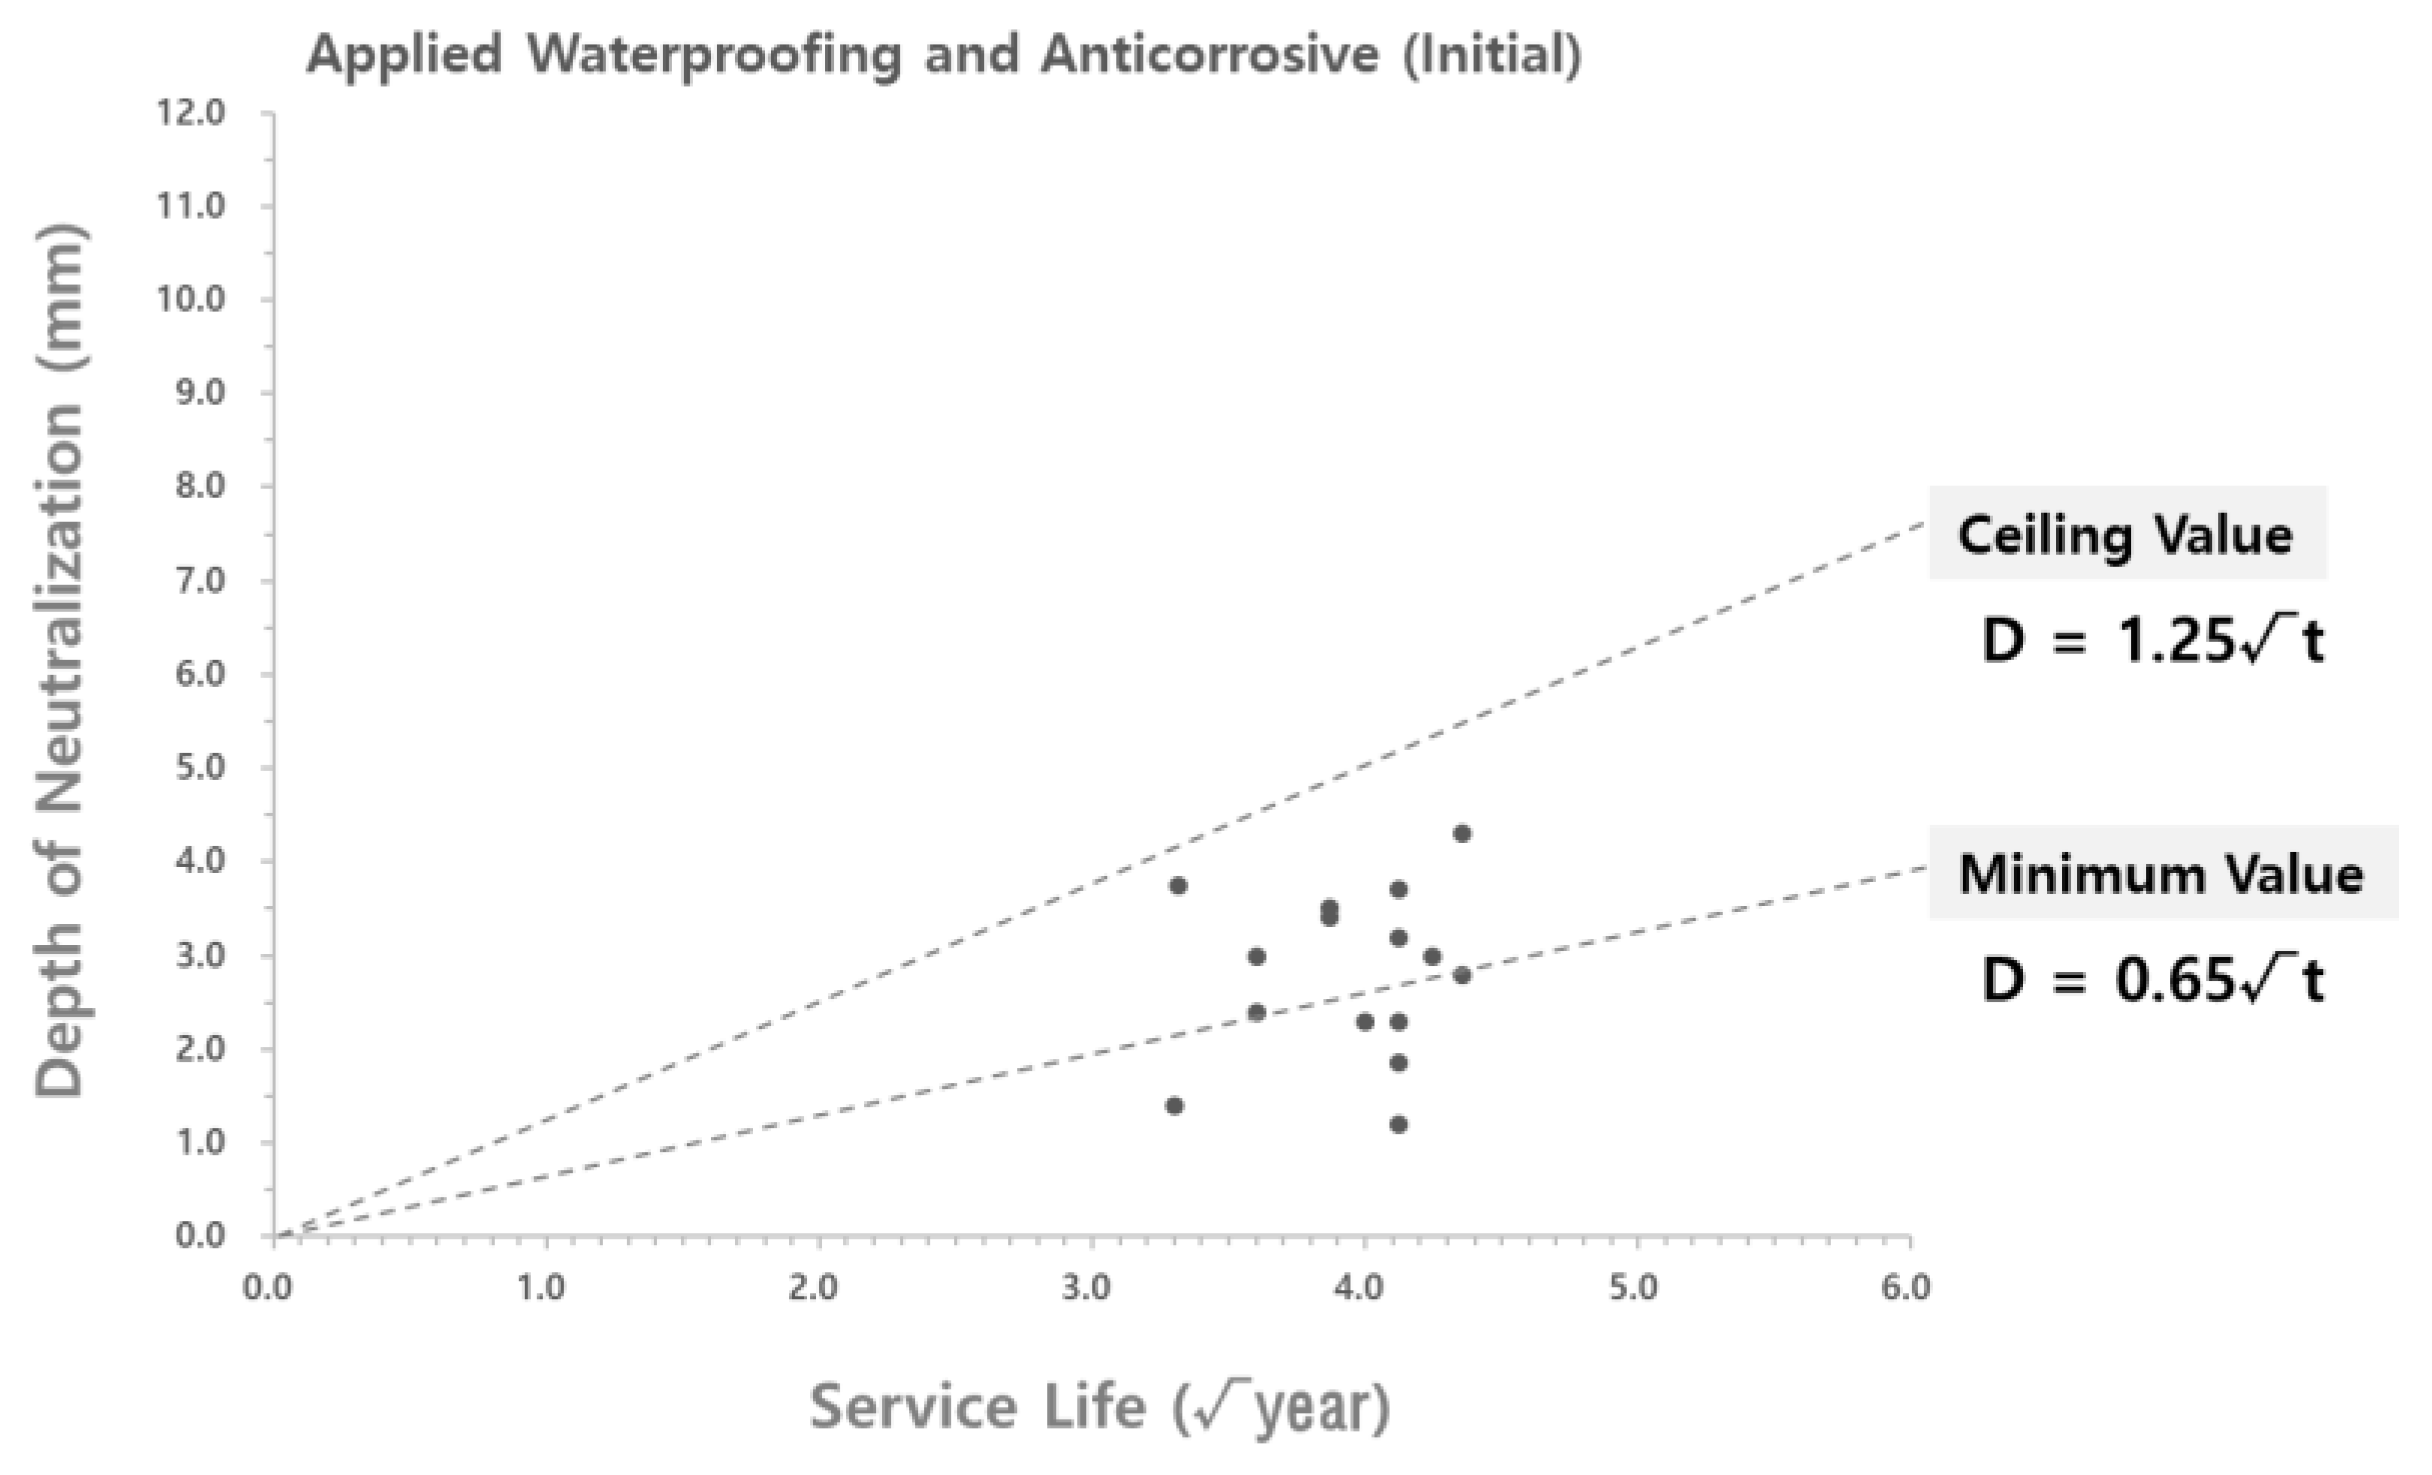
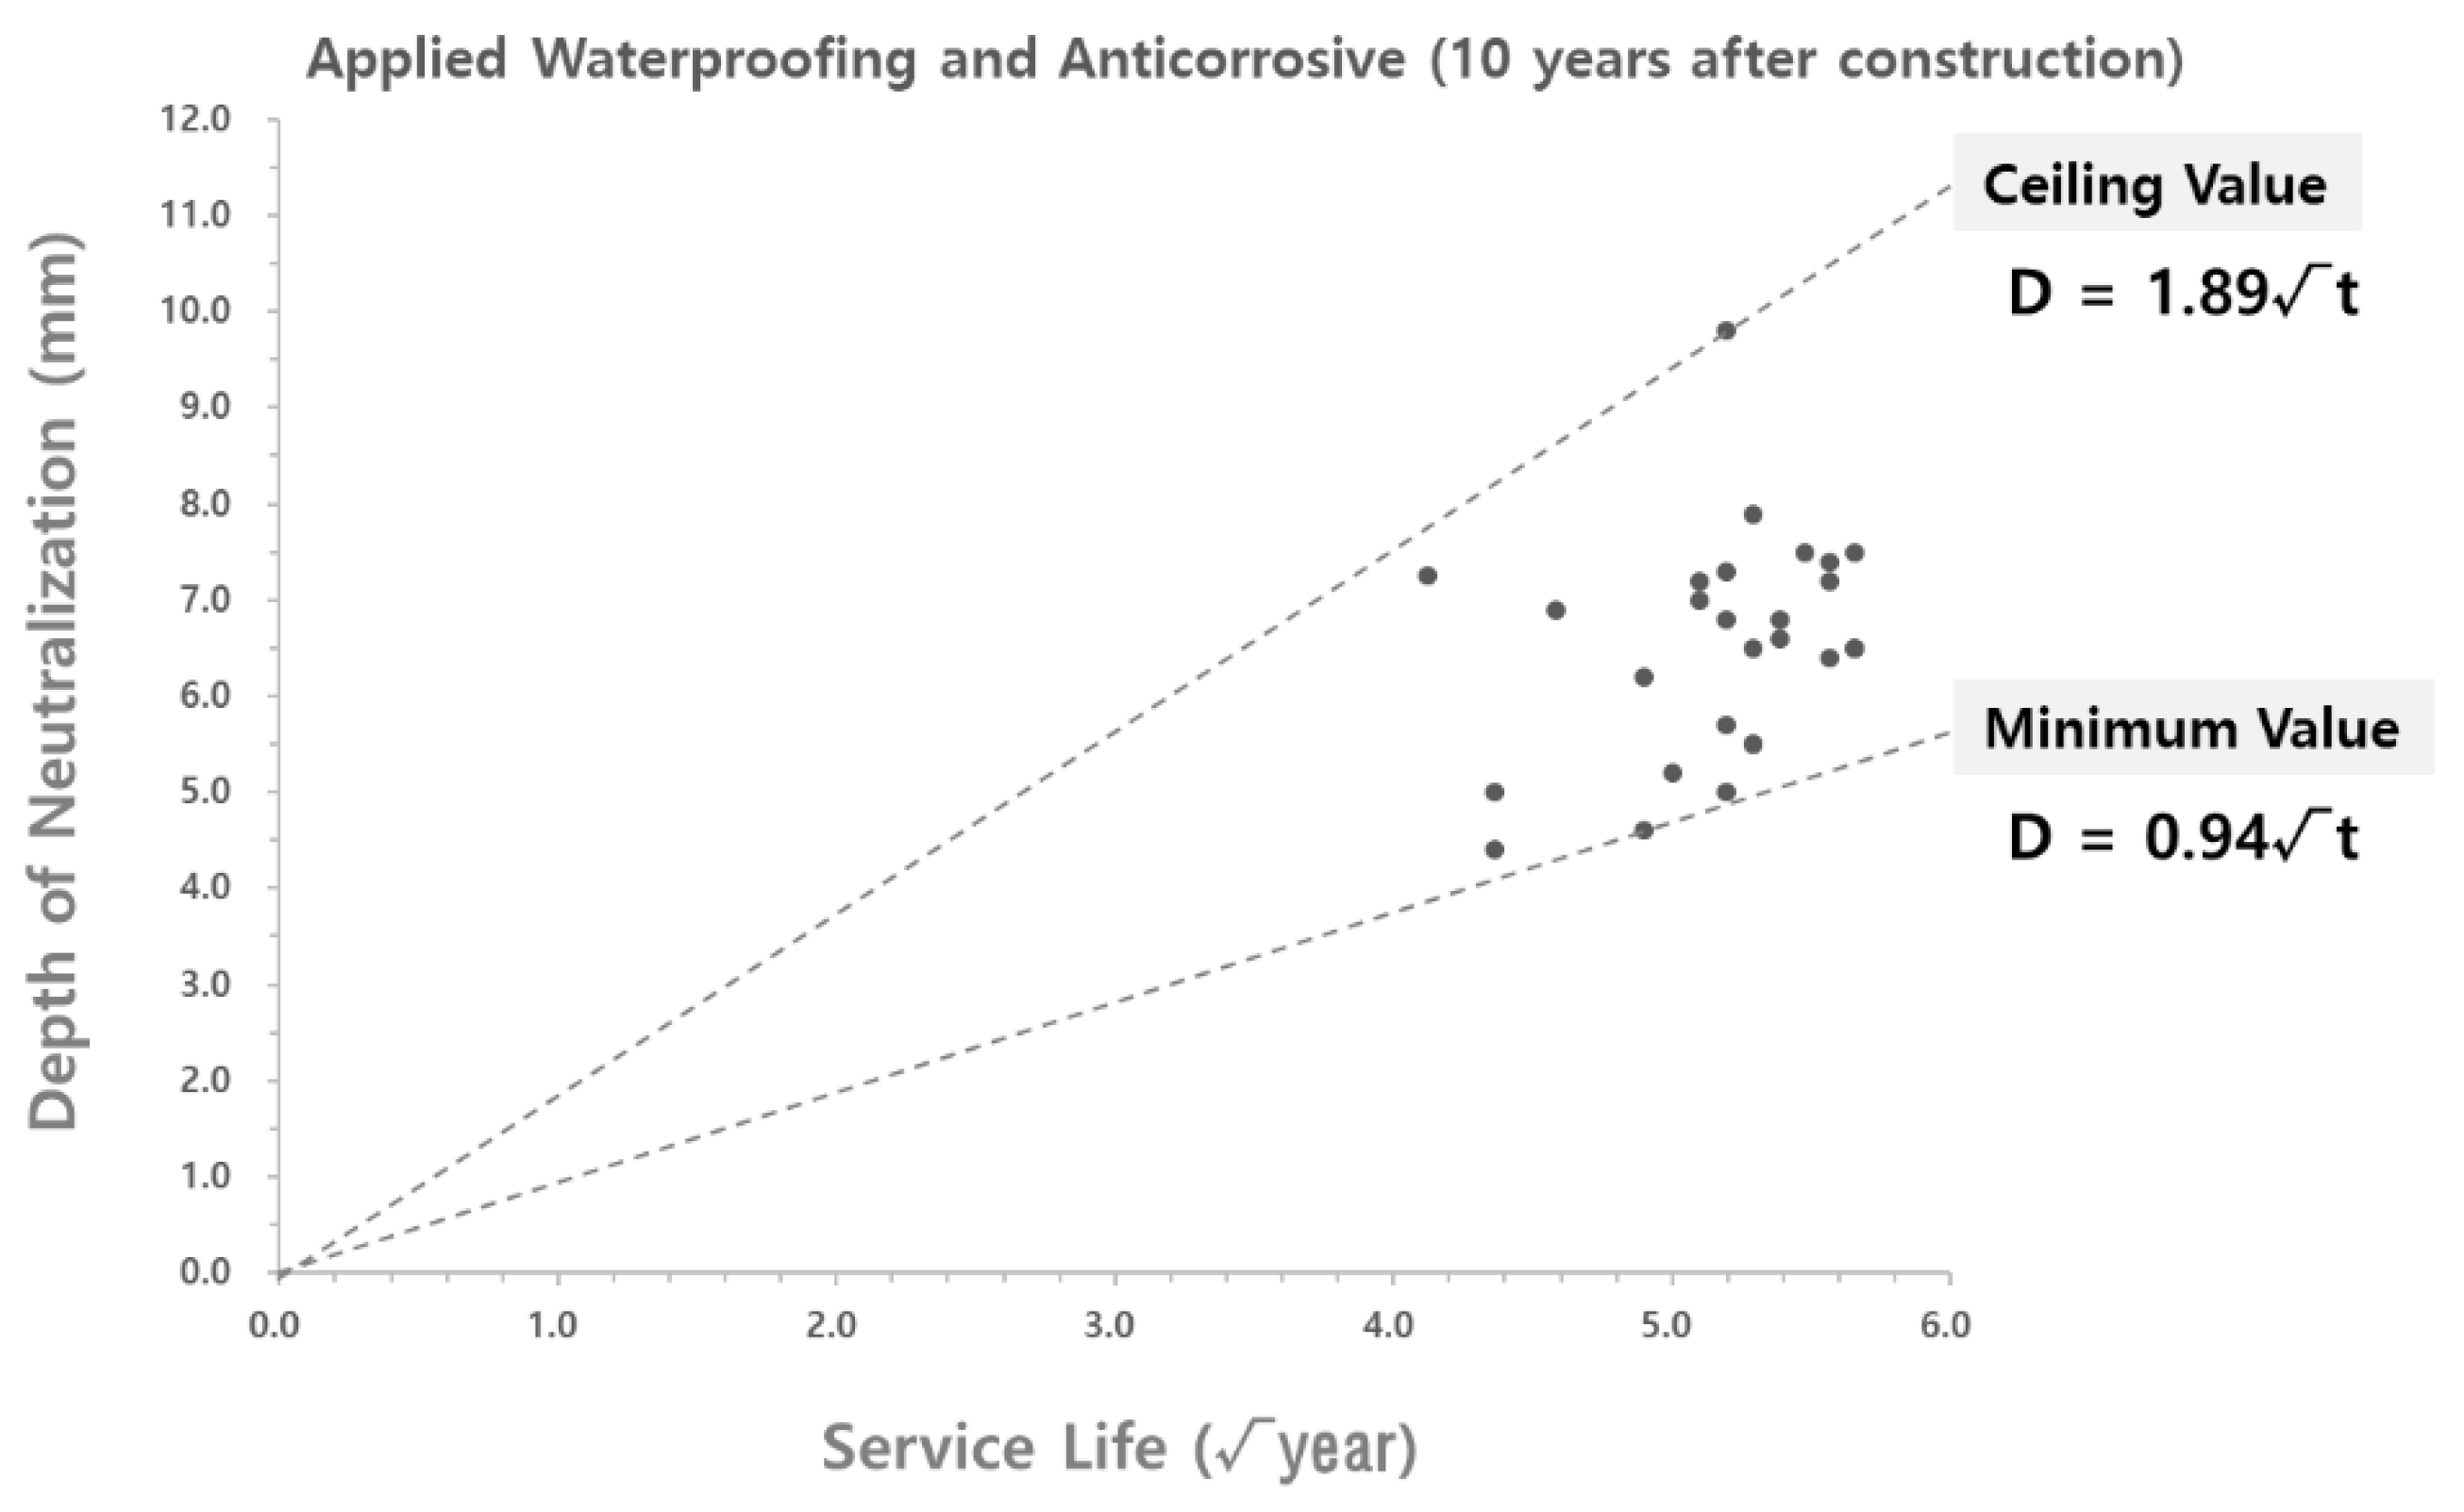
3.2.3. Comparison between Carbonation Rate Coefficient According to Theoretical Equation and Measured Carbonation Depth
3.2.4. Adjustment of Carbonation Rate Coefficient Range According to the Theoretical Equation
3.2.5. Derivation and Comparison of Carbonation Rate Coefficients of Water Reservoirs with No Waterproofing/Anticorrosive Method Applied after Public Service
4. Conclusions
- (1)
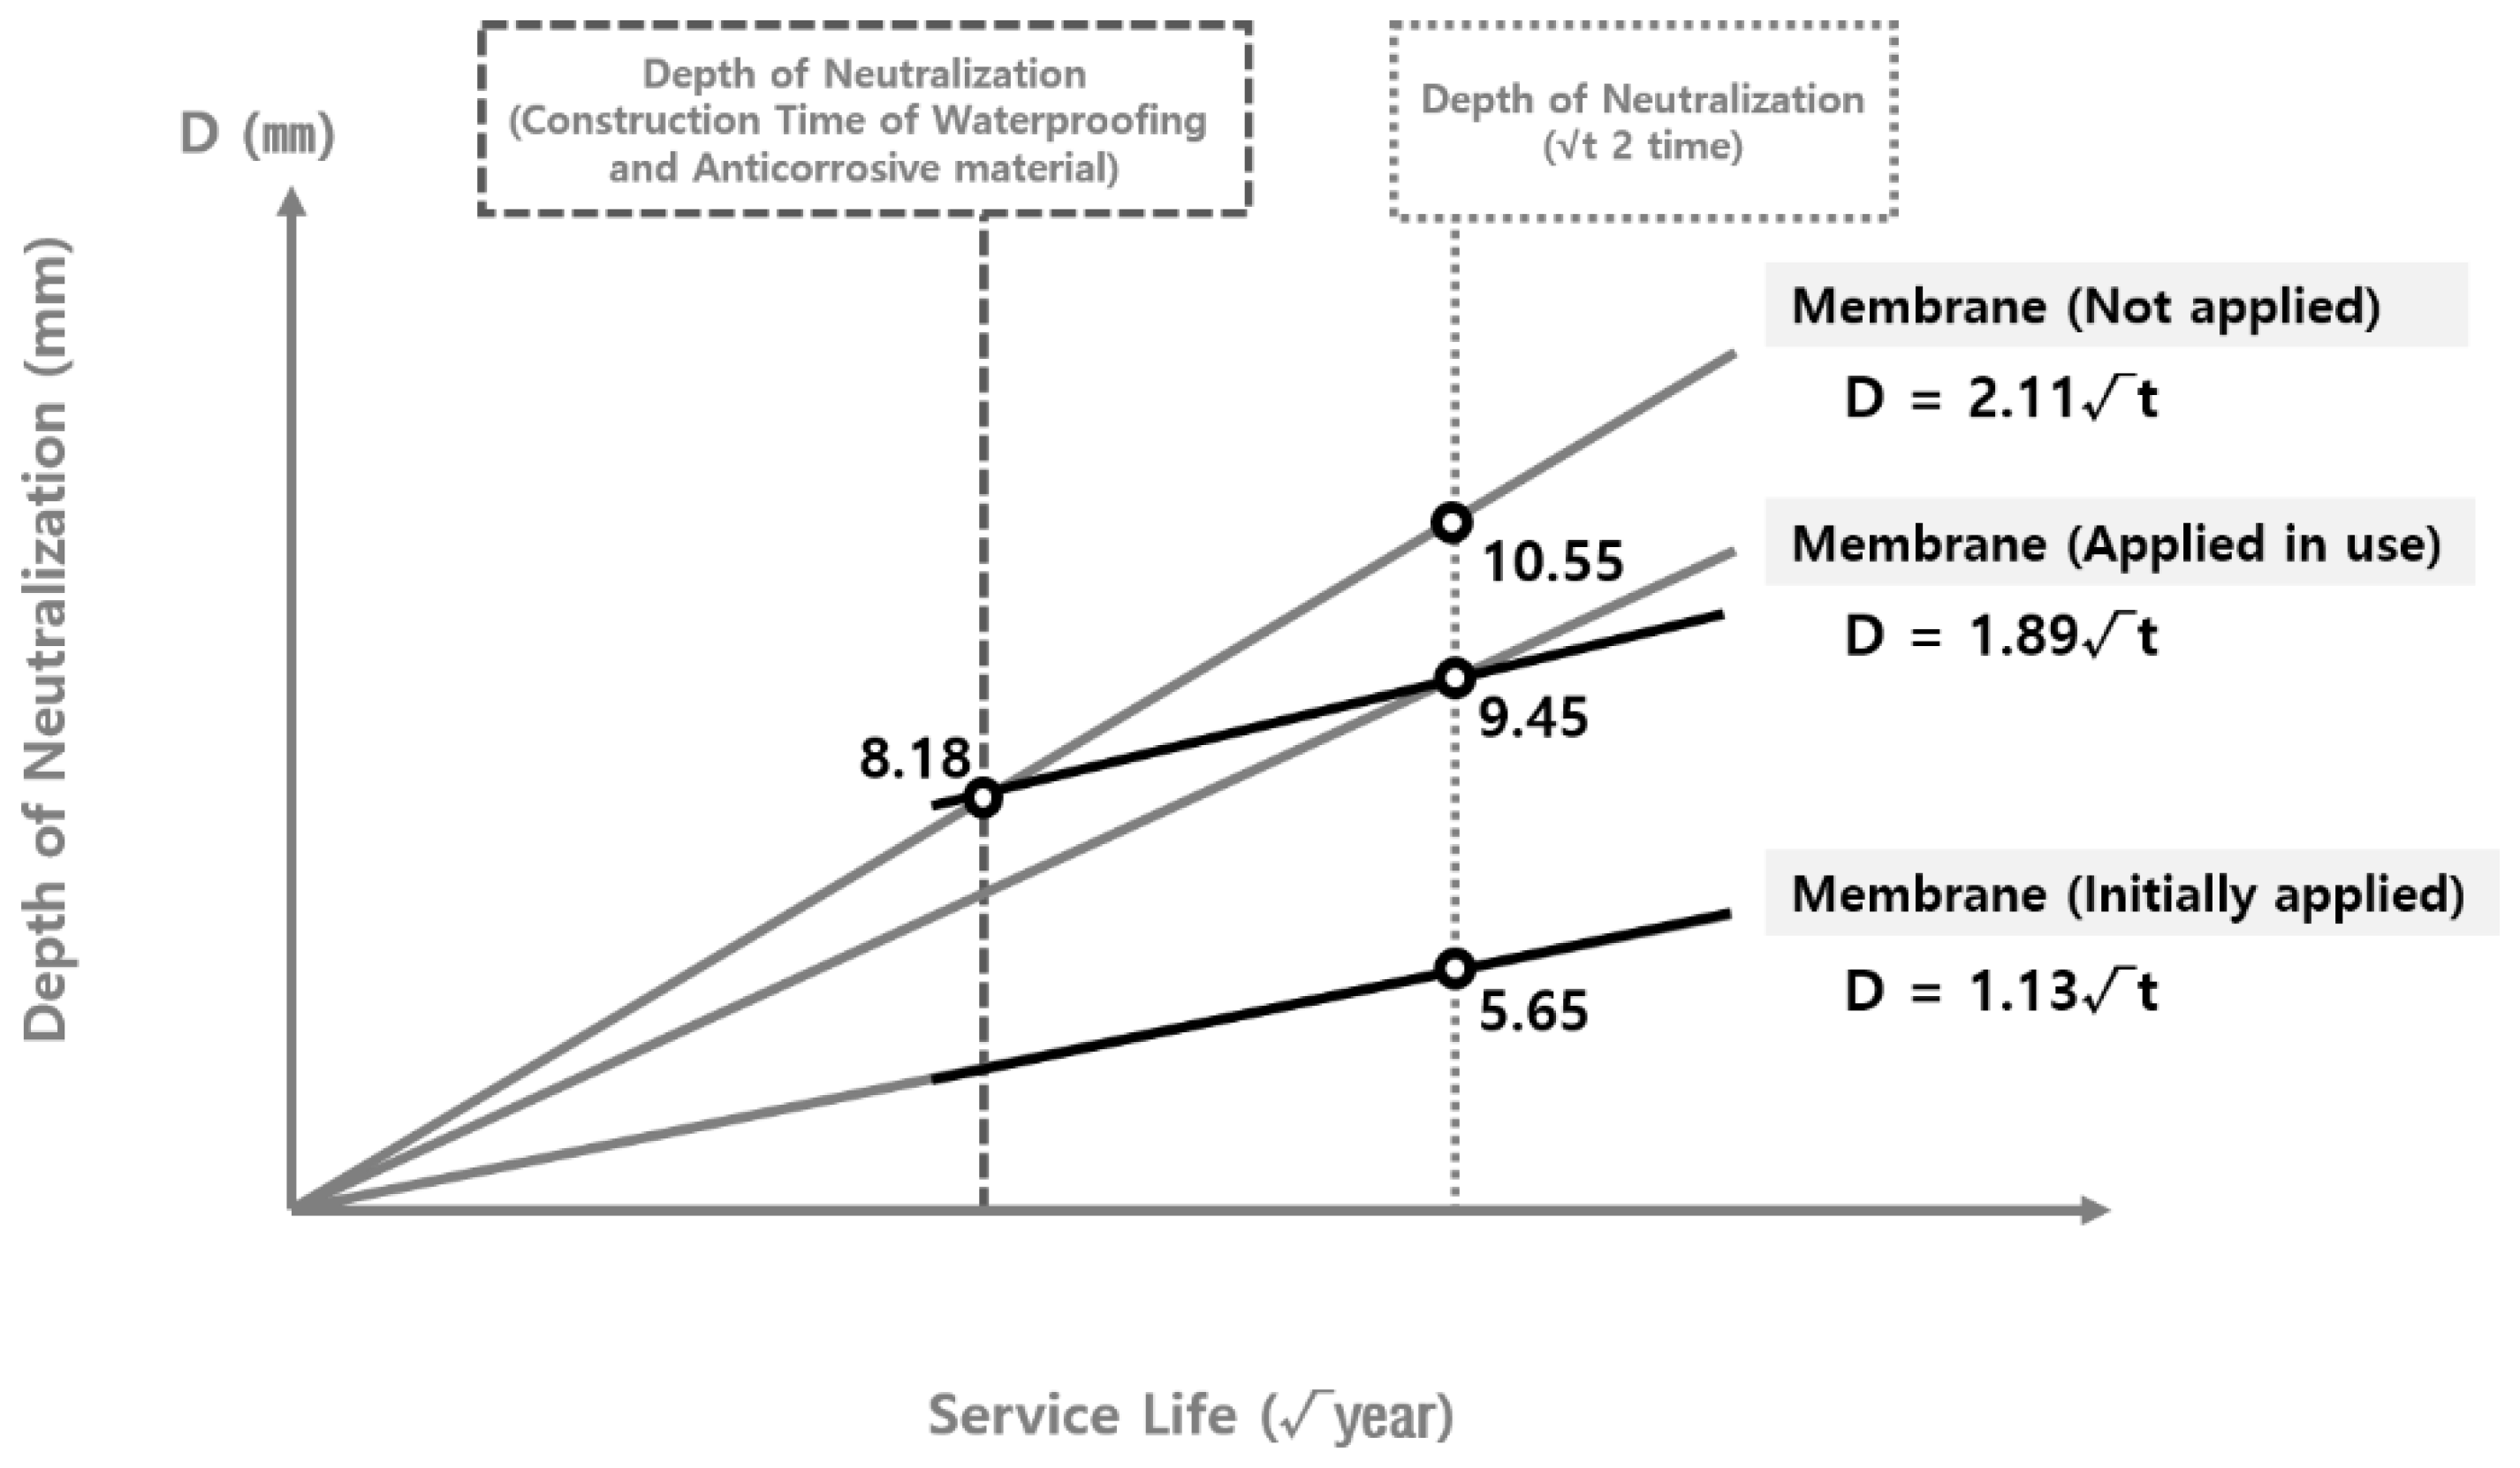
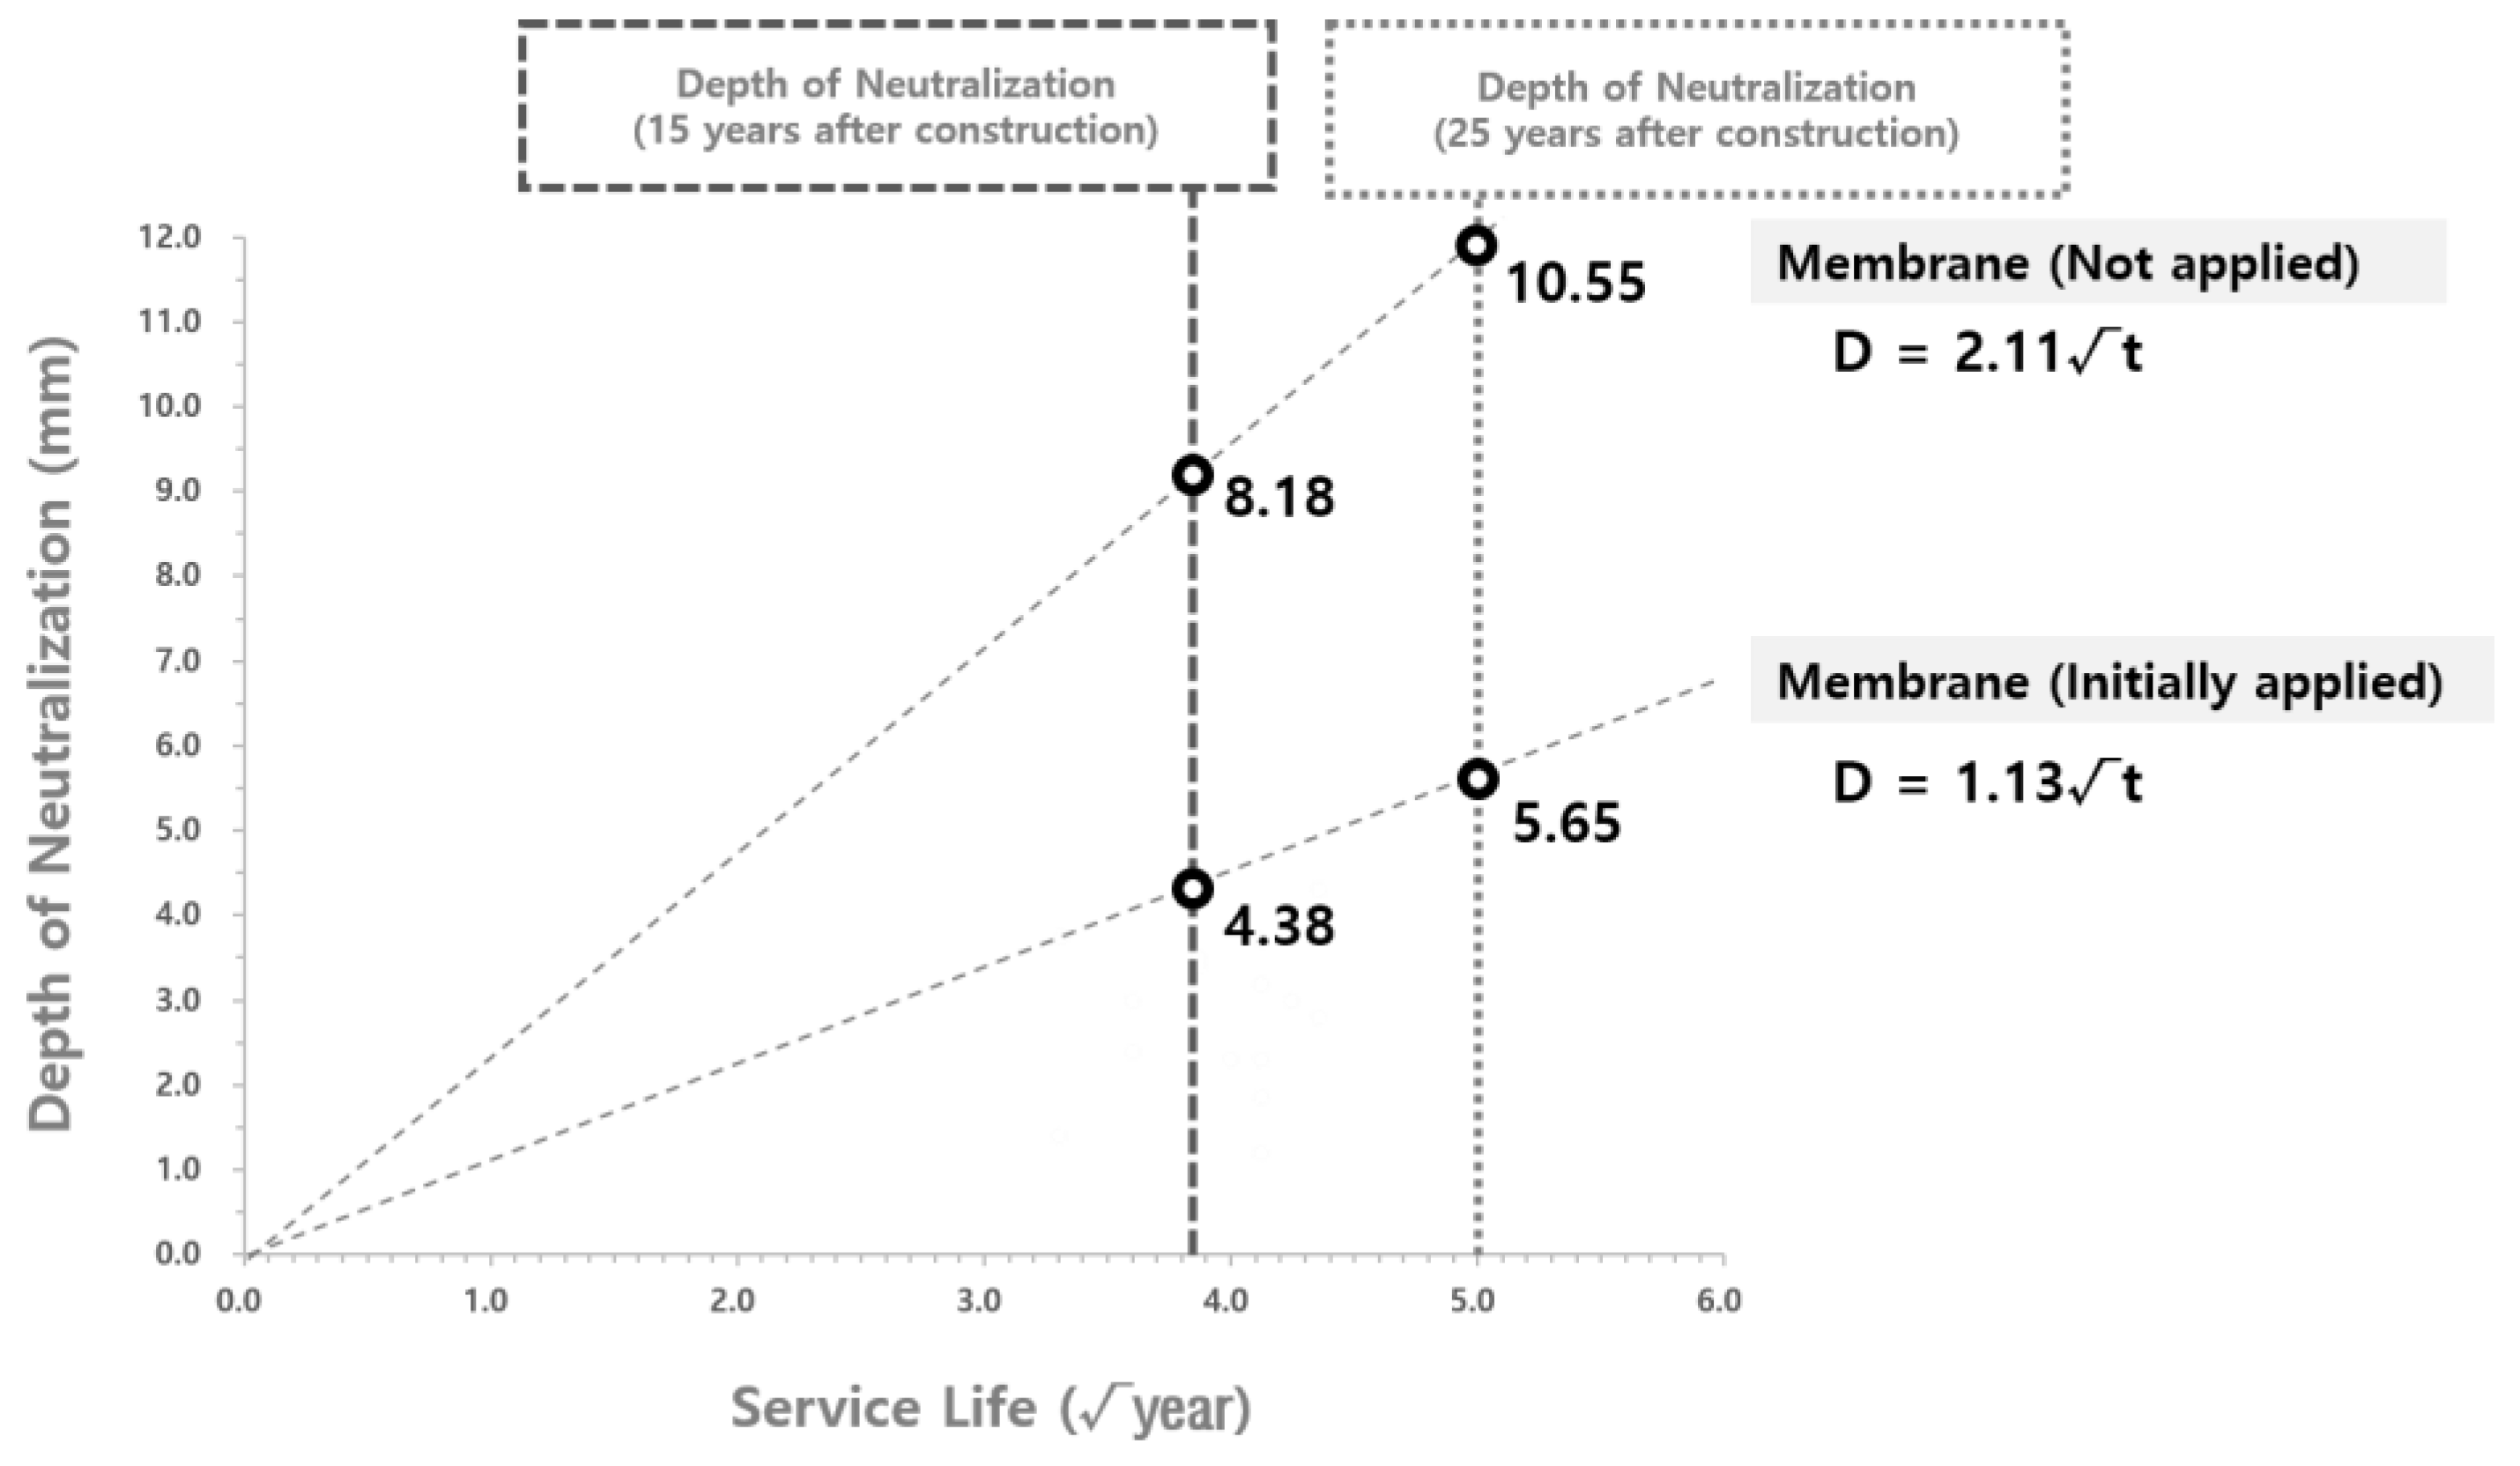
- To guarantee the similarity of the experimental group, 42 highly similar water supply reservoirs were selected from among the water reservoirs that are currently in operation in Seoul. On-site carbonation assessments were then performed in order to derive the carbonation rate coefficients. In the case of the water reservoirs applied with the waterproofing/anticorrosive method immediately after public service, the upper and lower values were D = 1.13 and D = 0.29, respectively, whereas those for the water reservoirs with the waterproofing/anticorrosive method applied after 15 years of service life were D = 1.89 and D = 0.94, respectively.
- (2)
- The carbonation rate coefficient of the water reservoirs with no waterproofing/anticorrosive method applied from the initial stage of public service was derived based on the carbonation rate coefficients of the structures applied with the waterproofing/anticorrosive method from the initial stage of public service and after 15 years of service life. The results show that for the carbonation rate coefficient of the water reservoirs with no waterproofing/anticorrosive method applied from the initial stage of public service, the upper and lower limits were D = 2.11 and D = 1.13, respectively.
- (3)
- The carbonation rates of the water reservoirs with or without application of the waterproofing/anticorrosive method were analyzed based on the carbonation rate coefficients and duration of the waterproofing/anticorrosive method application derived above. Results show that the carbonation rate of the water reservoirs with the waterproofing/anticorrosive method applied from the initial stage of public service or during public service was reduced when compared with that of the water reservoirs with no waterproofing/anticorrosive method applied after public service.
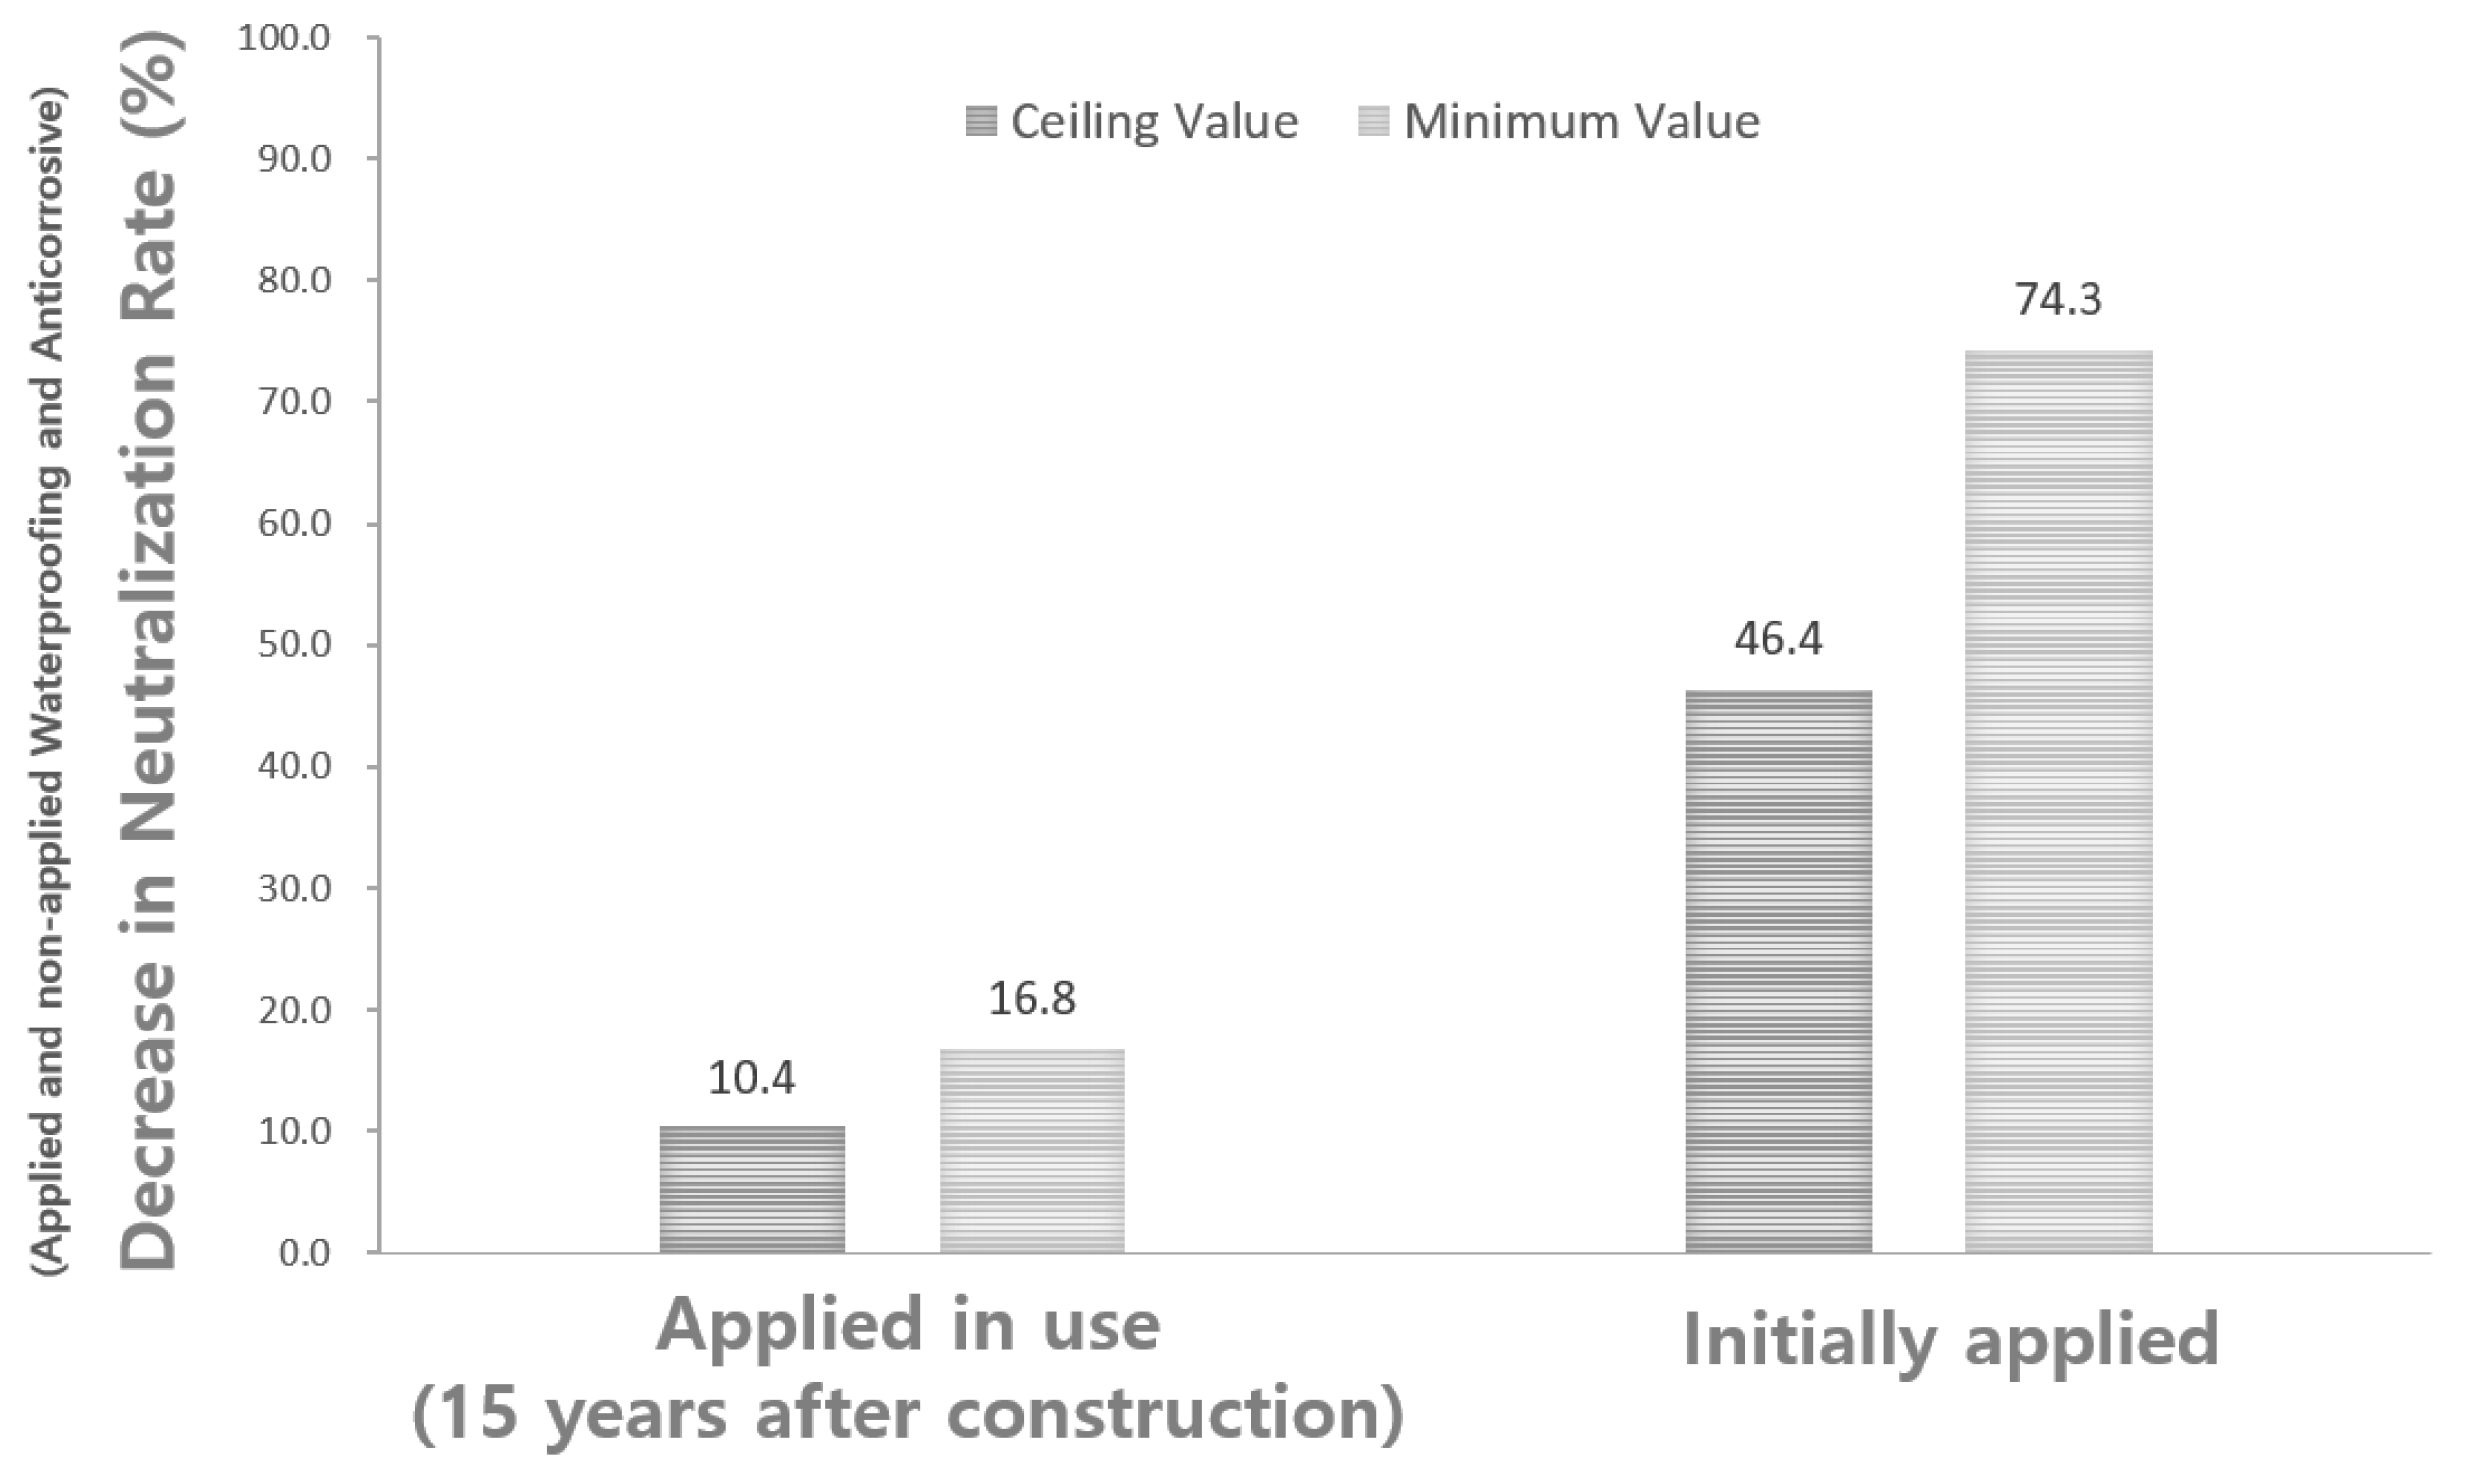
- (4)
- The rate of decrease in the carbonation rate was about 10.4% to 16.8% in the water reservoirs applied with the waterproofing/anticorrosive method after 15 years of service life. The decrease in carbonation rate was about 46.4% to 74.3% in the water reservoirs applied with the waterproofing/anticorrosive method from the initial stage of public service.
- (5)
- Based on the above research results, it is concluded that the application of the waterproofing/anticorrosive method is needed in order to decrease the carbonation rate. Early application is thus recommended for a concrete water reservoir inside the water reservoir structure.
Author Contributions
Funding
Institutional Review Board Statement
Informed Consent Statement
Data Availability Statement
Conflicts of Interest
Abbreviations
| KS | Korean Industrial Standards |
References
- Kwak, K.S.; Ma, S.J.; Choi, S.M.; Oh, S.K. An Experimental Study of the Performance Grade Establishment of Bond Strength for the Most Suitable Maintenance of Waterproof and Anti-corrosion in the Concrete Structure for Tap Water. Korea Recycl. Constr. Resour. Inst. 2015, 3, 122–132. [Google Scholar]
- Kwak, K.S.; Seo, H.J.; Miyaushi, H.; Kim, K.Y.; Oh, S.K. Property Analysis of Waterproofing and Corrosion-Resistant Performance in Concrete Water Supply Facilities. Archit. Inst. Korea 2011, 27, 149–158. [Google Scholar]
- Rao, N.V.; Meena, T. A review on carbonation study in concrete. Mater. Sci. Eng. 2017, 263, 032011. [Google Scholar] [CrossRef]
- Chae, B.S. A Study on Improvement of Property through Water Supply Facilities Concrete Wall Applicated by Waterproofing and Anticorrosive Coatings. Doctoral Thesis, Korea University, Seoul, Korea, December 2001. Available online: https://www.riss.kr/link?id=T8182791 (accessed on 28 July 2022).
- Park, J.H.; Lee, H.S.; Shin, J.H. An experimental study on evaluation of bond strength of arc thermal metal spraying according to treatment method of water facilities concrete surface. J. Korea Inst. Build. Constr. 2016, 16, 107–115. [Google Scholar] [CrossRef]
- Swamy, R.N.; Tanikawa, S. An external surface coating to protect the concrete and steel from aggressive environments. Mater. Struct. 1993, 26, 465–478. [Google Scholar] [CrossRef]
- Vera, R.; Apablaza, J.; Carvajal, A.; Vera, M. Enrique. Effect of Surface Coatings in the Corrosion of Reinforced Concrete in Acid Environments. Int. J. Electrochem. Sci. 2013, 8, 11832–11846. [Google Scholar]
- Jain, A.; Gencturk, B. Multiphysics and Multiscale Modeling of Coupled Transport of Chloride Ions in Concrete. Materials 2021, 14, 885. [Google Scholar] [CrossRef]
- Biswas, R.; Rai, B.; Samui, P. Compressive strength prediction model of high-strength concrete with silica fume by destructive and non-destructive technique. Innov. Infrastruct. 2021, 6, 65. [Google Scholar] [CrossRef]
- Prakash, S.; Kumar, S.; Biswas, R.; Rai, B. Influence of silica fume and ground granulated blast furnace slag on the engineering properties of ultra-high-performance concrete. Innov. Infrastruct. 2022, 7, 117. [Google Scholar] [CrossRef]
- Jun, J.S.; Park, J.S.; Oh, S.K.; Lim, N.G. Proposal of Selection of Index of Evaluation Waterproof and Anti-corrosion Material to be Applied on the Interior of Water Supply Facilities. Archit. Inst. Korea 2016, 32, 31–39. [Google Scholar] [CrossRef]
- Owaki, E.; Okamoto, R.; Nagashio, D. Deterioration of concrete in an advanced water treatment plant. In Concrete under Severe Condition: Environment and Loading; Gjorv, E., Odd, E., Sakai, K., Banthia, N., Eds.; E & FN Spon: London, UK; New York, NY, USA, 1998; p. 438. [Google Scholar]
- Hwang, S.H.; Yoon, Y.S.; Kwon, S.J. Carbonation Behavior Evaluation of OPC Concrete Considering Effect of Aging and Loading Conditions. Korea Inst. Struct. Maint. Insp. 2019, 23, 122–129. [Google Scholar]
- Kwon, S.J.; Park, S.S.; Nam, S.H.; Lho, B.C. A Service Life Prediction for Unsound Concrete Under Carbonation Through Probability of Durable Failure. Korea Inst. Struct. Maint. Insp. 2008, 12, 49–58. [Google Scholar]
- Pade, C.; Guimaraes, M. The CO2 Uptake of Concrete in a 100 Year Perspective. Cem. Con. 2007, 37, 1348–1356. [Google Scholar] [CrossRef]
- Lagerblad, B. Carbon Dioxide Uptake During Concrete Life Cycle: State of the Art, Report; Swedish Cement and Concrete Research Institute: Stockholm, Sweden, 2006; pp. 22–32. [Google Scholar]
- Ho, D.W.S.; Lewis, R.K. Carbonation of concrete and its prediction. Cem. Concr. Res. 1987, 17, 489–504. [Google Scholar] [CrossRef]
- Biswas, R.; Li, E.; Zhang, N.; Kumar, S.; Rai, B.; Zhou, J. Development of hybrid models using metaheuristic optimization techniques to predict the carbonation depth of fly ash concrete. J. Constr. Build. Mater. 2022, 346, 128483. [Google Scholar] [CrossRef]
- Lee, H.S.; Ha, J.D. Durability Design and Repair System of RC Structure for Concrete Carbonation. Mag. Korea Concr. Inst. 2001, 13, 36–43. [Google Scholar]
- Nodehi, M.; Ozbakkaloglu, T.; Gholampour, A.; Mohammed, T.; Shi, X. The effect of curing regime on physico-mechanical, microstructural and durability properties of alkali-activated materials: A review. J. Constr. Build. Mater. 2022, 321, 126335. [Google Scholar] [CrossRef]
- Choi, S.Y. A Study on the Improvement of Evaluation Test Method for Waterproofing and Anti-Corrosion Materials of Water Supply Facility. Master’s Thesis, Seoul National University of Science and Technology, Seoul, Korea, February 2017. Available online: https://www.riss.kr/link?id=T14442064 (accessed on 28 July 2022).
- De Schutter, G.; Audenaert, K. Evaluation of water absorption of concrete as a measure for resistance against carbonation and chloride migration. Mater. Struct. 2004, 37, 591–596. [Google Scholar] [CrossRef]
- Lee, H.S.; Park, J.H.; Singh, J.K.; Ismail, M.A. Protection of Reinforced Concrete Structures of Waste Water Treatment Reservoirs with Stainless Steel Coating Using Arc Thermal Spraying Technique in Acidified Water. Materials 2016, 9, 753. [Google Scholar] [CrossRef] [Green Version]
- Roziere, E.; Loukili, A.; Cussigh, F. A performance based approach for durability of concrete exposed to carbonation. Constr. Build. Mater. 2019, 23, 190–199. [Google Scholar] [CrossRef] [Green Version]
- Kwon, Y.G. Waterproofing and Anticorrosive Method of High Clean Water System Used Anti-ozone Material. Master’s Thesis, Seoul National University of Science and Technology, Seoul, Korea, August 2003. Available online: https://www.riss.kr/link?id=T8970400 (accessed on 28 July 2022).
- Yang, S.D. (An) Experimental Study on the Deterioration of Anticorrosive Coatings under Advanced Water Treatment Using O₃: Centering Around the Concrete Structure for Drink Water. Master’s Thesis, Seoul National University of Science and Technology, Seoul, Korea, February 2003. Available online: http://www.riss.kr/link?id=T8671520 (accessed on 28 July 2022).
- Nodehi, M. Epoxy, polyester and vinyl ester based polymer concrete: A review. Innov. Infrastruct. Solut. 2022, 7, 1–24. [Google Scholar] [CrossRef]
- Korean Standard KS F 4042; Polymer Modified Cement Mortar for Maintenance in Concrete Structure. Korean Agency for Technology and Standards (KATS): Seoul, Korea, 2012.
- Korean Standard KS B 5203-1; Vernier Callipers Part 1: Vernier Callipers Reading to 0.1 and 0.05 mm. Korean Agency for Technology and Standards (KATS): Seoul, Korea, 2013.
- Kim, J.H.; Oh, K.C.; Park, S.B. A Study on Carbonation Velocity for Concrete Structures. Korea Inst. Struct. Maint. Insp. 2008, 12, 163–170. [Google Scholar]
- Jung, J.D. Present Status of Researches on Carbonation of Concrete. Korea Concr. Inst. 1992, 4, 17–24. [Google Scholar] [CrossRef]
- Park, G.K. Durability of a Carbonated Concrete. Korea Concr. Inst. 1995, 7, 74–81. [Google Scholar] [CrossRef]
- Architectural Institute of Japan. Revision of the “Recommendations for Durability Design and Construction Practice of Reinforced Concrete Buildings” of the Architectural Institute of Japan. Concr. J. 2016, 54, 1091–1096. [Google Scholar] [CrossRef]


| Coating Materials | Constituent | CAS NO. | Content (%) |
|---|---|---|---|
| Epoxy | Diglycidyl ether of bispheonl F | 2095-03-6 | 65 |
| Limestone | 1317-65-3 | 30 | |
| etc. | - | 5 | |
| Ceramic Metal | Diglycidyl ether of bispheonl F | 2095-03-6 | 40 |
| Micro ceramic metal powder | - | 20 | |
| etc. | - | 40 | |
| Polyurea | 4,4-Diphenylmethane diisocyanate | 101-68-8 | 55 |
| 1,6-Hexamethylene diisocyanate | 28182-81-2 | 40 | |
| etc. | - | 5 |
| No. | Completion (Year) | Design Strength (MPa) | Service Life (Year) | Capacity (m3/Day) | Compressive Strength (MPa) | Duration of Waterproofing/Anticorrosive Material Application (Year) |
|---|---|---|---|---|---|---|
| 1 | 2003 | 24 | 16 | 2500 | 27 | 16 |
| 2 | 2002 | 24 | 17 | 50,000 | 28.6 | 17 |
| 3 | 1987 | 21 | 32 | 60,000 | 26.1 | 17 |
| 4 | 1993 | 24 | 26 | 600 | 28.5 | 10 |
| 5 | 2006 | 24 | 13 | 60,000 | 24.3 | 13 |
| 6 | 1987 | 21 | 32 | 23,000 | 21.3 | 16 |
| 7 | 1990 | 24 | 29 | 40,000 | 26 | 14 |
| 8 | 1987 | 24 | 32 | 30,000 | 27.2 | 14 |
| 9 | 2000 | 24 | 19 | 60,000 | 24.8 | 8 |
| 10 | 1990 | 24 | 29 | 60,000 | 24.5 | 12 |
| 11 | 1992 | 24 | 27 | 2500 | 21.9 | 8 |
| 12 | 2001 | 24 | 18 | 110,000 | 28.1 | 18 |
| 13 | 1995 | 24 | 24 | 60,000 | 29.1 | 9 |
| 14 | 1989 | 24 | 30 | 2500 | 25.9 | 13 |
| 15 | 2004 | 30 | 15 | 30,000 | 31.2 | 15 |
| 16 | 2004 | 30 | 15 | 20,000 | 30 | 15 |
| 17 | 1988 | 24 | 31 | 2000 | 24.7 | 12 |
| 18 | 2008 | 27 | 11 | 10,000 | 28.5 | 11 |
| 19 | 2002 | 27 | 17 | 200,000 | 30 | 17 |
| 20 | 2014 | 30 | 5 | 3000 | 32.9 | 5 |
| 21 | 1993 | 24 | 26 | 100,000 | 28.1 | 12 |
| 22 | 2002 | 24 | 17 | 40,000 | 26 | 17 |
| 23 | 1998 | 21 | 21 | 170,000 | 27.3 | 8 |
| 24 | 1988 | 21 | 31 | 2000 | 23.1 | 12 |
| 25 | 1991 | 21 | 28 | 1200 | 23.4 | 9 |
| 26 | 1992 | 21 | 27 | 3000 | 26.7 | 9 |
| 27 | 2002 | 24 | 17 | 200,000 | 26.4 | 17 |
| 28 | 1995 | 21 | 24 | 6000 | 24.8 | 8 |
| 29 | 1992 | 24 | 27 | 4000 | 25.8 | 12 |
| 30 | 1985 | 21 | 19 | 11,000 | 23.6 | 8 |
| 31 | 2000 | 21 | 19 | 145,000 | 25.1 | 19 |
| 32 | 2002 | 24 | 17 | 90,000 | 24.8 | 17 |
| 33 | 2000 | 24 | 19 | 40,000 | 23.9 | 19 |
| 34 | 1991 | 24 | 28 | 4000 | 25.1 | 11 |
| 35 | 1991 | 24 | 28 | 60,000 | 24.2 | 10 |
| 36 | 1987 | 21 | 31 | 200 | 24 | 19 |
| 37 | 1991 | 21 | 28 | 3300 | 24.1 | 13 |
| 38 | 2006 | 27 | 13 | 20,000 | 26.8 | 13 |
| 39 | 1994 | 21 | 25 | 2000 | 26.1 | 12 |
| 40 | 2002 | 24 | 17 | 10,000 | 23.6 | 3 |
| 41 | 1992 | 24 | 27 | 2000 | 25.8 | 12 |
| 42 | 1992 | 24 | 27 | 1000 | 25.3 | 12 |
| No. | Completion (Year) | Design Strength (MPa) | Service Life (Year) | Capacity (m3/Day) | Compressive Strength (MPa) | Carbonation Depth (mm) | Duration of Waterproofing/Anticorrosive Material Application (Year) |
|---|---|---|---|---|---|---|---|
| 1 | 2003 | 24 | 16 | 2500 | 27 | 2.3 | 16 |
| 2 | 2002 | 24 | 17 | 50,000 | 28.6 | 3.2 | 17 |
| 3 | 1987 | 21 | 32 | 60,000 | 26.1 | 6.5 | 17 |
| 4 | 1993 | 24 | 26 | 600 | 28.5 | 7.2 | 10 |
| 5 | 2006 | 24 | 13 | 60,000 | 24.3 | 2.4 | 13 |
| 6 | 1987 | 21 | 32 | 23,000 | 21.3 | 7.5 | 16 |
| 7 | 1990 | 24 | 29 | 40,000 | 26 | 6.8 | 14 |
| 8 | 1987 | 24 | 32 | 30,000 | 27.2 | 6.5 | 14 |
| 9 | 2000 | 24 | 19 | 60,000 | 24.8 | 5.0 | 8 |
| 10 | 1990 | 24 | 29 | 60,000 | 24.5 | 6.6 | 12 |
| 11 | 1992 | 24 | 27 | 2500 | 21.9 | 9.8 | 8 |
| 12 | 2001 | 24 | 18 | 110,000 | 28.1 | 3.0 | 18 |
| 13 | 1995 | 24 | 24 | 60,000 | 29.1 | 6.2 | 9 |
| 14 | 1989 | 24 | 30 | 2500 | 25.9 | 7.5 | 13 |
| 15 | 2004 | 30 | 15 | 30,000 | 31.2 | 3.4 | 15 |
| 16 | 2004 | 30 | 15 | 20,000 | 30 | 3.5 | 15 |
| 17 | 1988 | 24 | 31 | 2000 | 24.7 | 7.2 | 12 |
| 18 | 2008 | 27 | 11 | 10,000 | 28.5 | 3.8 | 11 |
| 19 | 2002 | 27 | 17 | 200,000 | 30 | 1.2 | 17 |
| 20 | 2014 | 30 | 5 | 3000 | 32.9 | 1.4 | 5 |
| 21 | 1993 | 24 | 26 | 100,000 | 28.1 | 7.0 | 12 |
| 22 | 2002 | 24 | 17 | 40,000 | 26 | 3.7 | 17 |
| 23 | 1998 | 21 | 21 | 170,000 | 27.3 | 6.9 | 8 |
| 24 | 1988 | 21 | 31 | 2000 | 23.1 | 7.4 | 12 |
| 25 | 1991 | 21 | 28 | 1200 | 23.4 | 5.5 | 9 |
| 26 | 1992 | 21 | 27 | 3000 | 26.7 | 5.0 | 9 |
| 27 | 2002 | 24 | 17 | 200,000 | 26.4 | 1.9 | 17 |
| 28 | 1995 | 21 | 24 | 6000 | 24.8 | 4.6 | 8 |
| 29 | 1992 | 24 | 27 | 4000 | 25.8 | 5.7 | 12 |
| 30 | 1985 | 21 | 19 | 11,000 | 23.6 | 4.4 | 8 |
| 31 | 2000 | 21 | 19 | 145,000 | 25.1 | 2.3 | 19 |
| 32 | 2002 | 24 | 17 | 90,000 | 24.8 | 2.7 | 17 |
| 33 | 2000 | 24 | 19 | 40,000 | 23.9 | 4.3 | 19 |
| 34 | 1991 | 24 | 28 | 4000 | 25.1 | 6.5 | 11 |
| 35 | 1991 | 24 | 28 | 60,000 | 24.2 | 7.9 | 10 |
| 36 | 1987 | 21 | 31 | 200 | 24 | 6.4 | 19 |
| 37 | 1991 | 21 | 28 | 3300 | 24.1 | 5.5 | 13 |
| 38 | 2006 | 27 | 13 | 20,000 | 26.8 | 3.0 | 13 |
| 39 | 1994 | 21 | 25 | 2000 | 26.1 | 5.2 | 12 |
| 40 | 2002 | 24 | 17 | 10,000 | 23.6 | 7.3 | 3 |
| 41 | 1992 | 24 | 27 | 2000 | 25.8 | 6.8 | 12 |
| 42 | 1992 | 24 | 27 | 1000 | 25.3 | 7.3 | 12 |
| Item | Types of Concrete According to the Aggregate Type | ||
|---|---|---|---|
| Normal Concrete | Lightweight Aggregate Concrete Class 1 a | Lightweight Aggregate Concrete Class 2 a | |
| α1 | 1.0 | 1.2 | 1.4 |
| Item | Types of Cement | |||||
|---|---|---|---|---|---|---|
| Ordinary Portland Cement | High Early Strength Portland Cement | Blast Furnace Cement Class A | Blast Furnace Cement Class B | Blast Furnace Cement Class C | Flay Ash Cement Class B | |
| α2 | 1.0 | 0.85 | 1.25 | 1.4 | 1.8 | 1.8 |
| Classification | Time of Waterproofing/Anticorrosive Method Application | Carbonation Rate Coefficient |
|---|---|---|
| Membrane coatings | Applied at the initial stage of public service | ∘ Upper limit: D = 1.25 ∘ Lower limit: D = 0.65 |
| Applied after 15 years of service life | ∘ Upper limit: D = 1.90 ∘ Lower limit: D = 1.20 |
| Classification | Duration of Waterproofing/Anticorrosive Method Application | Carbonation Rate Coefficient |
|---|---|---|
| Membrane coatings | Applied at the initial stage of public service | ∘ Upper limit: D = 1.13 ∘ Lower limit: D = 0.29 |
| Applied after 15 years of service life | ∘ Upper limit: D = 1.89 ∘ Lower limit: D = 0.94 |
| Classification | Duration of Waterproofing/Anticorrosive Method Application | Carbonation Rate Coefficient |
|---|---|---|
| Membrane coatings | Applied at the initial stage of public service | ∘ Upper limit: D = 1.13 ∘ Lower limit: D = 0.29 |
| Applied after 15 years of service life | ∘ Upper limit: D = 1.89 ∘ Lower limit: D = 0.94 | |
| Not applied after public service | ∘ Upper limit: D = 2.11 ∘ Lower limit: D = 1.13 |
Publisher’s Note: MDPI stays neutral with regard to jurisdictional claims in published maps and institutional affiliations. |
© 2022 by the authors. Licensee MDPI, Basel, Switzerland. This article is an open access article distributed under the terms and conditions of the Creative Commons Attribution (CC BY) license (https://creativecommons.org/licenses/by/4.0/).
Share and Cite
Go, J.-I.; Park, W.-G.; Choi, S.-Y.; Jiang, B.; He, X.; Oh, S.-K. Analysis of the Effect of Carbonation Rate on the Concrete Water Reservoir Structures According to Applied Waterproofing/Anticorrosive Methods. Materials 2022, 15, 6854. https://doi.org/10.3390/ma15196854
Go J-I, Park W-G, Choi S-Y, Jiang B, He X, Oh S-K. Analysis of the Effect of Carbonation Rate on the Concrete Water Reservoir Structures According to Applied Waterproofing/Anticorrosive Methods. Materials. 2022; 15(19):6854. https://doi.org/10.3390/ma15196854
Chicago/Turabian StyleGo, Jeong-Il, Wan-Gu Park, Su-Young Choi, Bo Jiang, Xingyang He, and Sang-Keun Oh. 2022. "Analysis of the Effect of Carbonation Rate on the Concrete Water Reservoir Structures According to Applied Waterproofing/Anticorrosive Methods" Materials 15, no. 19: 6854. https://doi.org/10.3390/ma15196854