
Subtyping on Live Lymphoma Cell Lines by Raman Spectroscopy

 ,
, 
 ,
,  and
and 
Abstract
:1. Introduction
2. Materials and Methods
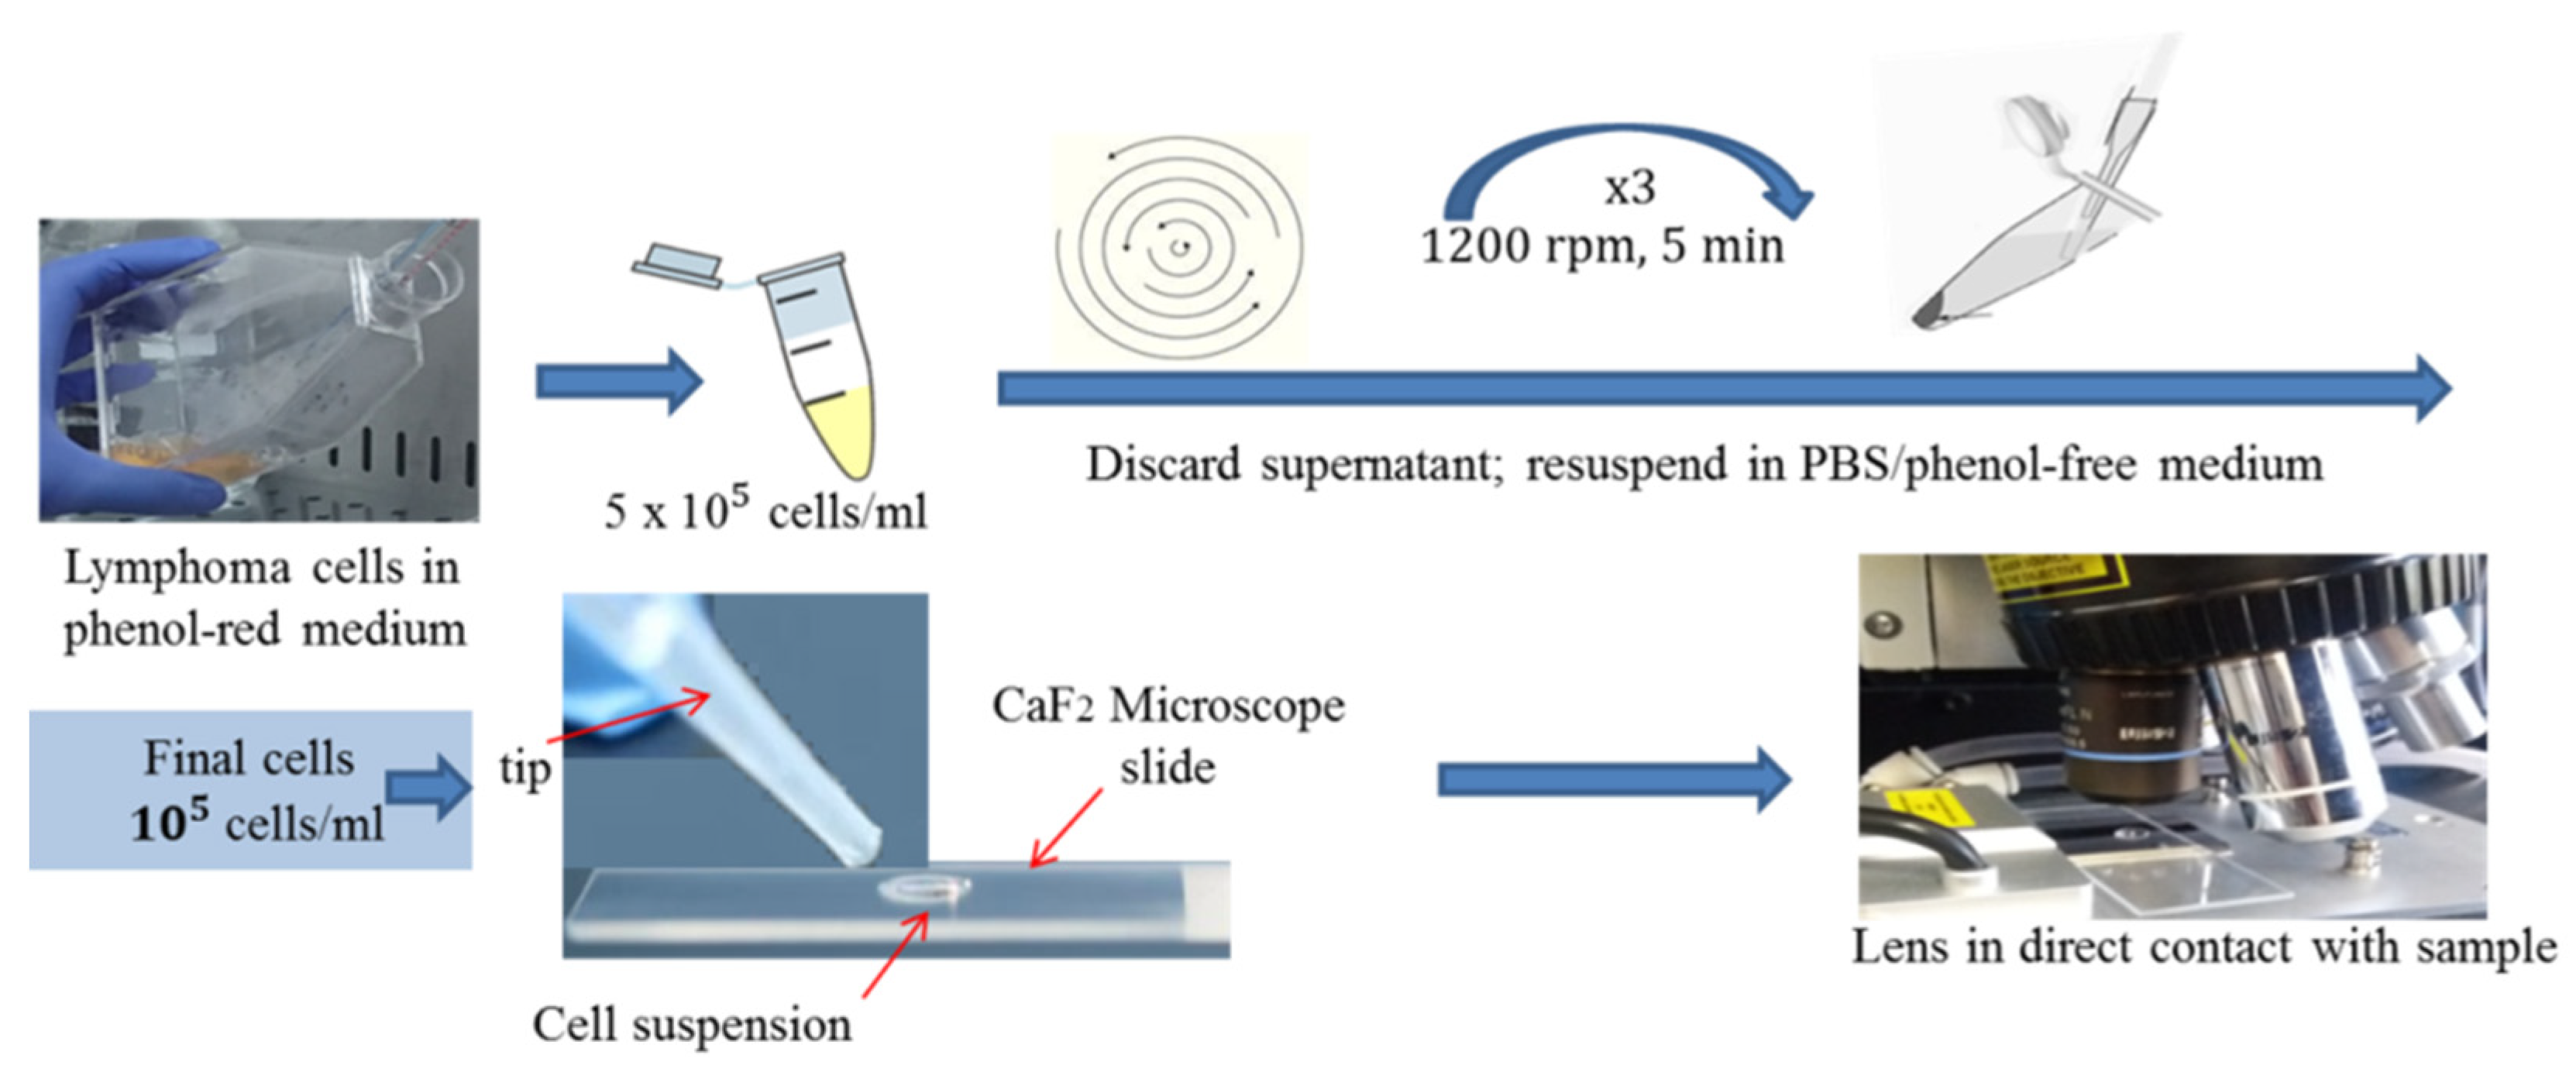
2.1. Cell Lines, Culture Conditions and Sample Preparation
2.2. Instrument and Measurement Preparation
2.2.1. Instrument Description
2.2.2. Acquisition Settings
2.2.3. Measurement Process
2.2.4. Experiments Performed
2.2.5. Raman Spectral Database
2.3. Raman Spectra Processing and Analysis
3. Results and Discussion
3.1. JMP-1/MCL NHL and MDA-V/HL Cell Lines Comparison
3.2. Comparison of Experiments BR1 vs. BR2 of JMP-1/MCL NHL Cell Line
3.3. Subtyping BR1 vs. BR3, BR4 (JMP-1/MCL NHL vs. MDA-V/HL)
3.4. Subtyping BR2 vs. BR3,4 (JMP-1/MCL NHL vs. MDA-V/HL)
3.5. Cell Line Differences Due to Temperature
3.5.1. MDA-V/HL Cell Line Temperature Differences (Tn-T37 MDA-V/HL)
3.5.2. JMP-1/MCL NHL Cell Line Temperature Differences (Tn-T37 JMP-1/MCL NHL)
3.6. Cell Viability
4. Conclusions
Supplementary Materials
Author Contributions
Funding
Institutional Review Board Statement
Informed Consent Statement
Data Availability Statement
Acknowledgments
Conflicts of Interest
References
- Steliarova-Foucher, E.; Stiller, C.; Lacour, B.; Kaatsch, P. International Classification of Childhood Cancer, third edition. Cancer 2005, 103, 1457–1467. [Google Scholar] [CrossRef] [PubMed]
- Harris, N.L.; Jaffe, E.S.; Diebold, J.; Flandrin, G.; Muller-Hermelink, H.K.; Vardiman, J. Lymphoma classification—From controversy to consensus: The R.E.A.L. and WHO Classification of lymphoid neoplasms. Ann. Oncol. 2000, 11 (Suppl. S1), 3–10. [Google Scholar] [CrossRef]
- Caleo, A.; Sanchez-Aguilera, A.; Rodriguez, S.; Dotor, A.M.; Beltran, L.; de Larrinoa, A.F.; Menarguez, F.J.; Piris, M.A.; Garcia, J.F. Composite Hodgkin lymphoma and mantle cell lymphoma: Two clonally unrelated tumors. Am. J. Surg. Pathol. 2003, 27, 1577–1580. [Google Scholar] [CrossRef]
- Kramer, S.; Uppal, G.; Wang, Z.X.; Gong, J.Z. Mantle Cell Lymphoma With Hodgkin and Reed-Sternberg Cells: Review With Illustrative Case. Appl. Immunohistochem. Mol. Morphol. 2019, 27, 8–14. [Google Scholar] [CrossRef] [PubMed]
- Kuppers, R. The biology of Hodgkin’s lymphoma. Nat. Rev. Cancer 2009, 9, 15–27. [Google Scholar] [CrossRef]
- Driessen, J.; Visser, O.; Zijlstra, J.M.; Lugtenburg, P.J.; Plattel, W.J.; Kersten, M.J.; Dinmohamed, A.G. Primary therapy and relative survival in classical Hodgkin lymphoma: A nationwide population-based study in the Netherlands, 1989–2017. Leukemia 2021, 35, 494–505. [Google Scholar] [CrossRef] [PubMed]
- Jain, P.; Wang, M. Mantle cell lymphoma: 2019 update on the diagnosis, pathogenesis, prognostication, and management. Am. J. Hematol. 2019, 94, 710–725. [Google Scholar] [CrossRef] [Green Version]
- Shiramizu, B.; Oda, R.; Kamada, N.; Garcia, M.A.; Shieh, T.; Maeda, T.A.; Choi, S.Y.; Lim, E.; Misra, A. Unique Raman Spectroscopic Fingerprints of B-Cell Non-Hodgkin Lymphoma: Implications for Diagnosis, Prognosis and New Therapies. J. Biol. Med. Sci. 2018, 2, 105. [Google Scholar] [PubMed]
- Keshavarz, M.; Tan, B.; Venkatakrishnan, K. Label-Free SERS Quantum Semiconductor Probe for Molecular-Level and in Vitro Cellular Detection: A Noble-Metal-Free Methodology. ACS Appl. Mater. Interfaces 2018, 10, 34886–34904. [Google Scholar] [CrossRef]
- Keshavarz, M.; Chowdhury, A.K.M.R.H.; Kassanos, P.; Tan, B.; Venkatakrishnan, K. Self-assembled N-doped Q-dot carbon nanostructures as a SERS-active biosensor with selective therapeutic functionality. Sens. Actuators B Chem. 2020, 323, 128703. [Google Scholar] [CrossRef]
- Rau, J.V.; Marini, F.; Fosca, M.; Cippitelli, C.; Rocchia, M.; Di Napoli, A. Raman spectroscopy discriminates malignant follicular lymphoma from benign follicular hyperplasia and from tumour metastasis. Talanta 2019, 194, 763–770. [Google Scholar] [CrossRef] [PubMed]
- Lloyd, G.R.; Orr, L.E.; Christie-Brown, J.; McCarthy, K.; Rose, S.; Thomas, M.; Stone, N. Discrimination between benign, primary and secondary malignancies in lymph nodes from the head and neck utilising Raman spectroscopy and multivariate analysis. Analyst 2013, 138, 3900–3908. [Google Scholar] [CrossRef] [PubMed]
- Lin, D.; Lin, J.Q.; Wu, Y.A.; Feng, S.Y.; Li, Y.Z.; Yu, Y.; Xi, G.Q.; Zeng, H.S.; Chen, R. Investigation on the interactions of lymphoma cells with paclitaxel by Raman spectroscopy. Spectrosc. Int. J. 2011, 25, 23–32. [Google Scholar] [CrossRef]
- Das, R.S.; Agrawal, Y.K. Raman spectroscopy: Recent advancements, techniques and applications. Vib. Spectrosc. 2011, 57, 163–176. [Google Scholar] [CrossRef]
- Leventaki, V.; Drakos, E.; Karanikou, M.; Psatha, K.; Lin, P.; Schlette, E.; Eliopoulos, A.; Vassilakopoulos, T.P.; Papadaki, H.; Patsouris, E.; et al. c-JUN N-terminal kinase (JNK) is activated and contributes to tumor cell proliferation in classical Hodgkin lymphoma. Hum. Pathol. 2014, 45, 565–572. [Google Scholar] [CrossRef]
- Talari, A.C.S.; Movasaghi, Z.; Rehman, S.; Rehman, I.U. Raman Spectroscopy of Biological Tissues. Appl. Spectrosc. Rev. 2015, 50, 46–111. [Google Scholar] [CrossRef]
- Czamara, K.; Majzner, K.; Pacia, M.Z.; Kochan, K.; Kaczor, A.; Baranska, M. Raman spectroscopy of lipids: A review. J. Raman Spectrosc. 2015, 46, 4–20. [Google Scholar] [CrossRef]
- Notingher, I.; Hench, L.L. Raman microspectroscopy: A noninvasive tool for studies of individual living cells in vitro. Expert Rev. Med. Devices 2006, 3, 215–234. [Google Scholar] [CrossRef]
- Tsikritsis, D.; Richmond, S.; Stewart, P.; Elfick, A.; Downes, A. Label-free identification and characterization of living human primary and secondary tumour cells. Analyst 2015, 140, 5162–5168. [Google Scholar] [CrossRef] [Green Version]
- Lee, L.C.; Liong, C.Y.; Jemain, A.A. Partial least squares-discriminant analysis (PLS-DA) for classification of high-dimensional (HD) data: A review of contemporary practice strategies and knowledge gaps. Analyst 2018, 143, 3526–3539. [Google Scholar] [CrossRef]
- Candeloro, P.; Grande, E.; Raimondo, R.; Di Mascolo, D.; Gentile, F.; Coluccio, M.L.; Perozziello, G.; Malara, N.; Francardi, M.; Di Fabrizio, E. Raman database of amino acids solutions: A critical study of extended multiplicative signal correction. Analyst 2013, 138, 7331–7340. [Google Scholar] [CrossRef] [PubMed]
- De Gelder, J.; De Gussem, K.; Vandenabeele, P.; Moens, L. Reference database of Raman spectra of biological molecules. J. Raman Spectrosc. 2007, 38, 1133–1147. [Google Scholar] [CrossRef]
- Pyrak, E.; Jaworska, A.; Kudelski, A. SERS Studies of Adsorption on Gold Surfaces of Mononucleotides with Attached Hexanethiol Moiety: Comparison with Selected Single-Stranded Thiolated DNA Fragments. Molecules 2019, 24, 3921. [Google Scholar] [CrossRef] [PubMed] [Green Version]
- Kelly, J.G.; Najand, G.M.; Martin, F.L. Characterisation of DNA methylation status using spectroscopy (mid-IR versus Raman) with multivariate analysis. J. Biophotonics 2011, 4, 345–354. [Google Scholar] [CrossRef] [PubMed]


| No | PC6 Peaks (cm−1) | PC5 Peaks (cm−1) | Assignment |
|---|---|---|---|
| 1 * | 747 | 748 | 747 cm−1 → CH2 rocking, L-Phenylalanine [22], 748 cm−1 → DNA, ring breathing of pyrimidine of T [23] |
| 2 | 783 | 782 | Phosphodiester, Cytosine, Thymine, Uracil |
| 3 | 1091 | 1091 | 1090 cm−1 → Symmetric phosphate stretching vibrations, 1092–1093 cm−1 → Phosphodioxy |
| 4 * | 1127 | 1129 | v(C-N) stretching (lipids, 1127 cm−1 → proteins), ν(C-C) skeletal of acyl backbone in lipid (1129 cm−1→ trans conformation) |
| 5 | 1310 | 1312 | 1309 cm−1 → CH3/CH2 twisting or bending mode of lipid/collagen, 1313 cm−1 → CH3CH2 twisting mode of collagen/lipid |
| 6 * | 1337 | 1334 | 1334 cm−1→ DNA/RNA purine bases, Guanine, Adenine), proteins (1337 cm−1→ amide III, CH2 wagging vibrations from Glycine backbone and proline side chain, L-Histidine, L-Tryptophane, L-Glutamate) |
| 7 | 1373 | 1375 | T, A, G (ring breathing modes of the DNA/RNA bases), Acetyl coenzyme A [22] |
| 8 | 1484 | 1484 | 1480–1575 cm−1 → Amide II (largely due to a coupling of C-N stretching and in-plane bending of the N-H group 1485 cm−1 → G, A (ring breathing modes in the DNA bases) Nucleotide acid purine bases (guanine and adenine), Purine rings (guanine) [24] 1483 cm−1 → CG (C4 me) associated with CH2 and CH3 bending and stretching vibrations, CG (C4 me) [24] |
| 9 * | 1578 | 1586 | 1586 cm−1→ DNA/RNA, 1578 cm−1→ Guanine (N3), Guanine, adenine |
| 10 | 2928 | 2919 | CH2 asym stretches and CH stretches in lipids and proteins |
| No | PC2 Peaks (cm−1) | Assignment |
|---|---|---|
| 1 | 1002 | Proteins, C-C aromatic ring stretching (collagen assignment) |
| 2 | 1447 | CH2 bending mode of proteins and lipids, CH2 deformation (protein vibration), a marker for protein concentration, δas (CH3) δ(CH2) of proteins |
| 3 | 1655 | Proteins, Lipids, ν(C=O) amide I, α-helix, C=C lipid stretch |
| 4 | 2938 | CH2 asym stretches and CH stretches in lipids and proteins |
| No | PC4 Peaks (cm−1) | PC2 Peaks (cm−1) | Assignment |
|---|---|---|---|
| 1 | 601 | - | Nucleotide conformation |
| 2 * | 749 | - | 749 cm−1→ Symmetric breathing of tryptophan |
| 3 | 999 | 1001 | 999 cm−1 → ν45(C-C), observed in the spectra of single human Red blood cell (RBC), 1001 cm−1 → Symmetric ring breathing mode of phenylalanine |
| 4 * | 1127 | - | v(C-N) stretching (proteins) |
| 5 | 1194 | 1191 | 1191 cm−1 → L-Valine, acetoacetate, 1194 cm−1 → L-Proline [22], 1185–1300 cm−1 → Antisymmetric phosphate vibrations |
| 6 | 1312 | - | 1313 cm−1 → CH3CH2 twisting mode of collagen/lipid |
| 7 | 1446 | 1445 | δ(CH2), δ(CH3) protein (collagen) and lipid (phospholipids) assignment (CH2 bending mode being of diagnostic significance), CH2 deformation (1446 cm−1) |
| 8 | 1509 | 1502 | 1499 cm−1 → C-C stretching in benzenoid ring, 1510 cm−1 → Cytosine, A (ring breathing modes in the DNA bases |
| 9 * | 1582 | - | C=C stretching in Phenylalanine, hydroxyproline |
| 10 | 1650 | 1656 | 1650 cm−1 → amide I (C=C) absorption, 1656 cm−1 → cis phospholipids, Carbonyl stretch (C=O) |
| 11 | 2851 | - | CH3 symmetric stretch of lipids |
| 12 | - | 2934 | 2934 cm−1 → CH2 asym stretches and CH stretches in lipids and proteins |
| 13 | 2949 | - | CH3 stretching vibrations |
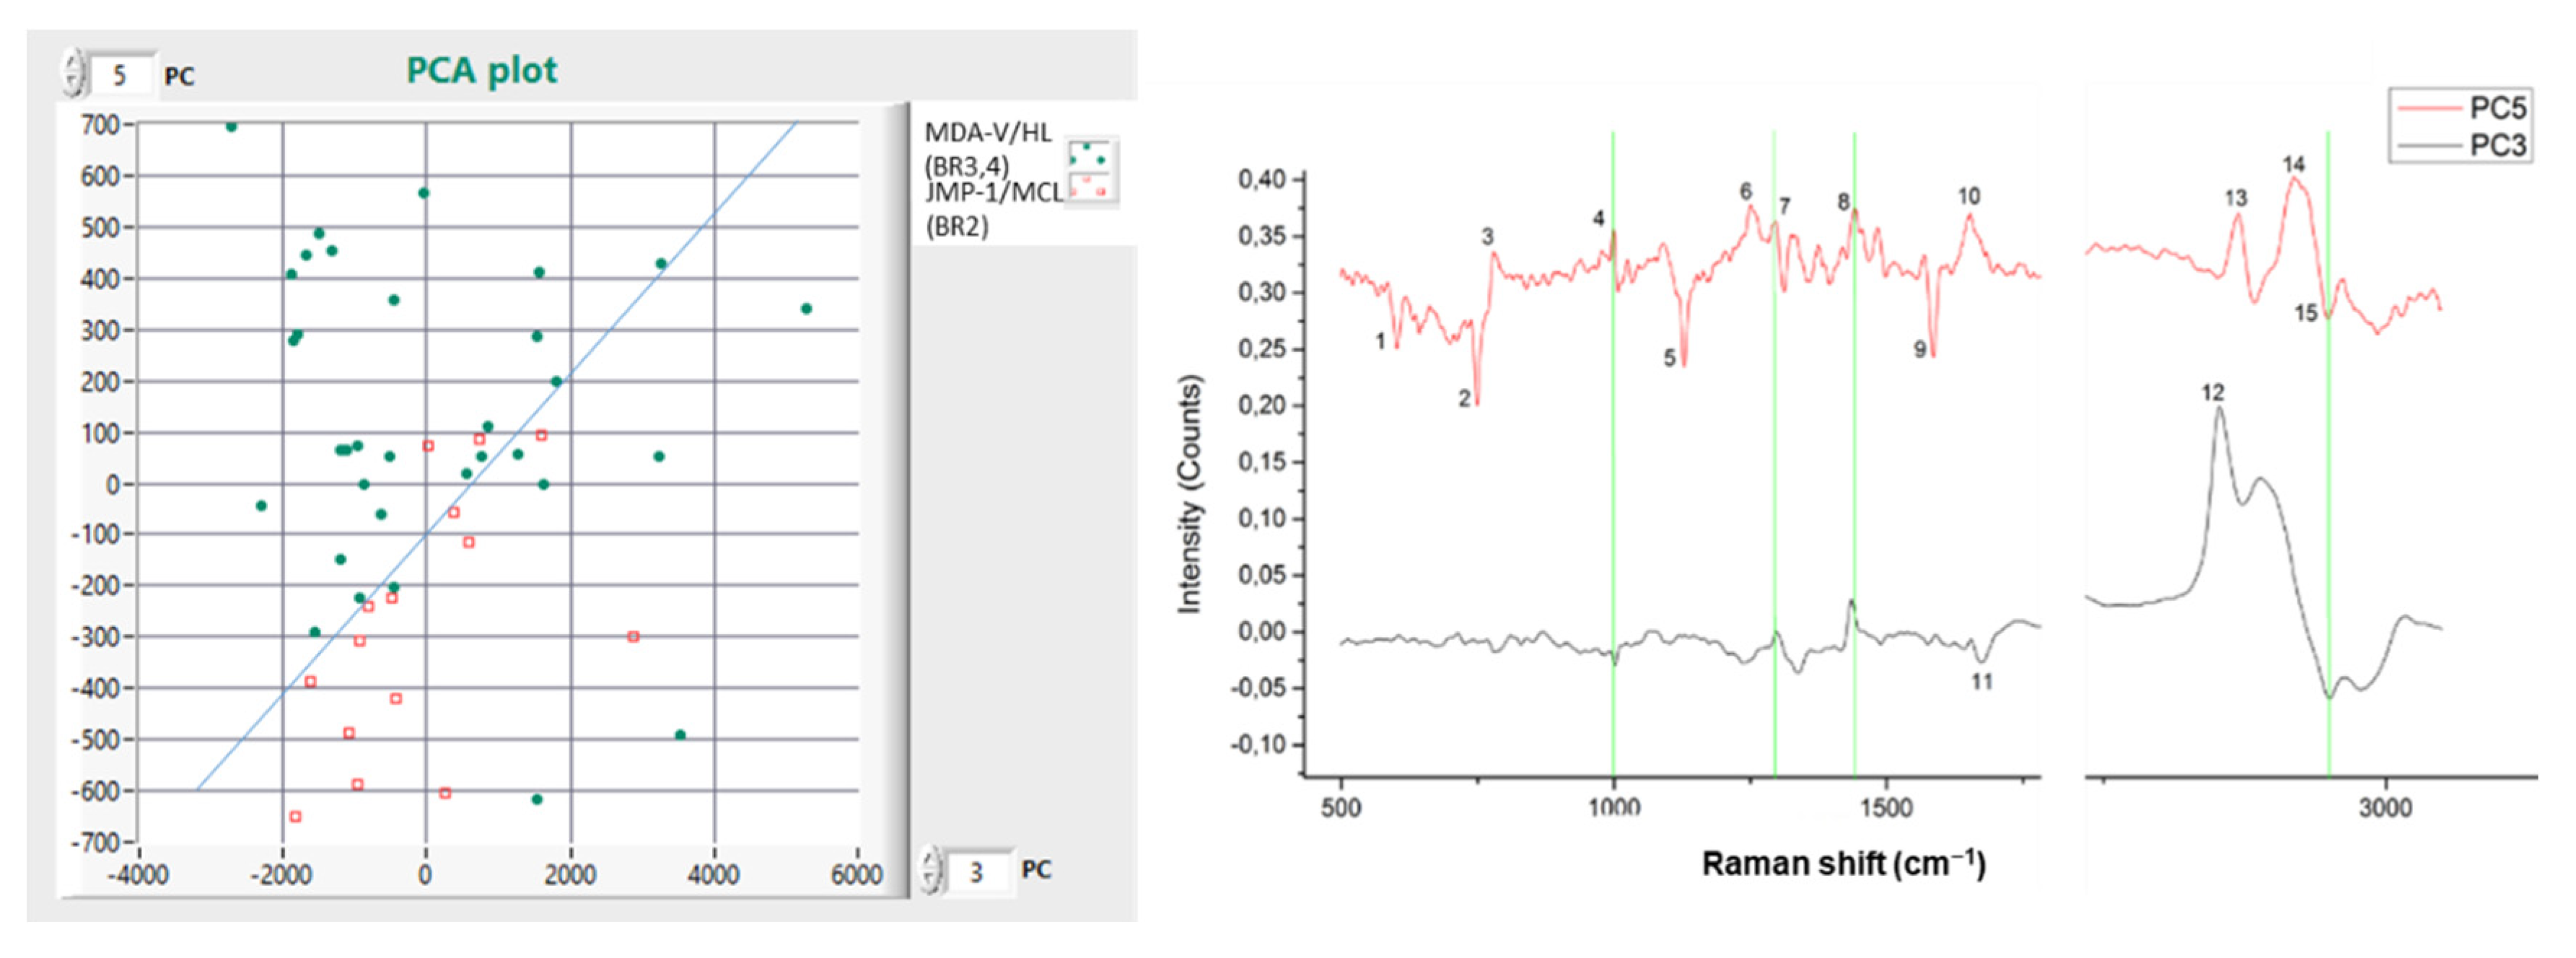
| No | PC5 Peaks (cm−1) | PC3 Peaks (cm−1) | Assignment |
|---|---|---|---|
| 1 | 602 | - | Nucleotide conformation |
| 2 * | 749 | - | Symmetric breathing of tryptophan |
| 3 | 779 | - | DNA/RNA |
| 4 | 999 | 1000 | 900 cm−1 → ν45(C-C), observed in the spectra of single human Red blood cell (RBC), 1000 cm−1 → Phenylalanine, Bound and free NADH |
| 5 * | 1129 | - | ν(C-C) skeletal of acyl backbone in lipid→ trans conformation |
| 6 | 1251 | - | Guanine, cytosine (NH2) |
| 7 | 1298 | 1298 | 1220–1300 cm−1 → Amide III (arising from coupling of C-N stretching & N-H bonding-can be mixed with vibrations of side chains), amide III (L-Arginine [22]), CH bend in Lipids (Palmitic acid), Acyl chains |
| 8 | 1441 | 1435 | 1435 cm−1 → Thymine (weak) [22], 1420–1481 cm−1 → DNA/RNA, Guanine, Adenine, 1441 cm−1 → CH2 scissoring and CH3 bending in lipids, Cholesterol and its esters, C-H bending mode of accumulated lipids in the vecrotic core of the atheromatous plaque |
| 9 * | 1586 | - | DNA/RNA |
| 10 | 1653 | - | 1653 cm−1 → Lipid (C=C stretch, Ascorbic acid [22]) |
| 11 | - | 1672 | C=C stretch, Amide I band (C=O stretch coupled to a N-H bending) |
| 12 | - | 2852 | CH3 symmetric stretch of lipids |
| 13 | 2869 | - | CH2 asym stretches and CH stretches in lipids and proteins, CH2 symmetric stretch of lipids |
| 14 | 2919 | - | CH2 asym stretches and CH stretches in lipids and proteins, CH2 asymmetric stretch of lipids and proteins, CH3 stretching vibration |
| 15 | 2947 | 2950 | CH3 stretching vibrations |
| No | Peaks (cm−1) | Assignment |
|---|---|---|
| 1 * | 749 | Symmetric breathing of tryptophan |
| 2 | 1008 | Proteins (L-Serine) [22], Phenylalanine, ν(C-O), ν(C-C) |
| 3 * | 1125–1134 | Adenine (1125, 1134 cm−1 [22]) and v(C-N) stretching (lipids, 1127 cm−1 → proteins), ν(C-C) skeletal of acyl backbone in lipid (1129 cm−1 → trans conformation), Phospholipid structural changes (trans versus gauche isomerism), Acyl chains, Palmitic acid |
| 4 * | 1581–1586 | DNA/RNA (1586 cm−1), Phenylalanine, hydroxyproline (1582 cm−1→ C=C stretching) |
| 5 | 1604 | 1600–1800 cm−1 → Amide I band of proteins; due to C=O stretching Amide I (which is due mostly to the C=O stretching vibrations of the peptide backbone; has been used the most for structural studies due to its high sensitivity to small changes in molecular geometry and hydrogen bonding of peptide group) 1602 cm−1 → Phenylalanine, δ(C=C), phenylalanine (protein assignment) 1603 cm−1 → C=C in-plane bending mode of phenylalanine and tyrosine, Ring C-C stretch of phenyl,1605 cm−1 → Cytosine (NH2) |
| No | Peaks (cm−1) | Assignment |
|---|---|---|
| 1 * | 745–748 | 700–745 cm−1→ ν(C-S) trans (amino acid methionine), 747 cm−1→ CH2 rocking, L-Phenylalanine [22], 748 cm−1 → DNA, ring breathing of pyrimidine of T [23] |
| 2 | 999–1001 | 999 cm−1 → ν45(C-C), observed in the spectra of single human Red blood cell (RBC), 1001 cm−1 → Symmetric ring breathing mode of phenylalanine |
| 3 * | 1333–1341 | Polynucleotide chain (1334 cm−1→ DNA/RNA purine bases, Guanine, Adenine), proteins (1337 cm−1→ amide III, CH2 wagging vibrations from Glycine backbone and proline side chain, L-Histidine, L-Tryptophane, L-Glutamate), CH3CH2 wagging mode of collagen, CH protein deformation |
| 4 | 1441–1446 | 1441 cm−1 → CH2 scissoring and CH3 bending in lipids, Cholesterol and its esters, C-H bending mode of accumulated lipids in the vecrotic core of the atheromatous plaque, 1446 cm−1 → δ(CH2), δ(CH3) protein (collagen) and lipid (phospholipids) assignment (CH2 bending mode being of diagnostic significance), CH2 deformation |
| 5 | 2934 | CH2 asym stretches and CH stretches in lipids and proteins |
Publisher’s Note: MDPI stays neutral with regard to jurisdictional claims in published maps and institutional affiliations. |
© 2022 by the authors. Licensee MDPI, Basel, Switzerland. This article is an open access article distributed under the terms and conditions of the Creative Commons Attribution (CC BY) license (https://creativecommons.org/licenses/by/4.0/).
Share and Cite
Katsara, K.; Psatha, K.; Kenanakis, G.; Aivaliotis, M.; Papadakis, V.M. Subtyping on Live Lymphoma Cell Lines by Raman Spectroscopy. Materials 2022, 15, 546. https://doi.org/10.3390/ma15020546
Katsara K, Psatha K, Kenanakis G, Aivaliotis M, Papadakis VM. Subtyping on Live Lymphoma Cell Lines by Raman Spectroscopy. Materials. 2022; 15(2):546. https://doi.org/10.3390/ma15020546
Chicago/Turabian StyleKatsara, Klytaimnistra, Konstantina Psatha, George Kenanakis, Michalis Aivaliotis, and Vassilis M. Papadakis. 2022. "Subtyping on Live Lymphoma Cell Lines by Raman Spectroscopy" Materials 15, no. 2: 546. https://doi.org/10.3390/ma15020546
APA StyleKatsara, K., Psatha, K., Kenanakis, G., Aivaliotis, M., & Papadakis, V. M. (2022). Subtyping on Live Lymphoma Cell Lines by Raman Spectroscopy. Materials, 15(2), 546. https://doi.org/10.3390/ma15020546