Abstract
A drop calorimetric method was used to measure liquid Ag–Mg–Pb alloys. The partial and integral mixing enthalpies of the investigated alloys were determined at a temperature of 1116 K. The experiments were performed for four separate series starting from binary alloys with a constant xMg/xPb ratio of 1/3, 1, 3 ((Mg0.25Pb0.75)1−xAgx, (Mg0.50Pb0.50)1−xAgx, (Mg0.75Pb0.25)1−xAgx) and xAg/xMg ratio of 1/3 (Ag0.25Mg0.75)1−xPbx. Next, the ternary interaction parameters were determined using the Muggianu model, the thermodynamic properties of binary systems in the form of the Redlich-Kister equations and the values of the mixing enthalpy changes, which were determined in this study. The partial mixing enthalpies of Ag, Mg, and Pb were calculated based on the binary and elaborated ternary interaction parameters for the same intersections in which the measurements were conducted. It was found that the ternary Ag-Mg-Pb liquid solutions are characterized by negative deviations from the ideal solutions, with a maximal value slightly lower than –13 kJ/mol for alloys with the ratio (Mg0.75Pb0.25) and xAg = 0.4166.
1. Introduction
Knowledge of phase equilibria, existing intermetallic compounds, melting temperatures, and invariant reactions is essential for people who design new materials. The above information can be read from the phase diagram or calculated if a suitable thermodynamic model is available. Therefore, careful examination of phase equilibrium systems, starting from binary systems, is extremely important from the point of view of the development of science itself. In recent years, there has been an intensive development of magnesium-based alloys, which, thanks to their properties such as their low density, high specific strength, and good castability [1], have been widely used in many areas of industry. For example, the binary Mg–Pb alloy was proposed as a cooling medium for nuclear fast reactors [2] or as a novel material for solar cells [3]. Moreover, in recent years, due to their ability to interact with hydrogen, these alloys have been studied as materials that safely store hydrogen [4,5]. The addition of silver has a positive effect on the properties of Mg-based alloys [6] since it was found to possess catalytic properties for the dissociation of molecular hydrogen, as well as potential to protect metals from surface oxidation [7]. For these reasons, and also cognitive motivation, in two of our previous works, we investigated the ability of Mg–Ag alloys produced by mechanical milling [8] and classical melting and casting [9] to absorb hydrogen. The addition of Pb to this system is not beneficiary from a density point of view since it rather lowers the gravimetric hydrogen capacity of such alloys. However, lead possesses a significantly higher atomic radius than both Mg and Ag. This means that it may cause a significant lattice expansion when added as an alloying element. Expansion of the lattice may lower the equilibrium pressure of the hydrogen absorption and by that allow easier hydrogenation of the alloy.
A literature review concerning thermodynamic studies of Ag–Mg and Mg–Pb systems was presented in our previous papers [10,11,12]; therefore, only information about thermodynamic studies of the Ag–Pb system will be provided in this paper.
The Ag–Pb phase diagram is a simple eutectic system and has been widely investigated [13,14,15,16,17,18,19]. A detailed review can be found in [16]. The liquidus line has been determined by several techniques, such as thermal analysis, metallography, and diffusion studies [20,21,22,23,24,25]. The mutual solid solubility of Ag and Pb was reported previously [26,27,28,29].
The enthalpy of mixing of Ag–Pb liquid alloys has been measured many times by the calorimetric method and conducted at different temperatures. Kawakami performed measurements at 1323 K [30], Kleppa at 723 K [24], Von Samson-Himmelstjerna at 773 K [31], Ehrlich at 1248 K [32], Kozuka et al. at 1273 K [33], Castanet et al. [34] at 1280 K, Itagaki and Yazawa [35] at 1243 K, and Hultgren and Sommelet at 1250 K [36]. The obtained mixing enthalpy had a positive deviation from ideal solutions. The values obtained by Castanet et al. [34] and Kozuka et al. [33], which were measured at approximately the same temperature, are consistent but differ significantly from the data presented by Itagaki and Yazawa [35]. Hultgren and Sommelet’s data [36] are less endothermic than those measured by Castanet et al. [34]. Kawakami’s data [30] measured at 1323 K differ significantly from the data presented by Von Samson-Himmelstjerna [31] at 773 K. This may suggest that the mixing enthalpy of Ag-Pb alloys is temperature dependent.
Thermodynamic activities in liquid alloys have been determined by many researchers using the emf method [37,38,39,40,41] and vapor pressure measurements [42,43,44].
Since calorimetric measurements of the mixing enthalpy of ternary Ag–Mg–Pb solutions have not yet been carried out, in this study, high-temperature drop calorimetric studies were performed to determine the partial and integral mixing enthalpies of the liquid mentioned above for the ternary alloys. This work initiates research on the thermodynamic properties of Ag–Mg–Pb solutions, and it is the first step of the investigation before modeling the phase equilibria in this ternary system.
2. Materials and Methods
All calorimetric measurements were performed in a high purity argon atmosphere using magnesium oxide (MgO) crucibles. All experimental series were performed with the use of the Setaram MHTC 96 Line Evo calorimeter. The samples were prepared from the high purity metals presented in Table 1, whose shape was similar to a sphere about 3 mm in diameter or a cylinder 3 mm in diameter and 3 to 20 mm high. Before the beginning of each measurement series, the calorimeter was evacuated several times with the use of a vacuum pump and flushed with high purity argon. Before being dropped into the reaction crucible, the samples were mechanically cleaned with a file to remove the possible surface impurities. After stabilizing the temperature and the baseline, the calibration constant was determined. Lead samples were used to determine the calibration constant in experimental series 1–3, while in series 4, silver samples were applied. The measured thermal effect was studied five times during the calibration process. In each measurement series, the following parts can be distinguished: the calibration process, measurement of the mixing enthalpy for a starting binary alloy, and measurement of the mixing enthalpy for ternary alloys. Each of the above-mentioned parts of the measurement may be presented as follows:

Table 1.
Specifications of the applied materials.
(a) The calibration process:
for series 1–3: zPb(s, TD) → zPb(l, TM) or for series 4 xAg(s, TD) → xAg(s, TM);
(b) Measurement of the mixing enthalpy of binary alloys:
Series 1–3: zPb(l, TM) + yMg(s, TD) → MgyPbz(l, TM) or Series 4: xAg(s, TM) + yMg(s, TD) → AgxMgy(l, TM)
(c) Measurement of the mixing enthalpy of ternary alloys:
Series 1–3: MgyPbz(l, TM) + xAg(s, TD) → AgxMgyPbzi(l, TM);
Series 4: AgxMgy(l, TM) + zPb(s, TD) → AgxMgyPbzi(l, TM);
where TD and TM are the drop and measurement temperatures, respectively; “s”, and “l” denote the solid (crystalline) and liquid states, respectively; x, y, z are the number of moles of Ag, Mg, or Pb; MgyPbz(l, TM) or AgxMgy(l, TM) symbolizes the formation of a starting binary Mg–Pb or Ag–Mg alloy and includes the increments of enthalpy of the pure magnesium and the melting enthalpy at the measurement temperature; and AgxMgyPbzi(l, TM) symbolizes the formation of the i-th ternary alloy (i = 1, 2, 3, …) and includes the increments of enthalpy of the pure dropped metal (Ag or Pb) and the melting enthalpy of the dropped metal at the measurement temperature.
The equations listed below were used to calculate the integral enthalpies of mixing (∆mixH) of the Ag–Mg–Pb liquid alloys:
where is a voltage signal given in µV/s that is caused by the heat increment originating from each dropped metal (Ag or Pb); K is the calibration constant; is the molar enthalpy difference of X element (X = silver and lead) between room temperature (TD = 298 K) and the temperature of measurement (TM), which was calculated using [45]; () is the number of moles of silver, magnesium, and lead, respectively; is the enthalpy of dissolution of pure silver and lead; and is the voltage signal given in µV/s that is caused by the heat increment originating from the dropped lead sample, which was used for calibration.
3. Results and Discussion
The calorimetric study of the Ag-Mg-Pb system was conducted at four separate experimental series for a constant ratio of xMg/xPb equal to 1/3, 1, 3 ((Mg0.25Pb0.75)1−xAgx, (Mg0.50Pb0.50)1−xAgx, and (Mg0.75Pb0.25)1−xAgx) and xAg/xMg equal to 1/3 ((Ag0.25Mg0.75)1−xPbx) to verify the obtained results. The compositions of all investigated alloys in these studies are shown in Figure 1.
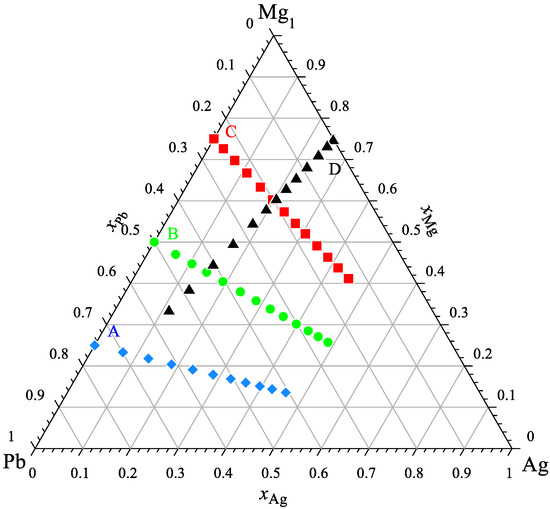
Figure 1.
The studied compositions of alloys from the Ag-Mg-Pb system.
The calorimetric studies were performed at 1116 K for four series with constant ratios of xMg/xPb and xAg/xMg, as mentioned above. The obtained experimental values of the heat effects, the integral molar mixing enthalpy of liquid Ag–Mg–Pb alloys, the mole fraction of elements, the drop enthalpies and other information measured in these studies are listed in Table 2 and Table 3.
Table 2.
The integral mixing enthalpy of (Mg0.25Pb0.75)1−xAgx, (Mg0.50Pb0.50)1−xAgx, and (Mg0.75Pb0.25)1−xAgx. Standard states: pure liquid metals.
Table 3.
The integral mixing enthalpy of (Ag0.25Mg0.75)1−xPbx. Standard states: pure liquid metals.
The calorimetric data of the mixing enthalpy change of Ag–Mg–Pb liquid alloys, presented in Table 2 and Table 3, were used to elaborate the thermodynamic properties (∆mixH) of liquid Ag–Mg–Pb solutions by the Muggianu model [46], with the additional mathematical expression describing the ternary interactions. In such a case, this model can be expressed as follows:
The parameters in Equation (4) are marked as follows: is the mixing enthalpy change of the liquid Ag–Mg–Pb alloys; are the Ag, Mg, and Pb mole fractions, respectively; are the binary interaction parameters in the Redlich–Kister polynomial [47] for the Ag–Mg, Ag–Pb, and Mg–Pb binary systems; and (k = 0, 1, 2, 3) are the ternary interaction parameters. More information on this topic can be found in [48].
Using the obtained calorimetric data of the mixing enthalpy change for the Ag–Mg–Pb liquid solutions, the parameters were calculated by the least square method by utilizing the optimization own computer program (TerGexHm). The calculated standard deviation is equal to 582 J/mol, and the values of all parameters in Equation (4) are shown in Table 4.
Table 4.
The binary and ternary interaction parameters in Equation (4) for the Ag–Mg–Pb liquid alloys.
The determined values of the mixing enthalpy change for the Ag–Mg–Pb liquid solutions and those calculated with the use of Equation (4) and the parameters in Table 4 are presented in Figure 2 and Figure 3, where solid lines are the integral mixing enthalpy data calculated based on Equation (4) and the symbols show the experimental values obtained in this study.
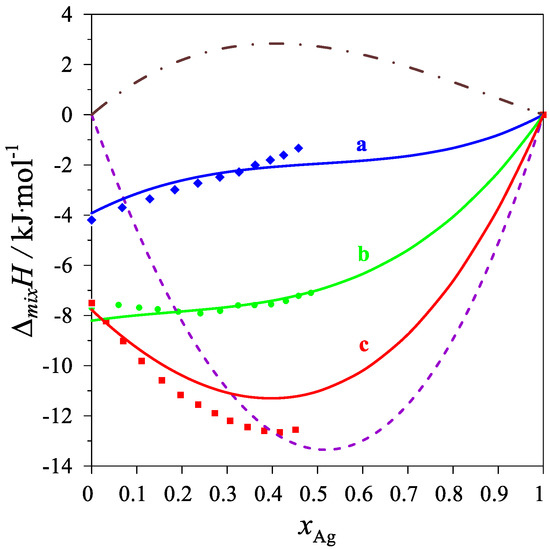
Figure 2.
The integral mixing enthalpy of liquid Ag-Mg-Pb alloys at 1116 K, for the following intersections: (a)—Series A (Mg0.25Pb0.75)1−xAgx—blue line: data calculated with Equation (4), blue diamonds—experimental data; (b)—Series B (Mg0.50Pb0.50)1−xAgx—green line: data calculated with Equation (4), green circles—experimental data; (c)—Series C (Mg0.75Pb0.25)1−xAgx—red line: data calculated with Equation (4), red rectangles—experimental data. The purple dash line is the integral molar mixing enthalpy of Ag–Mg [10] liquid alloys, and the brown dash-dot line is the integral molar mixing enthalpy of Ag–Pb [17] liquid alloys.
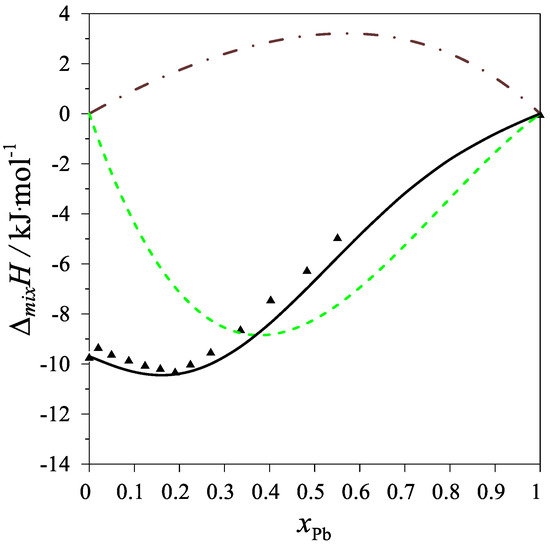
Figure 3.
The integral mixing enthalpy of Ag–Mg–Pb liquid solutions for the intersection (Ag0.25Mg0.75)1−xPbx at 1116 K. Black line: data calculated with Equation (4), black triangles—experimental data. The dashed green line is the integral molar mixing enthalpy of Mg–Pb liquid alloys [12], and the brown dash-dotted line is the integral molar mixing enthalpy of Ag–Pb liquid alloys [17].
By applying the parameters from Table 4 and Equation (4), the integral and partial mixing enthalpies for the Ag–Mg–Pb liquid solutions were calculated and are presented in Table 5.
Table 5.
The partial and integral functions of Ag–Mg–Pb liquid alloys.
As shown in Table 5 and in Figure 4, the partial mixing enthalpies of Ag and Pb have both positive and negative values. For the cross-sections xMg/xPb = 1/3 and 1, the values of the partial silver mixing enthalpy decrease, reaching a minimum of −1.379 kJ/mol for the mole fraction xAg = 0.5 and −6.633 kJ/mol for the mole fraction xAg = 0.1916. On the other hand, the values of the partial mixing enthalpy of silver for the cross-section xMg/xPb = 3 increase with increasing silver content in the alloy. For the cross-section xMg/xAg = 3, the values of the partial mixing enthalpy of lead increase, reaching a maximum of 2.492 J/mol for the mole fraction xPb = 0.5506. The values of the partial mixing enthalpy of Mg in the measured cross-sections resulted in only negative values.
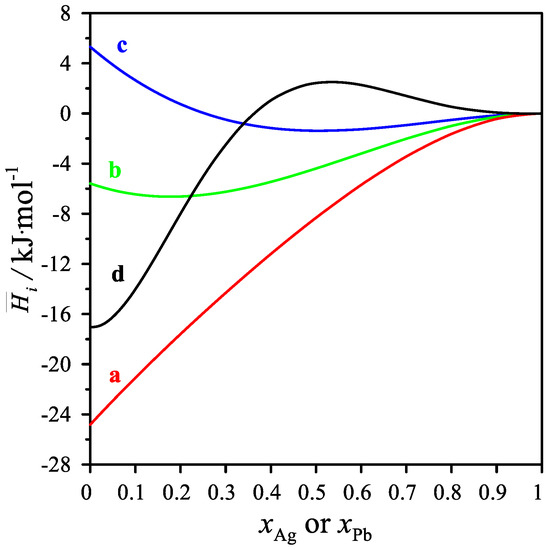
Figure 4.
The partial molar mixing enthalpy Δi for the measured intersections. Δ Ag for (a) xMg/xPb = 1/3, (b) xMg/xPb = 1, (c) xMg/xPb = 3 and Δ Pb for the measured intersections (d) xAg/xMg = 1/3 at 1116 K.
The comparison of the data calculated by the Muggianu model is presented in Figure 5, and the calculation was performed by using only the thermodynamic properties of binary alloys with the thermodynamic properties calculated by using the ternary interaction parameters shown in Table 4.
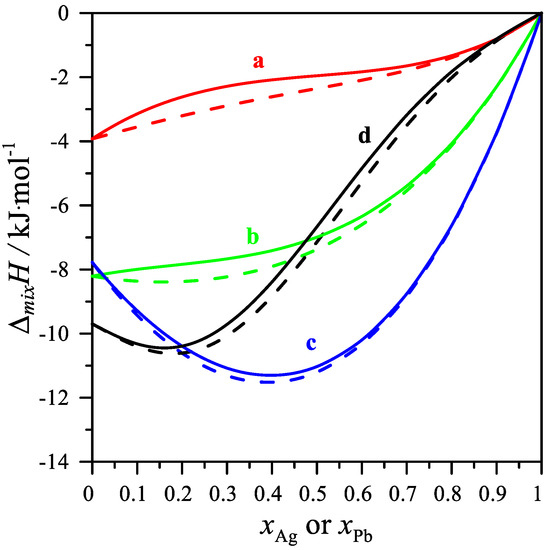
Figure 5.
Comparison of the mixing enthalpy change calculated using the Muggianu model [46] (only binary systems; dashed lines) and using the same model with the ternary interaction parameter Lijk shown in Table 4 (Equation (4); continuous lines); (a) xMg/xPb = 1/3, (b) xMg/xPb = 1, (c) xMg/xPb = 3, (d) xAg/xMg = 1/3.
For the starting alloys in the Mg–Pb system, the differences between the two variants are less than 0.7 kJ/mol. In the case of starting alloys of the Ag–Mg system, the differences between the two variants are less than 0.5 kJ/mol. The differences between the experimental data and those calculated by the Muggianu model with the ternary interaction parameters in the case of the studied liquid solutions are less than 1.5 kJ/mol.
4. Conclusions
This paper presents calorimetric measurements for the partial and integral molar mixing enthalpies of Ag–Mg–Pb liquid alloys. The determined results of the integral molar mixing enthalpies of liquid Ag–Mg–Pb alloys show negative deviations from the ideal solutions over the entire range of concentrations.
Based on our own calorimetric data for binary systems and the values of mixing enthalpy for the liquid Ag–Mg–Pb alloys measured in this study, the thermodynamic description of the ternary system was proposed in the form of the Muggianu model with the ternary interaction parameters that were calculated by the least square method. The counted standard deviation is equal to 0.582 kJ/mol.
Depending on the selected cross-section, the partial mixing enthalpies of Ag and Pb have both positive and negative values. On the other hand, the partial mixing enthalpy of Mg in the measured sections have only negative values.
The values of the mixing enthalpy calculated using the Muggianu model with the elaborated ternary parameters are in good agreement with the values obtained experimentally.
The observed differences between the values calculated by applying the Muggianu model with and without ternary interaction parameters are lower than 1 kJ/mol.
These are the first conducted experimental studies of the Ag–Mg–Pb liquid alloys and could be used in the future to optimize thermodynamic properties and phase diagram calculations.
Author Contributions
Conceptualization, A.D.; methodology, A.D. and W.G. (Władysław Gąsior); software, W.G. (Władysław Gąsior) and W.G. (Wojciech Gierlotka); validation, A.D., W.G. (Władysław Gąsior), W.G. (Wojciech Gierlotka) and M.P.; investigation, A.D.; writing—original draft preparation, A.D., W.G. (Władysław Gąsior), W.G. (Wojciech Gierlotka), M.P.; Writing—Review & Editing, A.D., W.G. (Władysław Gąsior), M.P.; visualization, A.D. All authors have read and agreed to the published version of the manuscript.
Funding
This research was financially supported by the Institute of Metallurgy and Materials Science of the Polish Academy of Sciences within the statutory work “Physicochemical and thermodynamic properties of materials for energy and hydrogen storage” Z-10/2022.
Institutional Review Board Statement
Not applicable.
Informed Consent Statement
Not applicable.
Data Availability Statement
Raw data is available upon request.
Conflicts of Interest
The authors declare no conflict of interest.
References
- Mordike, B.L.; Ebert, T. Magnesium: Properties—Applications—Potential. Mater. Sci. Eng. A 2001, 302, 37. [Google Scholar] [CrossRef]
- Plevachuk, Y. Electrophysical Properties of Mg-Pb Based Liquid Alloys and Their Application; Kainer, K.U., Ed.; Wiley: Hoboken, NJ, USA, 2000. [Google Scholar]
- Singh, P.; Rana, P.J.S.; Mukherejee, R.; Srivastava, P. A step towards environmental benign Mg/Pb based binary metal mixed halide perovskite material. Sol. Energy 2018, 170, 769. [Google Scholar] [CrossRef]
- Ouyang, L.; Liu, F.; Wang, H.; Liu, J.; Yang, X.-S.; Sun, L.; Zhu, M. Magnesium-based hydrogen storage compounds: A review. J. Alloy. Compd. 2020, 832, 154865. [Google Scholar] [CrossRef]
- Baran, A.; Polański, M. Magnesium-based materials for hydrogen storage—A scope review. Materials 2020, 13, 3993. [Google Scholar] [CrossRef] [PubMed]
- Mendis, C.L.; Oh-ishi, K.; Hono, K. Enhanced age hardening in a Mg–2.4 at.% Zn alloy by trace additions of Ag and Ca. Scr. Mater. 2007, 57, 485. [Google Scholar] [CrossRef]
- Adams, B.D.; Chen, A. The role of palladium in a hydrogen economy. Mater. Today 2011, 14, 282. [Google Scholar] [CrossRef]
- Pęska, M.; Smektalska, K.; Dworecka-Wójcik, J.; Terlicka, S.; Gąsior, W.; Gierlotka, W.; Dębski, A.; Polański, M. Hydrogen sorption behavior of mechanically synthesized Mg–Ag alloys. Int. J. Hydrogen Energy 2021, 46, 33152. [Google Scholar] [CrossRef]
- Dębski, A.; Terlicka, S.; Sypien, A.; Gąsior, W.; Pęska, M.; Polański, M. Hydrogen Sorption Behavior of Cast Ag-Mg Alloys. Materials 2022, 15, 270. [Google Scholar] [CrossRef]
- Dębski, A.; Gierlotka, W.; Gąsior, W. Calorimetric studies and thermodynamic calculations of the Ag-Mg system. J. Alloys Compd. 2022, 891, 161937. [Google Scholar] [CrossRef]
- Terlicka, S.; Dębski, A.; Sypien, A.; Gąsior, W.; Budziak, A. Determination of thermophysical and thermodynamic properties, of Ag-Mg alloys. Mater. Today Commun. 2021, 29, 102946. [Google Scholar] [CrossRef]
- Dębski, A.; Gierlotka, W.; Terlicka, S.; Gąsior, W. On the Mg-Pb system. Calorimetric studies and thermodynamic calculations. J. Alloys Compd. 2021, 861, 158396. [Google Scholar] [CrossRef]
- Zimmermann, B. Calculative and Experimental Optimization of Binary and Ternary Ag, Bi, Pb and T1 Systems. Ph.D. Thesis, Universitat Stuttgart, Stuttgart, German, 1976. [Google Scholar]
- Elliott, R.P.; Shunk, F.A. The Ag–Pb (Silver-Lead) System. Bull. Alloy Phase Diagr. 1980, 1, 56. [Google Scholar] [CrossRef]
- Ashtakala, S.; Pelton, A.D.; Bale, C.W. The Ag-Pb (Silver-Lead) System. Bull. Alloy Phase Diagr. 1981, 2, 81. [Google Scholar] [CrossRef]
- Karakaya, I.; Thompson, W.T. The Ag-Pb (Silver-Lead) system. Bull. Alloy Phase Diagr. 1987, 8, 326. [Google Scholar] [CrossRef]
- Gierlotka, W.; Łapsa, J.; Fitzner, K. Thermodynamic Description of the Ag-Pb-Te Ternary System. J. Phase Equlib. Diff. 2010, 31, 509. [Google Scholar] [CrossRef]
- Hassam, S.; Boa, D.; Rogez, B.P.J. Critical assessment and optimization of the Ag–Au–Pb system. Thermochim. Acta 2010, 510, 37. [Google Scholar] [CrossRef]
- Du, J.-Y.; Zemanova, A.; Hutabalian, Y.; Kroupa, A.; Chen, S.-W. Phase diagram of Ag–Pb–Sn system. Calphad 2020, 71, 101997. [Google Scholar] [CrossRef]
- Heycock, C.T.; Neville, F.H. Complete Freezing-point Curves of Binary Alloys, containing Silver or Copper together with another metal. Philos. Trans. R. Soc. Lond. Ser. A 1897, 189, 25. [Google Scholar]
- Petrenko, G.J. On the Alloying of Silver with Lead and Tin. Z. Anorg. Chem. 1907, 53, 200. [Google Scholar]
- Friedrich, K. Lead and Silver. Metallurgie 1906, 3, 396. [Google Scholar]
- Yoldi, F. The Lead-Silver System. An. Soc. Espan. Fis. Quim. 1930, 28, 1055. [Google Scholar]
- Kleppa, O.J. Thermodynamic Properties of Moderately Dilute Liquid Solutions of Copper, Silver and Gold in Thallium, Lead and Bismuth. J. Phys. Chem. 1956, 60, 446. [Google Scholar] [CrossRef]
- Preckshot, G.W.; Hudrlik, R.E. Diffusion in the solid silver-molten lead system. Trans. AIME 1960, 218, 516. [Google Scholar]
- Glazov, V.M.; Akopyan, R.A.; Timoshina, G.G. Determination of the Position of the Retrograde Solidus in the Ag-Pb and Ag-Bi Systems. Izvest. Akad. Nauk SSSR Met. 1975, 1, 162. [Google Scholar]
- Akopyan, R.A.; Mamedova, S.K.; Kerimov, E.R. A Study of the Retrograde Solidus Curves in the Systems Ag−Pb and Ag−Bi. Izv V. U. Z. Tsvetn. Metall. 1983, 6, 83. [Google Scholar]
- Pollock, D.D. Solubility Limits of Some Silver-Rich Binary Solid Solutions near Room Temperature. Trans. AIME 1967, 239, 1768. [Google Scholar]
- Kusunoki, K.; Tsumuraya, K.; Nishikawa, S. Diffusion of Ag in dilute Pb (Ag) alloys. Trans. Jpn. Inst. Met. 1981, 22, 501. [Google Scholar] [CrossRef][Green Version]
- Kawakami, M. A Further Investigation of the Heat of Mixture in Molten Metals. Sci. Rep. Tohoku Imp. Univ. 1930, 19, 521. [Google Scholar]
- von Samson-Himmelstjerna, H.O. Heat capacity and heat of formation of molten alloys. Z. Metallkd. 1936, 28, 197. [Google Scholar]
- Ehrlich, K. The Enthalpy of Mixing of Silver and Magnesium with Some B Metals in Liquid Binary Systems. Inaugural Thesis, Ludwig-Maximilians-Universität, München, Germany, 1965. [Google Scholar]
- Kozuka, Z.; Oishi, T.; Moriyama, J. Measurements of the Thermodynamic Properties of Molten Ag-Pb Alloys by Calorimetry. Nippon Kihz. Gakk. 1968, 32, 136. [Google Scholar]
- Castanet, R.; Claire, Y.; Lafitte, M. Enthalpie de formation à 1 280 k des alliages liquides d’argent avec le germanium, l’étain et le plomb. J. Chim. Phys. 1969, 66, 1276. [Google Scholar] [CrossRef]
- Itagaki, K.; Yazawa, A. Measurements of Heats of Mixing in Liquid Silver Binary Alloys. J. Jpn. Inst. Met. 1968, 32, 1294. [Google Scholar] [CrossRef][Green Version]
- Hultgren, R.; Sommelet, P. The magnitude of some of the errors in determining heats of formation of liquid alloys by drop calorimetry; the silver-lead system. In Proceedings of the First International Conference on Calorimetry and Thermodynamics, Warsaw, Poland, 31 August–4 September 1969; p. 1027. [Google Scholar]
- Hager, J.P.; Wilkomirsky, I.A. Galvanic cell studies using a molten oxide electrolyte. Pt. 1. Thermodynamic properties of the lead-silver system. Trans. AIME 1968, 242, 183. [Google Scholar]
- Terpilowski, J. Thermodynamic Properties of Liquid Metallic Solutions. (I) Ag−Pb System. Arch. Hutnictwa 1957, 2, 289. [Google Scholar]
- Eremenko, V.N. Thermodynamic Activity of Pb in Melted Pb−Ag Alloys. Ukr. Khim. Zh. 1957, 23, 6. [Google Scholar]
- Iwase, M.; Fujimura, K.; Mori, T. Thermodynamic study of liquid lead-silver alloys by means of solid-oxide galvanic cell. Trans. Jpn. Inst. Met. 1978, 19, 377. [Google Scholar] [CrossRef]
- Jacob, K.T.; Jeffes, J.H.E. Activities of oxygen and lead in liquid Pb + Ag + O solutions. J. Chem. Thermodyn. 1971, 3, 433. [Google Scholar] [CrossRef]
- Aldred, A.T.; Pratt, J.N. Thermodynamic properties of liquid silver-lead alloys. With an appendix on the vapour pressure of lead. Trans. Faraday Soc. 1961, 57, 611. [Google Scholar] [CrossRef]
- Khobdabergenov, R.Z.; Nesterov, V.I.; Ivragimov, E.T.; Shendyapin, A.S.; Vasharatyan, E.I.; Kalinin, E.I. The Vapour Pressure of Lead in the Silver-Lead System. Trans. Inst. Met. i Obogashch. Akad. Nauk Kaz. SSR 1967, 26, 37. [Google Scholar]
- Granovskaya, A.P.; Lyubimov, A.P. Measurement of Small Vapor Pressures at High Temperatures (IV) Partial Vapor Pressures of Components of the Ag− Pb System. Z. Fiz. Khim. 1953, 27, 1437. [Google Scholar]
- Scientific Group Thermodata Europe. Unary SGTE Database 5.0. Available online: https://www.sgte.net/en/free-pure-substance-database (accessed on 19 September 2022).
- Muggianu, Y.M.; Gambino, M.; Bros, J.-P. Enthalpies de formation des alliages liquides bismuth-etain-gallium a 723 k. choix d’une representation analytique des grandeurs d’exces integrales e t partielles de melange. J. Chim. Phys. 1975, 72, 83. [Google Scholar] [CrossRef]
- Redlich, O.; Kister, A.T. Algebraic representation of thermodynamic properties and the classification of solutions. Ind. Eng. Chem. 1948, 40, 345. [Google Scholar] [CrossRef]
- Gąsior, W.; Dębski, A.; Zabrocki, M. Thermodynamic description of the Ge-In-Li liquid alloys. J. Mol. Liq. 2018, 260, 415. [Google Scholar] [CrossRef]


Publisher’s Note: MDPI stays neutral with regard to jurisdictional claims in published maps and institutional affiliations. |
© 2022 by the authors. Licensee MDPI, Basel, Switzerland. This article is an open access article distributed under the terms and conditions of the Creative Commons Attribution (CC BY) license (https://creativecommons.org/licenses/by/4.0/).