Abstract
The use of non-thermal plasma technology in producing green fuels is a much-appreciated environmentally friendly approach. In this study, an Al2O3-supported CrxZnS semiconductor catalyst was tested for hydrogen evolution from hydrogen sulfide (H2S) gas by using a single-layered dielectric barrier discharge (DBD) system. The Al2O3-supported CrxZnS catalyst (x = 0.20, 0.25, and 0.30) was produced by using a co-impregnation method and characterized for its structural and photocatalytic characteristics. The discharge column of the DBD system was filled with this catalyst and fed with hydrogen sulfide and argon gas. The DBD plasma was sustained with a fixed AC source of 10 kV where plasma produced species and UV radiations activated the catalyst to break H2S molecules under ambient conditions. The catalyst (hexagonal-cubic-sphalerite structure) showed an inverse relationship between the band gap and the dopant concentration. The hydrogen evolution decreased with an increase in dopant concentration in the nanocomposite. The Cr0.20ZnS catalyst showed excellent photocatalytic activity under the DBD exposure by delivering 100% conversion efficiency of H2S into hydrogen. The conversion decreased to 96% and 90% in case of Cr0.25ZnS and Cr0.30ZnS, respectively.
1. Introduction
Hydrogen sulfide (H2S) is a poisonous gas and its production is harmful to both human health and equipment [1]. Hydrogen can be produced from various raw materials like coal, water, natural gas, hydrogen sulphide, biomass and boron hydrides using various methods (electrolytic, thermal and photolytic) [2,3]. Currently, the yearly global production of hydrogen is 50 million tons and more than 95% of it is obtained from fossil fuels. The CO2 released by fossil fuels contributes to environmental pollution [3]. Hydrogen can also be produced by cracking hydrogen sulfide (H2S) over a suitable catalyst. Hydrogen gas is produced through different methods [4,5]. A large amount of H2 gas is used in industrial applications, such as the production of chemicals, oils, fats, fuels, and metal reforming [6]. Currently, the Claus method is considered to be an important hydrogen-sulfide-removal technology. This technique is generally not preferred owing to its high working cost and related environmental issues. In the Claus method, hydrogen accumulating in hydrogen sulfide cannot be regained [7]. Various approaches have been proposed for the decomposition of H2S to produce hydrogen (H2). These methods include the thermo-chemical method, catalytic decomposition, thermal-diffusion photochemical, electrochemical, and plasma [7,8]. In comparative economic analysis, the thermal decomposition and non-thermal plasma (NTP) methods give better results than other methods due to their lower energy cost. At very high temperatures, the decomposition of H2S is very low due to the limitation of the thermodynamic equilibrium. The conventional catalysts do not play a better role in converting H2S in thermal catalytic decomposition because H2S shows high catalytic reactivity with metal species at elevated temperatures [9]. The NTP technique has been suggested as a potential alternative for the direct decomposition of H2S into S and H2, particularly due to the accomplishment of high-electron energies within a short time. In NTP, various methods have been used to breakdown H2S. Such methods include corona, dielectric barrier discharge plasma, microwave, rotating glow, radio frequency discharge, and gliding arc discharge.
A review of the literature shows that many catalyst-hybrid systems have been investigated for the decomposition of H2S in DBD plasma with Al2O3. In addition to Al2O3-supported Zn0.4Cd0.6S, ZnS and CdS have also been used for hydrogen production. The ZnS and CdS showed H2S conversion corresponding to 90.9% and 97.9%. On the other hand, Zn0.4Cd0.6S showed 100% catalytic activity for hydrogen production. However, it is a time-consuming catalyst and took 100 h to complete the process. Some other catalysts were also used with Al2O3 support to produce H2, such as ZnxCd1-xS, MoS2/Al2O3, LaxMnO3, and Mn2O3. The catalytic performance of these catalysts was checked within 50 to 100 h with 100%, 99%, 52%, and 100% H2S conversion, respectively [10,11]. A similar activity of H2 production was also observed when Zhao et al. [10] used the Al2O3-supported CrxZnS semiconductor. They used different molar ratios of Cr/Zn (x = 0.10, 0.15, 0.20 and 0.25) in their investigations. These molar ratios resulted in 81.8%, 87.4%, 100% and 89.7% conversion of H2S, respectively [12,13,14].
The Cr-doped ZnS exhibits high-catalytic activity compared to transition metal-doped ZnS. Barnhart et al. [13] reported that Cr is the 21st most common element in the Earth’s crust, with a concentration of 100 ppm. Poornaprakash et al. [14] explained that chromium is an important metal that has an abundant shell structure. Moreover, due to the closed ionic radius of Cr3+ (0.63 Å) and Zn2+ (0.74 Å), it is easy for Cr3+ to substitute Zn2+ and penetrate into the host lattice of ZnS. On the other hand, ZnS also acts as a host material with its bulky band gap (3.67 eV). Due to its low toxicity and low cost, it produces different nanostructures in various research applications. In this research, H2 gas was produced from Cr-doped ZnS by non-thermal plasma treatment at atmospheric pressure. This method consumed a very small amount of energy at low temperatures when a catalyst was placed in the quartz discharge tube. The catalyst (CrxZnS) was prepared by the co-impregnation/wet impregnation method with different molar ratios of Cr/Zn (x = 0.20, 0.25, and 0.30). The advantage of this method is that a layer of active matter can easily be prepared on the catalyst surface. Different characterization techniques such as X-ray diffraction (XRD), Ultraviolet-visible (UV-Vis) spectroscopy, Fourier transform infrared spectroscopy (FTIR) and Scanning transmission electron microscopy (STEM) was used to analyze the catalysts. These analyses gave information about the structure, crystal planes, band gap, and light absorbance. The previously reported methods were time-consuming and energy-intensive compared to our work. This study produced reasonably good results in relatively shorter periods. The Cr0.20ZnS showed 100% production of H2 within 15 h of the process.
2. Experimental Part
2.1. Chemicals
All the chemicals, including zinc sulfide (ZnS), gamma-aluminum oxide (γ-Al2O3), zinc nitrate Zn(NO3)3, and chromium nitrate Cr(NO3)3 were supplied by Merck & Co., Inc. (Rahway, NJ, USA).
2.2. Preparation of Photocatalyst
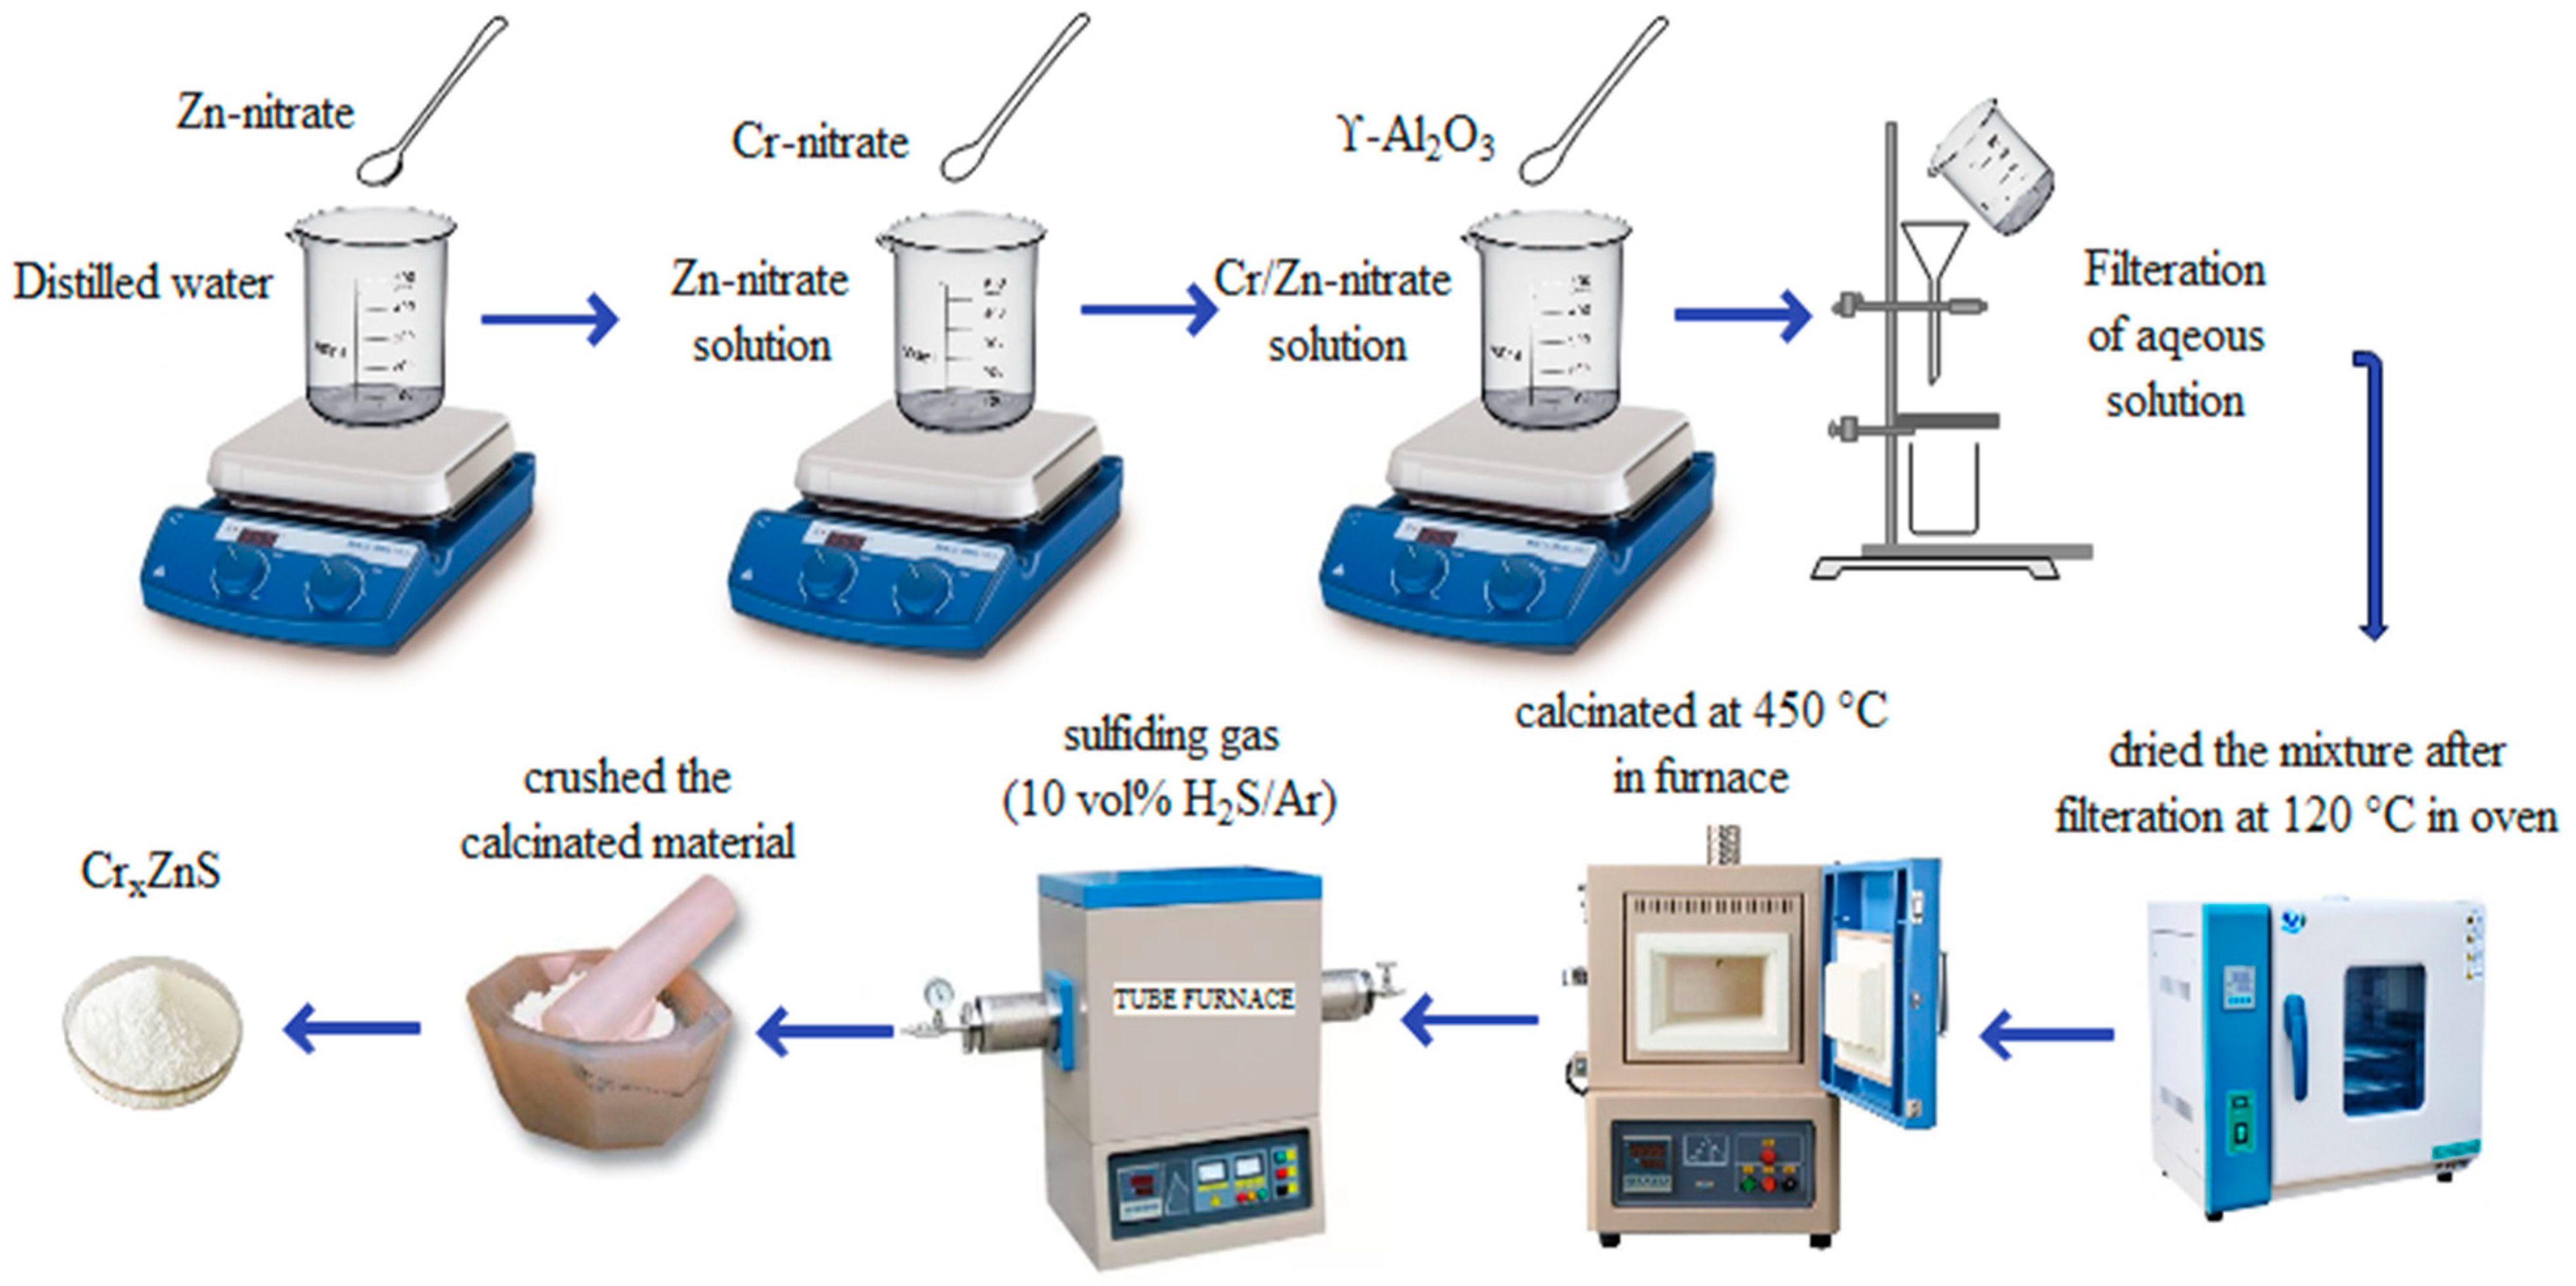
The procedure of synthesis of photocatalyst is illustrated in Figure 1. Using the illustrated procedure, a series of Cr-doped ZnS with Al2O3 support was prepared with different ratios of chromium (Cr). A wet-impregnation method was adopted to prepare the catalyst samples. In this method, the ZnS amount was taken as 15 g, which is 10 wt% of γ-Al2O3. An aqueous solution was prepared by adding 5 g of a Zn-nitrate solution to 15 mL of distilled water. The Cr-nitrate and Zn-nitrate were mixed with different molar ratios (0.20, 0.25, and 0.30) by comparing the previous research. The prepared solution and γ-Al2O3 were mixed with a gentle shake. The mixture was filtered by a filtration process and then dried at 120 °C for 12 h in the oven. The calcination of the material was performed in the furnace for 5 h. A fine powder was formed after crushing the calcinated material. The sulfide catalysts were formed when oxide precursors were sulfidated in the presence of sulfiding gas. Eventually, CrxZnS catalysts (x= 0.20, 0.25, and 0.30) was prepared.
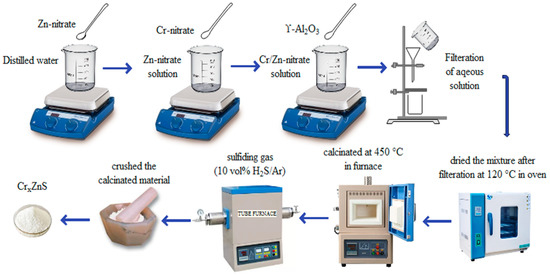
Figure 1.
Illustration of the catalyst preparation procedure.
2.3. DBD Plasma-Assisted Hydrogen Evolution
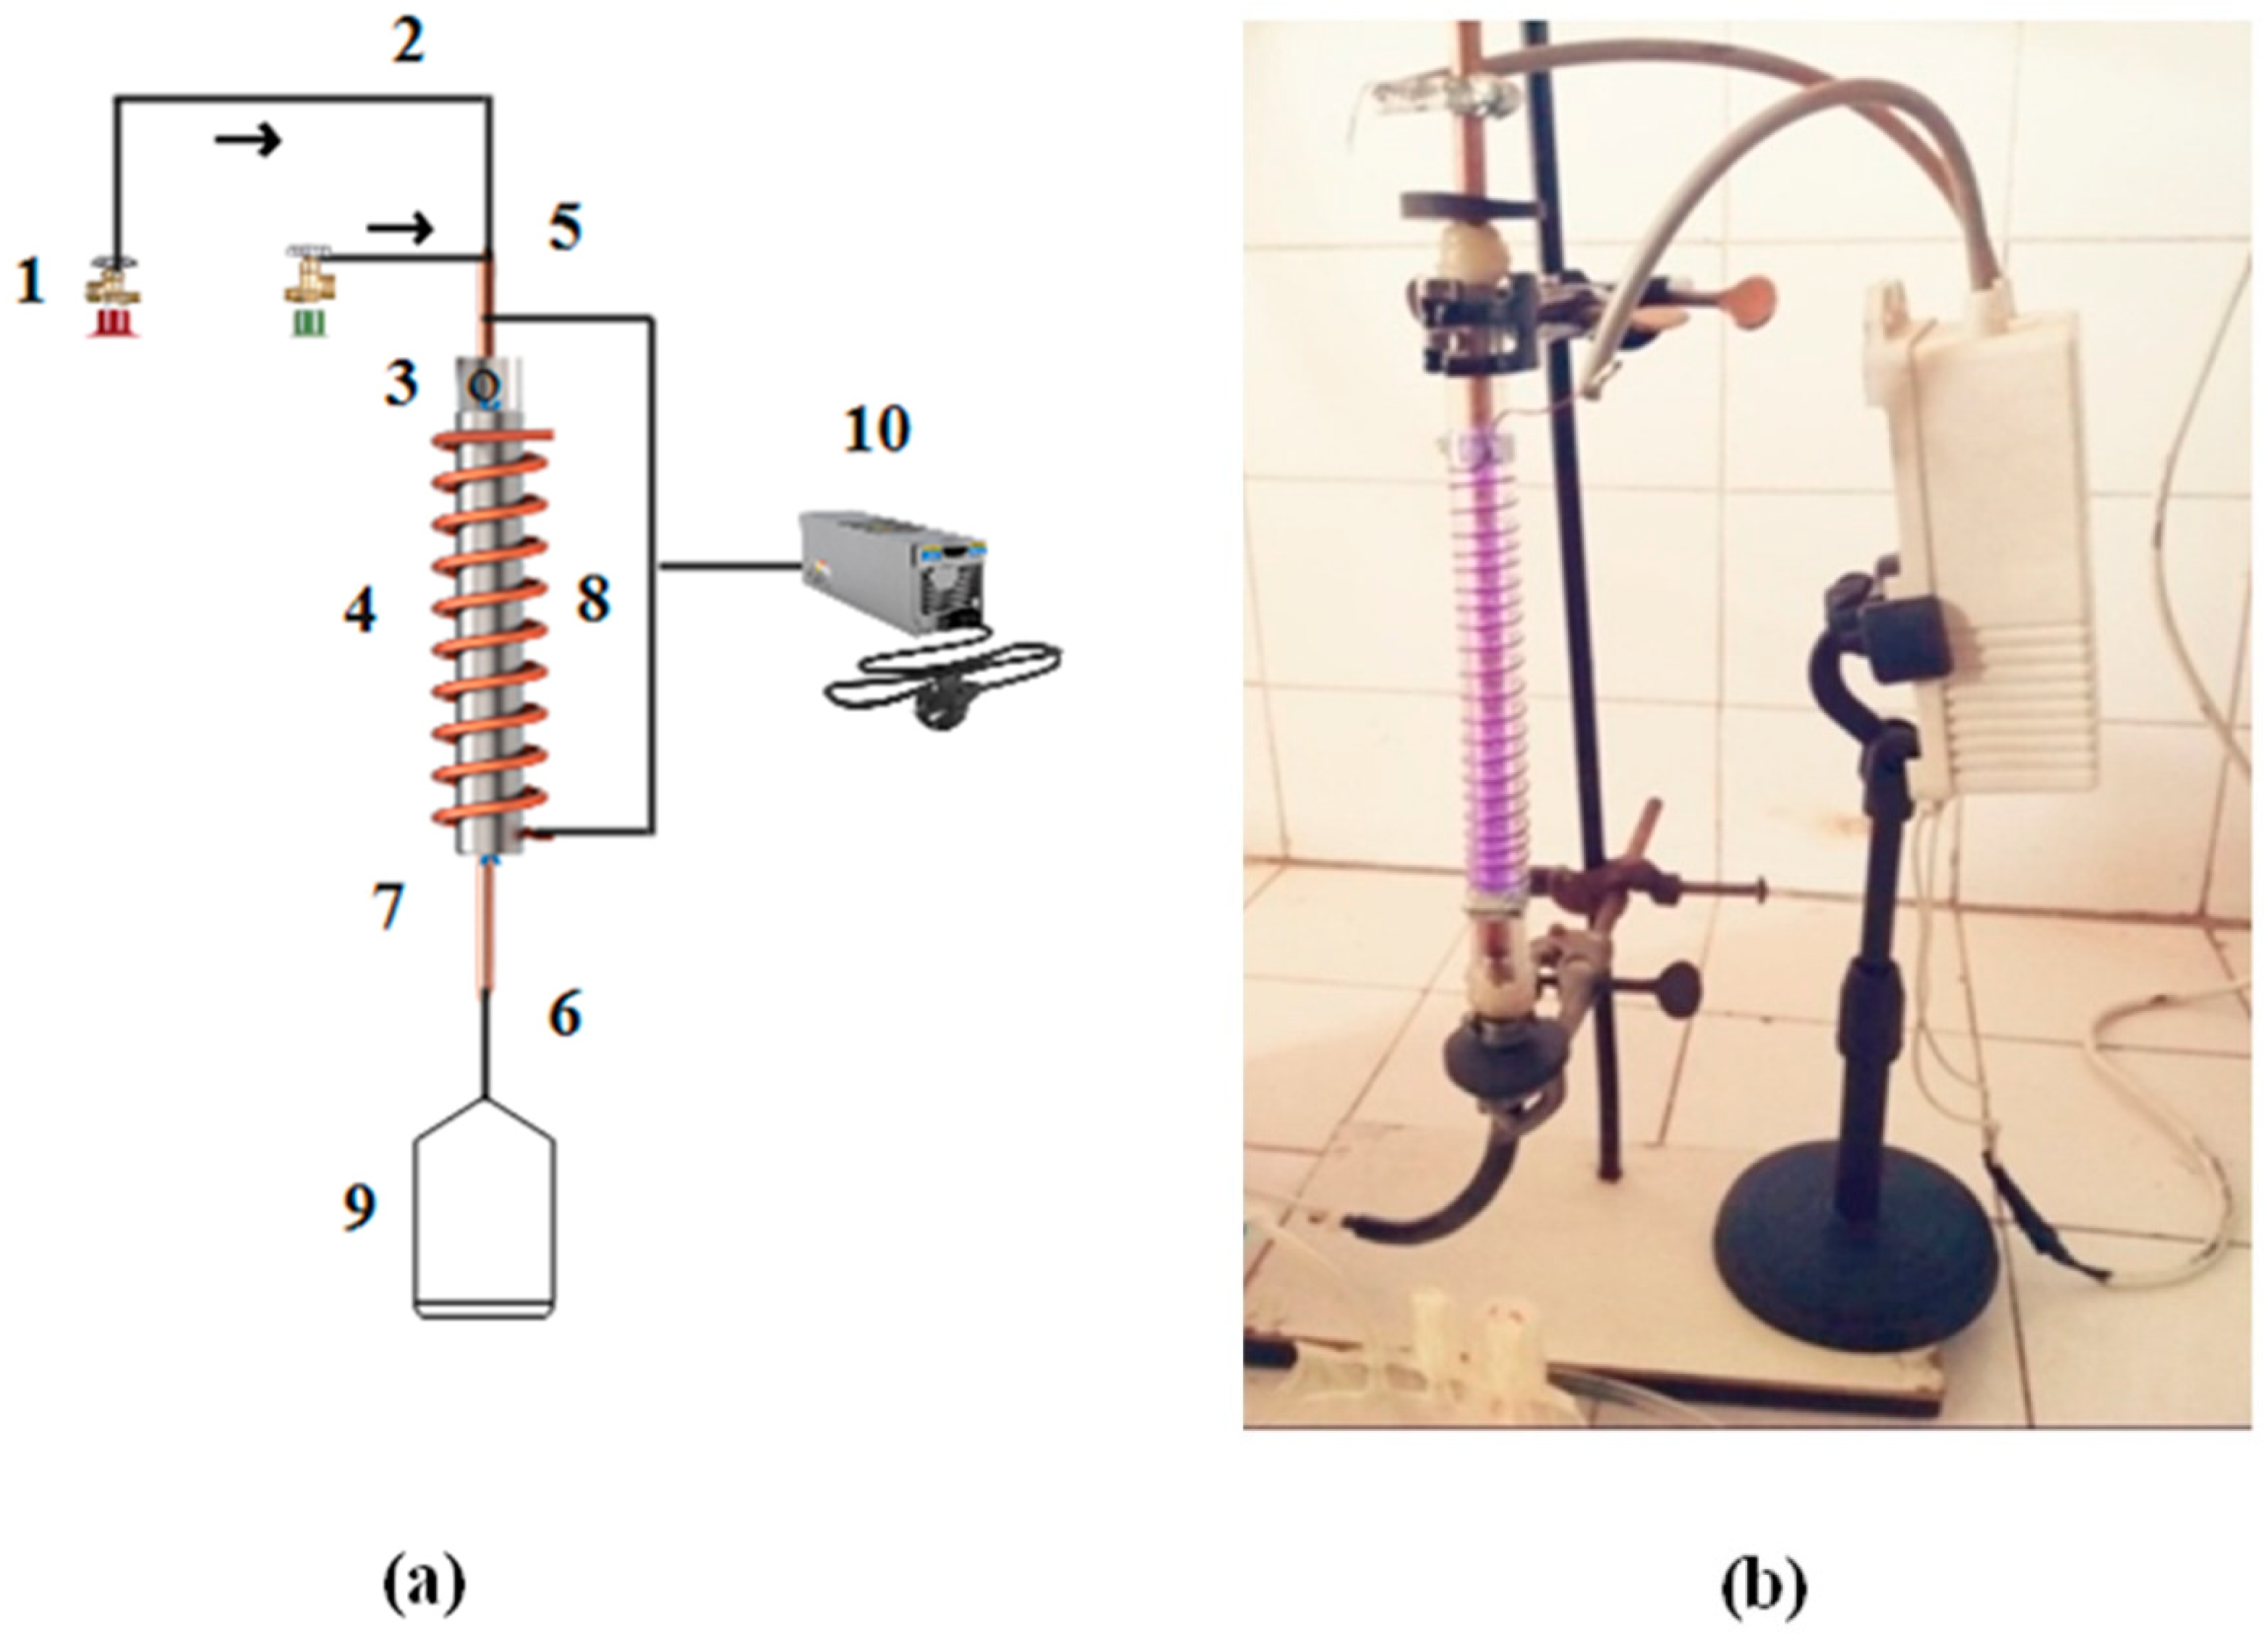
The schematic and photographic views of the DBD setup, used for the production of hydrogen by cracking H2S molecules over the composite catalyst, are given in Figure 2. This laboratory-built system consists of a 30 cm DBD vertical column with an active plasma column length of 23 cm. A quartz tube with a 4 mm wall thickness and a 12 mm internal diameter was used as a DBD column. A copper rod of 8 mm diameter was passed through the tube to work as one of the two electrodes. The tube was wrapped with a copper wire to work as an electrode for uniform radial and spatial distribution of the applied power and plasma. The upper end of the tube was used as a gas inlet and the lower end was connected with the gas analyzer. The discharge column of the DBD system was filled with this catalyst and fed with hydrogen-sulfide and argon gas.
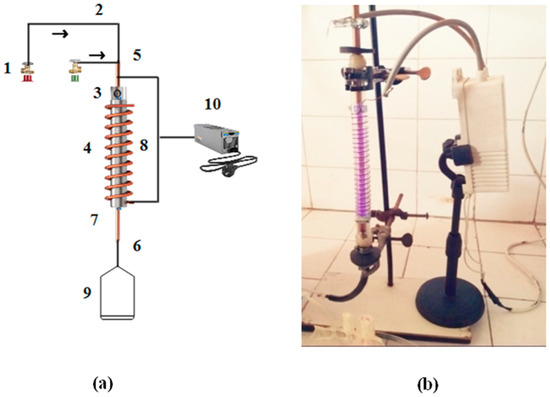
Figure 2.
(a) Schematic of DBD plasma system. (1) Gas cylinder, (2) Gas supply, (3) Hole in rod, (4) Quartz tube, (5) Inlet, (6) Outlet, (7) Inner electrode, (8) Copper coil, (9) Gas sampling bag, and (10) AC power supply. The arrows indicate the direction of the gas flow (H2S and Ar). (b) Photographic view of single-layered DBD plasma system for H2S decomposition.
The DBD plasma was sustained with a fixed AC source of 10 kV where plasma-produced species and UV radiations were used to activate the catalyst to break the H2S molecules under ambient conditions. The Al2O3-supported CrxZnS semiconductor catalyst was tested for hydrogen evolution from H2S gas using this single-layered DBD system [15]. The discharge volume of the dielectric-barrier-discharge reactor was 22 mL [16]. One end of the battery was attached to the wire and the other to the rod. About 10 g of the CrxZnS catalyst (x = 0.20, 0.25, and 0.30) was loaded in the discharge column. At the same time, the gas (Ar + H2S) was passed through the loaded column. The gas product of the reaction in the discharge column was analyzed. The relationship between the H2S (XHydrogen sulfide) and H2 yield (XHydrogen) is shown as follows:
where A is the value of the H2 peak area of effluence. Ao has represented the hydrogen peak area at 100% hydrogen sulfide conversion. The area of the represents the energy lost during a single voltage cycle in the discharge. The total input energy used in the plasma during the process was calculated by the specific input energy (SIE) as:
where V is the flowrate of gas (L/s) and P is the discharge power (W). The energy utilization for the H2 generation (E, eV) was calculated from the specific input energy as:
3. Results and Discussion
3.1. FTIR Analysis of Catalyst
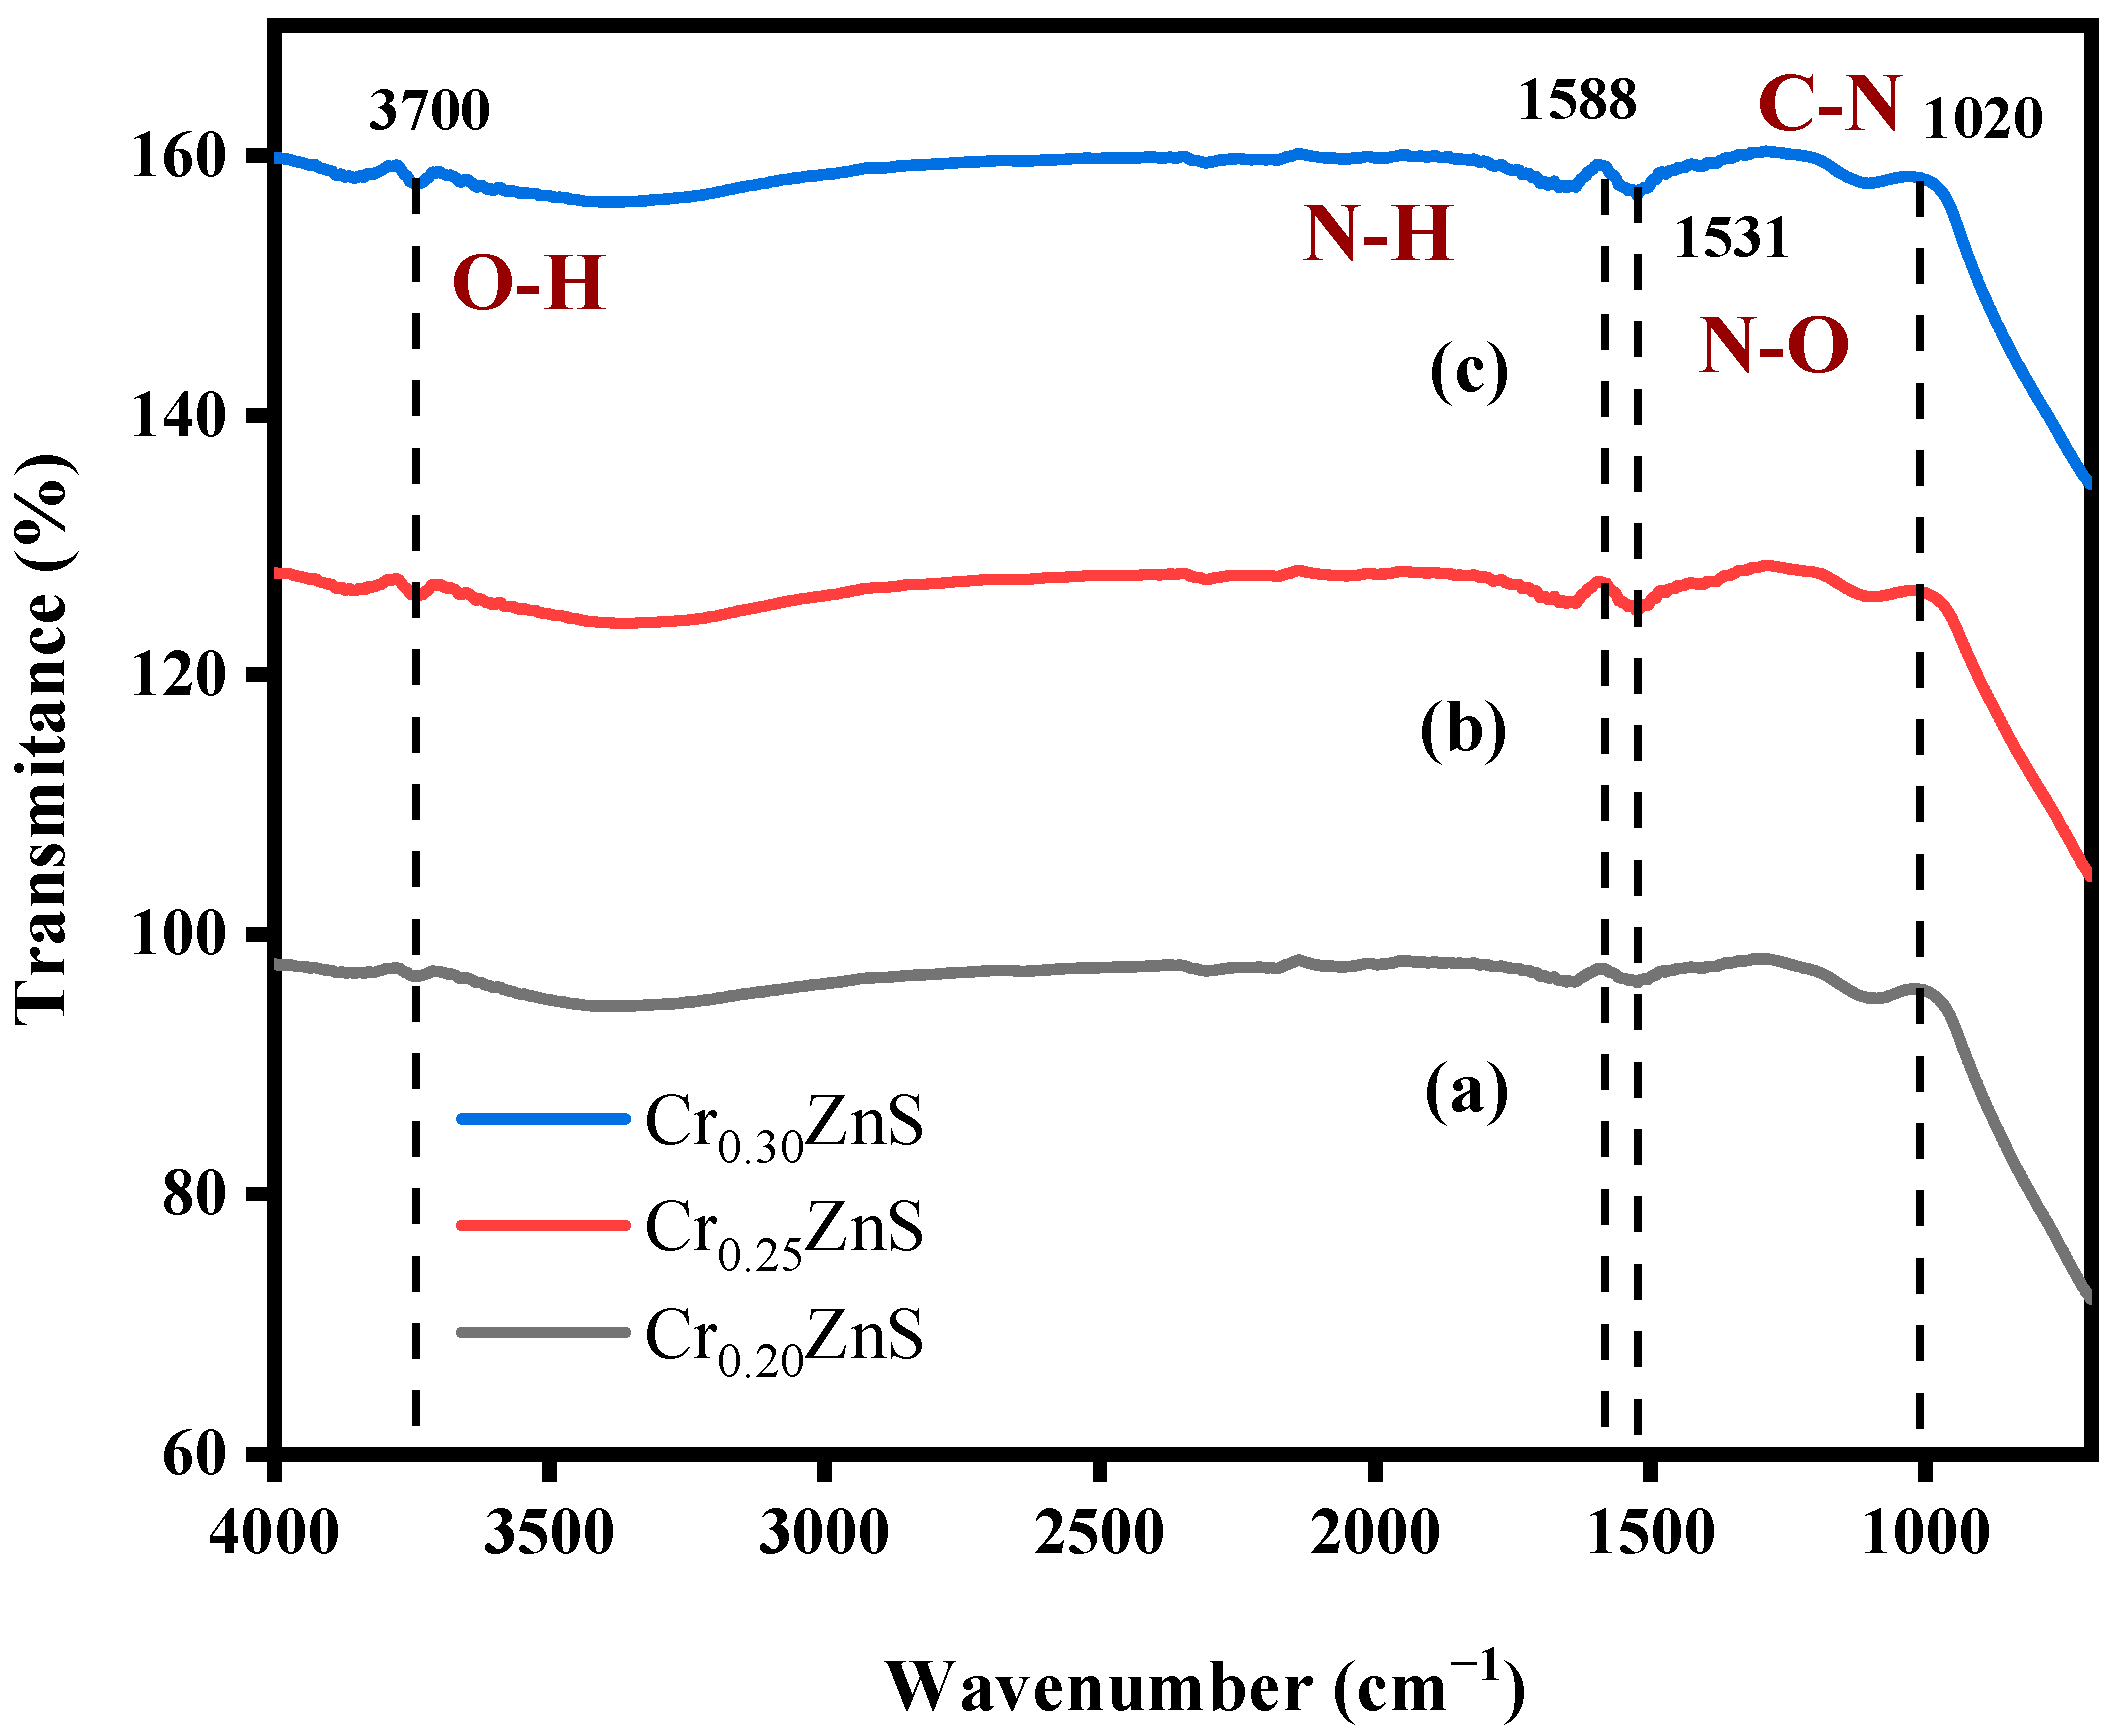
With the Fourier transform infrared (FTIR) analysis, the absorbance of the species in the crystal surface and the nanoparticle formation of ZnS were checked. It is reported that this analysis also gives information about the chemical bonding of the chemical [17]. The FTIR absorbance spectra of CrxZnS with different molar ratios are shown in Figure 3. As shown in Table 1, FTIR analysis showed the same peaks for CrxZnS samples with different ratios (x = 0.20, 0.25, and 0.30) within the range of 500–4000 cm−1. The FTIR peaks were located around 3700 cm−1, 1588 cm−1, 1531 cm−1, and 1020 cm−1. All the peaks exist in the group frequency region (GFR) except 1020 cm−1 because its range was lower than the other three peaks, so it was observed in the fingerprint region (FPR) [18]. The peak at 3700 cm−1 was due to O―H stretching vibration. This peak shows an alcohol group of compounds with intermolecular forces based on their structure [19]. The peaks at 1588 cm−1 and 1020 cm−1 exhibited the same amines groups with no intermolecular force at medium peaks. Both peaks have different vibrations, i.e., 1588 cm−1 represents the N―H bending due to GFR and 1020 cm−1 represents the C―N stretching vibration in FPR. There is a strong peak appearance at 1531 cm−1 caused by N―O stretching. It exists in a nitro-compound group with no bonding forces.
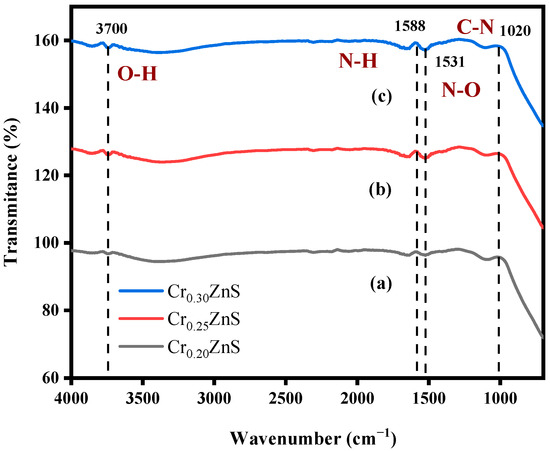
Figure 3.
FTIR spectra of (a) Cr0.20ZnS, (b) Cr0.25ZnS, and (c) Cr0.30ZnS catalyst samples.

Table 1.
FTIR peaks and corresponding groups of the CrxZnS catalyst.
3.2. UV-Visible Analysis
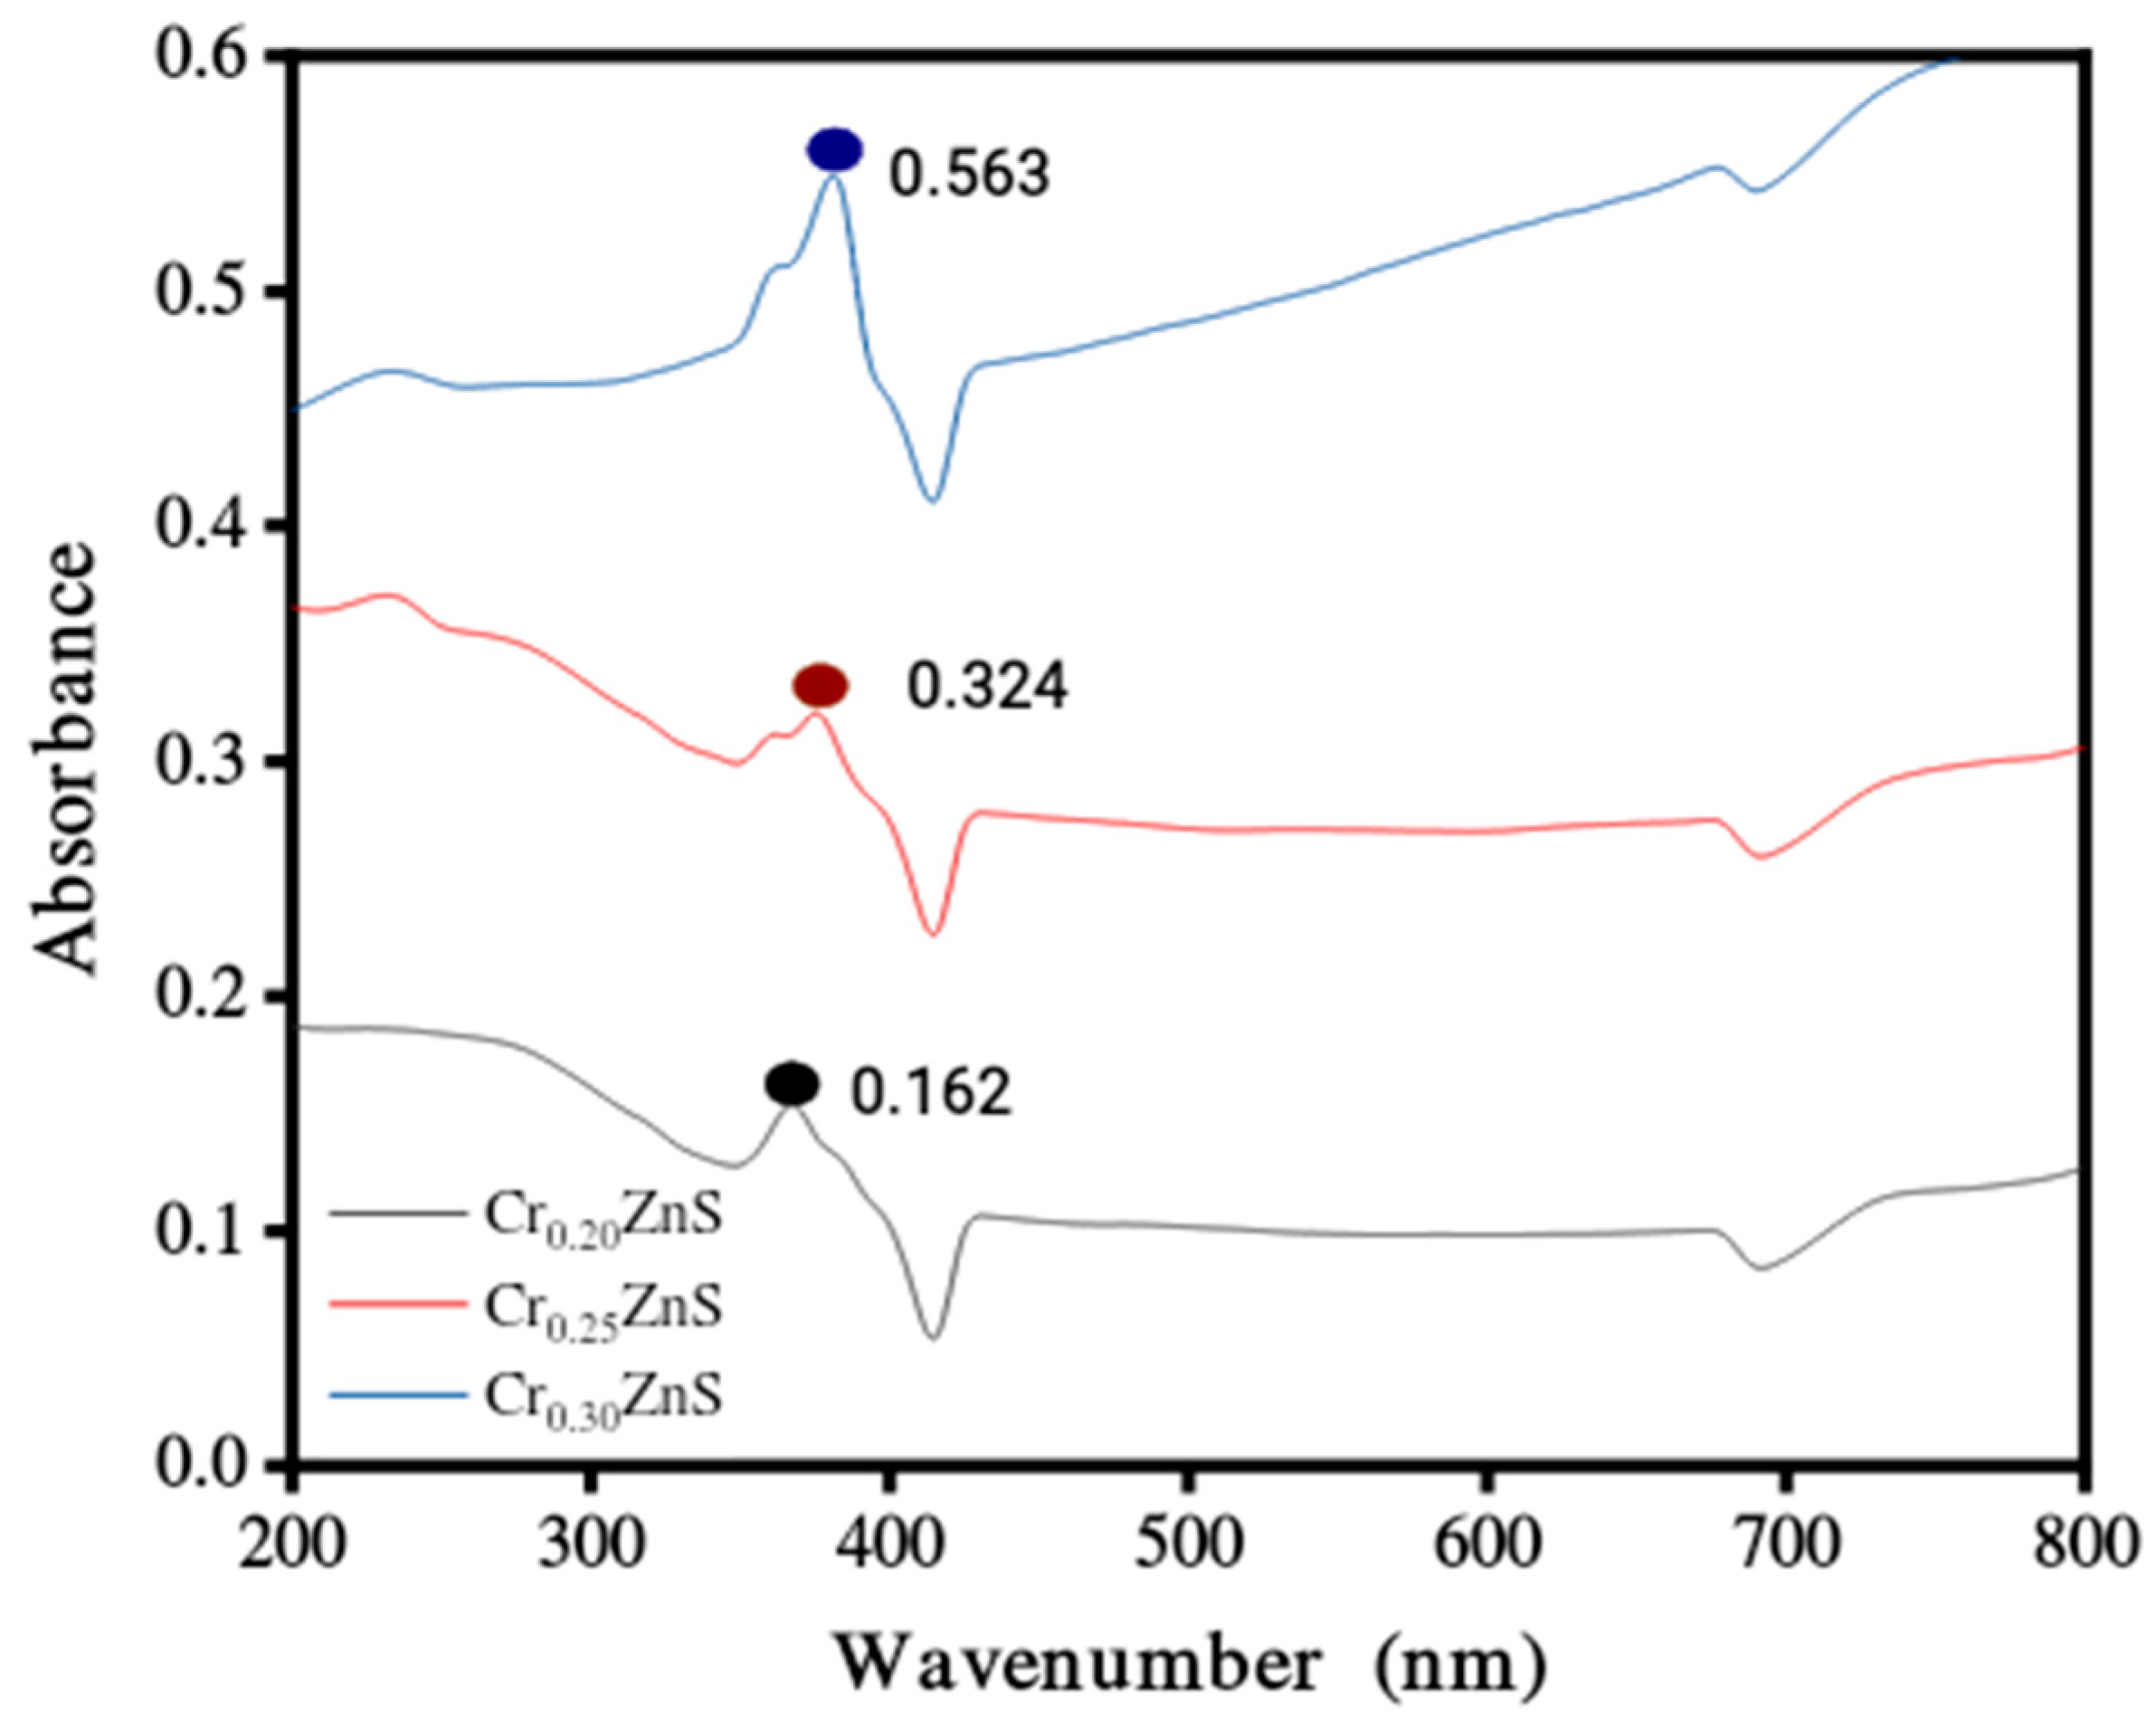
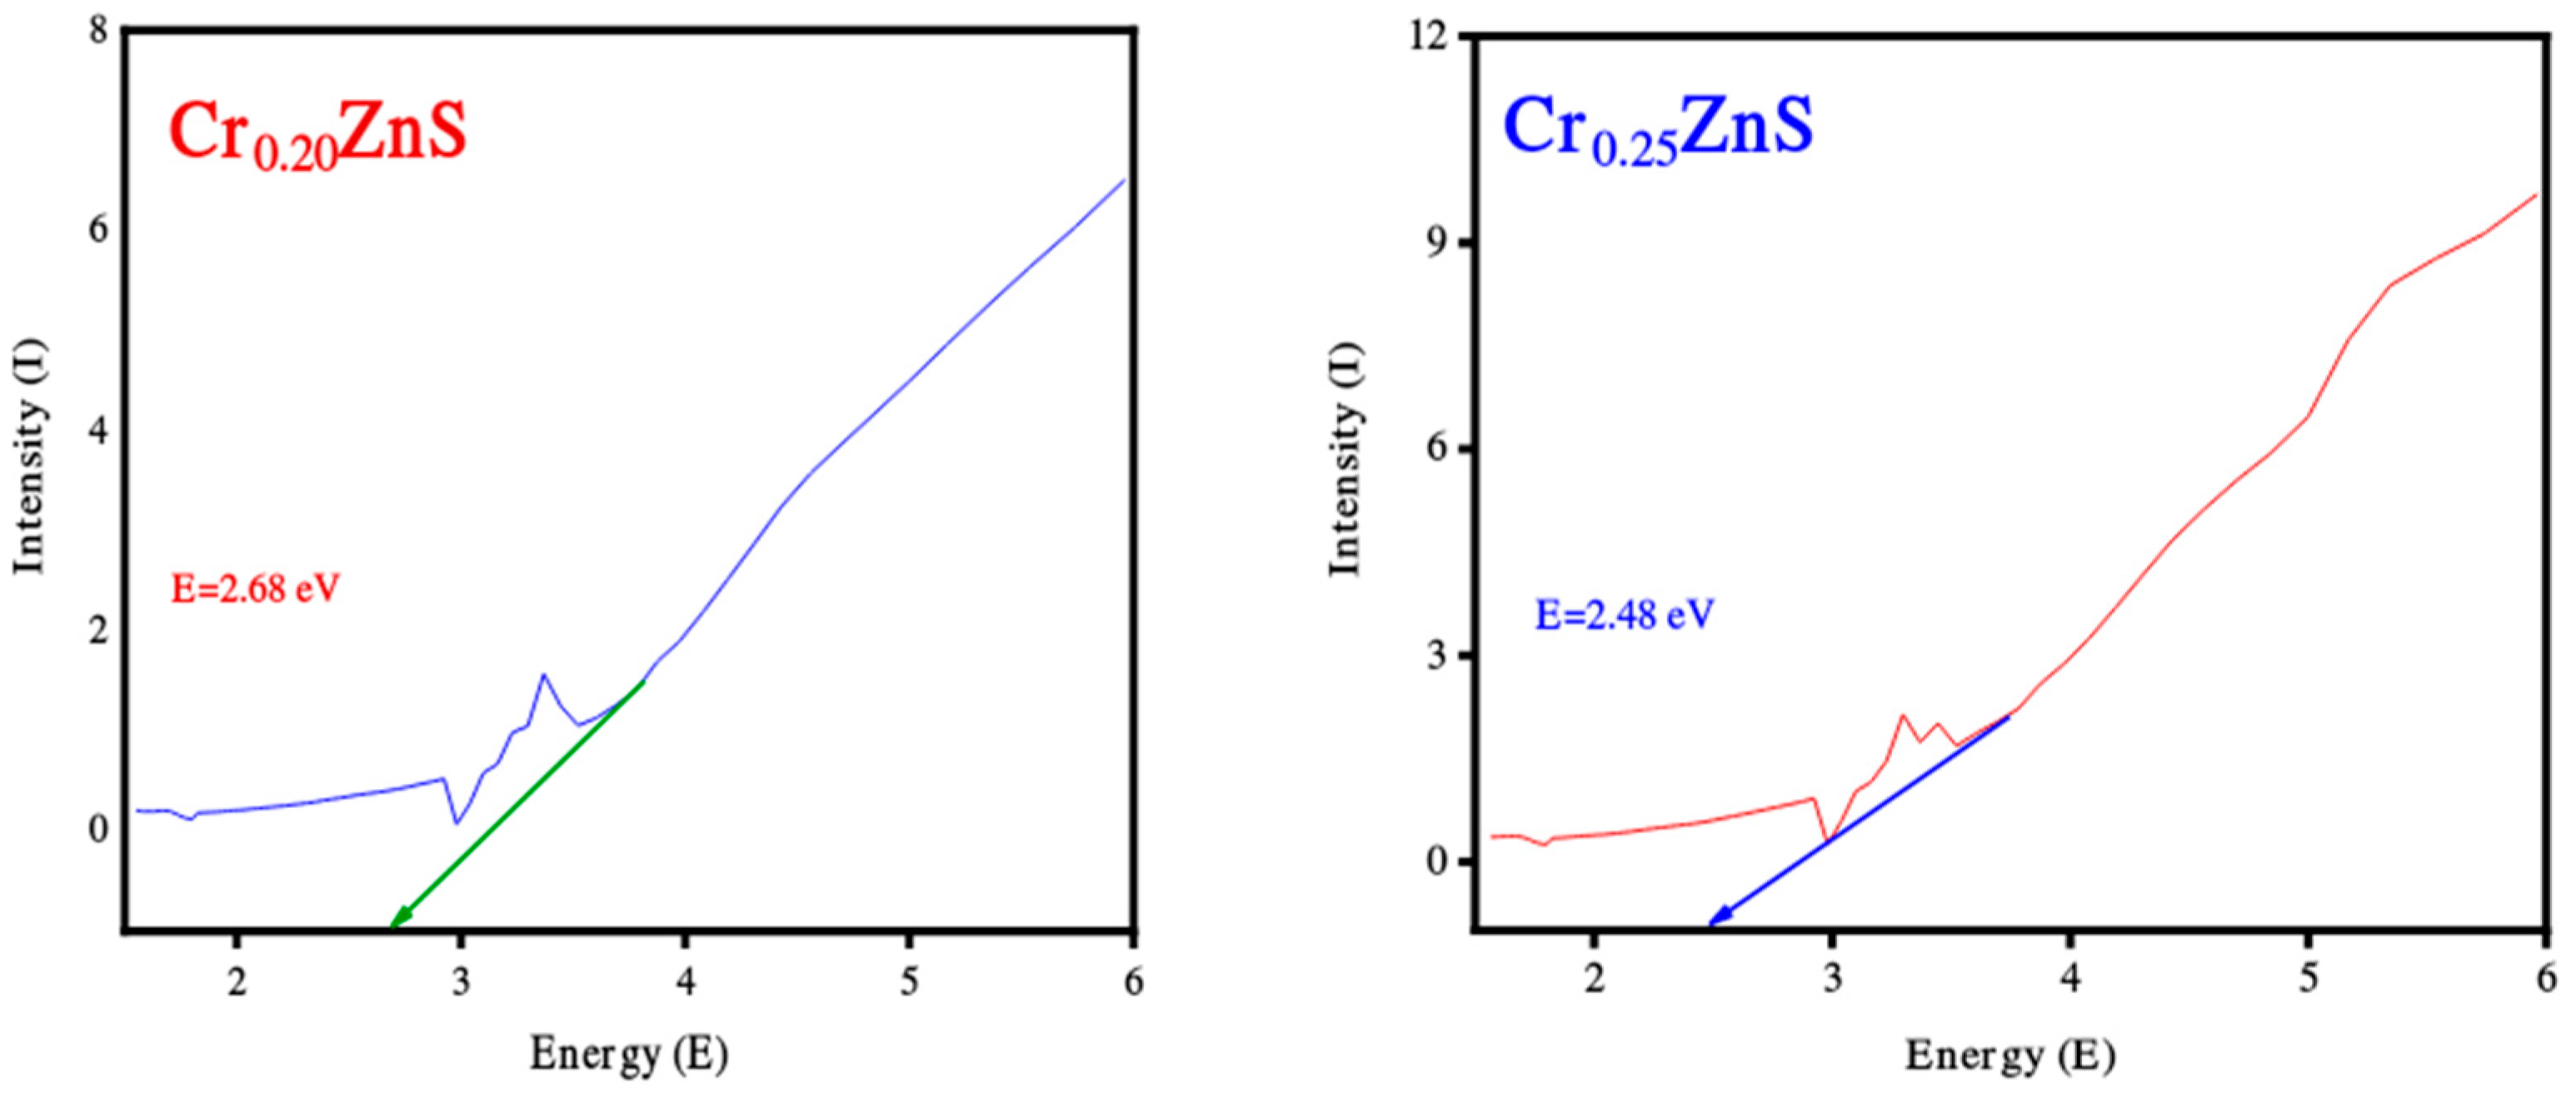
The absorption spectra of catalysts CrxZnS (x = 0.20, 0.25, and 0.30) were examined by UV-Vis analysis within the wavelength range of 200 nm to 800 nm and obtained results are shown in Figure 4. The absorption edges at 367 nm, 376 nm, and 379 nm correspond to Cr0.20ZnS, Cr0.25ZnS, and Cr0.30ZnS respectively observed along the x-axis [20]. In Figure 5, the Cr0.30 ZnS catalyst showed a superior shift in absorption edge (red-shift) towards the visible light region in contrast to other samples, showing a maximum absorption upto 379 nm [21,22]. Cr0.20ZnS, Cr0.25ZnS and Cr0.30ZnS catalysts represented the absorbance values of 0.162 nm, 0.324 nm and 0.563 nm, respectively. Bodke et al. [14] reported that the concentration of doped Cr3+ had a pronounced effect on the optical properties of the ZnS catalyst and witnessed a significant red-shift in the absorption of Cr-doped ZnS.
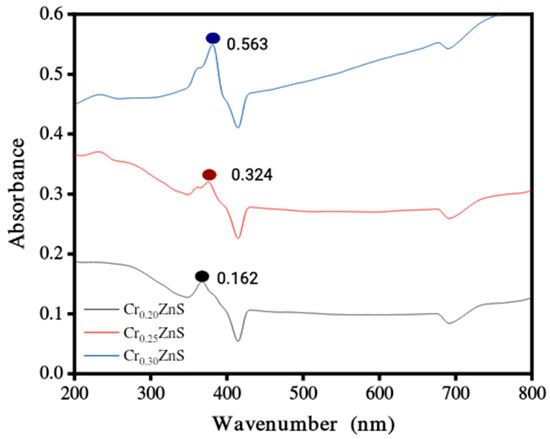
Figure 4.
UV-Vis absorbance spectra of CrxZnS (x = 0.20, 0.25, and 0.30) catalyst.
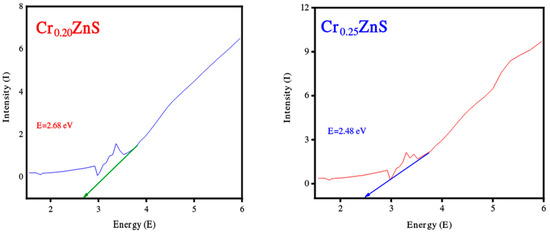
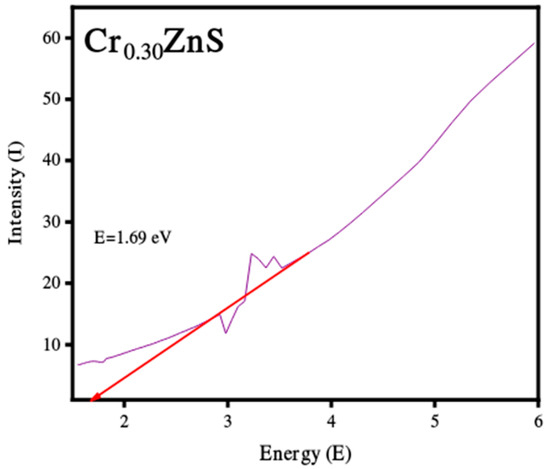
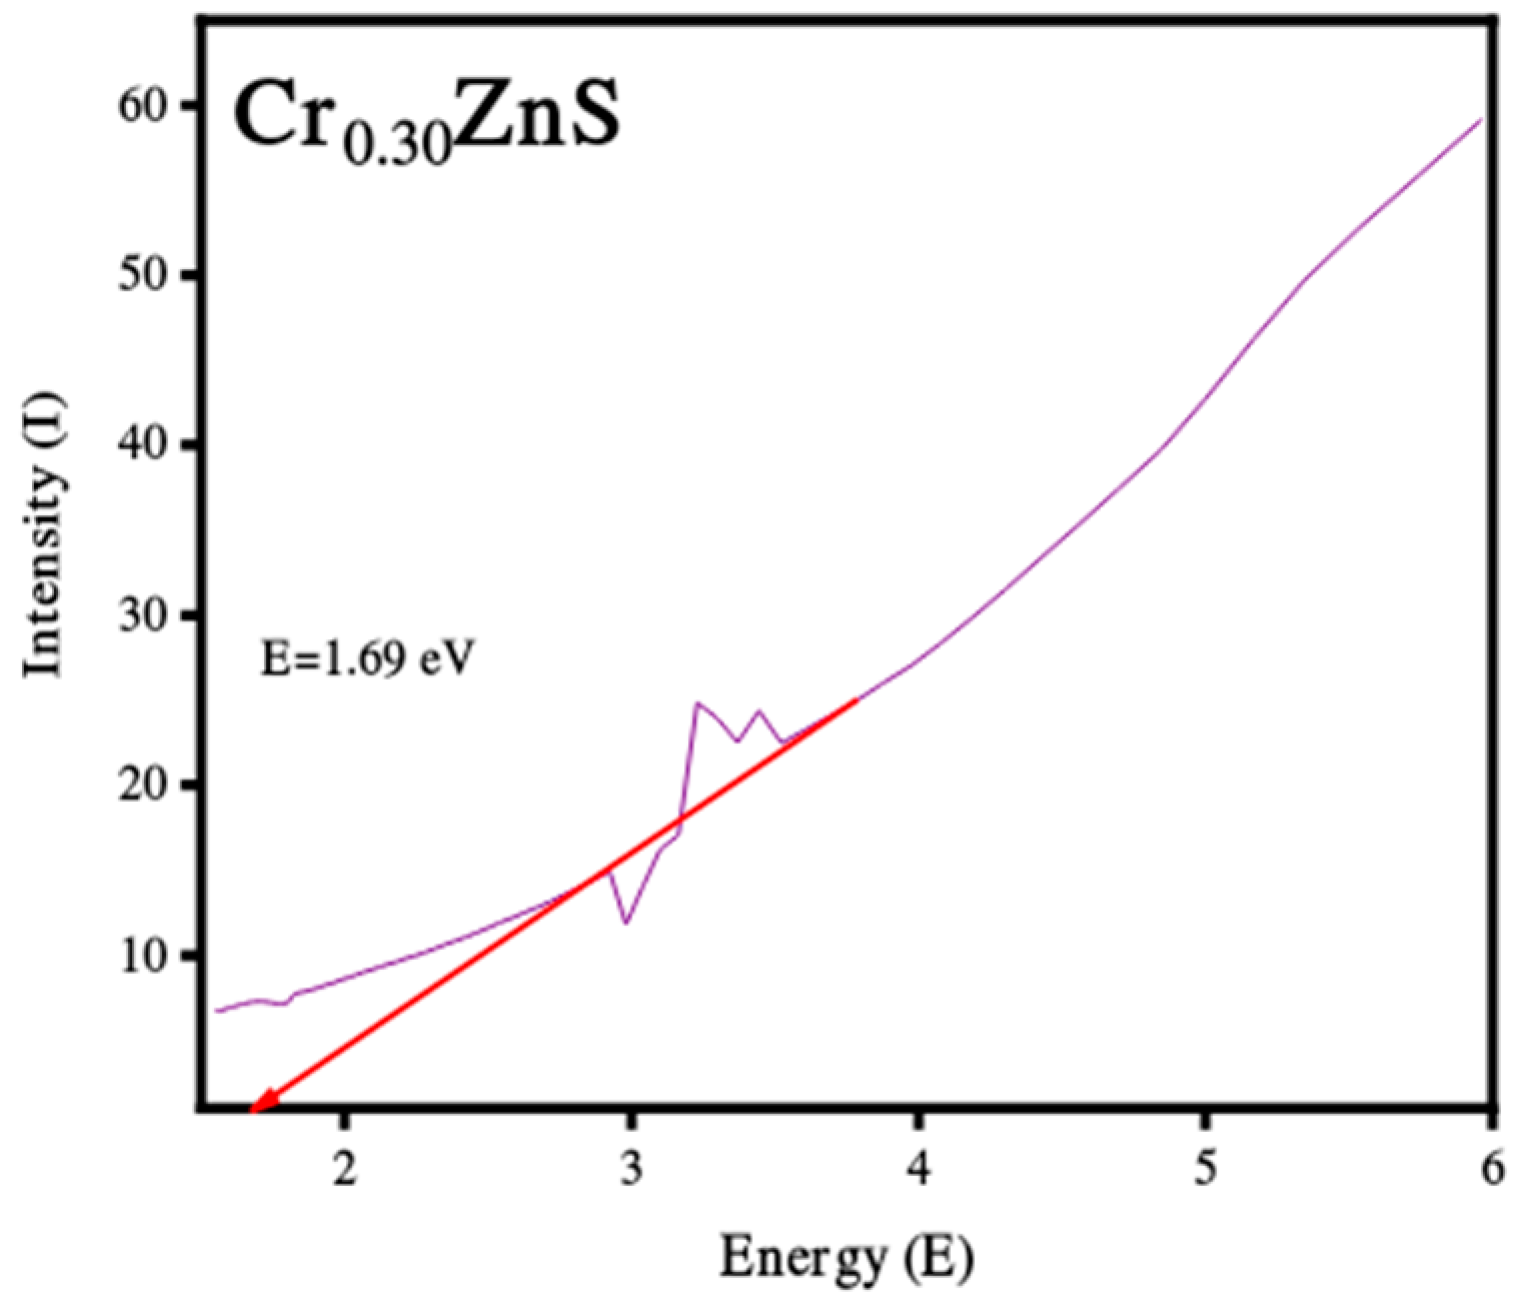
Figure 5.
Band gap estimation of Cr0.20ZnS, Cr0.25ZnS, and Cr0.30ZnS catalyst samples.
The band gap values of the catalysts with different Cr compositions are reported in Figure 5. The band gap of CrxZnS with x = 0.20, 0.25, and 0.30 was found to be 2.68, 2.48, and 1.69 eV, respectively. These band gap values are lower than the standard value of bulk ZnS (3.6 eV) [23].
3.3. X-ray Diffraction Analysis
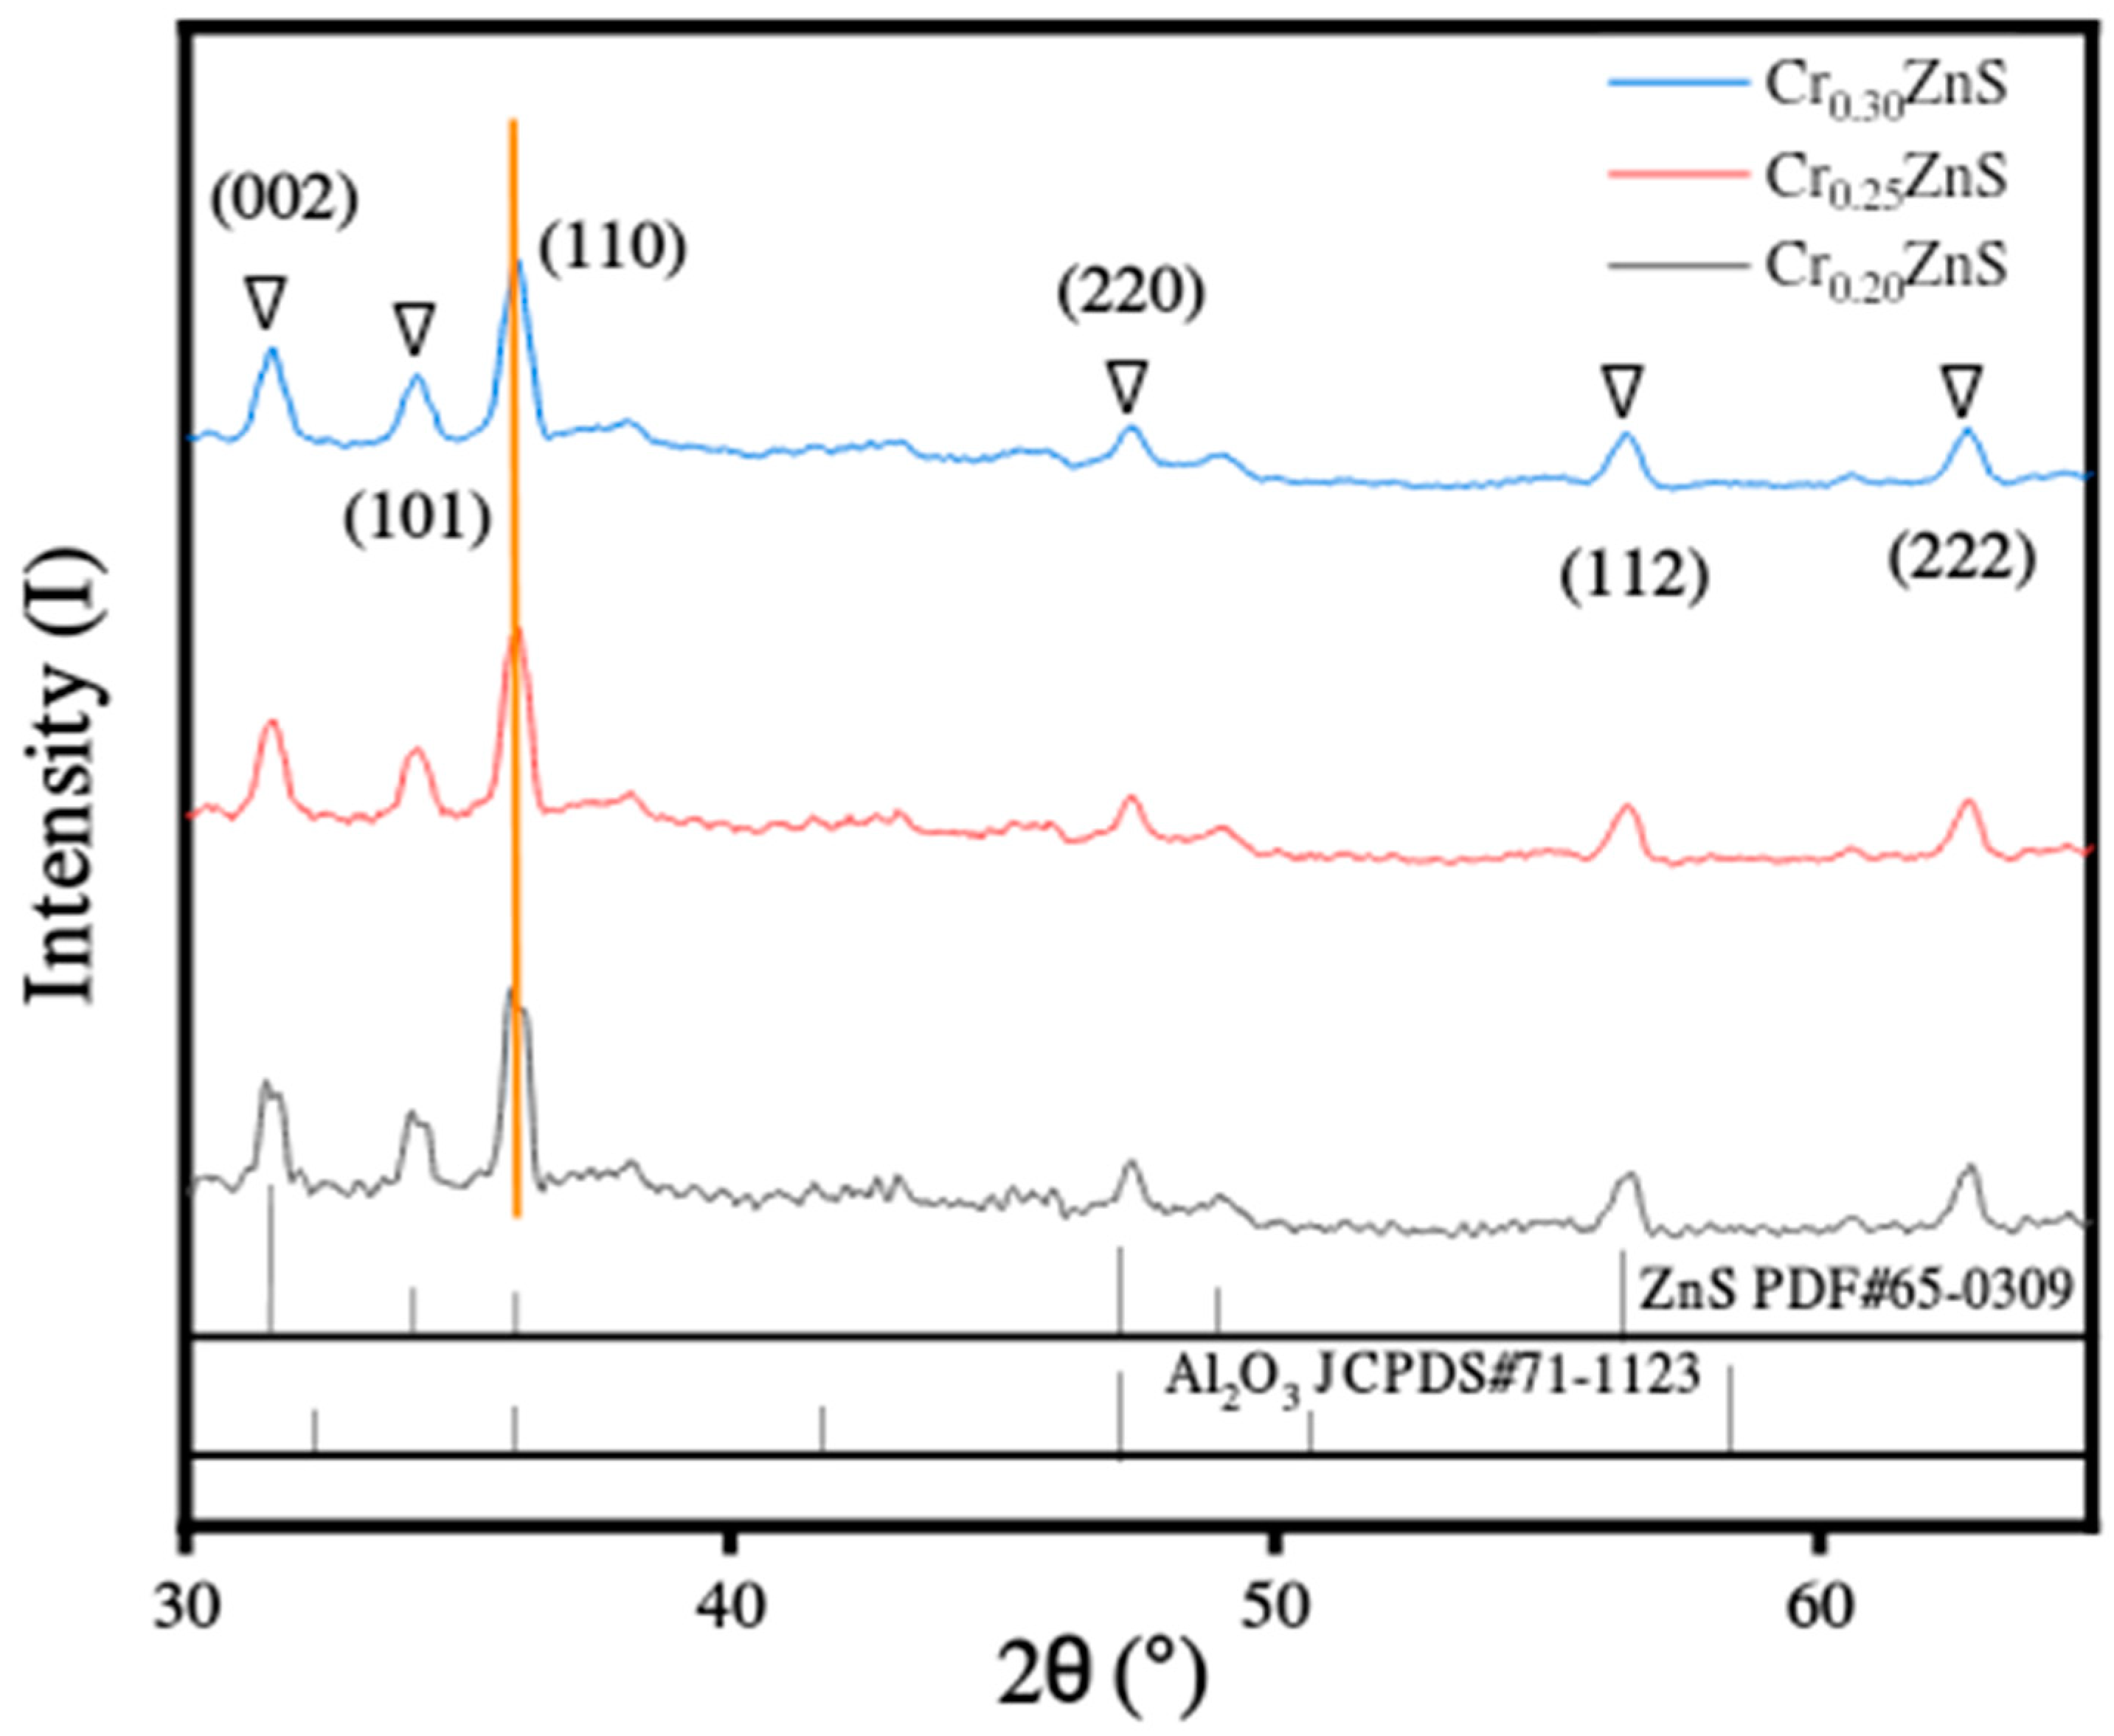
The XRD analysis of as-synthesized catalysts CrxZnS (x = 0.20, 0.25, and 0.30) are shown in Figure 6. All prepared samples showed similar diffraction peaks, identifying no variation in the host crystal structure after introducing Cr3+ ions into its lattice. The different diffraction peaks were found at 2θ values of 31°, 36°, 47°, and 56°, which correspond to (002), (001), (110), and (112) planes of ZnS, respectively. There was no other obvious indication of any other diffraction peak found except for the alumina peak. Among all samples, only the Cr0.20ZnS catalyst showed the origination of diffraction peak related to Cr impurity [24]. The information about the existence of the characteristic peak of (110) plane was confirmed from JCPDS#65-0309. The crystal structure of the CrxZnS catalyst is cubic sphalerite.
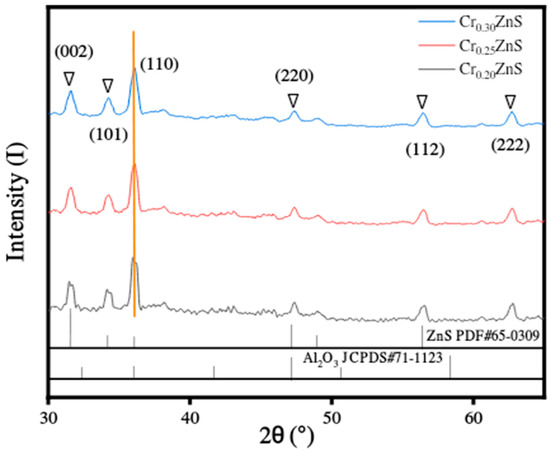
Figure 6.
XRD spectra of the CrxZnS (x = 0.20, 0.25, and 0.30) catalyst.
The surface area decreased with an increase in a molar ratio of Cr/Zn. Ramasamy [25] reported that the lattice constants were reduced with Cr doping because of the ionic radius (0.63 Å and 0.74 Å) of Cr3+ and Zn2+ ions. In our study, as the Cr3+ content increased, the lattice parameters were decreased in the case of all as-prepared CrxZnS catalysts. The Scherrer equation was used to calculate the average crystallite size of the catalyst. The grain sizes of CrxZnS were estimated to be 18.30, 17.89, and 17.49 nm, corresponding to the Cr0.20ZnS, Cr0.25ZnS, and Cr0.30ZnS, respectively. Since the band gap and the grain size are inversely related to each other; therefore, our measured band gap and crystallite size are in good agreement, as illustrated in Table 2 [26].

Table 2.
The band gap and grain size of CrxZnS catalyst samples.
3.4. STEM Morphology Analysis
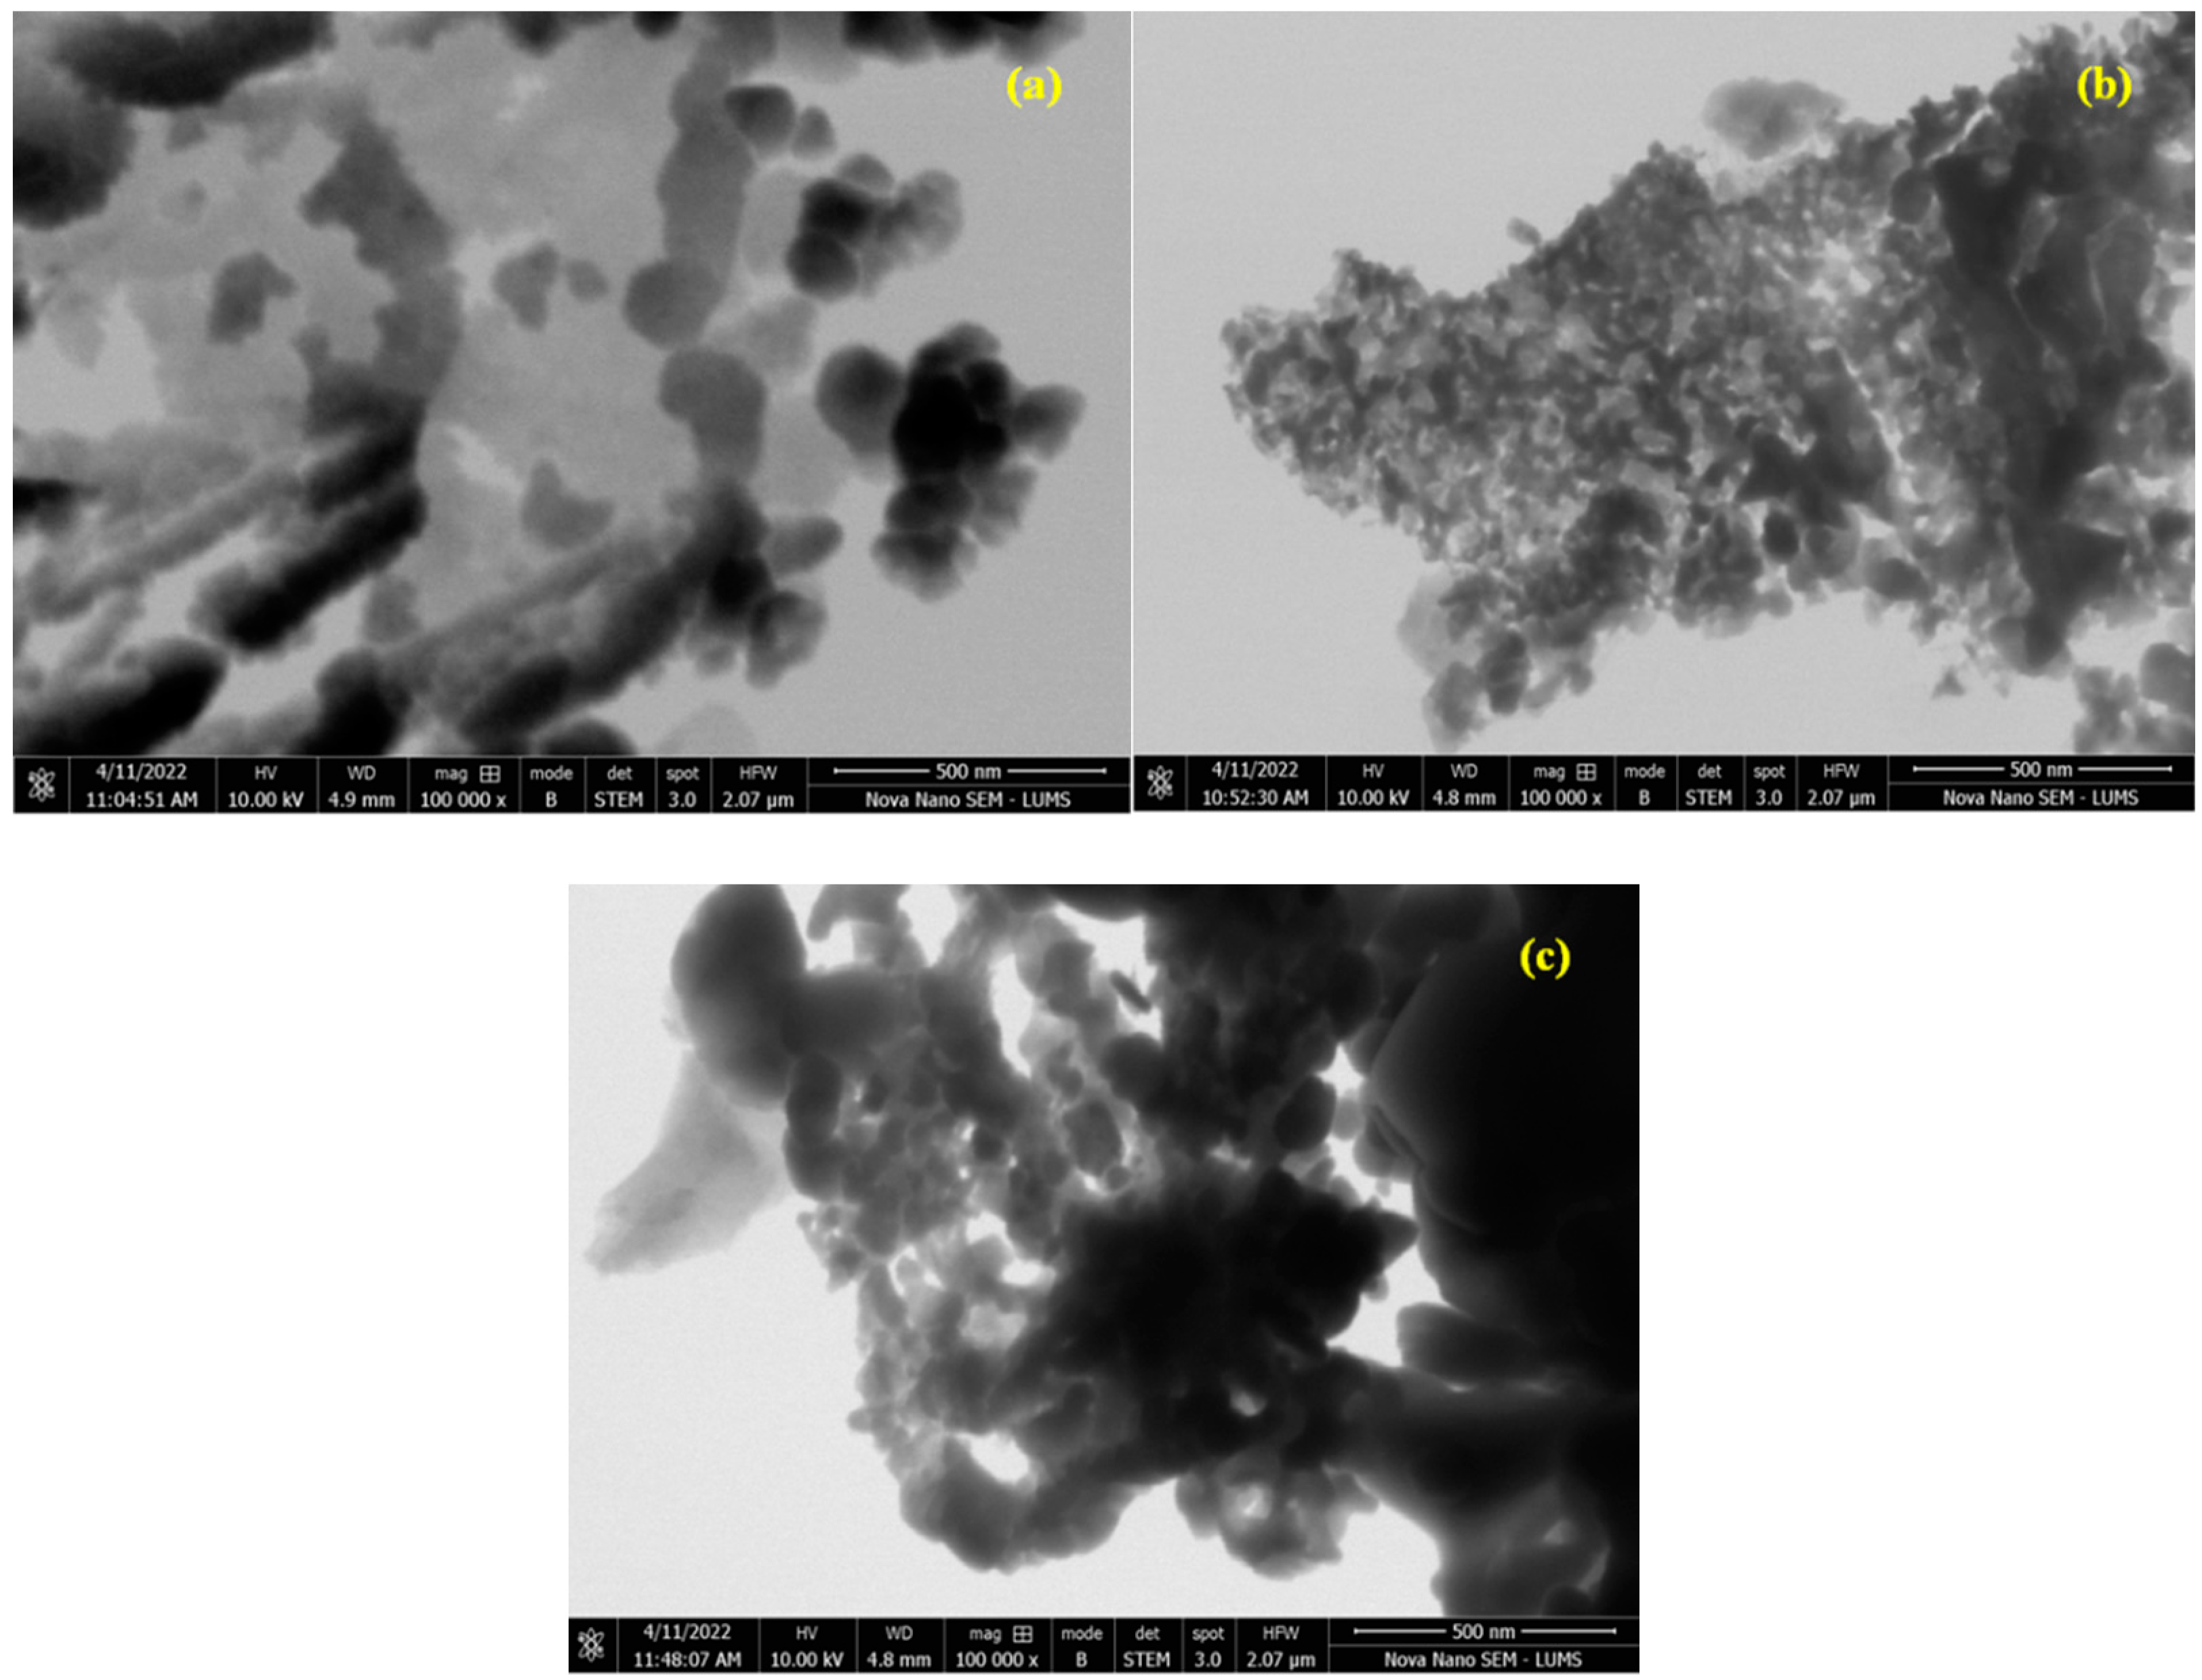
The morphology of the as-prepared samples was analyzed using the STEM technique and the results are displayed in Figure 7. The STEM analysis confirmed the successful formation of nanoparticles. The fine doping of the catalyst at a ratio of x = 0.30 appeared as a dark area in the images. A rough spherical morphology of the particles was observed in STEM images [27].
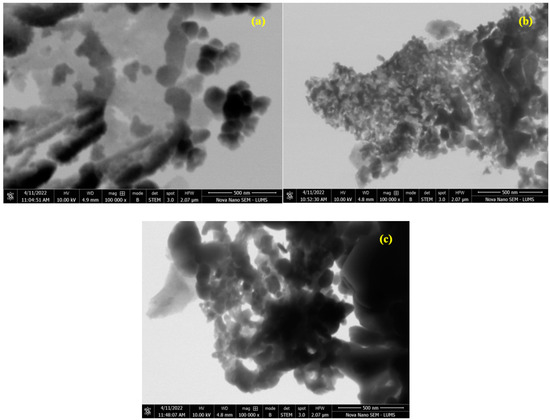
Figure 7.
STEM images of (a) Cr0.20ZnS, (b) Cr0.25ZnS, and (c) Cr0.30ZnS catalyst samples.
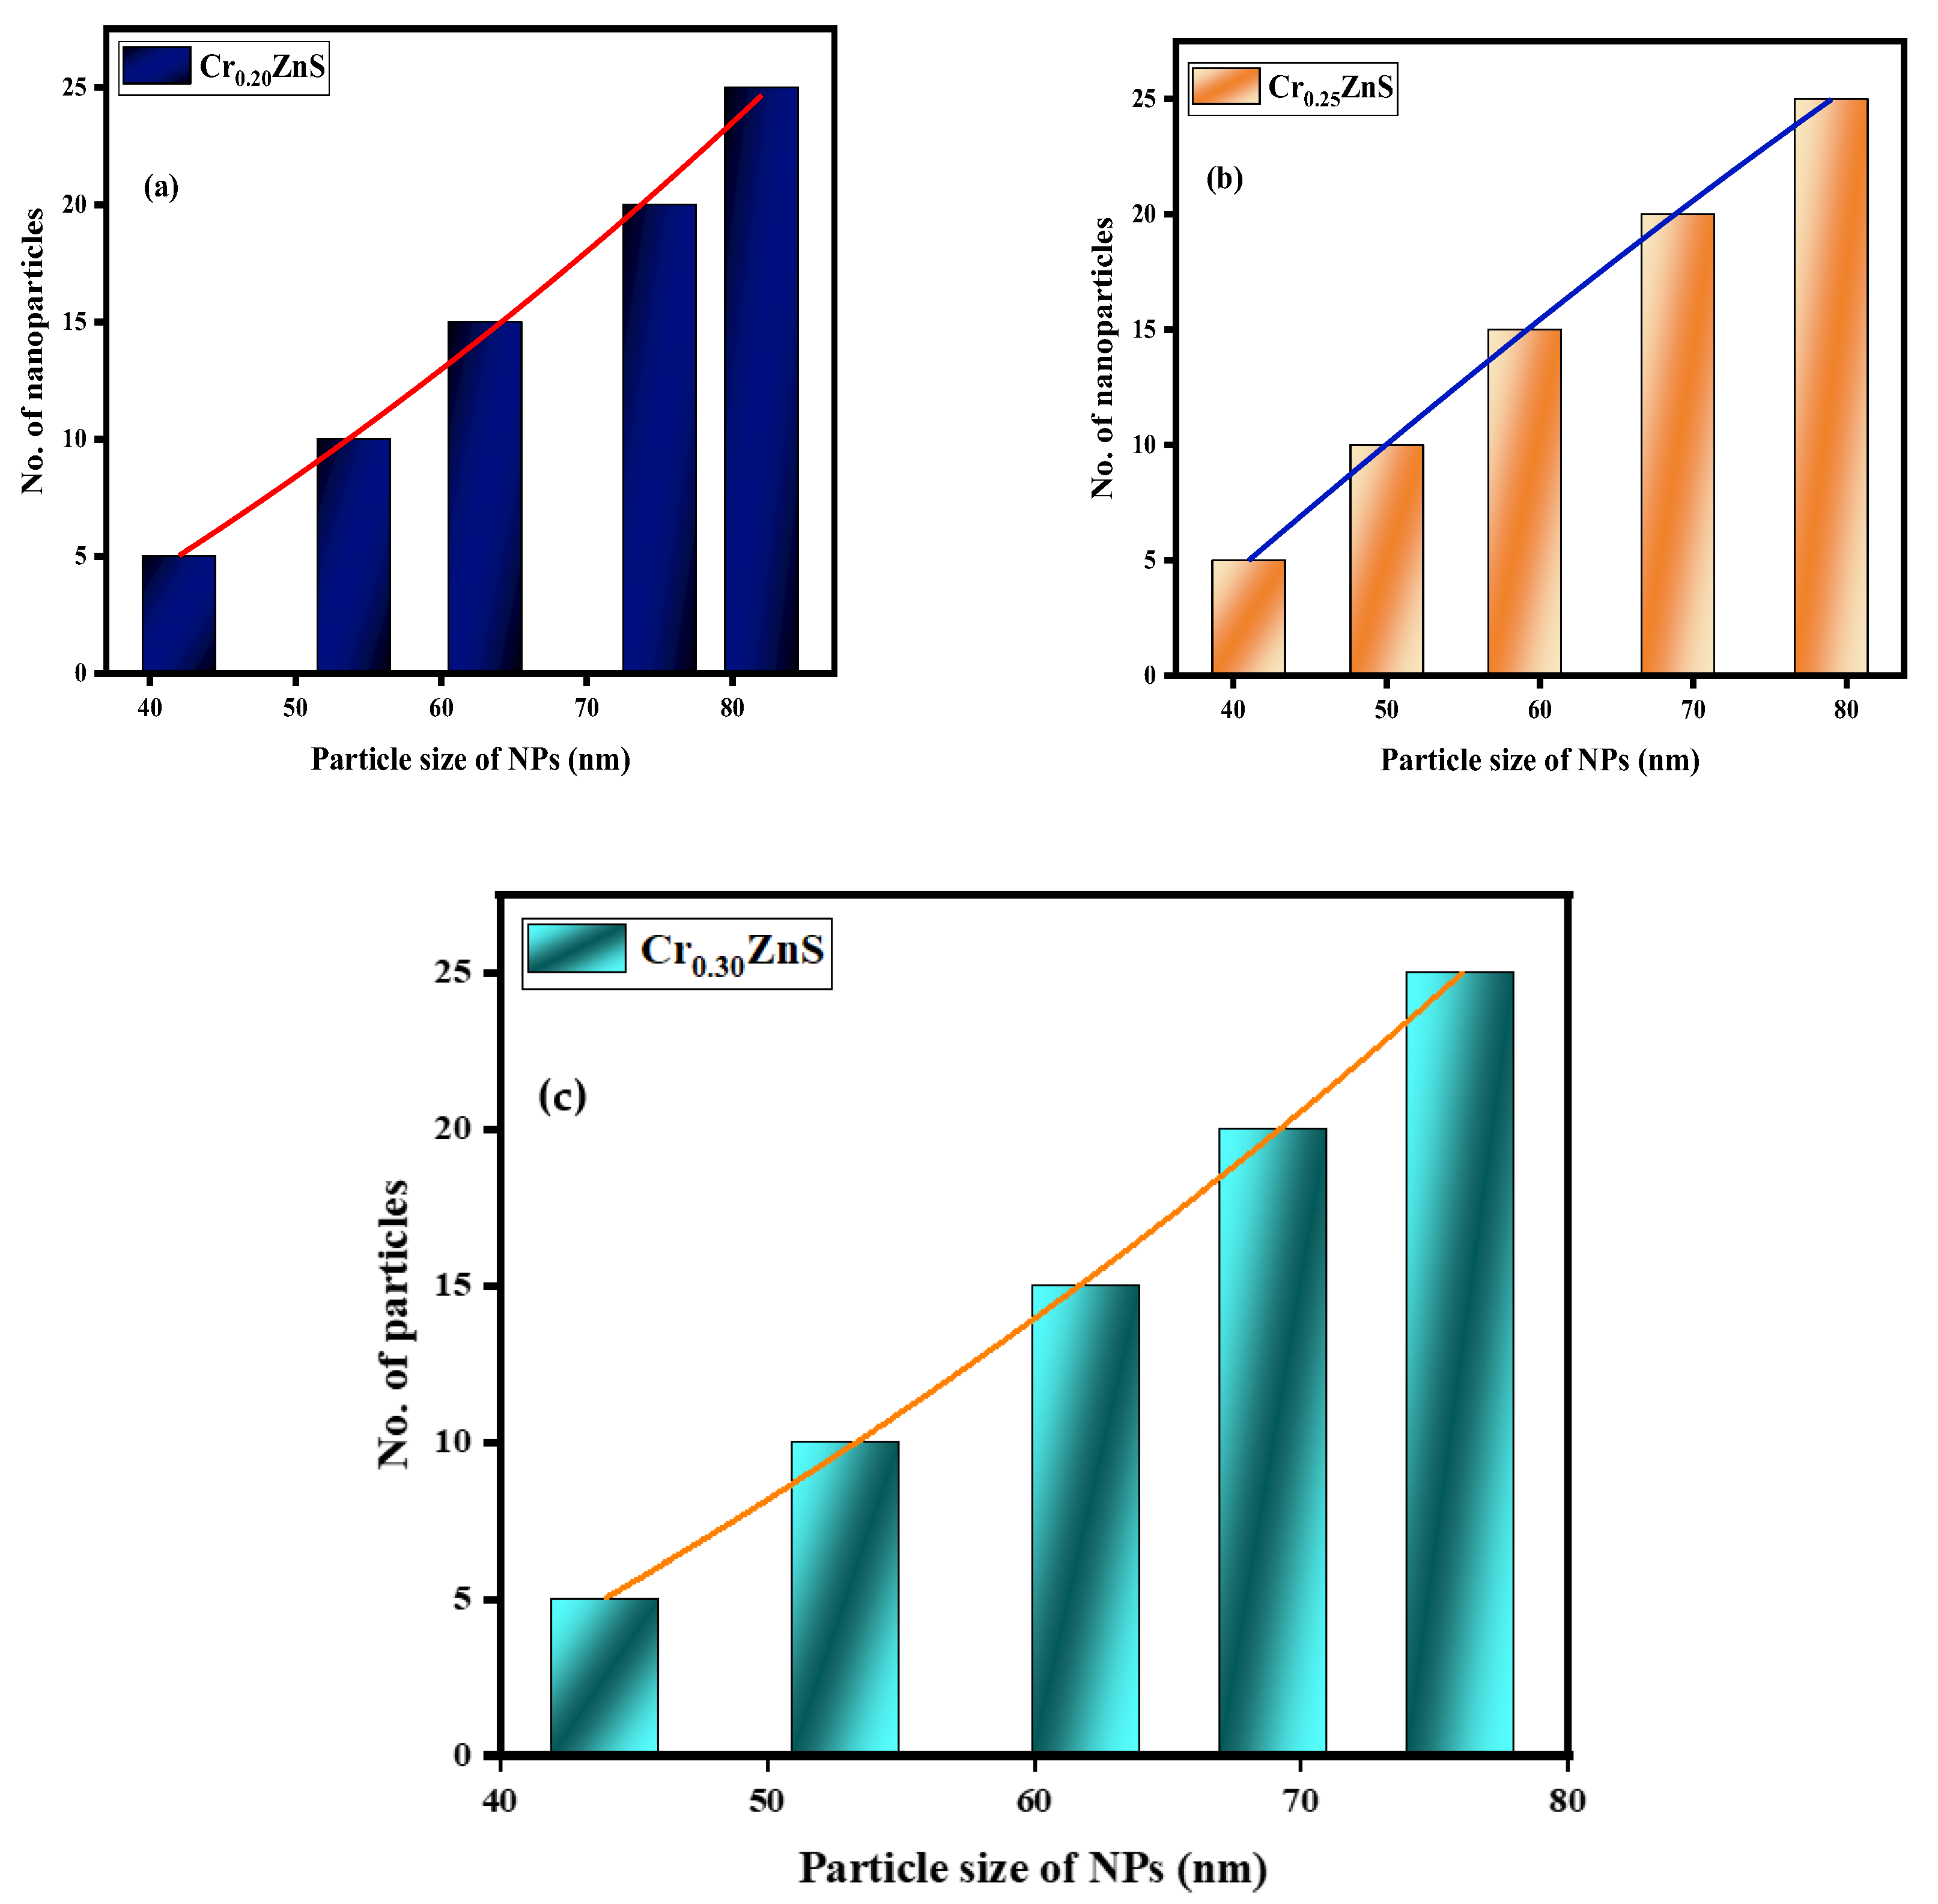
The statistical distribution of CrxZnS (x = 0.20, 0.25, and 0.30) is expressed within the range of 1–10 nm [28]. Figure 8 shows the distribution of particle sizes measured from the STEM images. The average particle size of Cr0.20ZnS, Cr0.25ZnS, and Cr0.30ZnS was measured at about 82 nm, 79 nm, and 76 nm, respectively.
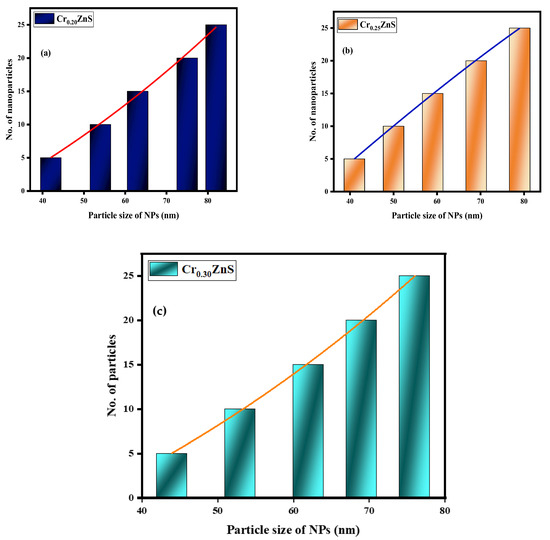
Figure 8.
Particle size distribution of (a) Cr0.20ZnS, (b) Cr0.25ZnS, and (c) Cr0.30ZnS catalyst samples.
3.5. Photoluminescence Analysis
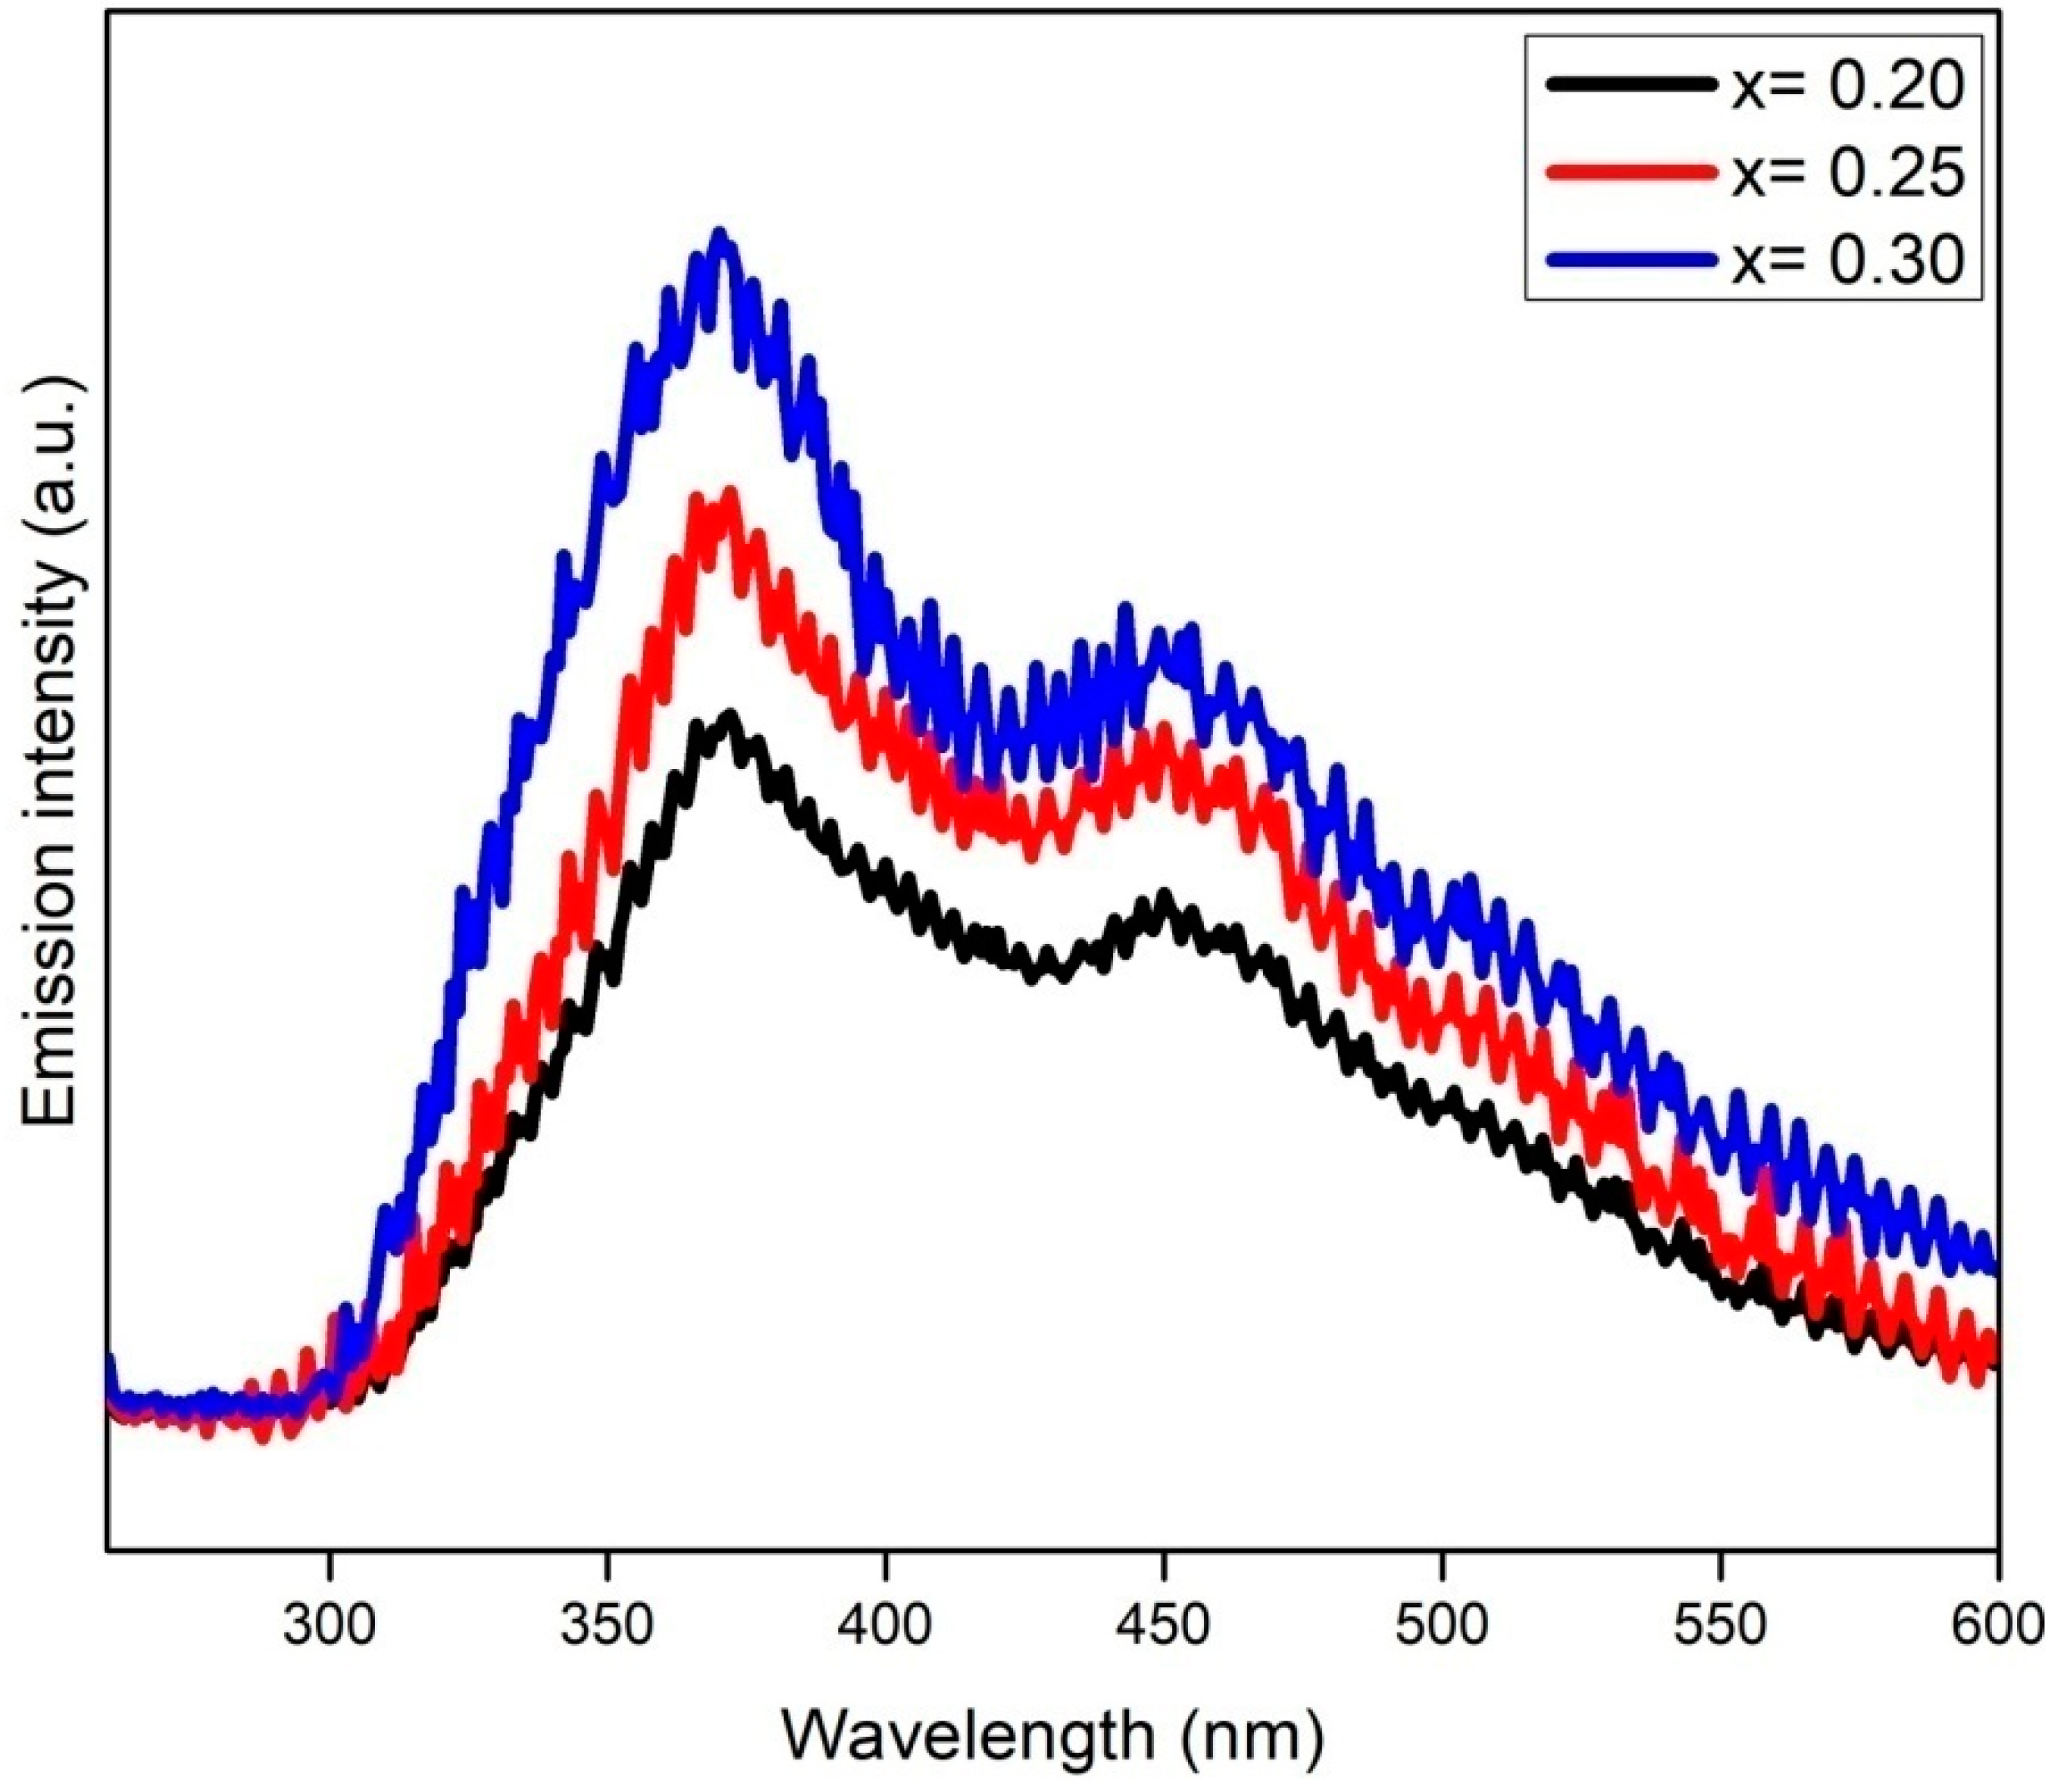
The catalysts were further characterized with PL technique to determine the extent of the photoinduced electron-hole recombination rate. Principally, high-PL-emission intensity represents the rapid recombination of charge carriers and vice versa [29]. Figure 9 shows the PL emission spectra of CrxZnS catalyst samples measured at room temperature and an exciton wavelength of 325 nm. The Cr doping has successfully altered the surface of the ZnS and promoted the migration of surface carriers, causing an increment in light-harvesting, which is consistent with the UV-Vis results [30]. The CrxZnS (x = 0.20) catalyst demonstrated the lowest emission intensity compared to the other two catalysts, identifying its effective suppression of charge carriers. It is worth mentioning that the PL intensity was reduced with Cr doping in the UV and visible zone because of the effective role of Cr3+ ions in trapping the electrons to prolong their recombination with holes [31]. Additionally, Cr3+ dopants provide electrons reaching the surface of the ZnS to effectively initiate the reaction to accelerate the photocatalytic process [32]. Hence, it is concluded that the PL intensity is reduced owing to a strongly inhibited recombination of photoinduced charge carriers because Cr3+ captured the electrons. The CrxZnS (x = 0.20) catalyst demonstrated the least intensity; therefore, it is more appropriate for hydrogen production.
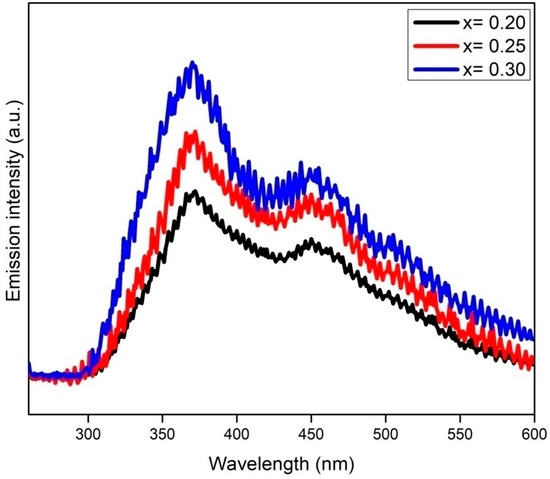
Figure 9.
PL spectra of the CrxZnS (x = 0.20, 0.25, and 0.30) catalyst.
3.6. Hydrogen Evolution Activity
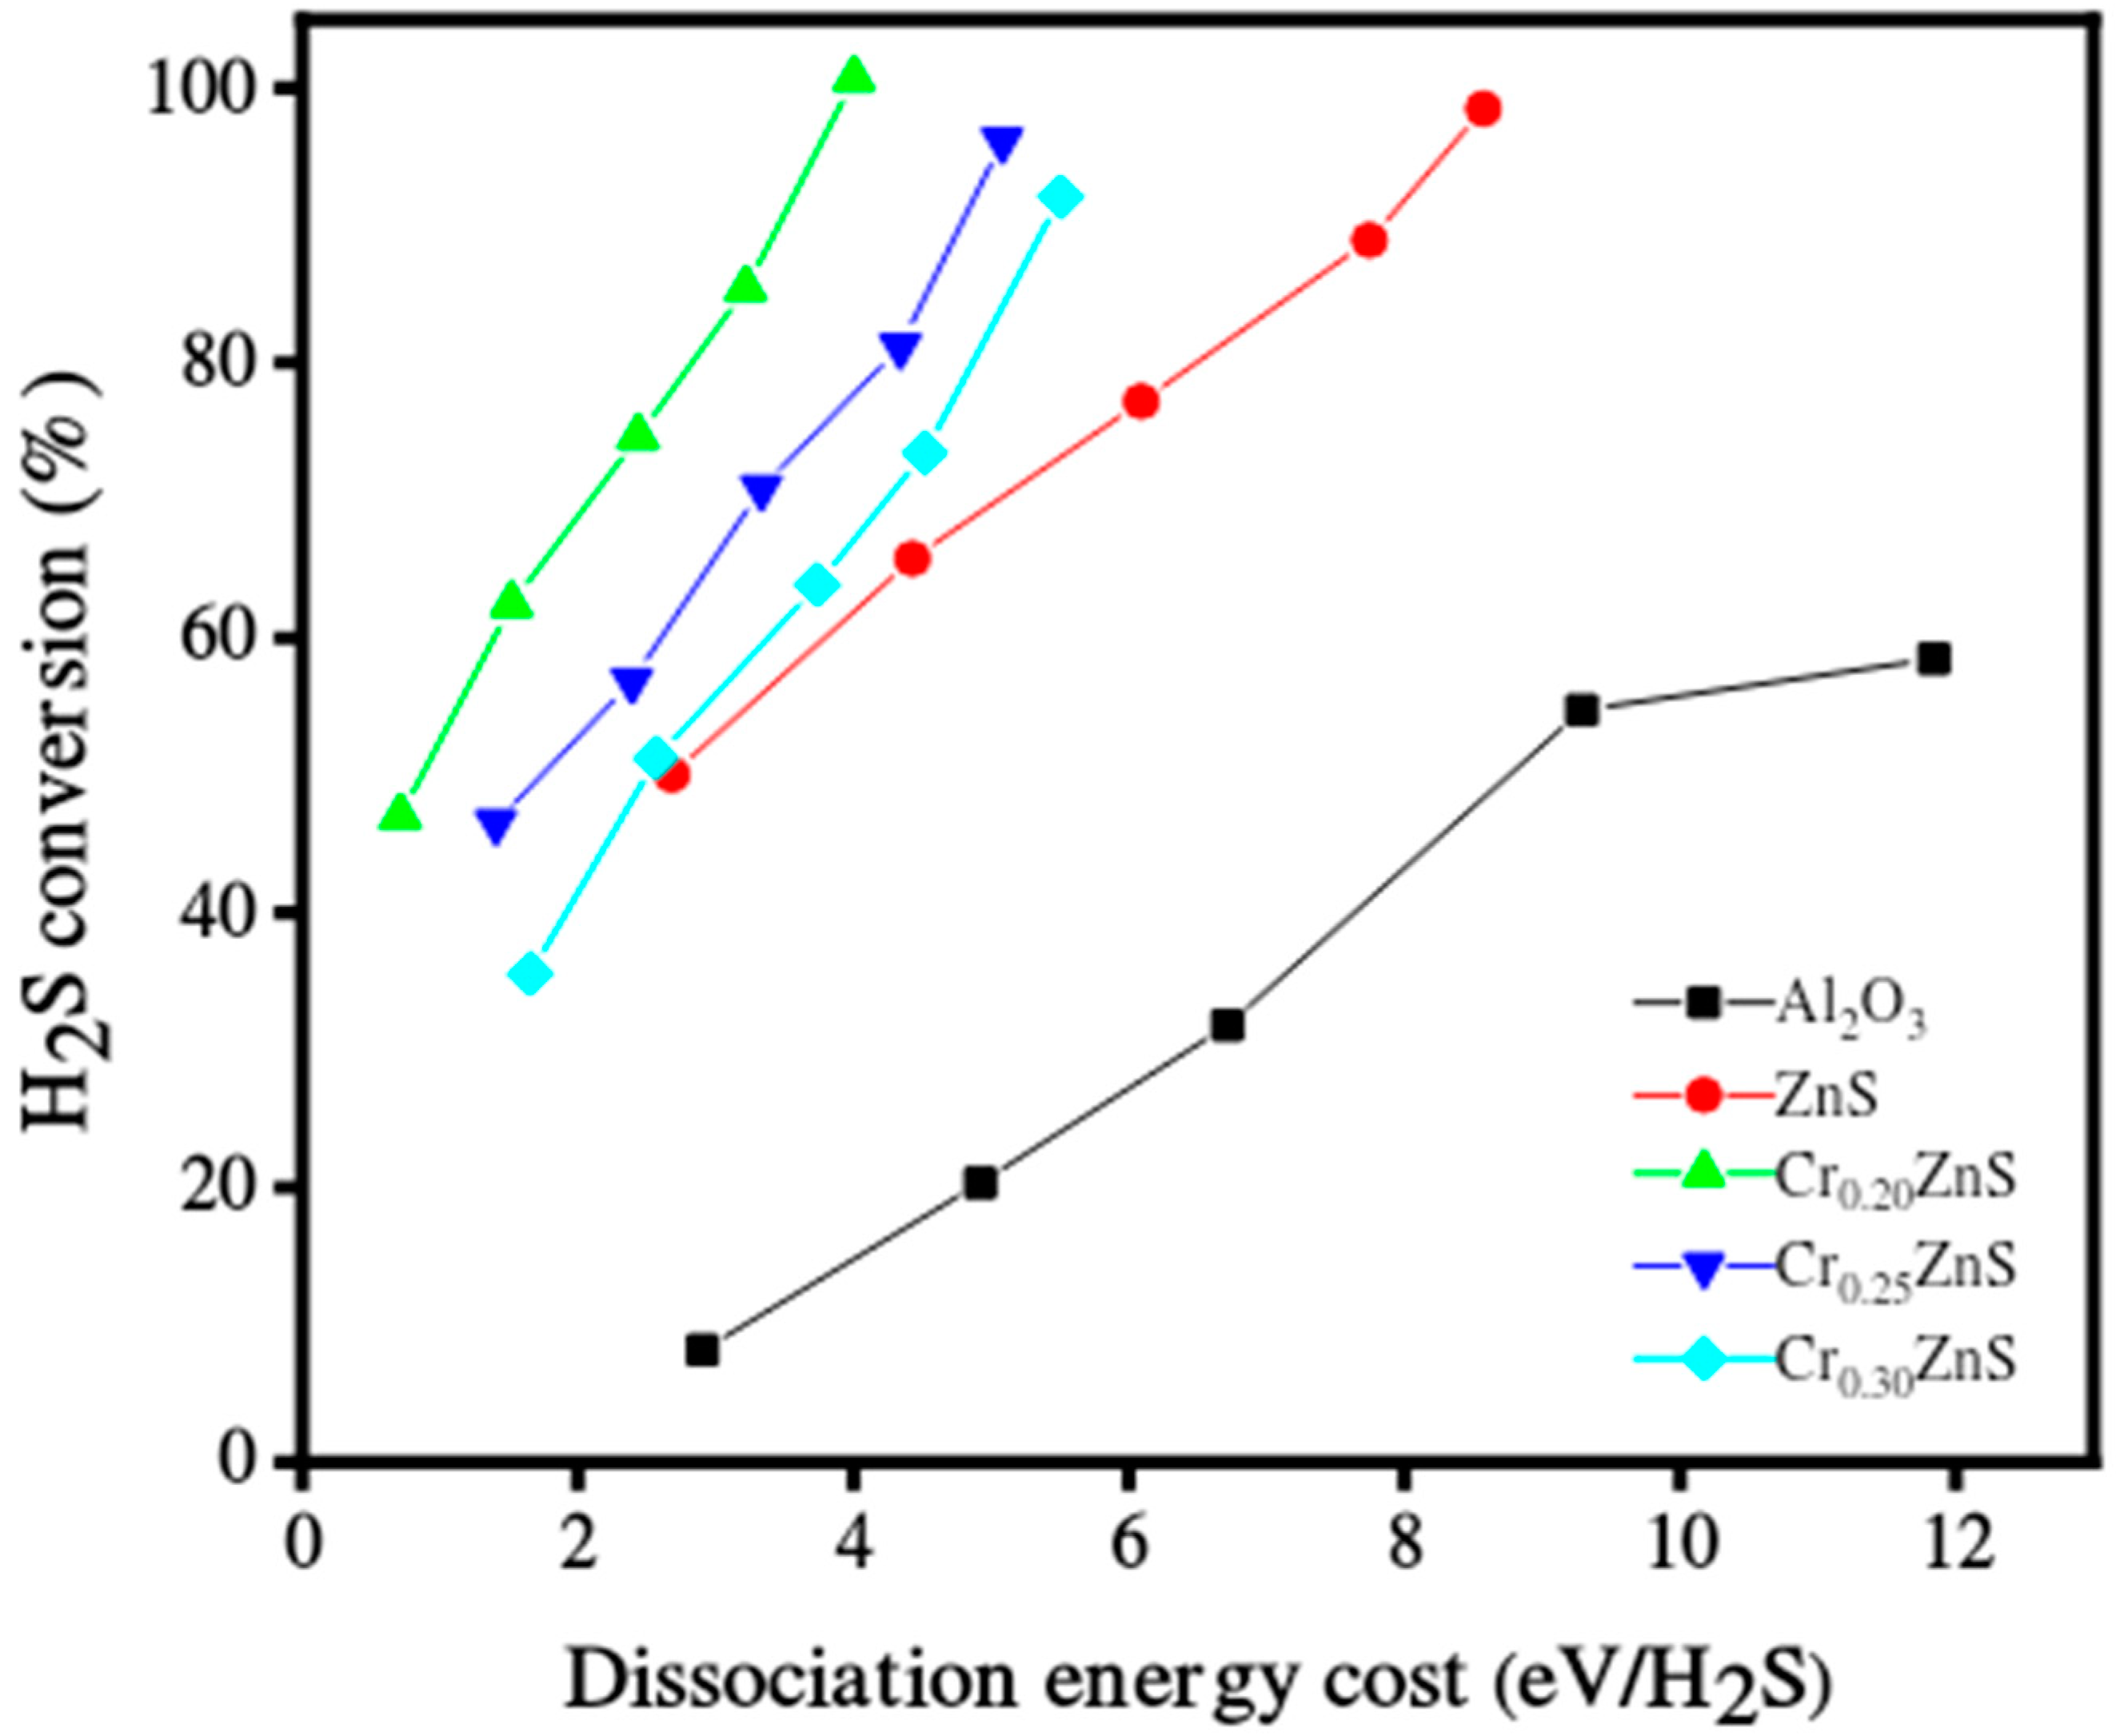
The catalytic performance of the CrxZnS catalyst samples was evaluated for hydrogen production under non-thermal plasma treatment. The catalytic performance of un-doped ZnS and Al2O3 as a support material was also presented. The decomposition of H2S over the tested catalyst compositions in a single-layered DBD plasma environment is reported in Figure 10. In the case of Al2O3 support, both discharge diffusion and plasma-produced reactive species may be influenced. The residence time of these species may be extended by the adsorption capacity of the Al2O3 support [33]; however, in the literature, the electric field was enhanced by using porous materials. Both the discharge and prolonged residence time are useful for H2S decomposition [34]. More micro-discharges occurred in the Al2O3-filled gap, which led to the beginning of chemical processes involving H2S molecules, radicals, and electrons. All prepared CrxZnS catalysts showed better performance of H2S conversion than that of pure ZnS and Al2O3 support. The CrxZnS catalyst with a molar ratio of x = 0.20 showed the highest decomposition of H2S.
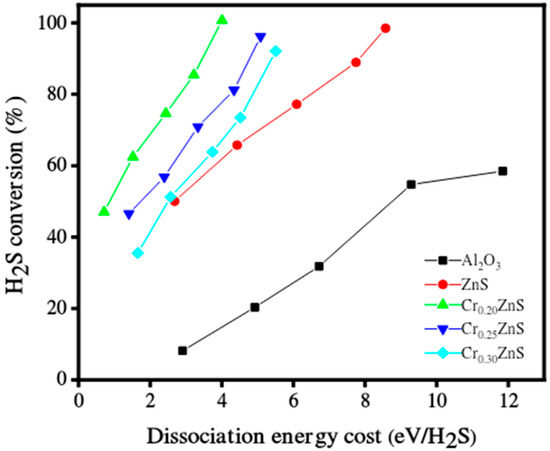
Figure 10.
Hydrogen sulfide decomposition over the catalyst in DBD plasma environment.
The results after comparison revealed that H2S conversion varied for different Cr/Zn molar ratios. The catalytic activity greatly depends upon the dopant concentration. The H2S conversion levels significantly impact the energy needed to break down its molecules [35]. The Cr0.20ZnS catalyst outperformed the other tested catalysts in terms of catalytic performance and fully converted H2S at significantly lower energies. The H2S decomposition was 100%, 96%, and 90% when the gap was filled with Cr0.20ZnS, Cr0.25ZnS, and Cr0.30ZnS, respectively. The characterization of the catalyst showed that physical and chemical properties changed with Cr/Zn molar ratio. The cubic sphalerite structure of the catalyst was shown by XRD analysis [36,37]. Cr3+ ions of chromium revealed uniformly scattering over the ZnS without introducing separated impurity phases.
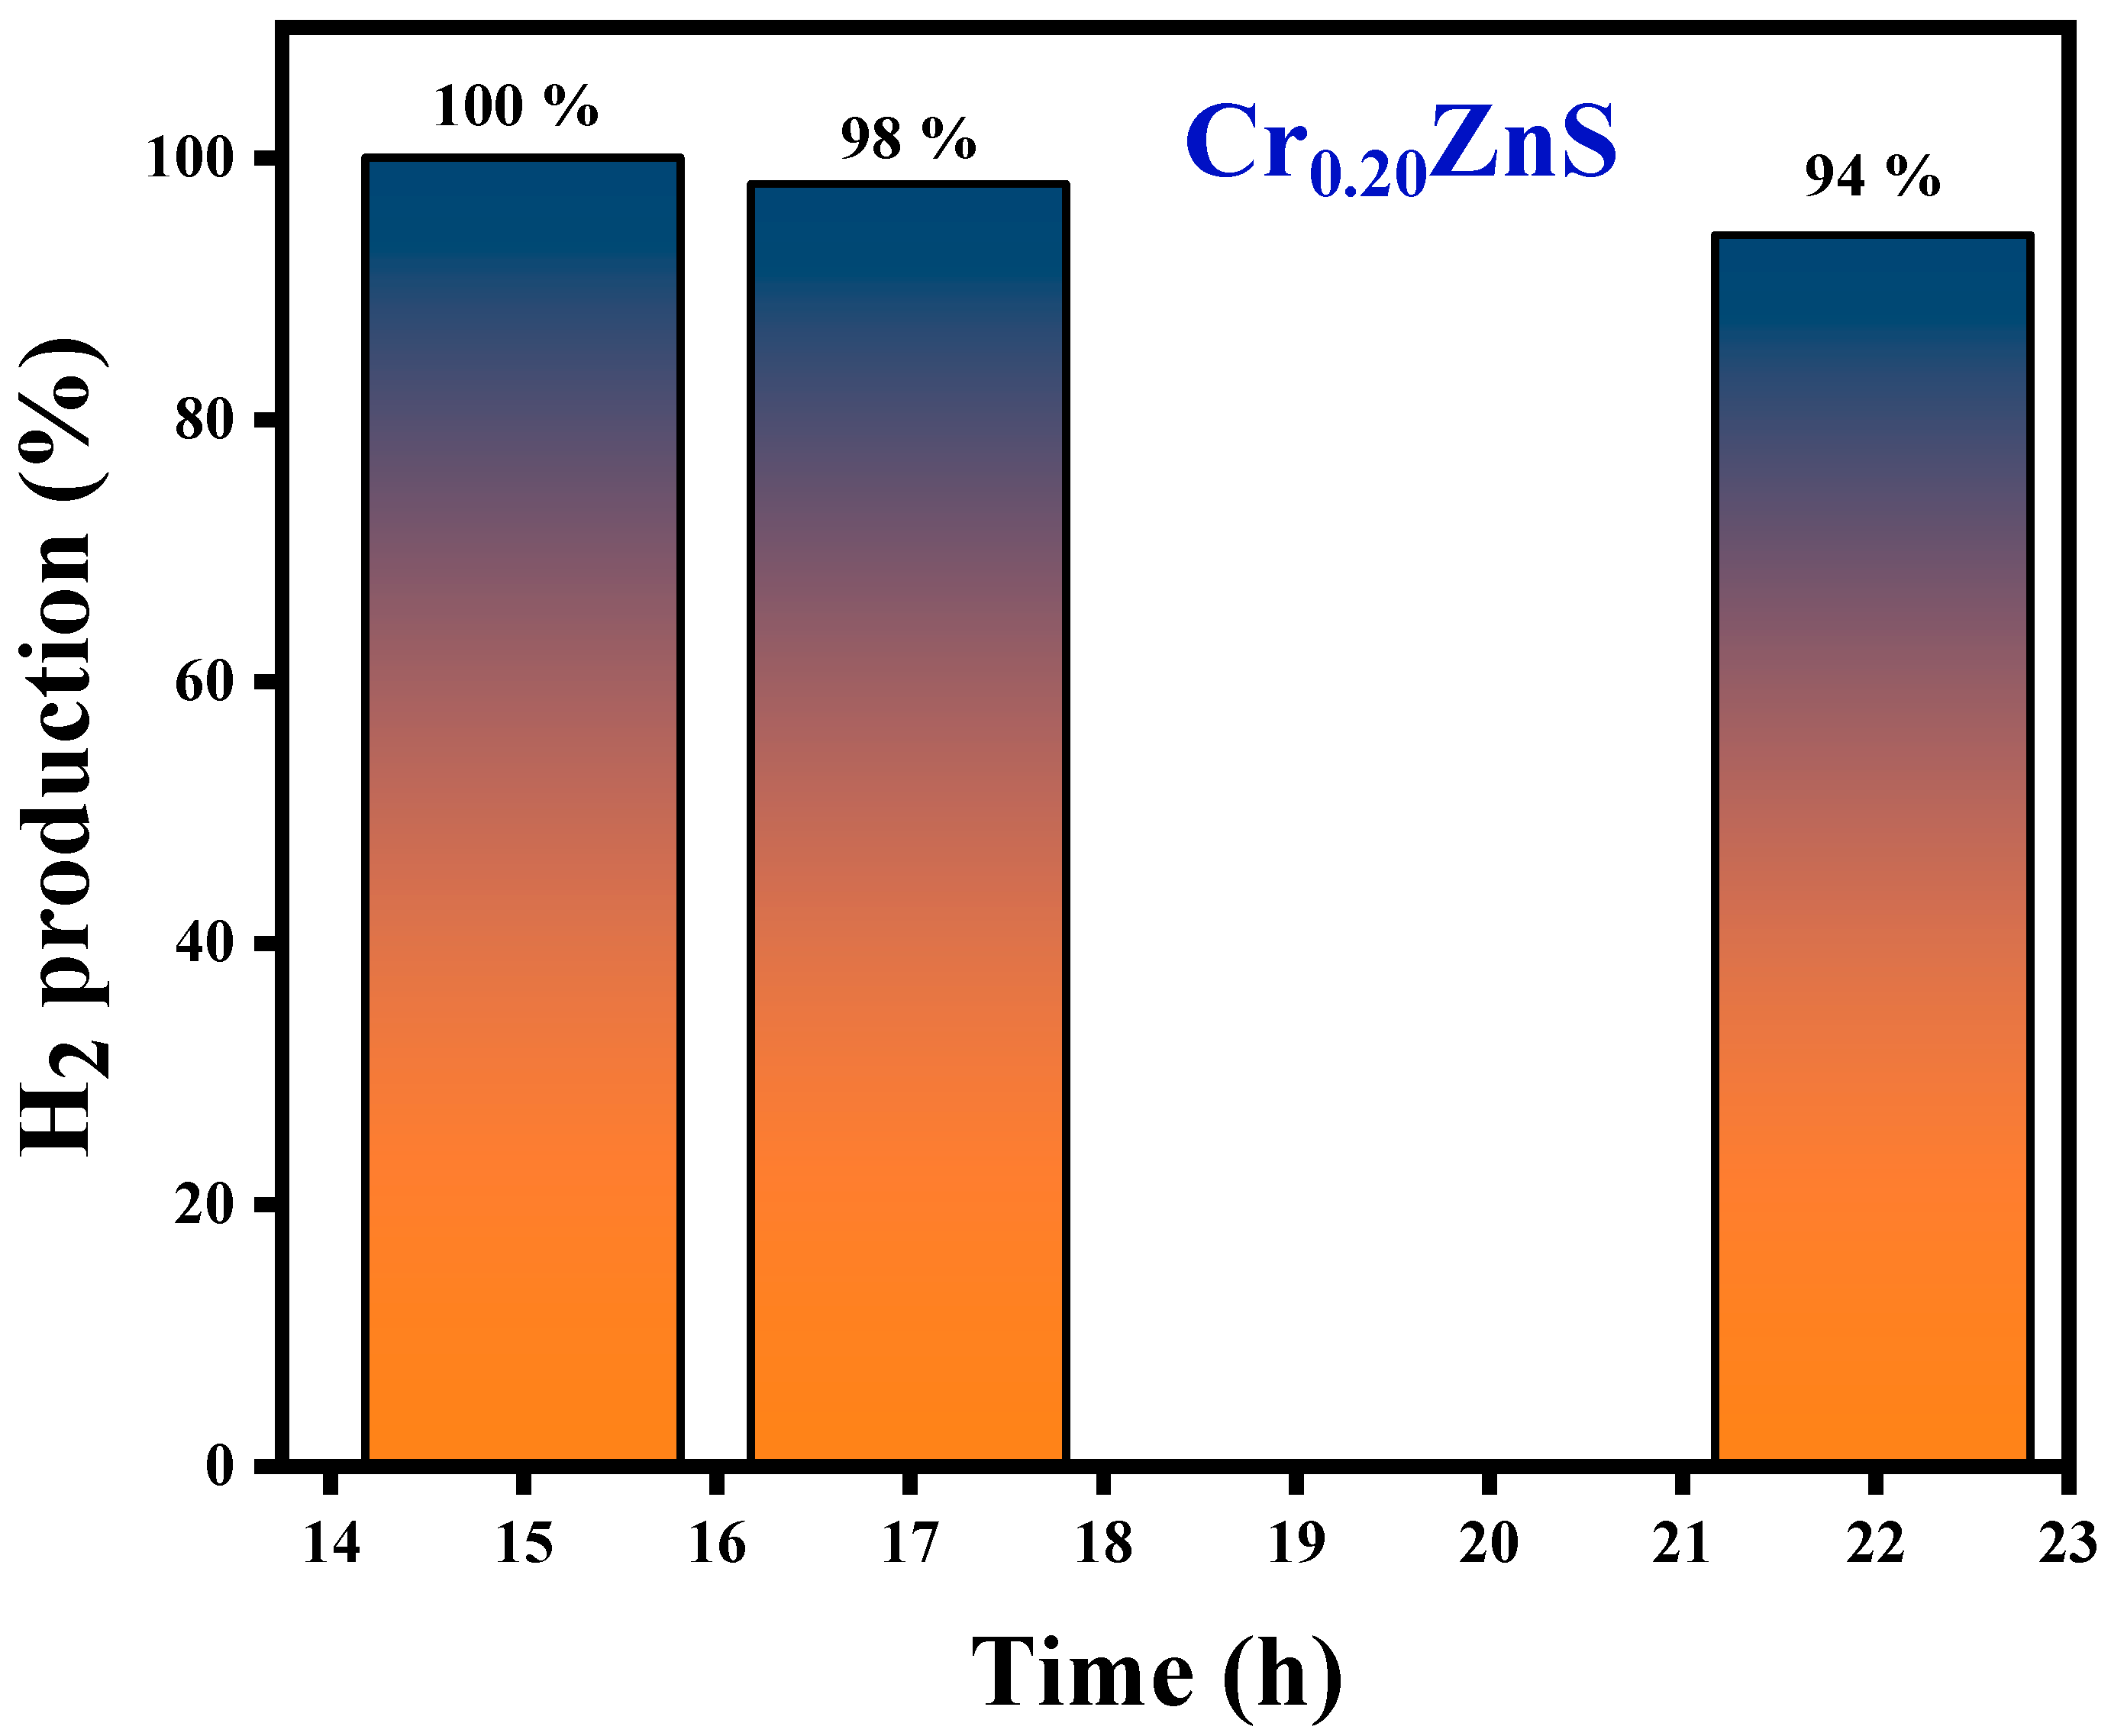
The H2S conversion with specific input energy varies for different H2S concentrations over the Cr0.20ZnS catalyst. The conversion rate was higher at the lower H2S concentrations. H2S decomposition increased with increasing the specific input energy. Chivers and Lau [36] showed similar results for the H2S conversion under non-thermal plasma conditions. When a large number of electrons collide with Ar balance gas at lower H2S concentrations, air balance gas is also crucial to the breakdown. Cr0.20ZnS was selected to evaluate the stability of the catalytic after 100% decomposition of H2S [38]. The long-term H2S conversion reaction of the Cr0.20ZnS catalyst is shown in Figure 11. The H2 evaluation shows a maximum value up to 15 h and thereafter starts to decrease over time. Three different readings were noted at different time periods. The H2 evolution decreased from 100% to 94% over the Cr0.20ZnS after 22 h of reaction time. A decrease in H2 production over time might be due to the deactivation of the catalyst.
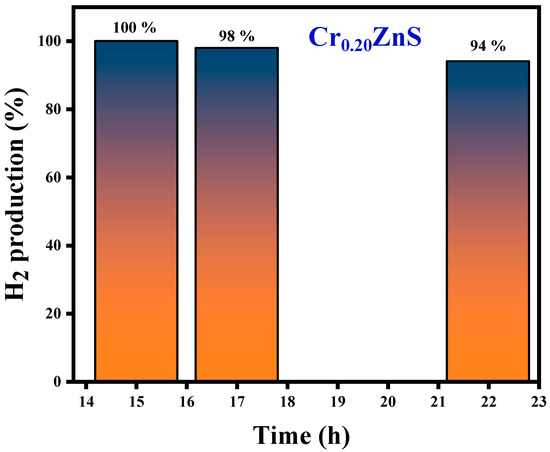
Figure 11.
H2 production of the Cr0.20ZnS catalyst with time.
Table 3 summarizes the findings of hydrogen production efficiency over the CrxZnS catalyst samples. The H2 production during the conversion of H2S was 100%, 96%, and 90% for x = 0.20, 0.25, and 0.30, respectively. Different energy conversion was observed with the same SIE (specific input energy) values for all catalysts.

Table 3.
Conversion efficiency, specific input energy, and energy consumption for catalytic hydrogen production.
4. Conclusions
This laboratory-built non-thermal plasma system with a vertical DBD column was used to decompose H2S over the CrxZnS catalyst for the production of hydrogen gas. The catalyst was prepared using the co-impregnation method. A FTIR spectrum showed the materials’ absorbance in different regions (fingerprint and group frequency region) and functional groups. X-ray diffraction displayed the surface morphology of the catalyst. The values of intensity, millar indices, grain size, and d-spacing were decreased with increasing the Cr concentration. Hydrogen evolution was maximized (100%) after 15 h of reaction over the Cr0.20ZnS. Hydrogen evolution then decreased to 94% after 22 h of reaction time, showing a decrease in catalytic activity over time. The Cr0.20ZnS, Cr0.25ZnS, and Cr0.30ZnS catalysts showed 100%, 96%, and 90% conversion, respectively, after 15 h of processing time. The earlier reported works are time-consuming and energy-intensive compared to our work. This study produced reasonably good results in relatively shorter periods. The Cr0.20ZnS showed 100% conversion of H2S within 15 h of the process.
Author Contributions
Conceptualization, M.Y.N. and M.I.; data curation, S.A.; formal analysis, H.H., I.A. and D.G.-K.; funding acquisition, M.I.; investigation, S.S. and I.K.; methodology, H.H., S.S. and I.A.; validation, S.N.F.M.; visualization, S.L.; writing—original draft, S.A. and M.Y.N.; writing—review & editing, S.N.F.M., S.L., I.K. and D.G.-K. All authors have read and agreed to the published version of the manuscript.
Funding
The paper fee was paid through the Poznan University of Technology—project no. 0713/SBAD/0958.
Institutional Review Board Statement
No applicable.
Informed Consent Statement
No applicable.
Data Availability Statement
Data is available from the authors on reasonable request.
Acknowledgments
The authors acknowledge the support from the Deanship of Scientific Research, Najran University, Kingdom of Saudi Arabia, for funding this work under the Research Collaboration funding program grant code number NU/RC/SERC/11/4.
Conflicts of Interest
There is not known conflict of interest for publishing this work.
References
- Thangam, N.; Suganya Devi, B.; Lalitha Muthu, A.C. Hydrogen production from Hydrogen Sulfide Waste stream using Ru/Cd0.6Zn0.4S Photocatalyst. Int. J. New Technol. Res. 2015, 1, 4–10. [Google Scholar]
- Liao, J.; Shao, Y.; Feng, Y.; Zhang, J.; Song, C.; Zeng, W.; Tang, J.; Dong, H.; Liu, Q.; Li, H. Interfacial charge transfer induced dual-active-sites of heterostructured Cu0.8Ni0.2WO4 nanoparticles in ammonia borane methanolysis for fast hydrogen production. Appl. Catal. B Environ. 2022, 320, 121973. [Google Scholar] [CrossRef]
- Feng, Y.; Li, Y.; Liao, Q.; Zhang, W.; Huang, Z.; Chen, X.; Shao, Y.; Dong, H.; Liu, Q.; Li, H. Modulation the electronic structure of hollow structured CuO-NiCo2O4 nanosphere for enhanced catalytic activity towards methanolysis of ammonia borane. Fuel 2022, 332, 126045. [Google Scholar] [CrossRef]
- Reddy, D.A.; Murali, G.; Vijayalakshmi, R.P.; Reddy, B.K. Room-temperature ferromagnetism in EDTA capped Cr-doped ZnS nanoparticles. Appl. Phys. A 2011, 105, 119–124. [Google Scholar] [CrossRef]
- Deshmukh, G.M.; Shete, A.; Pawar, D.M. Oxidative absorption of hydrogen sulfide using an iron-chelate based process: Chelate degradation. J. Chem. Technol. Biotechnol. 2013, 88, 432–436. [Google Scholar] [CrossRef]
- Zhao, L.; Wang, Y.; Li, X.; Wang, A.; Song, C.; Hu, Y. Hydrogen production via decomposition of hydrogen sulfide by synergy of non-thermal plasma and semiconductor catalysis. Int. J. Hydrogen Energy 2013, 38, 14415–14423. [Google Scholar] [CrossRef]
- Zaman, J.; Chakma, A. Production of hydrogen and sulfur from hydrogen sulfide. Fuel Processing Technol. 1995, 41, 159–198. [Google Scholar] [CrossRef]
- Feng, Y.; Zhang, X.; Shao, Y.; Chen, X.; Wang, H.; Li, J.; Wu, M.; Dong, H.; Liu, Q.; Li, H. Modulating the Acidic Properties of Mesoporous Mox–Ni0.8Cu0.2O Nanowires for Enhanced Catalytic Performance toward the Methanolysis of Ammonia Borane for Hydrogen Production. ACS Appl. Mater. Interfaces 2022, 14, 27979–27993. [Google Scholar] [CrossRef]
- Duan, L.B.; Zhao, X.R.; Liu, J.M.; Wang, T.; Rao, G.H. Room-temperature ferromagnetism in lightly Cr-doped ZnO nanoparticles. Appl. Phys. A 2010, 99, 679–683. [Google Scholar] [CrossRef]
- Zhao, L.; Liu, X.; Mu, X.; Li, Y.; Fang, K. Highly selective conversion of H2S–CO2 to syngas by combination of non-thermal plasma and MoS2/Al2O3. J. CO2 Util. 2020, 37, 45–54. [Google Scholar] [CrossRef]
- Eyasu, A.; Yadav, O.P.; Bachheti, R.K. Photocatalytic degradation of methyl orange dye using Cr-doped ZnS nanoparticles under visible radiation. Int. J. Chem. Tech. Res. 2013, 5, 1452–1461. [Google Scholar]
- Poornaprakash, B.; Naveen Kumar, K.; Chalapathi, U.; Reddeppa, M.; Poojitha, P.T.; Park, S.H. Chromium doped ZnS nanoparticles: Chemical, structural, luminescence and magnetic studies. J. Mater. Sci. Mater. Electron. 2016, 27, 6474–6479. [Google Scholar] [CrossRef]
- Barnhart, J. Occurrences, uses, and properties of chromium. Regul. Toxicol. Pharmacol. 1997, 26, S3–S7. [Google Scholar] [CrossRef] [PubMed]
- Bodke, M.R.; Purushotham, Y.; Dole, B.N. Crystallographic and optical studies on Cr doped ZnS nanocrystals. Cerâmica 2014, 60, 425–428. [Google Scholar] [CrossRef]
- Linga Reddy, E.; Karuppiah, J.; Renken, A.; Kiwi-Minsker, L.; Subrahmanyam, C. Kinetics of the decomposition of hydrogen sulfide in a dielectric barrier discharge reactor. Chem. Eng. Technol. 2012, 35, 2030–2034. [Google Scholar] [CrossRef]
- Kogelschatz, U.; Eliasson, B.; Egli, W. Dielectric-barrier discharges. Principle and applications. Le J. De Phys. IV 1997, 7, C4–C47. [Google Scholar] [CrossRef]
- Bodke, M. Synthesis and characterization of chromium doped zinc sulfide nanoparticles. Open Access Libr. J. 2015, 2, 1. [Google Scholar] [CrossRef]
- Palma, V.; Cortese, M.; Renda, S.; Ruocco, C.; Martino, M.; Meloni, E. A review about the recent advances in selected nonthermal plasma assisted solid–gas phase chemical processes. Nanomaterials 2020, 10, 1596. [Google Scholar] [CrossRef]
- Bhat, V.S.; Tilakraj, T.S.; Patil, M.K.; Pujari, V.; Inamdar, S.R. One-Pot Synthesis of Biocompatible Glycine Protected Chromium Doped ZnS Nanoparticles and their Optical Properties. In IOP Conference Series: Materials Science and Engineering; IOP Publishing: Bristol, UK, 2022; Volume 1221, p. 012029. [Google Scholar]
- Dake, D.V.; Raskar, N.D.; Mane, V.A.; Sonpir, R.B.; Stathatos, E.; Asokan, K.; Babu, P.D.; Dole, B.N. Exploring the role of defects on diverse properties of Cr-substituted ZnS nanostructures for photocatalytic applications. Appl. Phys. A 2020, 126, 1–15. [Google Scholar] [CrossRef]
- Amaranatha Reddy, D.; Murali, G.; Vijayalakshmi, R.P.; Reddy, B.K.; Sreedhar, B. Effect of Cr doping on the structural and optical properties of ZnS nanoparticles. Cryst. Res. Technol. 2011, 46, 731–736. [Google Scholar] [CrossRef]
- Mohammed, B.A.; Ahmed, L.M. Improvement the Photo Catalytic Properties of ZnS nanoparticle with Loaded Manganese and Chromium by Co-Precipitation Method. J. Glob. Pharma Technol. 2018, 10, 129–138. [Google Scholar]
- Batra, V.; Kotru, S.; Varagas, M.; Ramana, C.V. Optical constants and band gap determination of Pb0.95La0.05 Zr0.54Ti0.46O3 thin films using spectroscopic ellipsometry and UV–visible spectroscopy. Opt. Mater. 2015, 49, 123–128. [Google Scholar] [CrossRef]
- Kaur, P.; Kumar, S.; Singh, A.; Rao, S.M. Improved magnetism in Cr doped ZnS nanoparticles with nitrogen co-doping synthesized using chemical co-precipitation technique. J. Mater. Sci. Mater. Electron. 2015, 26, 9158–9163. [Google Scholar] [CrossRef]
- Ramasamy, V.; Praba, K.; Murugadoss, G. Synthesis and study of optical properties of transition metals doped ZnS nanoparticles. Spectrochim. Acta Part A: Mol. Biomol. Spectrosc. 2012, 96, 963–971. [Google Scholar] [CrossRef] [PubMed]
- Reddy, D.A.; Divya, A.; Murali, G.; Vijayalakshmi, R.P.; Reddy, B.K. Synthesis and optical properties of Cr doped ZnS nanoparticles capped by 2-mercaptoethanol. Phys. B Condens. Matter 2011, 406, 1944–1949. [Google Scholar] [CrossRef]
- Choi, B.; Shim, H.; Allabergenov, B. Red photoluminescence and blue-shift caused by phase transformation in multilayer films of titanium dioxide and zinc sulfide. Opt. Mater. Express 2015, 5, 2156–2163. [Google Scholar] [CrossRef]
- Wang, Z.; Cao, S.W.; Loo, S.C.J.; Xue, C. Nanoparticle heterojunctions in ZnS–ZnO hybrid nanowires for visible-light-driven photocatalytic hydrogen generation. Cryst. Eng. Comm. 2013, 15, 5688–5693. [Google Scholar] [CrossRef]
- Irfan, M.; Shukrullah, S.; Naz, M.Y.; Ahmad, I.; Shoukat, B.; Legutko, S.; Alsaiari, M.A. Si/SiO2/Al2O3 Supported Growth of CNT Forest for the Production of La/ZnO/CNT Photocatalyst for Hydrogen Production. Materials 2022, 15, 3226. [Google Scholar] [CrossRef] [PubMed]
- Irfan, M.; Ahmad, I.; Shukrullah, S.; Hussain, H.; Atif, M.; Legutko, S.; Petru, J.; Hatala, M.; Naz, M.Y.; Rahman, S. Construction of 0D/2D Schottky Heterojunctions of ZnO and Ti3C2 Nanosheets with the Enriched Transfer of Interfacial Charges for Photocatalytic Hydrogen Evolution. Materials 2022, 15, 4557. [Google Scholar] [CrossRef]
- Ahmad, I.; Shukrullah, S.; Naz, M.Y.; Ahmad, M.; Ahmed, E.; Liu, Y.; Hussain, A.; Iqbal, S.; Ullah, S. Recent advances and challenges in 2D/2D heterojunction photocatalysts for solar fuels applications. Adv. Colloid Interface Sci. 2022, 304, 102661. [Google Scholar] [CrossRef]
- Liang, W.J.; Fang, H.-P.; Li, J.; Zheng, F.; Li, J.X.; Jin, Y.Q. Performance of non-thermal DBD plasma reactor during the removal of hydrogen sulfide. J. Electrost. 2011, 69, 206–213. [Google Scholar] [CrossRef]
- Xing, C.; Zhang, Y.; Yan, W.; Guo, L. Band structure-controlled solid solution of Cd1-x ZnxS photocatalyst for hydrogen production by water splitting. Int. J. Hydrogen Energy 2006, 31, 2018–2024. [Google Scholar] [CrossRef]
- Reddy, E.L.; Biju, V.M.; Subrahmanyam, C. Production of hydrogen and sulfur from hydrogen sulfide assisted by nonthermal plasma. Appl. Energy 2012, 95, 87–92. [Google Scholar] [CrossRef]
- Hu, J.S.; Ren, L.L.; Guo, Y.G.; Liang, H.P.; Cao, A.M.; Wan, L.J.; Bai, C.L. Mass production and high photocatalytic activity of ZnS nanoporous nanoparticles. Angew. Chem. Int. Ed. 2005, 44, 1269–1273. [Google Scholar] [CrossRef]
- Chivers, T.; Lau, C. The use of thermal diffusion column reactors for the production of hydrogen and sulfur from the thermal decomposition of hydrogen sulfide over transition metal sulfides. Int. J. Hydrogen Energy 1987, 12, 561–569. [Google Scholar] [CrossRef]
- Kalamaras, C.M.; Efstathiou, A.M. Hydrogen production technologies: Current state and future developments. In Conference Papers in Science; Hindawi: London, UK, 2013; Volume 2013. [Google Scholar]
- Zhao, L.; Wang, Y.; Wang, A.; Li, X.; Song, C.; Hu, Y. Cr–doped ZnS semiconductor catalyst with high catalytic activity for hydrogen production from hydrogen sulfide in non-thermal plasma. Catal. Today 2019, 337, 83–89. [Google Scholar] [CrossRef]
Publisher’s Note: MDPI stays neutral with regard to jurisdictional claims in published maps and institutional affiliations. |
© 2022 by the authors. Licensee MDPI, Basel, Switzerland. This article is an open access article distributed under the terms and conditions of the Creative Commons Attribution (CC BY) license (https://creativecommons.org/licenses/by/4.0/).

