
Experimental Research and Optimization of Ti-6Al-4V Alloy Microgroove Machining Based on Waterjet-Guided High-Power Laser
 ,
,
Abstract
:1. Introduction
2. Equipment and Mechanism
2.1. Materials
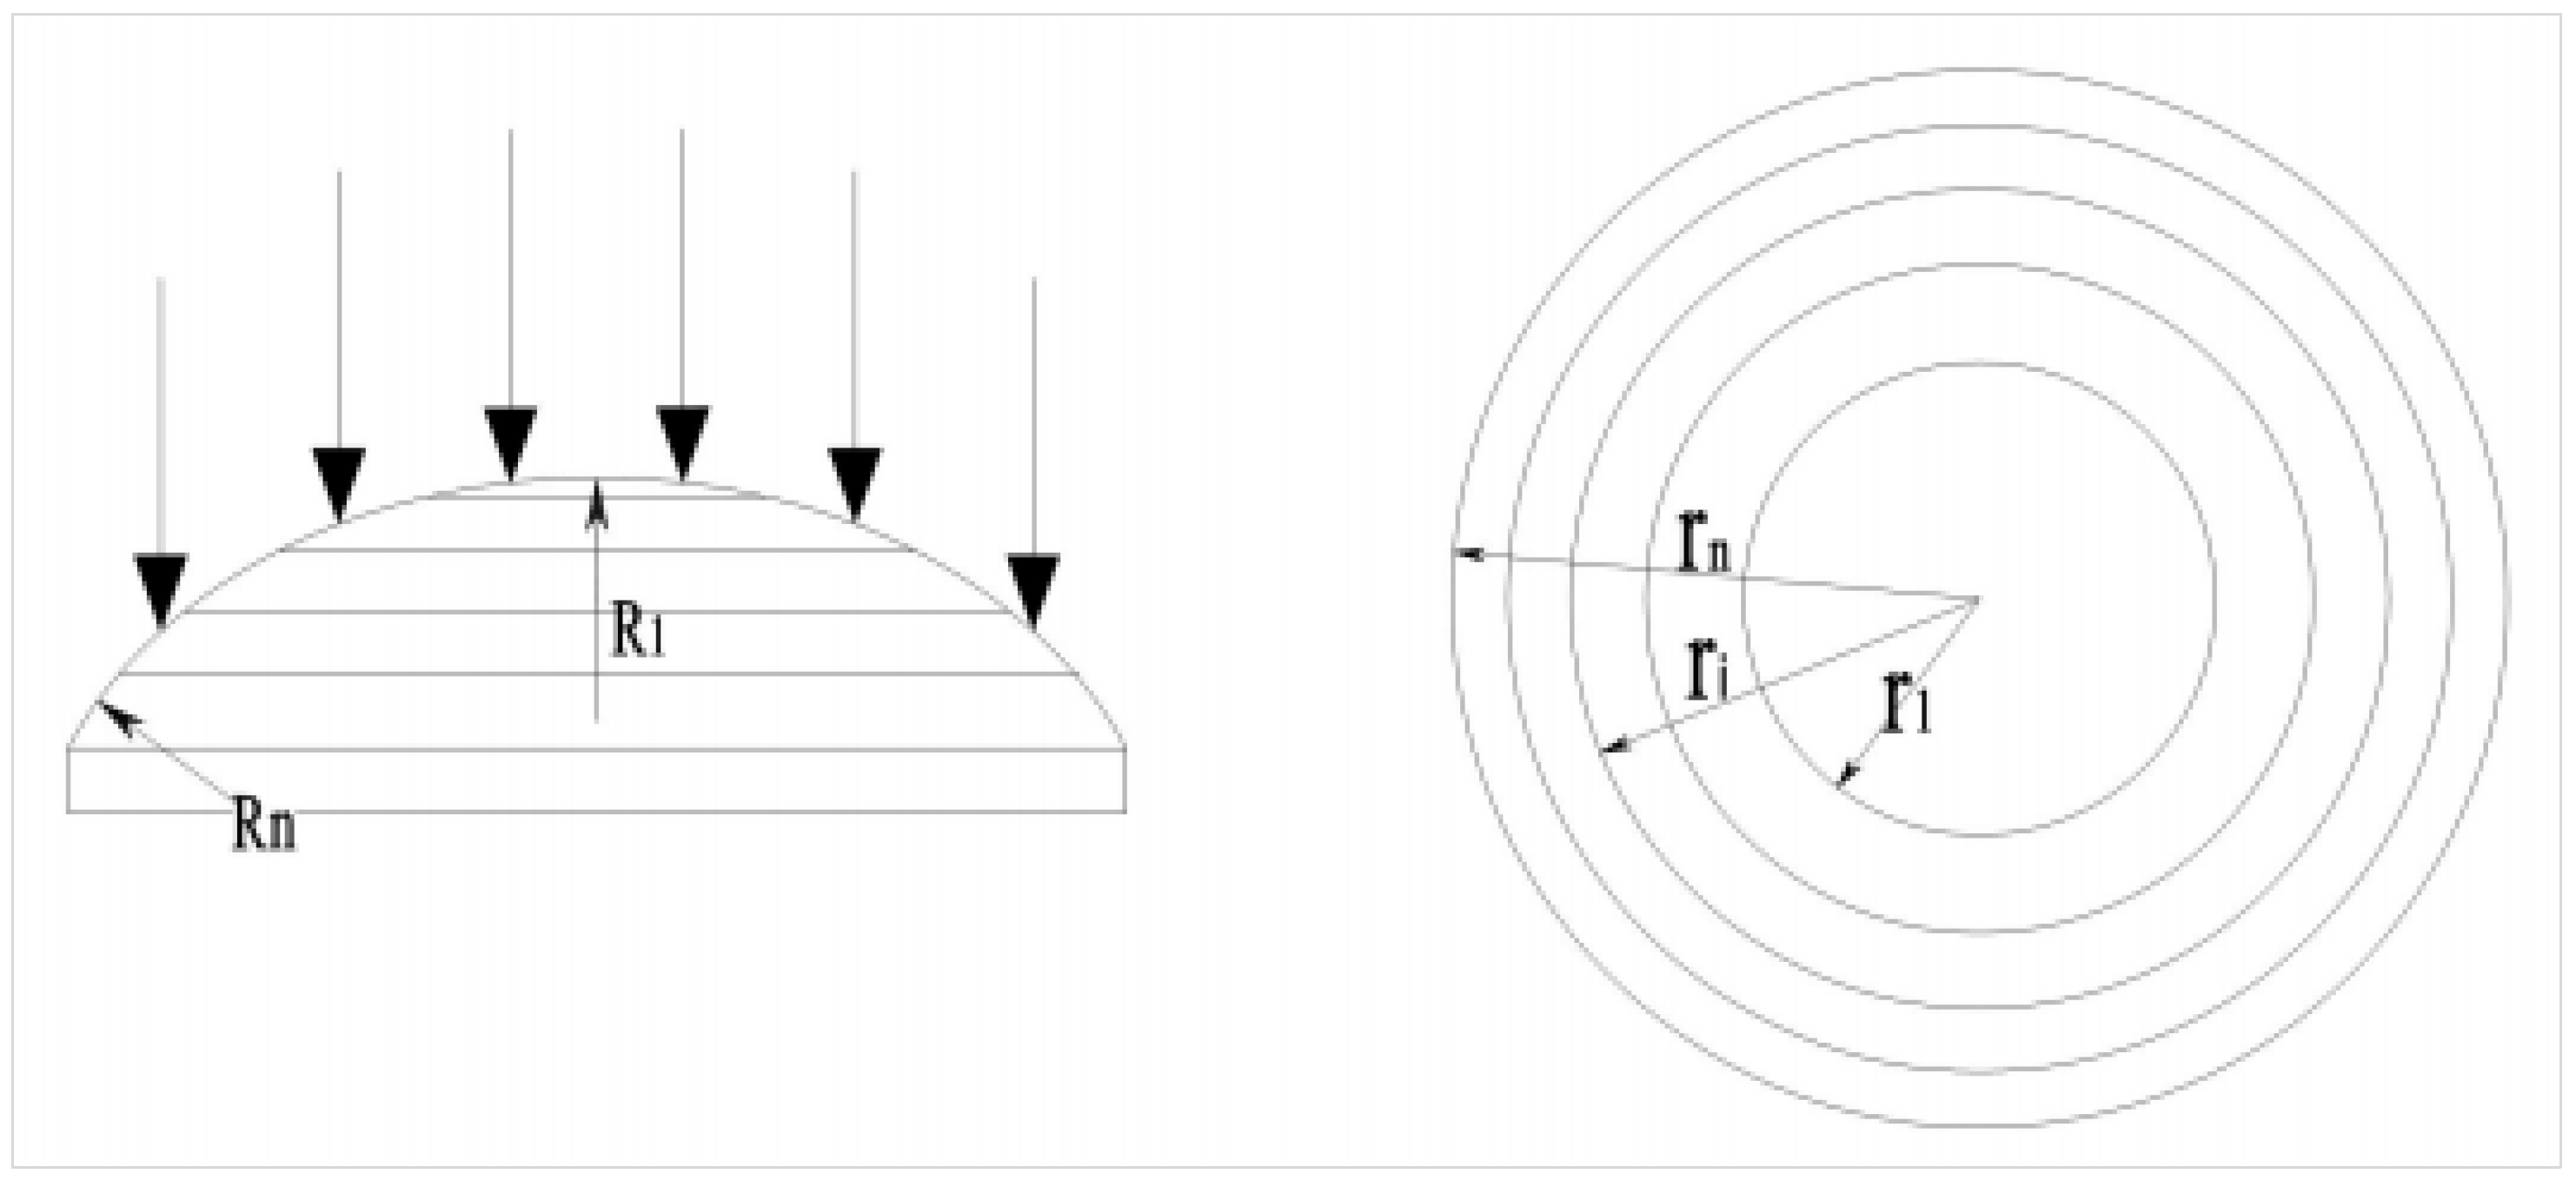
2.2. Mechanism
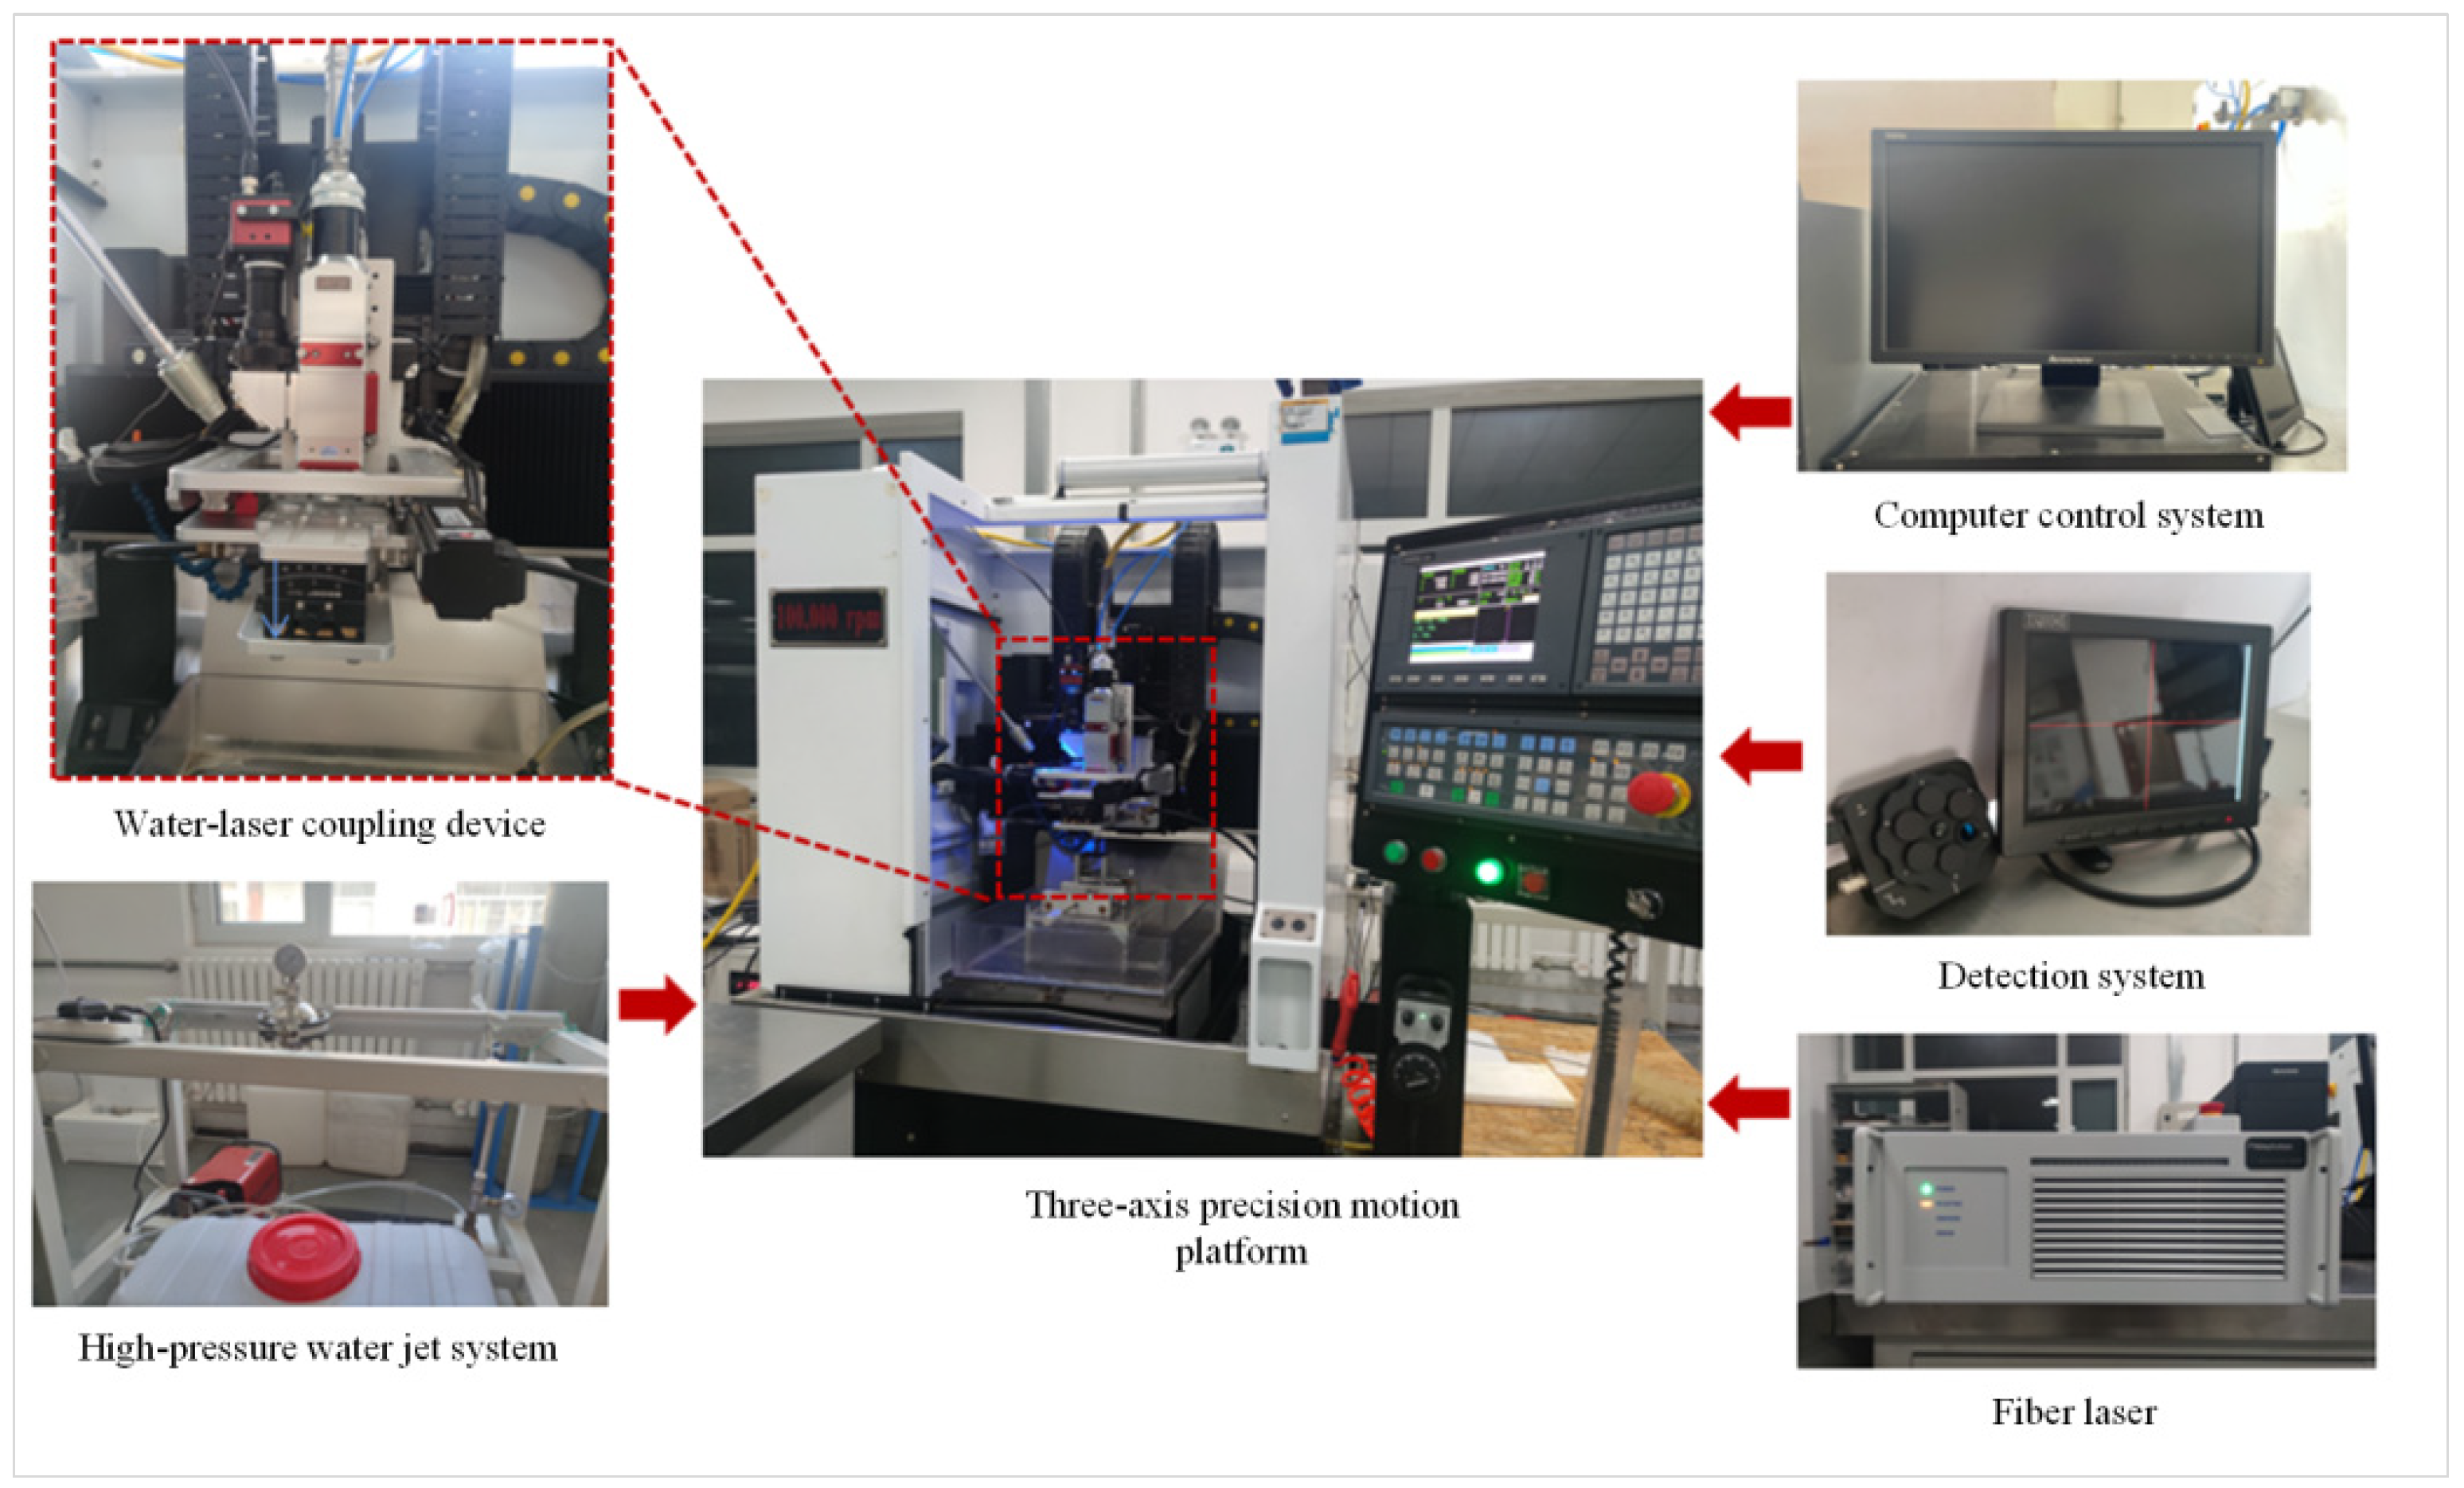
2.3. Equipment
3. Design of Experiment
3.1. Single-Factor Experiments
3.2. Response Surface Methodology Experiments
4. Results and Discussion
4.1. Analysis of Single-Factor Experimental Results
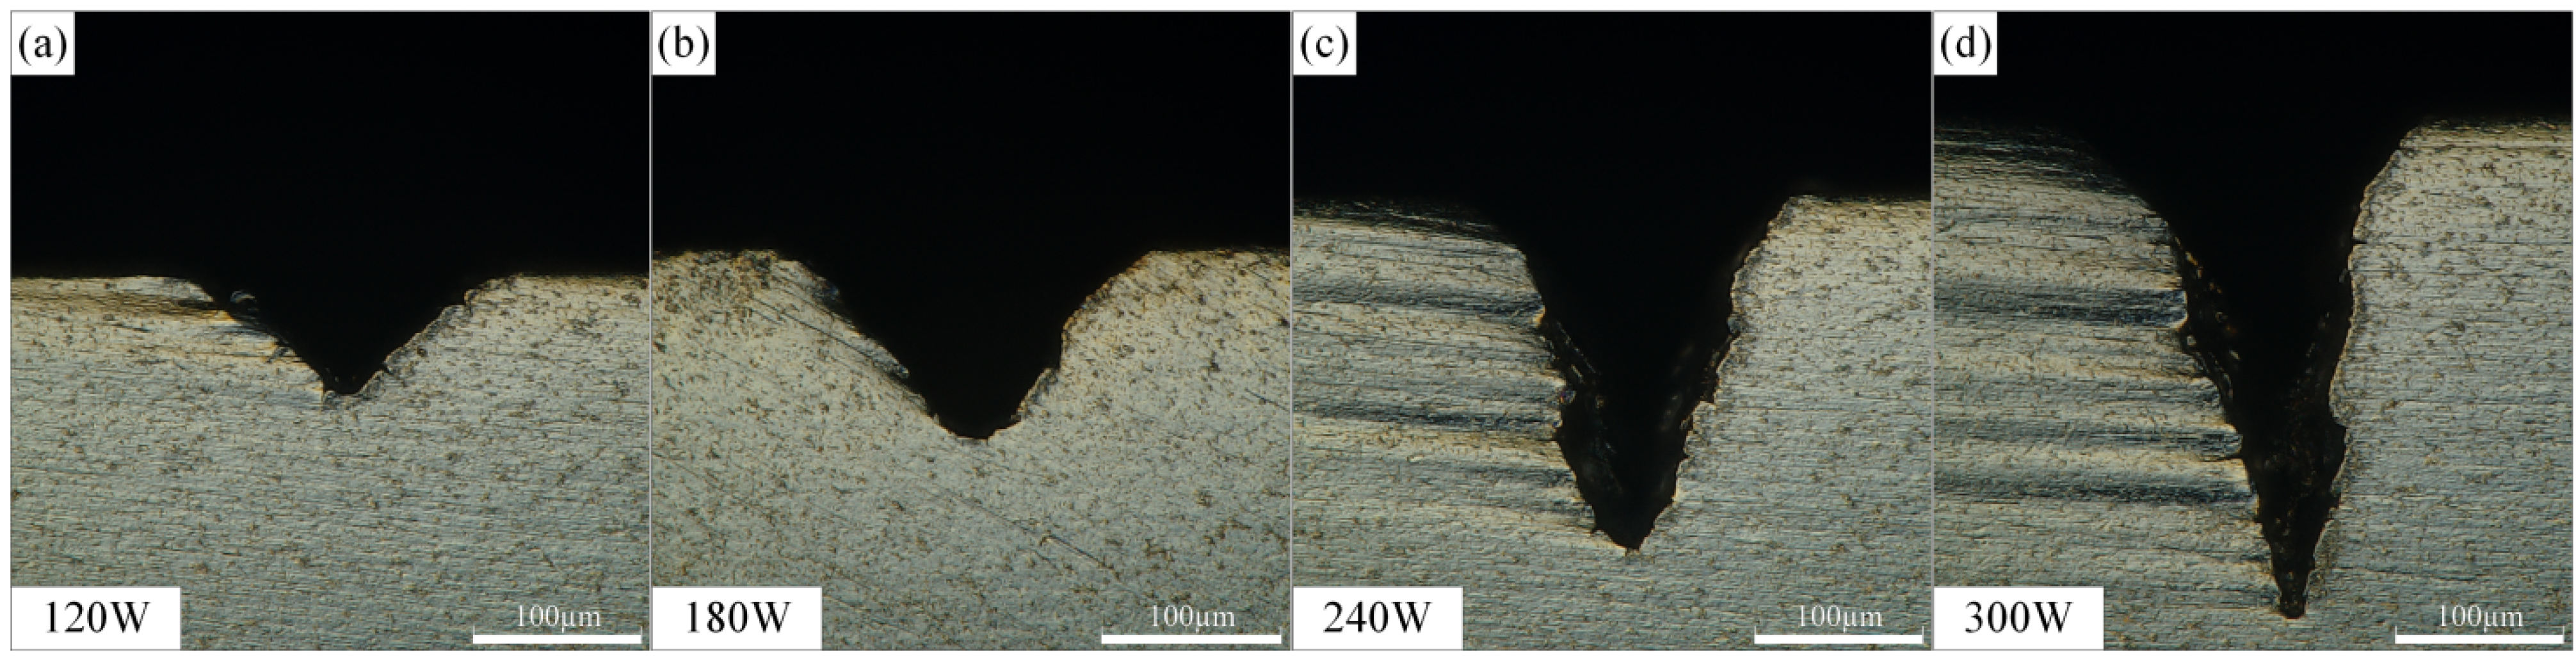
4.1.1. The Effect of Laser Power on the Microgroove Morphology
4.1.2. The Effect of Cutting Speed on the Microgroove Morphology
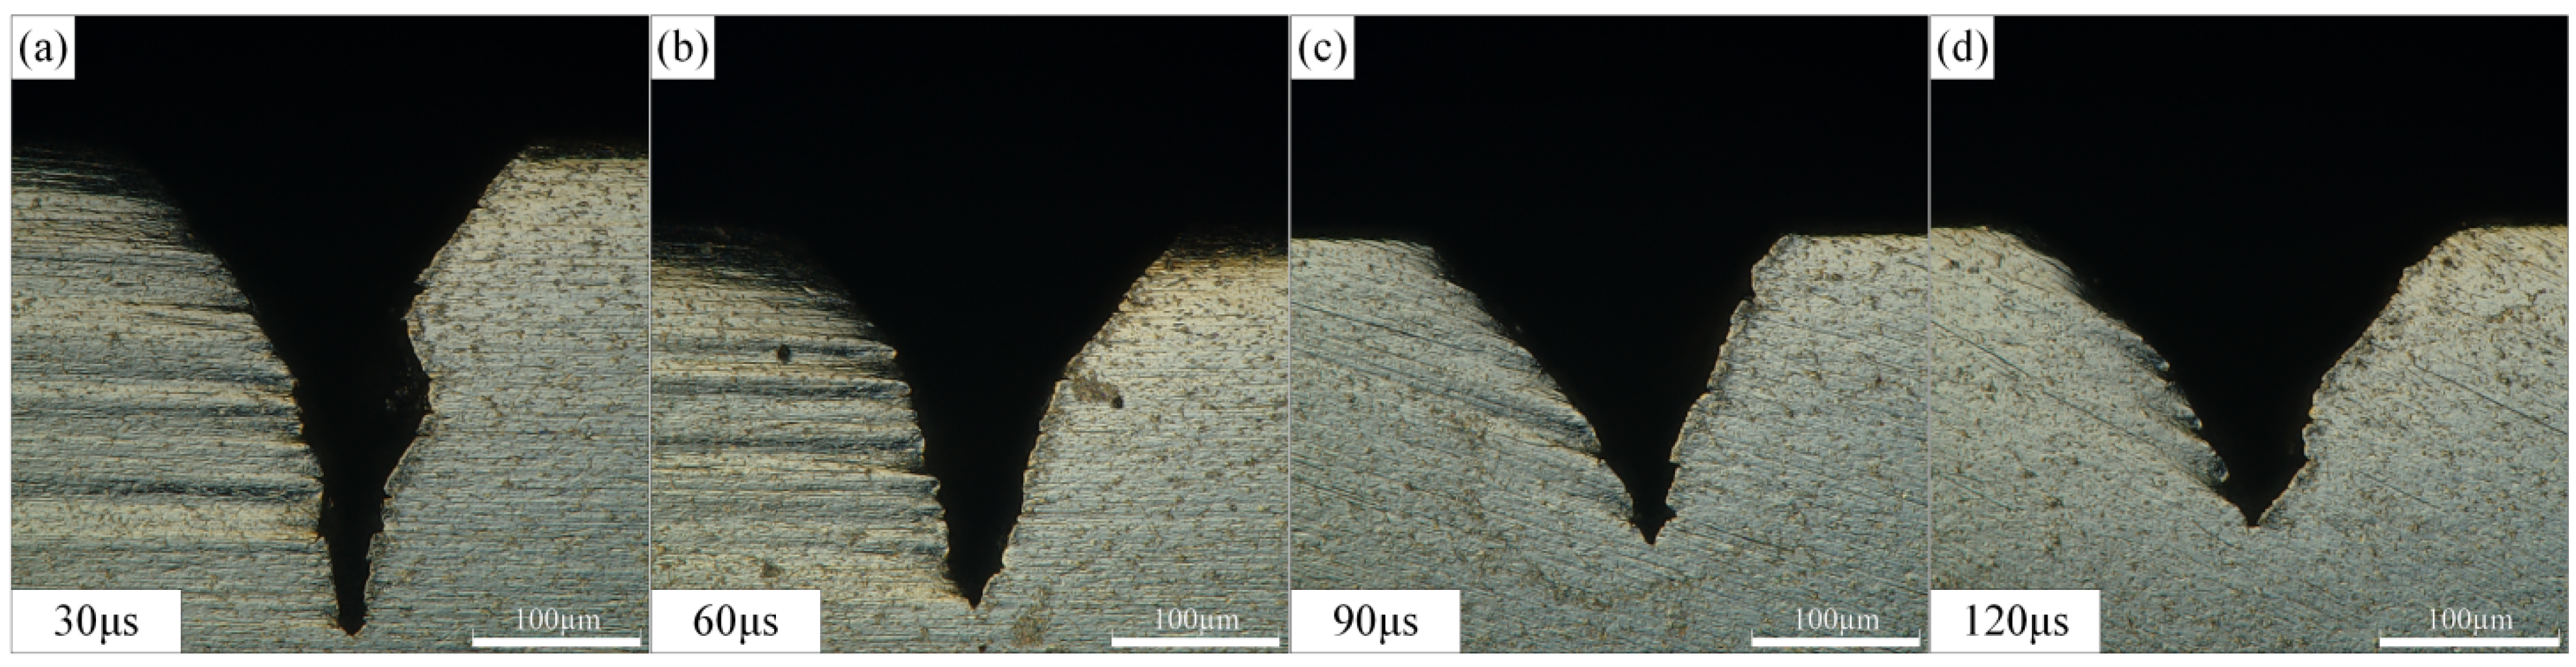
4.1.3. The Effect of Laser Pulse Width on the Microgroove Morphology
4.1.4. The Effect of Water Pressure on the Microgroove Morphology
4.2. Analysis of Response Surface Experiment Results
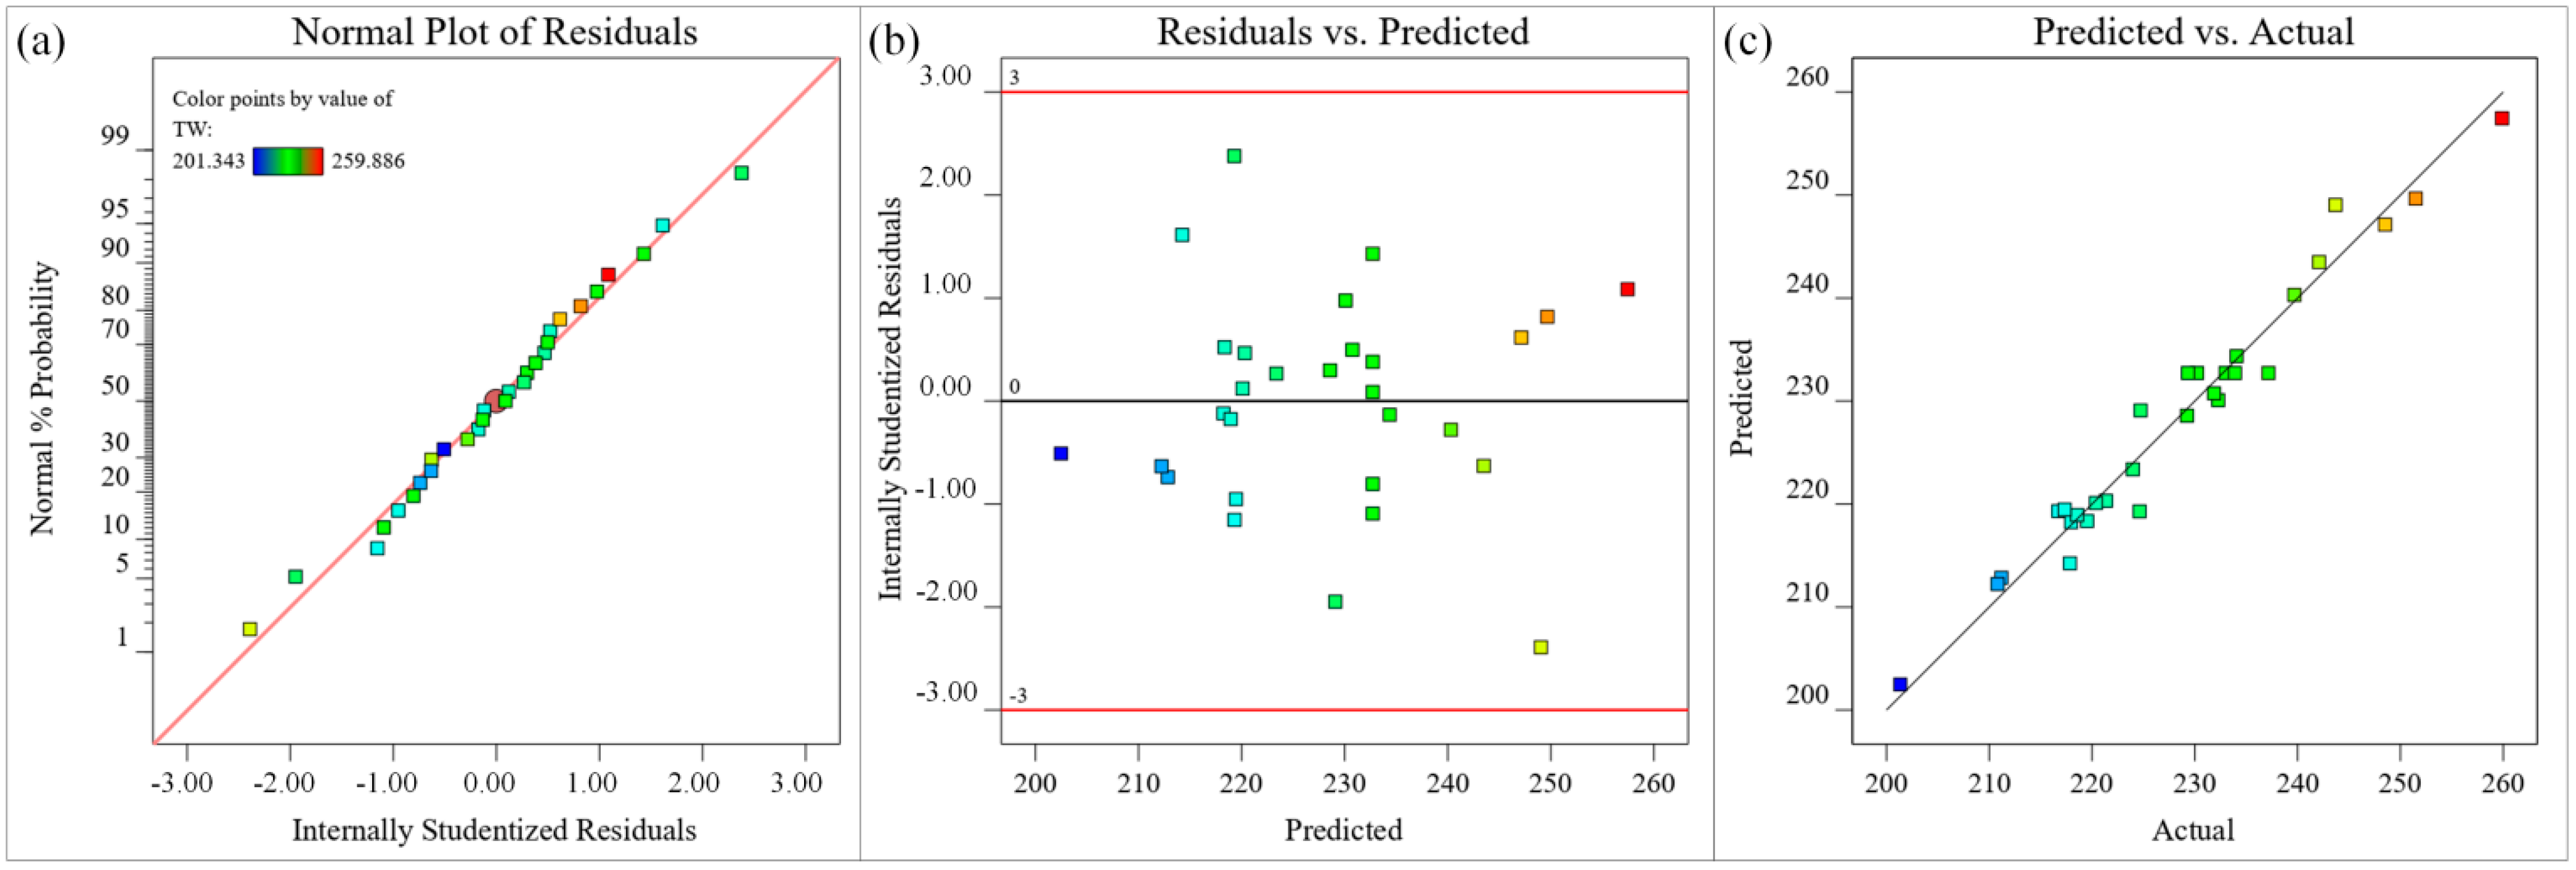
4.2.1. Regression Model and ANOVA
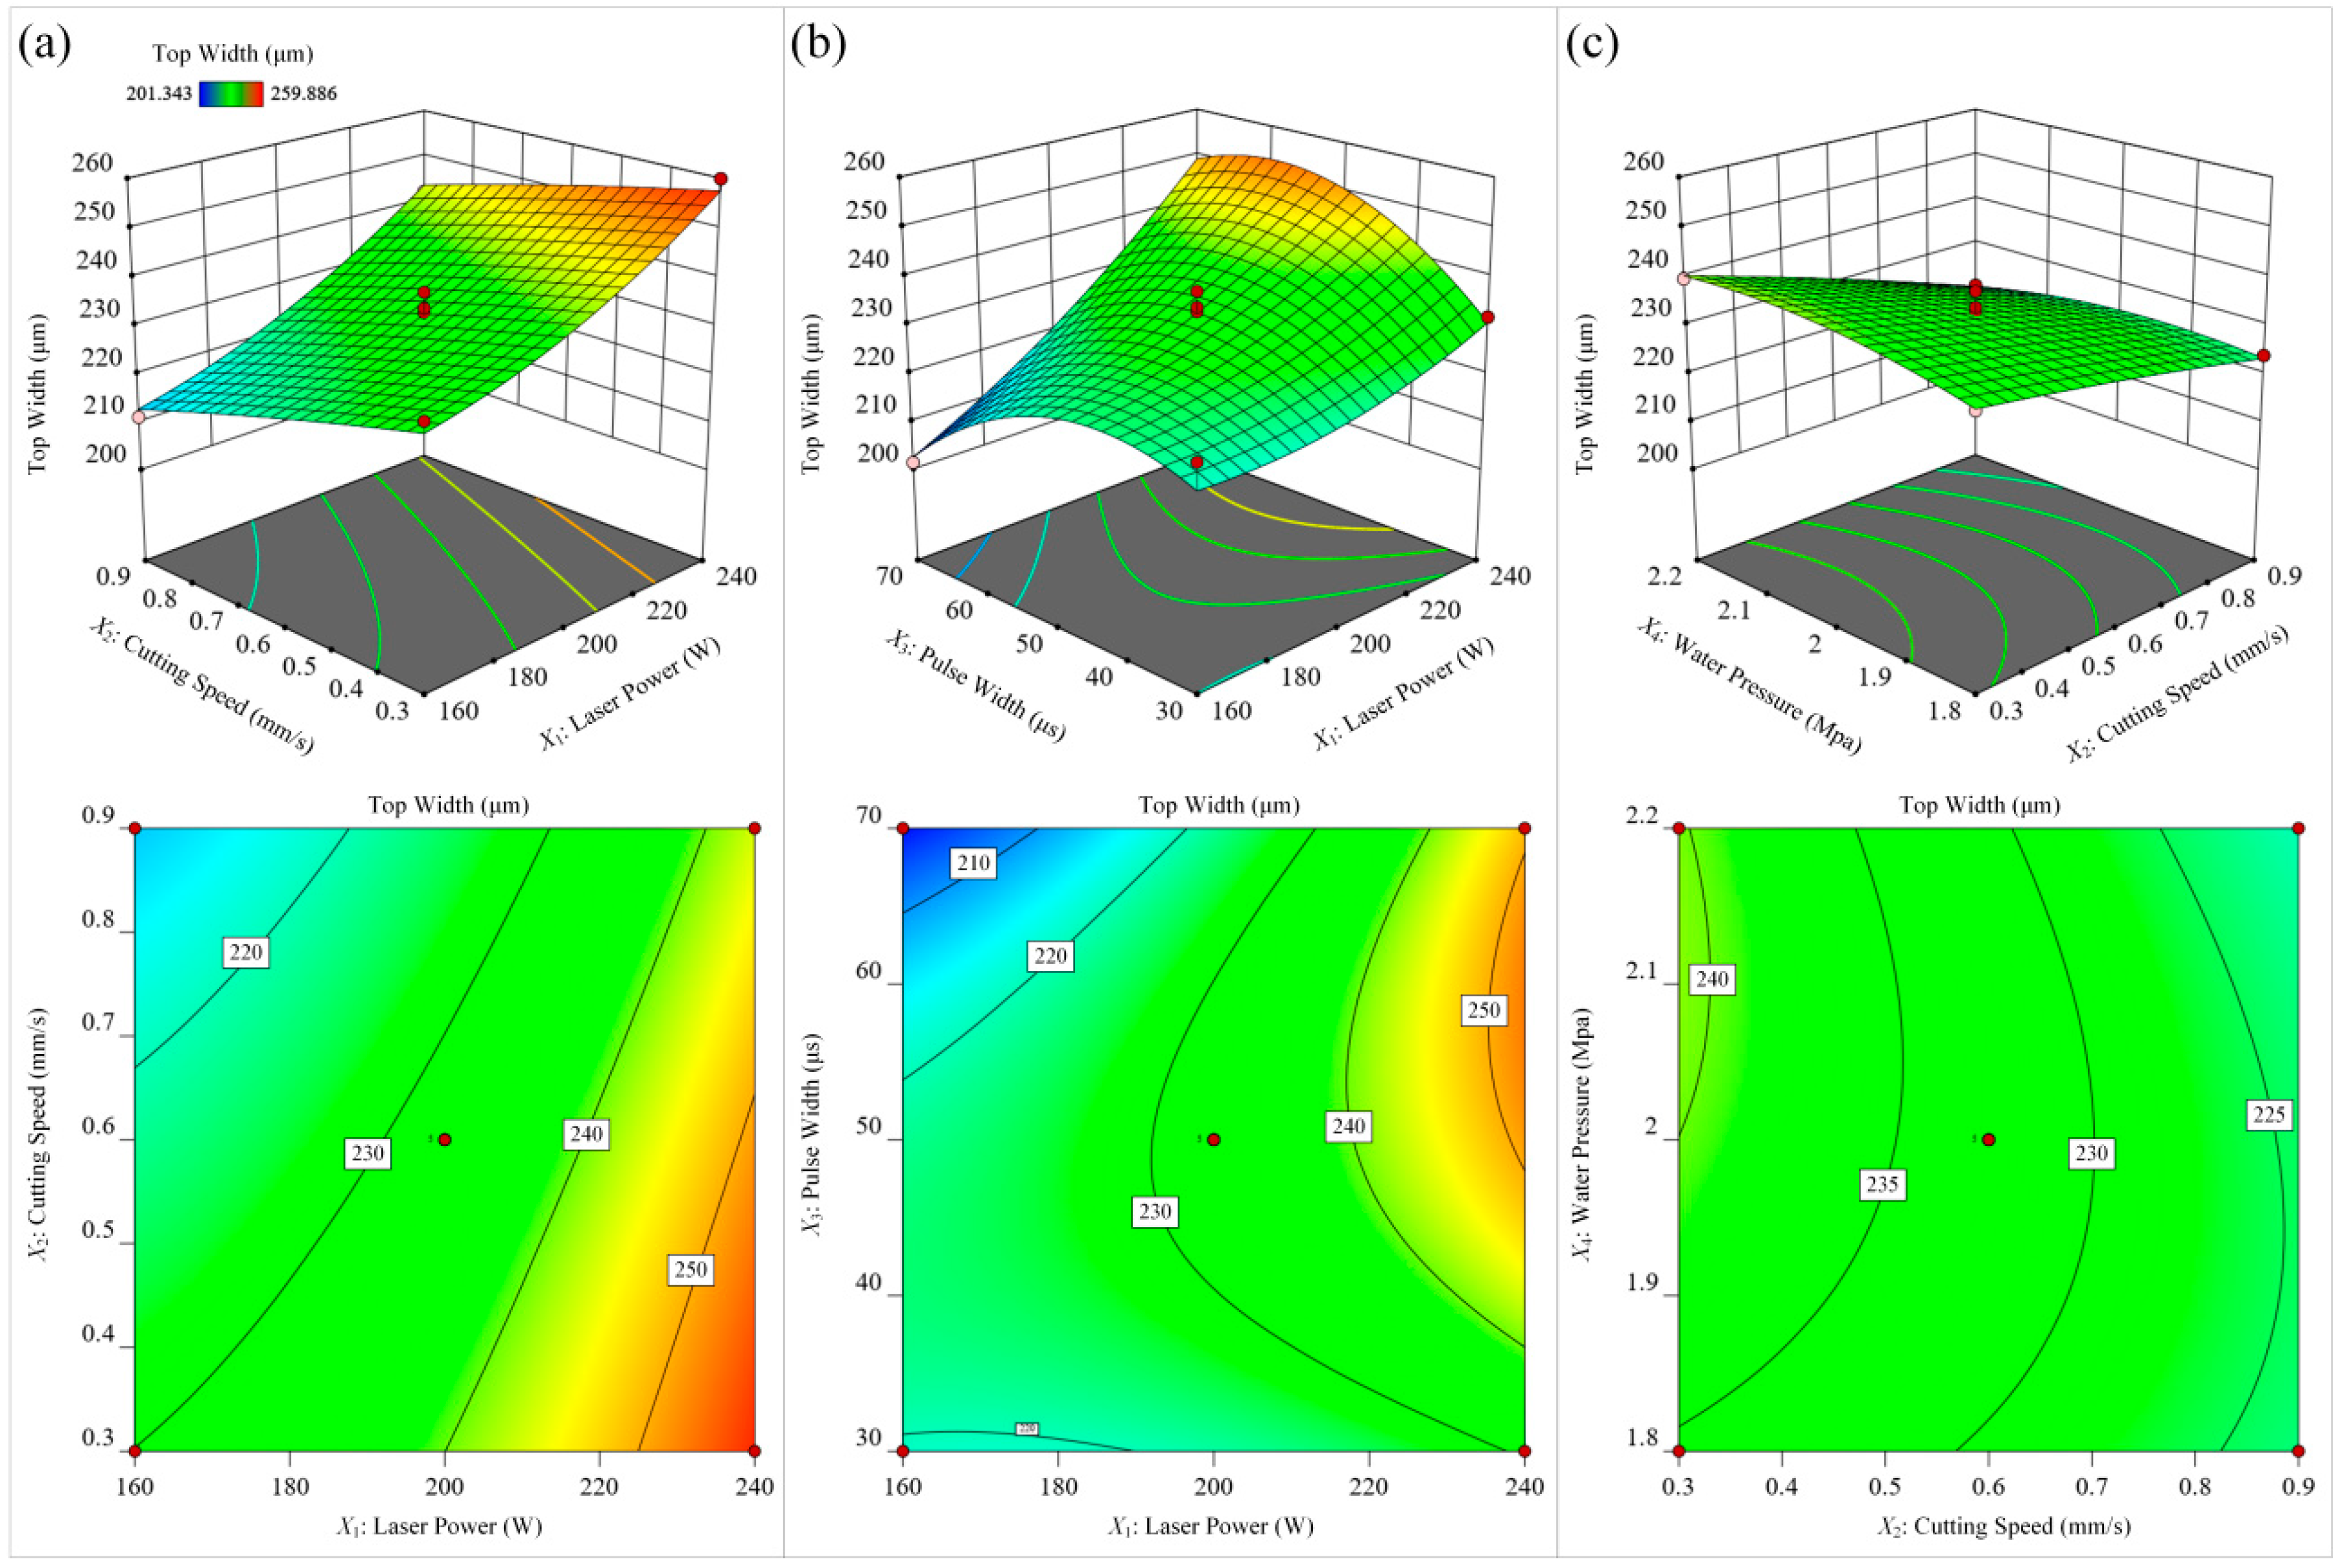
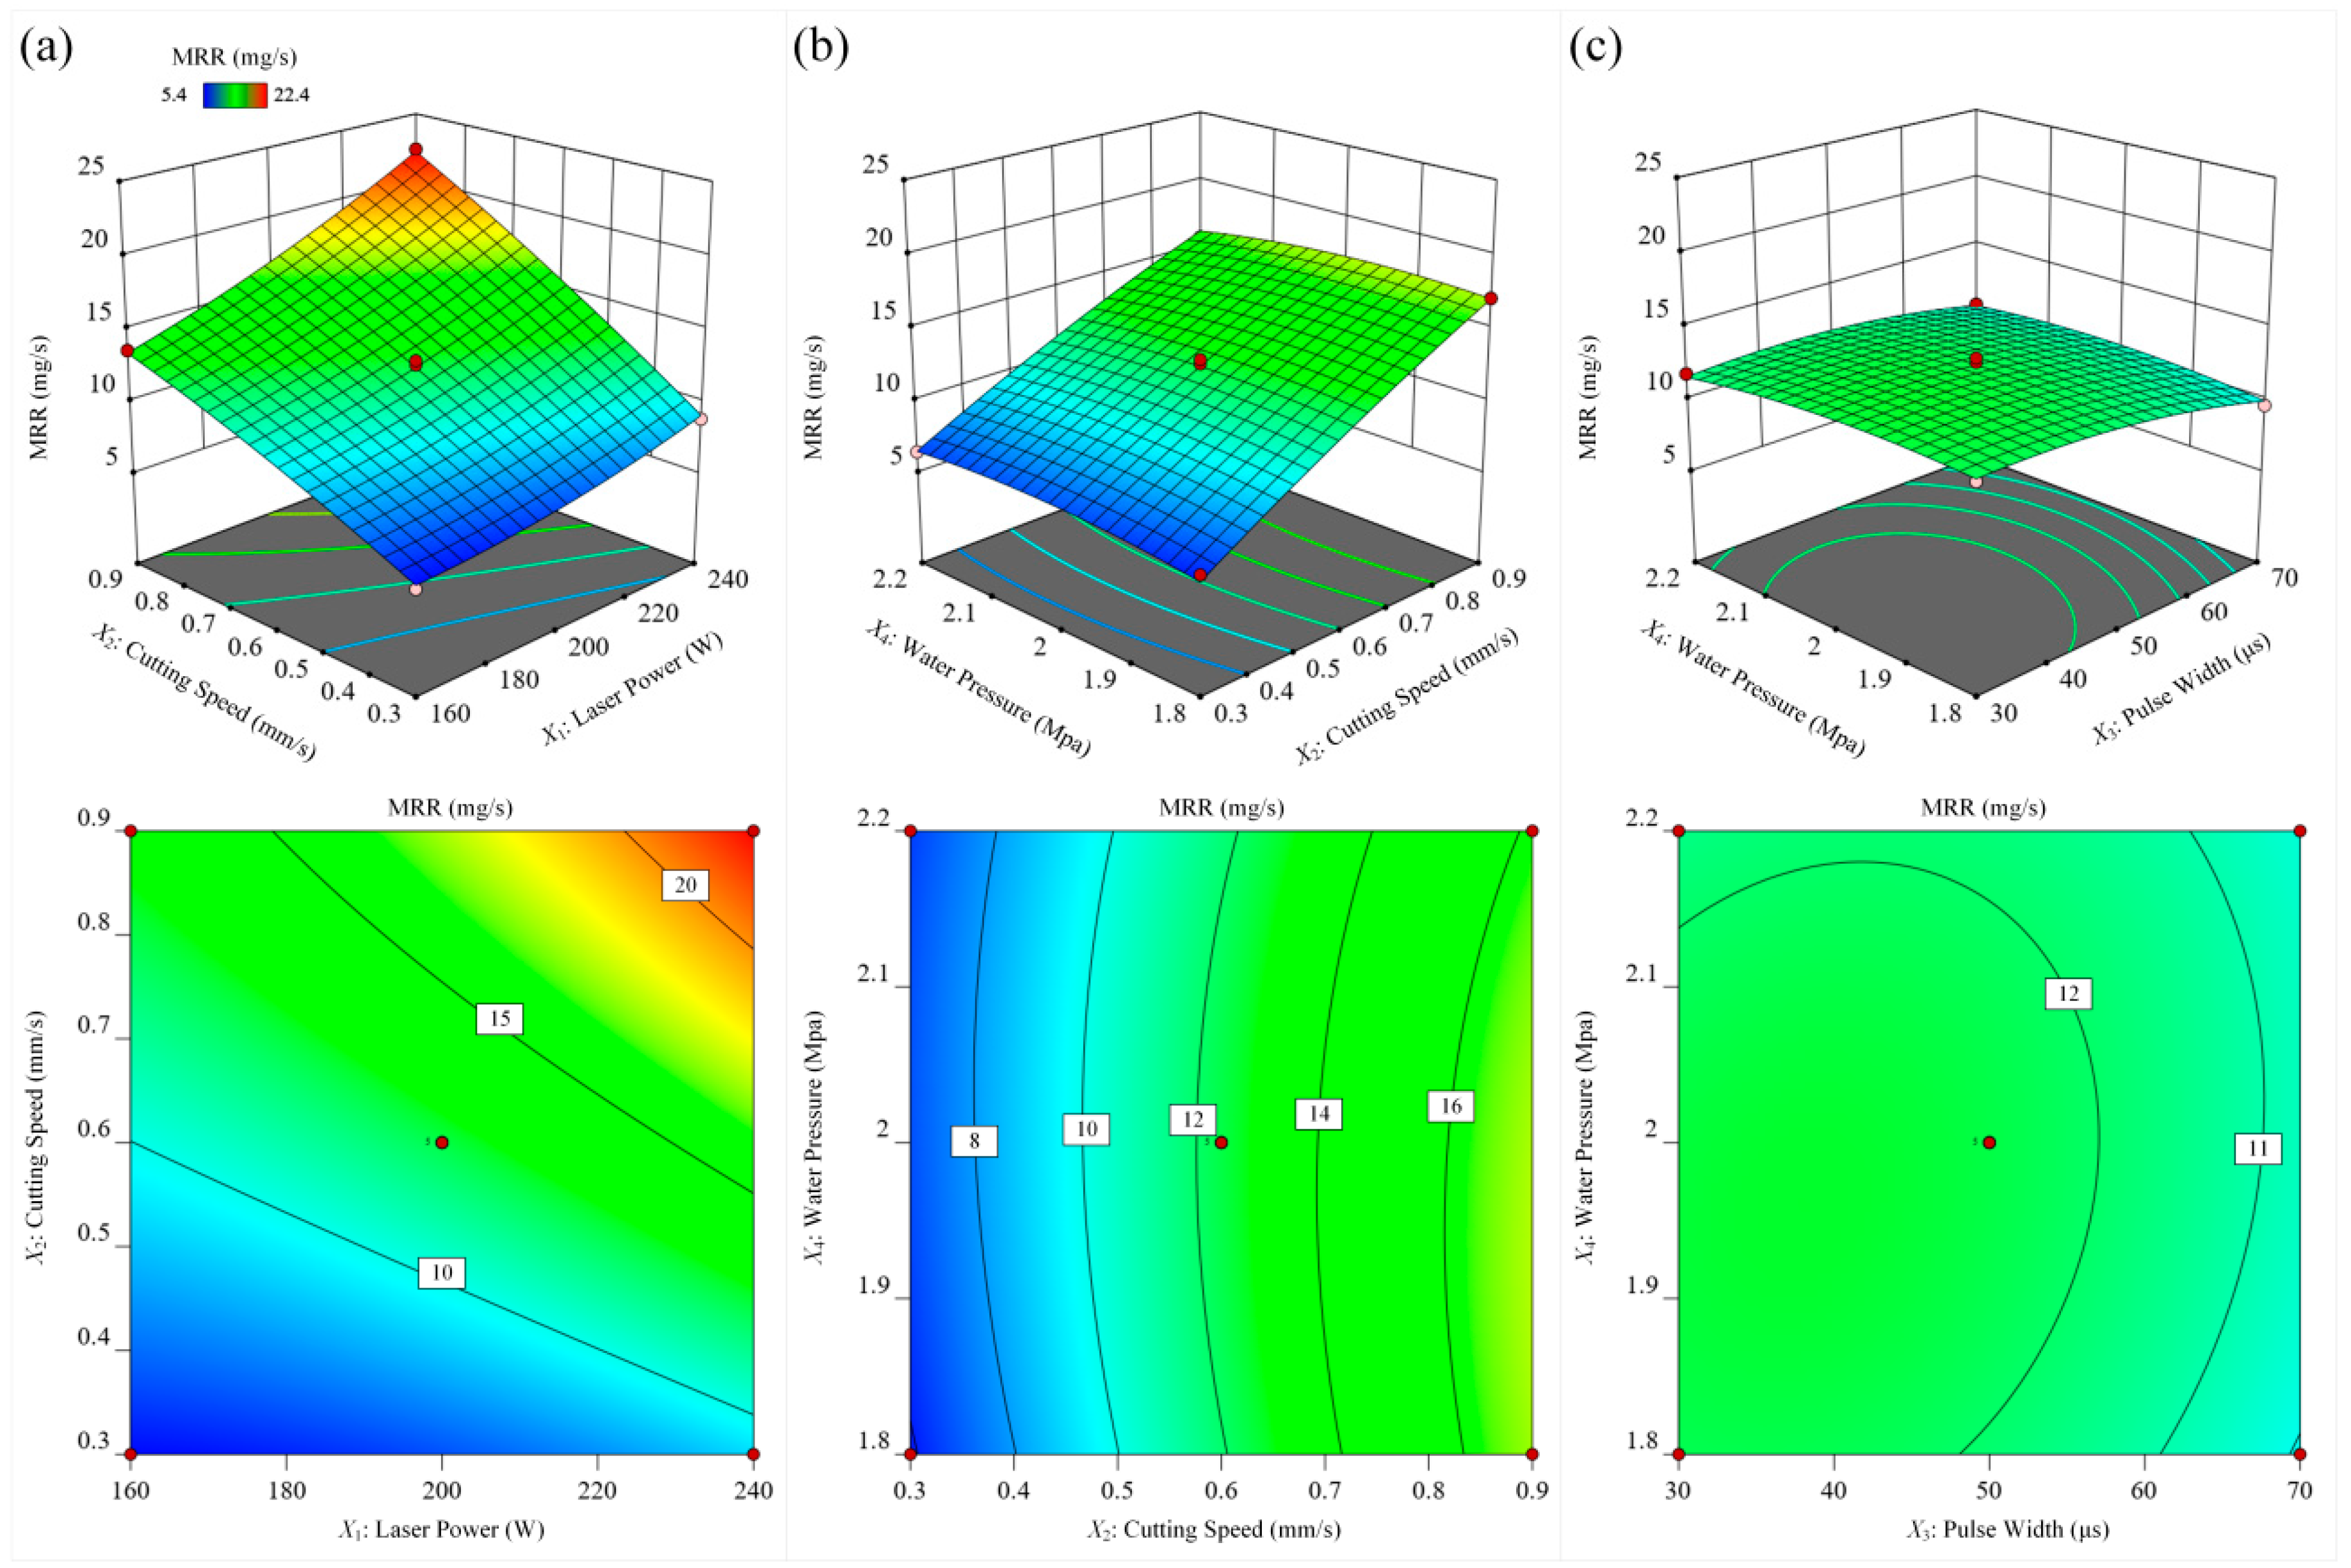
4.2.2. Influence of Process Parameters on Response
4.3. Parameter Optimization and Experimental Verification
- The instability and system error of the test equipment.
- There is an error between the actual process parameters and the predicted process parameters.
- The defect of the optimization method itself leads to the error.
5. Results and Discussion
- This paper proposed a method of “using an aspheric multifocus lens instead of a spherical single-focus lens to reduce the energy density of the focused spot at the water–laser coupling point and avoid gas explosion disturbance”, thus realizing waterjet-guided high-power laser processing.
- According to the results of the single-factor experiment, it was determined that the parameters such as laser power, cutting speed, and laser pulse width have a significant effect on the depth and top width of the microgroove, but have no significant effect on the HAZ and surface roughness of the microgroove. The water pressure has a significant effect on the stability of the water beam fiber, which in turn affects the transmission efficiency of the laser energy, thereby affecting the surface morphology of the microgroove.
- In this paper, the quadratic regression model of laser power, cutting speed, laser pulse width, and water pressure on the index was established with the microgroove depth, microgroove top width, and MRR as the evaluation indexes, and the variance analysis was used to verify the good fitting effect. The 3D surface map and contour map reflect the influence law of different process parameters on the evaluation index and their interaction relationship.
- In this paper, through multiobjective optimization, microgrooves with high aspect ratio, high processing efficiency, and excellent surface quality were obtained. The optimal process parameters are as follows: laser power is 238.6 W, cutting speed is 0.90 mm/s, laser pulse width is 36.8μs, and water pressure is 2.13 MPa. The Ti-6Al-4V alloy microgrooves with good morphology were fabricated by using the optimized process parameters. The actual depth, top width, and MRR of the microgrooves were 467.257 μm, 230.727 μm, and 20.351 mg/s, respectively. The prediction error was within the acceptable range.
Author Contributions
Funding
Institutional Review Board Statement
Informed Consent Statement
Data Availability Statement
Acknowledgments
Conflicts of Interest
References
- Li, Z.Y.; Liu, X.L.; Wu, G.Q.; Huang, Z. Fretting fatigue behavior of Ti-6Al-4V and Ti-10V-2Fe 3Al alloys. Met. Mater. Int. 2019, 25, 64–70. [Google Scholar] [CrossRef]
- Hamza, H.M.; Deen, K.M.; Haider, W. Microstructural examination and corrosion behavior of selective laser melted and conventionally manufactured Ti6Al4V for dental applications. Mater. Sci. Eng. C 2020, 113, 110980. [Google Scholar] [CrossRef] [PubMed]
- Liu, S.; Shi, Y.C. Additive manufacturing of Ti6Al4V alloy: A review. Mater. Des. 2019, 164, 107552. [Google Scholar] [CrossRef]
- Froend, M.; Fomin, F.; Riekehr, S.; Alvarez, P.; Zubiri, F.; Bauer, S.; Klusemann, B.; Kashaev, N. Fiber laser welding of dissimilar titanium (Ti-6Al-4V/cp-Ti) T-joints and their laser forming process for aircraft application. Opt. Laser Technol. 2017, 96, 123–131. [Google Scholar] [CrossRef]
- Sun, Z.P.; He, G.Y.; Meng, Q.J.; Li, Y.; Tian, X. Corrosion mechanism investigation of TiN/Ti coating and TC4 alloy for aircraft compressor application. Chin. J. Aeronaut. 2020, 33, 256–267. [Google Scholar] [CrossRef]
- Mandlenkosi, G.M.; Lethu, C.; Peter, A.O. Study of the corrosion properties of powder rolled Ti-6Al-4V alloy applied in the biomedical implants. J. Mater. Res. Technol. 2022, 18, 3631–3639. [Google Scholar]
- El-Hossary, F.M.; Negm, N.Z.; Abd El-Rahman, A.M.; Seleem, A.A.; Abd El-Moula, A.A. Tribo-mechanical and electrochemical properties of plasma nitriding titanium. Surf. Coat. Technol. 2015, 276, 658–667. [Google Scholar] [CrossRef]
- Ju, J.; Zhao, C.; Kang, M.; Li, J.; He, L.; Wang, C.; Li, J.; Fu, H.; Wang, J. Effect of heat treatment on microstructure and tribological behavior of Ti-6Al-4V alloys fabricated by selective laser melting. Tribol. Int. 2021, 159, 106996. [Google Scholar]
- Niu, R.; Li, J.; Wang, Y.; Chen, J.; Xue, Q. Structure and tribological behavior of GLCH/nitride coupled coatings on Ti6Al4V by nitriding and magnetron sputtering. Diam. Relat. Mater. 2016, 64, 70–79. [Google Scholar] [CrossRef]
- Wang, L.; Yang, L.; Huang, Y.; Yuan, Y.; Jia, C. Effects of Y2O3 addition on the microstructure and wear-resistant performance of TiN/TiB-reinforced Ti-based laser-clad coatings on Ti-6Al-4V alloys. Mater. Today Commun. 2021, 29, 102752. [Google Scholar] [CrossRef]
- He, D.; Zheng, S.; Pu, J.; Zhang, G.; Hu, L. Improving tribological properties of titanium alloys by combining laser surface texturing and diamond-like carbon film. Tribol. Int. 2015, 82, 20–27. [Google Scholar] [CrossRef]
- Fatoba, O.S.; Adesina, O.S.; Popoola, A.P.I. Evaluation of microstructure, microhardness, and electrochemical properties of laser-deposited Ti-Co coatings of Ti-6Al-4V alloy. Int. J. Adv. Manuf. Technol. 2018, 97, 2341–2350. [Google Scholar] [CrossRef]
- Sibisi, P.N.; Popoola AP, I.; Kanyane, L.R.; Fatoba, O.S.; Adesina, O.S.; Arthur, N.K.; Pityana, S.L. Microstructure and microhardness characterization of CpTi/SiAlON composite coatings on Ti-6Al-4V by laser cladding. Procedia Manuf. 2019, 35, 272–277. [Google Scholar] [CrossRef]
- Gao, Q.S.; Yan, H.; Qin, Y.; Zhang, P.; Guo, J.; Chen, Z.; Yu, Z. Laser cladding Ti-Ni/TiN/TiW + TiS/WS2 self-lubricating wear resistant composite coating on Ti-6Al-4V alloy. Opt. Laser Technol. 2019, 113, 182–191. [Google Scholar] [CrossRef]
- Sun, Q.; Hu, T.; Fan, H.; Zhang, Y.; Hu, L. Thermal oxidation behavior and tribological properties of textured TC4 surface: Influence of thermal oxidation temperature and time. Tribol. Int. 2016, 94, 479–489. [Google Scholar] [CrossRef]
- Wang, C.C.; Li, Z.P.; Zhao, H.; Zhang, G.; Ren, T.; Zhang, Y. Enhanced anticorrosion and antiwear properties of Ti-6Al-4V alloys with laser texture and graphene oxide coatings. Tribol. Int. 2020, 152, 106475. [Google Scholar] [CrossRef]
- Sugihara, T.; Singh, P.; Enomoto, T. Development of novel cutting tools with dimple textured surfaces for dry machining of aluminum alloys. Procedia Manuf. 2017, 14, 111–117. [Google Scholar] [CrossRef]
- Adeyemi, K.; Sun, B.; Xue, W.; Liu, W.; Cao, Y. Friction and wear characteristics modification via laser surface textured grooves. Surf. Eng. 2021, 37, 658–668. [Google Scholar] [CrossRef]
- Wang, C.; Hong, J.; Cui, M.; Huang, H.; Zhang, L.; Yan, J. The effects of simultaneous laser nitriding and texturing on surface hardness and tribological properties of Ti6Al4V. Surf. Coat. Technol. 2022, 437, 128358. [Google Scholar] [CrossRef]
- Bonse, J.; Kirner, S.V.; Griepentrog, M.; Spaltmann, D.; Krüger, J. Femtosecond laser texturing of surfaces for tribological applications. Materials 2018, 11, 801. [Google Scholar] [CrossRef] [Green Version]
- Khanh, P.L.; Rie, T.; Noboru, Y.; Yoshiro, I. Laser-Assisted Wet Etching of Silicon Back Surfaces Using 1552nm Femtosecond Laser. Int. J. Electr. Mach. 2020, 25, 7–13. [Google Scholar]
- Kumar, M.; Melkote, S.N. Process capability study of laser assisted micro milling of a hard-to-machine material. J. Manuf. Process. 2012, 14, 41–51. [Google Scholar] [CrossRef]
- Feng, S.; Huang, C.; Wang, J.; Jia, Z. Surface quality evaluation of single crystal 4H-SiC wafer machined by hybrid laser-waterjet: Comparing with laser machining. Mater. Sci. Semicond. Process. 2019, 93, 238–251. [Google Scholar] [CrossRef]
- Porter, J.A.; Louhisalmi, Y.A.; Karjalainen, J.A.; Füger, S. Cutting thin sheet metal with a water jet guided laser using various cutting distances, feed speeds and angles of incidence. Int. J. Adv. Manuf. Technol. 2007, 33, 961–967. [Google Scholar] [CrossRef]
- Mulick, S.; Madhukar, Y.K.; Roy, S.; Nath, A.K. Performance optimization of water-jet assisted underwater laser cutting of AISI 304 stainless steel sheet. Opt. Lasers Eng. 2016, 83, 32–47. [Google Scholar] [CrossRef]
- Madhukar, Y.K.; Mullick, S.; Nath, A.K. A study on co-axial water-jet assisted fiber laser grooving of silicon. J. Mater. Process. Technol. 2016, 227, 200–215. [Google Scholar] [CrossRef]
- Adelmann, B.; Ngo, C.; Hellmann, R. High aspect ratio cutting of metals using water jet guided laser. Int. J. Adv. Manuf. Technol. 2015, 80, 2053–2060. [Google Scholar] [CrossRef]
- Sun, D.; Han, F.; Ying, W. The experimental investigation of water jet-guided laser cutting of CFRP. Int. J. Adv. Manuf. Technol. 2019, 201, 719–729. [Google Scholar] [CrossRef]
- Tohidifar, M.R. On the analysis and optimization of lithi um-mica nano-crystallites using a statistical technique. Mater. Charact. 2017, 127, 333–341. [Google Scholar] [CrossRef]
- Loutas, T.H.; Kliafa, P.M.; Sotiriadis, G.; Kostopoulos, V. Investigation of the effect of green laser pre-treatment of aluminum alloys through a design-of-experiments approach. Surf. Coat. Technol. 2019, 375, 370–382. [Google Scholar] [CrossRef]
- Zhao, W.; Ma, A.; Ji, J.; Chen, X.; Yao, T. Multiobjective Optimization of a Double-Side Linear Vernier PM Motor Using Response Surface Method and Differential Evolution. IEEE Trans. Ind. Electron. 2020, 67, 80–90. [Google Scholar] [CrossRef]
- Xing, Y.; Liu, L.; Hao, X.; Wu, Z.; Huang, P.; Wang, X. Micro-channels machining on polycrystalline diamond by nanosecond laser. Opt. Laser Technol. 2018, 108, 333–345. [Google Scholar] [CrossRef]
- Mohammec, B.S.; Khed, V.C.; Nuruddin, M.F. Rubbercrete mixture optimization using response surface methodology. J. Clean. Prod. 2018, 171, 1605–1621. [Google Scholar] [CrossRef]
- Liu, Q.; Zhao, Y.; Meng, J.; Zhao, G.; Zhou, H.; Li, L.; Wang, K.; Liu, G.; Cao, C.; Zheng, Z. Effect of static alignment deviation on coupling efficiency and beam quality of water beam fiber. Appl. Opt. 2022, 61, 1994–2006. [Google Scholar] [CrossRef] [PubMed]
- Liu, Q.; Zhao, Y.; Meng, J.; Zhao, G.; Li, L.; Zhou, H.; Wang, K.; Liu, G.; Cao, C.; Zheng, Z. Research on the influence of water-laser coupling cavity and nozzle structure on the flow characteristics of water beam fiber. Iran. J. Sci. Technol. Trans. Mech. Eng. 2022, 48, 1–18. [Google Scholar] [CrossRef]


| Element | Al | V | Fe | C | H | N | O | Ti |
|---|---|---|---|---|---|---|---|---|
| Mass Fraction/% | 5.5~6.8 | 3.5~4.5 | ≤0.30 | ≤0.10 | ≤0.015 | ≤0.20 | ≤0.20 | Bal. |
| Values | Hardness (GPa) | Modulus (GPa) | Tensile Strength (MPa) | Yield Stress (MPa) | Poisson Ration |
|---|---|---|---|---|---|
| Ti-6Al-4V | 4.01 | 126 | 910 | 830 | 0.34 |
| Parameter | Value |
|---|---|
| Wavelength/nm | 1064 |
| Laser power/W | ≤2000 |
| Pulse width/µs | ≥50 |
| Scan speed/(mm·s−1) | ≤1000 |
| Focal length/mm | 98~100 |
| Number of focus points | 5 |
| Water beam fiber diameter/mm | 0.3 |
| Serial Number | Laser Power (W) | Cutting Speed (mm/s) | Pulse Width (μs) | Water Pressure (MPa) | Processing Times |
|---|---|---|---|---|---|
| 1 | 120 | 0.5 | 50 | 2.0 | 1 |
| 2 | 180 | 0.5 | 50 | 2.0 | 1 |
| 3 | 240 | 0.5 | 50 | 2.0 | 1 |
| 4 | 300 | 0.5 | 50 | 2.0 | 1 |
| 5 | 200 | 0.4 | 50 | 2.0 | 1 |
| 6 | 200 | 0.8 | 50 | 2.0 | 1 |
| 7 | 200 | 1.2 | 50 | 2.0 | 1 |
| 8 | 200 | 1.6 | 50 | 2.0 | 1 |
| 9 | 200 | 0.5 | 30 | 2.0 | 1 |
| 10 | 200 | 0.5 | 60 | 2.0 | 1 |
| 11 | 200 | 0.5 | 90 | 2.0 | 1 |
| 12 | 200 | 0.5 | 120 | 2.0 | 1 |
| 13 | 200 | 0.5 | 50 | 1.2 | 1 |
| 14 | 200 | 0.5 | 50 | 1.6 | 1 |
| 15 | 200 | 0.5 | 50 | 2.0 | 1 |
| 16 | 200 | 0.5 | 50 | 2.4 | 1 |
| 17 | 200 | 0.5 | 50 | 2.0 | 1 |
| 18 | 200 | 0.5 | 50 | 2.0 | 2 |
| 19 | 200 | 0.5 | 50 | 2.0 | 3 |
| 20 | 200 | 0.5 | 50 | 2.0 | 4 |
| Variable | Symbol | Extreme Value | ||
|---|---|---|---|---|
| Low (−1) | Medium (0) | High (+1) | ||
| Laser Power (W) | X1 | 160 | 200 | 240 |
| Cutting Speed (mm/s) | X2 | 0.3 | 0.6 | 0.9 |
| Pulse Width (μs) | X3 | 30 | 50 | 70 |
| Water Pressure (MPa) | X4 | 1.8 | 2.0 | 2.2 |
| Run Order | X1 | X2 | X3 | X4 | MRR (mg/s) | D (μm) | TW (μm) |
|---|---|---|---|---|---|---|---|
| 1 | 160 | 0.3 | 50 | 2.0 | 5.4 | 341.623 | 232.274 |
| 2 | 240 | 0.3 | 50 | 2.0 | 8.8 | 499.695 | 259.886 |
| 3 | 160 | 0.9 | 50 | 2.0 | 13.6 | 316.901 | 211.186 |
| 4 | 240 | 0.9 | 50 | 2.0 | 22.4 | 455.483 | 242.086 |
| 5 | 200 | 0.6 | 30 | 1.8 | 12.1 | 409.911 | 217.966 |
| 6 | 200 | 0.6 | 70 | 1.8 | 9.6 | 322.478 | 219.521 |
| 7 | 200 | 0.6 | 30 | 2.2 | 11.8 | 399.371 | 218.548 |
| 8 | 200 | 0.6 | 70 | 2.2 | 10.4 | 347.602 | 221.361 |
| 9 | 160 | 0.6 | 50 | 1.8 | 9.4 | 320.464 | 216.727 |
| 10 | 240 | 0.6 | 50 | 1.8 | 15.6 | 464.499 | 248.521 |
| 11 | 160 | 0.6 | 50 | 2.2 | 9.3 | 315.317 | 217.329 |
| 12 | 240 | 0.6 | 50 | 2.2 | 15.6 | 458.182 | 251.495 |
| 13 | 200 | 0.3 | 30 | 2.0 | 6.6 | 436.257 | 224.727 |
| 14 | 200 | 0.9 | 30 | 2.0 | 17.4 | 405.663 | 210.814 |
| 15 | 200 | 0.3 | 70 | 2.0 | 5.4 | 350.044 | 229.245 |
| 16 | 200 | 0.9 | 70 | 2.0 | 15.5 | 351.291 | 217.857 |
| 17 | 160 | 0.6 | 30 | 2.0 | 10.4 | 340.881 | 224.623 |
| 18 | 240 | 0.6 | 30 | 2.0 | 16.0 | 510.658 | 231.867 |
| 19 | 160 | 0.6 | 70 | 2.0 | 8.1 | 296.922 | 201.343 |
| 20 | 240 | 0.6 | 70 | 2.0 | 14.4 | 435.397 | 243.683 |
| 21 | 200 | 0.3 | 50 | 1.8 | 6.3 | 399.399 | 234.069 |
| 22 | 200 | 0.9 | 50 | 1.8 | 17.1 | 376.795 | 223.973 |
| 23 | 200 | 0.3 | 50 | 2.2 | 6.4 | 397.005 | 239.683 |
| 24 | 200 | 0.9 | 50 | 2.2 | 15.7 | 351.944 | 220.376 |
| 25 | 200 | 0.6 | 50 | 2.0 | 12.3 | 391.432 | 232.994 |
| 26 | 200 | 0.6 | 50 | 2.0 | 12.1 | 388.172 | 230.220 |
| 27 | 200 | 0.6 | 50 | 2.0 | 12.6 | 398.671 | 233.905 |
| 28 | 200 | 0.6 | 50 | 2.0 | 12.9 | 400.473 | 237.165 |
| 29 | 200 | 0.6 | 50 | 2.0 | 12.2 | 394.724 | 229.329 |
| Terms | Expressions | Remarks |
|---|---|---|
| Close to 1.0 is ideal. | ||
| Close to 1.0 is ideal. | ||
| PRESS | The value should be small. | |
| should be expected. | ||
| Lack of Fit | should be larger than 0.05. |
| Source | Sum of Squares | df | Mean Square | F Value | p Value |
|---|---|---|---|---|---|
| Model | 85844.06 | 14 | 6131.72 | 118.76 | <0.0001 |
| Laser Power (W) X1 | 66273.82 | 1 | 66,273.82 | 1283.61 | <0.0001 |
| Cutting Speed (mm/s) X2 | 2294.84 | 1 | 2294.84 | 44.45 | <0.0001 |
| Pulse Width (μs) X3 | 13268.41 | 1 | 13,268.41 | 256.99 | <0.0001 |
| Water Pressure (MPa) X4 | 48.50 | 1 | 48.50 | 0.9394 | 0.3489 |
| X1X2 | 94.97 | 1 | 94.97 | 1.84 | 0.1965 |
| X1X3 | 245.24 | 1 | 245.24 | 4.75 | 0.0469 |
| X1X4 | 0.3422 | 1 | 0.3422 | 0.0066 | 0.9363 |
| X2X3 | 253.46 | 1 | 253.46 | 4.91 | 0.0438 |
| X2X4 | 126.08 | 1 | 126.08 | 2.44 | 0.1404 |
| X3X4 | 317.98 | 1 | 317.98 | 6.16 | 0.0264 |
| X12 | 584.97 | 1 | 584.97 | 11.33 | 0.0046 |
| X22 | 0.4333 | 1 | 0.4333 | 0.0084 | 0.9283 |
| X32 | 548.65 | 1 | 548.65 | 10.63 | 0.0057 |
| X42 | 1388.95 | 1 | 1388.95 | 26.90 | 0.0001 |
| Residual | 722.83 | 14 | 51.63 | ||
| Lack of Fit | 620.44 | 10 | 62.04 | 2.42 | |
| Pure Error | 102.39 | 4 | 25.60 | ||
| Total | 86566.89 | 28 | |||
| R2 = 0.9917 Adjusted R2 = 0.9833 Predicted R2 = 0.9569 Adeq Precision = 41.6304 | |||||
| Source | Sum of Squares | df | Mean Square | F Value | p Value |
|---|---|---|---|---|---|
| Model | 4654.83 | 14 | 332.49 | 27.56 | <0.0001 |
| Laser Power (W) X1 | 2524.62 | 1 | 2524.62 | 209.23 | <0.0001 |
| Cutting Speed (mm/s) X2 | 729.96 | 1 | 729.96 | 60.50 | <0.0001 |
| Pulse Width (μs) X3 | 1.66 | 1 | 1.66 | 0.1377 | 0.7161 |
| Water Pressure (MPa) X4 | 5.35 | 1 | 5.35 | 0.4437 | 0.5162 |
| X1X2 | 2.70 | 1 | 2.70 | 0.2240 | 0.6433 |
| X1X3 | 307.93 | 1 | 307.93 | 25.52 | 0.0002 |
| X1X4 | 1.41 | 1 | 1.41 | 0.1166 | 0.7379 |
| X2X3 | 1.59 | 1 | 1.59 | 0.1321 | 0.7217 |
| X2X4 | 21.21 | 1 | 21.21 | 1.76 | 0.2061 |
| X3X4 | 0.3956 | 1 | 0.3956 | 0.0328 | 0.8589 |
| X12 | 93.72 | 1 | 93.72 | 7.77 | 0.0145 |
| X22 | 1.99 | 1 | 1.99 | 0.1652 | 0.6906 |
| X32 | 803.80 | 1 | 803.80 | 66.62 | <0.0001 |
| X42 | 44.87 | 1 | 44.87 | 3.72 | 0.0743 |
| Residual | 168.93 | 14 | 12.07 | ||
| Lack of Fit | 129.94 | 10 | 12.99 | 1.33 | 0.4200 |
| Pure Error | 38.99 | 4 | 9.75 | ||
| Total | 4823.76 | 28 | |||
| R2 = 0.9650 Adjusted R2 = 0.9300 Predicted R2 = 0.8322 Adeq Precision = 22.0022 | |||||
| Source | Sum of Squares | df | Mean Square | F Value | p Value |
|---|---|---|---|---|---|
| Model | 469.75 | 14 | 33.55 | 337.43 | <0.0001 |
| Laser Power (W) X1 | 111.63 | 1 | 111.63 | 1122.58 | <0.0001 |
| Cutting Speed (mm/s) X2 | 328.65 | 1 | 328.65 | 3305.03 | <0.0001 |
| Pulse Width (μs) X3 | 9.90 | 1 | 9.90 | 99.57 | <0.0001 |
| Water Pressure (MPa) X4 | 0.0675 | 1 | 0.0675 | 0.6788 | 0.4238 |
| X1X2 | 7.29 | 1 | 7.29 | 73.31 | <0.0001 |
| X1X3 | 0.1225 | 1 | 0.1225 | 1.23 | 0.2857 |
| X1X4 | 0.0025 | 1 | 0.0025 | 0.0251 | 0.8763 |
| X2X3 | 0.1225 | 1 | 0.1225 | 1.23 | 0.2857 |
| X2X4 | 0.5625 | 1 | 0.5625 | 5.66 | 0.0322 |
| X3X4 | 0.3025 | 1 | 0.3025 | 3.04 | 0.1030 |
| X12 | 2.42 | 1 | 2.42 | 24.34 | 0.0002 |
| X22 | 1.25 | 1 | 1.25 | 12.58 | 0.0032 |
| X32 | 4.17 | 1 | 4.17 | 41.92 | <0.0001 |
| X42 | 2.35 | 1 | 2.35 | 23.61 | 0.0003 |
| Residual | 1.39 | 14 | |||
| Lack of Fit | 0.9642 | 10 | 0.0964 | 0.9011 | 0.5957 |
| Pure Error | 0.4280 | 4 | 0.1070 | ||
| Total | 471.15 | 28 | |||
| R2 = 0.9970 Adjusted R2 = 0.9941 Predicted R2 = 0.9868 Adeq Precision = 75.0136 | |||||
| Serial Number | X1 (W) | X2 (mm/s) | X3 (μs) | X4 (Mpa) | D (μm) | TW (μm) | MRR (mg/s) | Desirability |
|---|---|---|---|---|---|---|---|---|
| 1 | 239.774 | 0.900 | 36.912 | 2.143 | 459.999 | 230.000 | 21.816 | 0.988 |
| 2 | 238.624 | 0.896 | 36.839 | 2.134 | 460.001 | 230.000 | 21.759 | 0.988 |
| 3 | 237.461 | 0.900 | 37.093 | 2.108 | 460.000 | 230.000 | 21.702 | 0.987 |
| Serial Number | X1 (W) | X2 (mm/s) | X3 (μs) | X4 (Mpa) | D (μm) | ΔD (%) | TW (μm) | ΔTW (%) | MRR (mg/s) | ΔMRR (%) |
|---|---|---|---|---|---|---|---|---|---|---|
| 1 | 239.8 | 0.90 | 36.9 | 2.14 | 469.384 | 2.04 | 236.521 | 2.84 | 20.413 | 6.43 |
| 2 | 238.6 | 0.90 | 36.8 | 2.13 | 467.257 | 1.58 | 230.727 | 0.32 | 20.351 | 6.47 |
| 3 | 237.5 | 0.90 | 37.1 | 2.11 | 448.695 | 2.46 | 231.886 | 0.82 | 19.995 | 7.87 |
Publisher’s Note: MDPI stays neutral with regard to jurisdictional claims in published maps and institutional affiliations. |
© 2022 by the authors. Licensee MDPI, Basel, Switzerland. This article is an open access article distributed under the terms and conditions of the Creative Commons Attribution (CC BY) license (https://creativecommons.org/licenses/by/4.0/).
Share and Cite
Liu, Q.; Zhao, Y.; Meng, J.; Zheng, Z.; Cao, C.; Zhao, G.; Zhao, C.; Liu, G.; Dai, D.; Song, Z. Experimental Research and Optimization of Ti-6Al-4V Alloy Microgroove Machining Based on Waterjet-Guided High-Power Laser. Materials 2022, 15, 7430. https://doi.org/10.3390/ma15217430
Liu Q, Zhao Y, Meng J, Zheng Z, Cao C, Zhao G, Zhao C, Liu G, Dai D, Song Z. Experimental Research and Optimization of Ti-6Al-4V Alloy Microgroove Machining Based on Waterjet-Guided High-Power Laser. Materials. 2022; 15(21):7430. https://doi.org/10.3390/ma15217430
Chicago/Turabian StyleLiu, Qian, Yugang Zhao, Jianbing Meng, Zhilong Zheng, Chen Cao, Guoyong Zhao, Chuang Zhao, Guangxin Liu, Di Dai, and Zhuang Song. 2022. "Experimental Research and Optimization of Ti-6Al-4V Alloy Microgroove Machining Based on Waterjet-Guided High-Power Laser" Materials 15, no. 21: 7430. https://doi.org/10.3390/ma15217430
APA StyleLiu, Q., Zhao, Y., Meng, J., Zheng, Z., Cao, C., Zhao, G., Zhao, C., Liu, G., Dai, D., & Song, Z. (2022). Experimental Research and Optimization of Ti-6Al-4V Alloy Microgroove Machining Based on Waterjet-Guided High-Power Laser. Materials, 15(21), 7430. https://doi.org/10.3390/ma15217430