
Investigating the Effect of Tube Diameter on the Performance of a Hybrid Photovoltaic–Thermal System Based on Phase Change Materials and Nanofluids
 ,
,  ,
,  , ,
, ,  and
and 
Abstract
1. Introduction
2. Governing Equations
3. Numerical Model, Grid Study, and Validation
4. Results and Discussion
5. Conclusions
- The PCM entirely melted in a short time at the lower and medium flow rates; at the higher flow rate, however, a portion of the PCM remained non-melted.
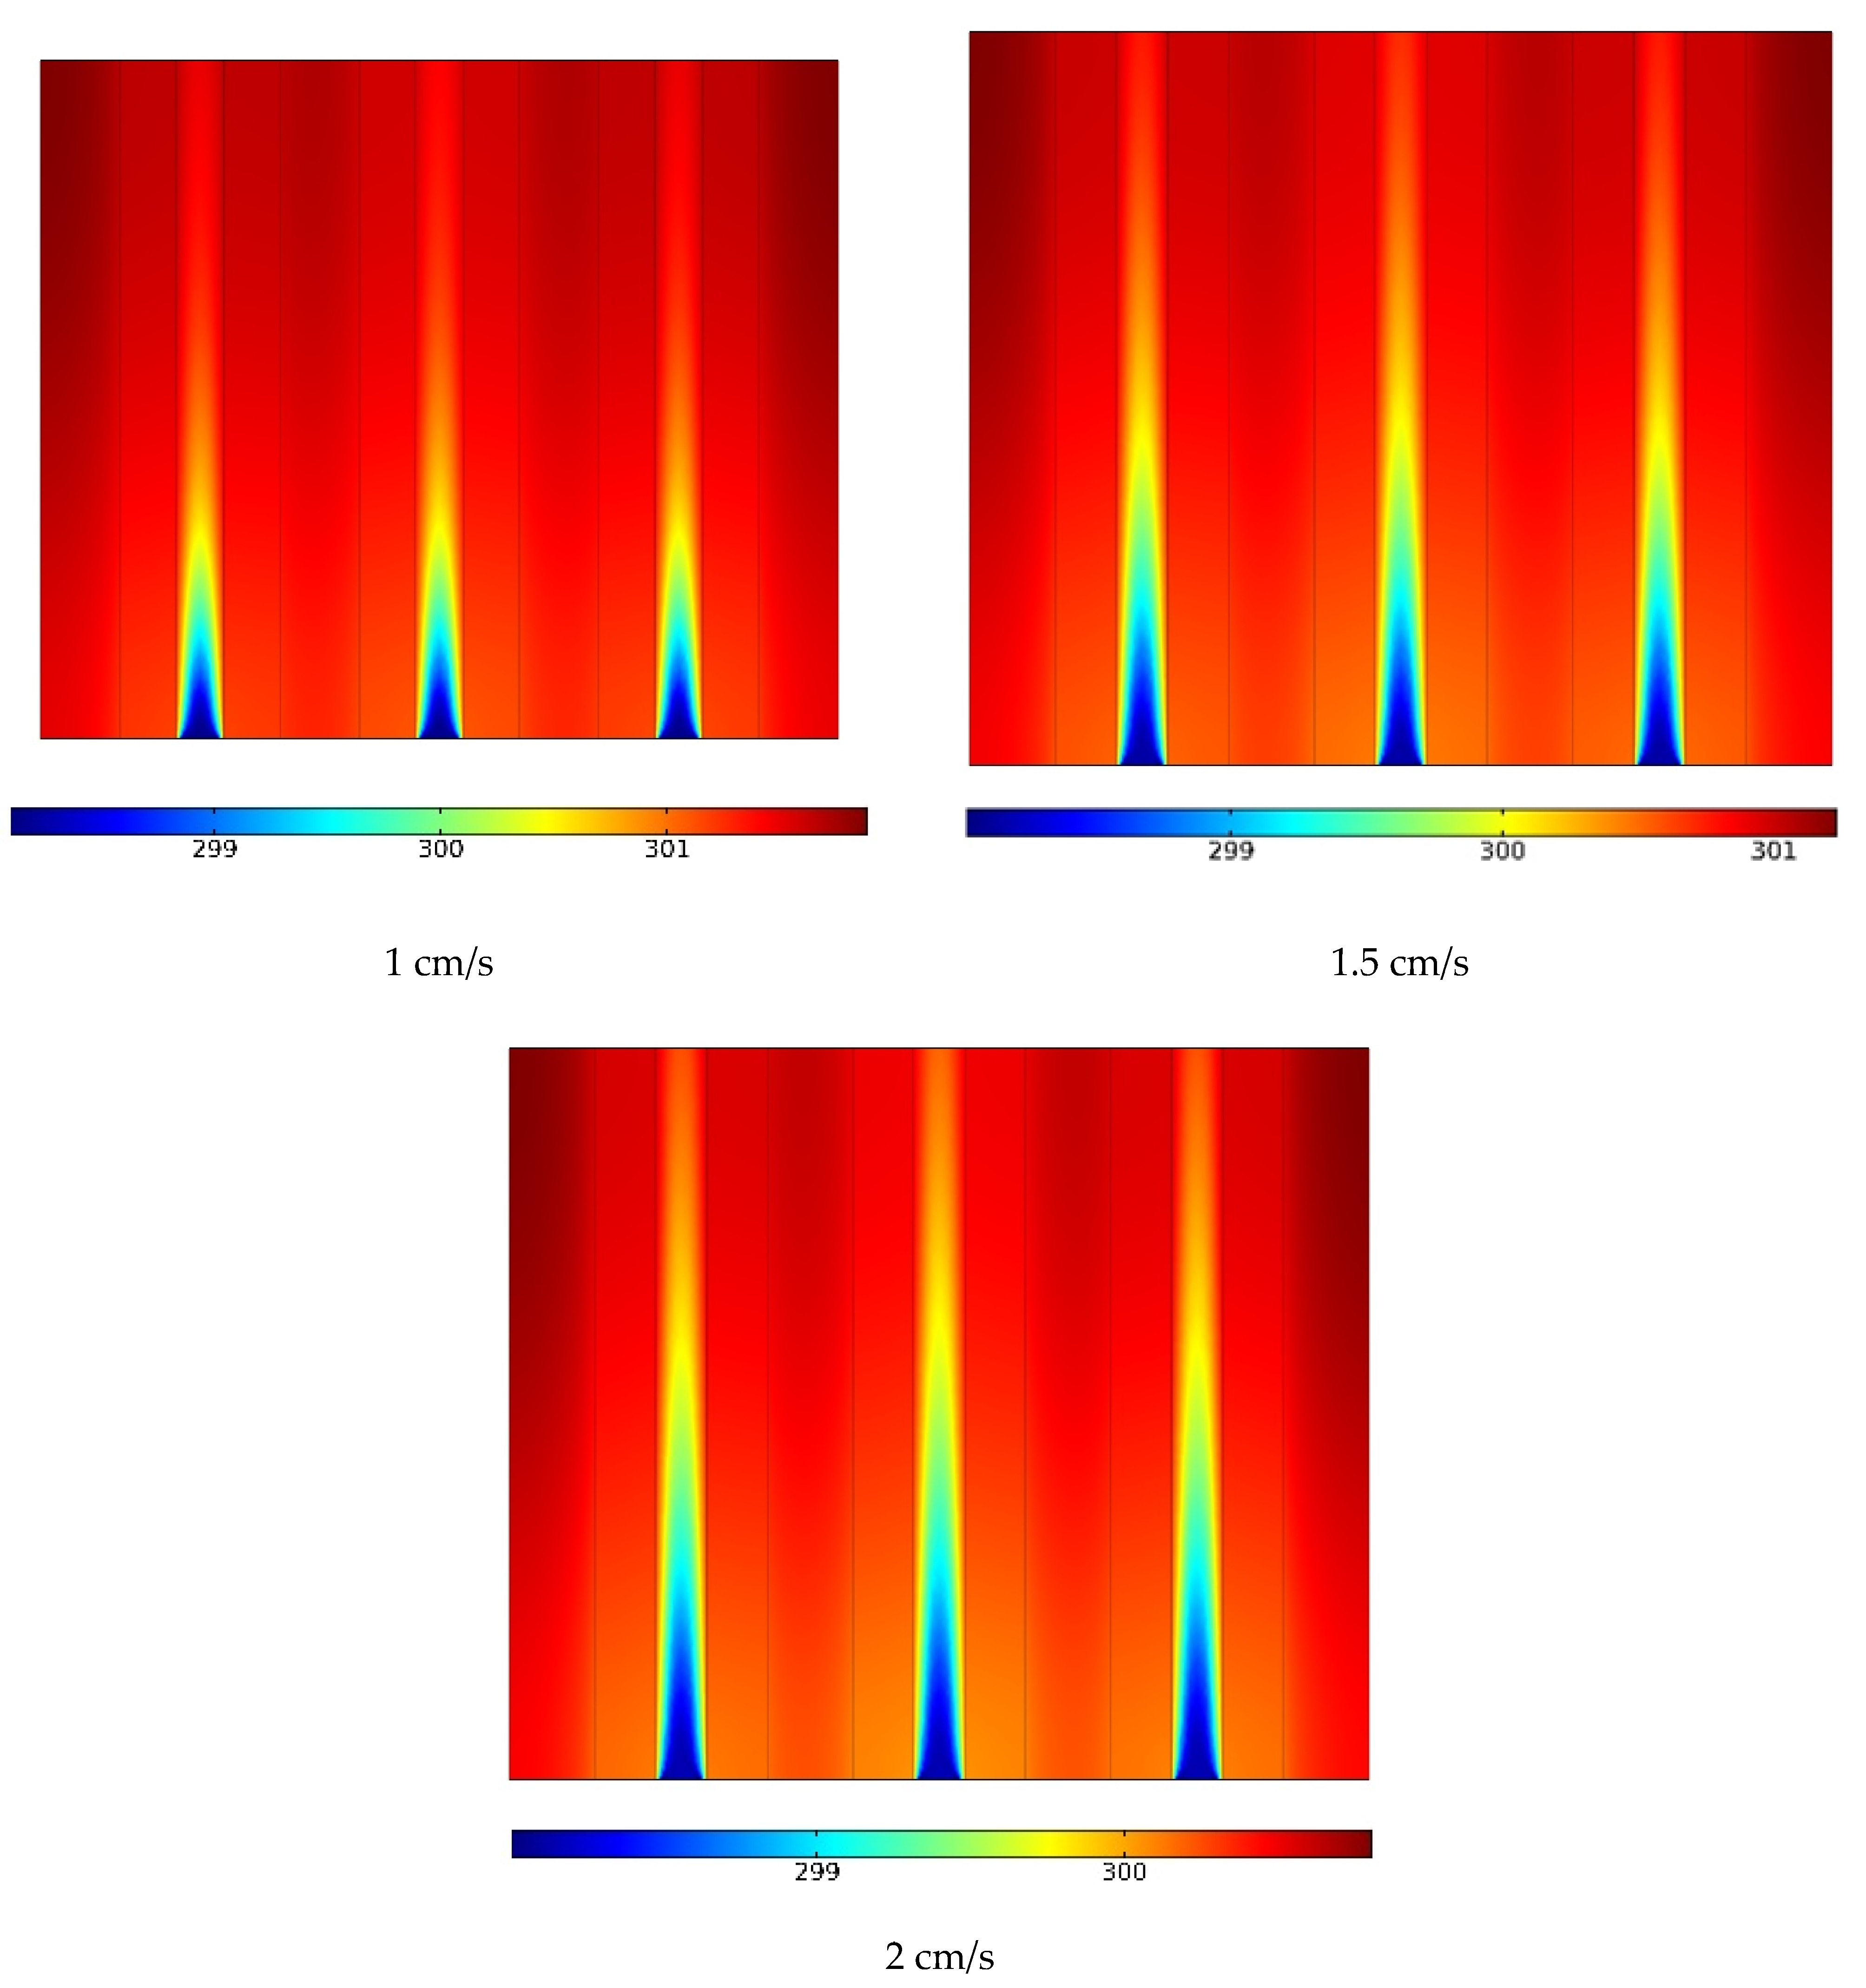
- The output temperature decreased by nearly 20 °C at t = 100 min as the input velocity (flow rate) doubled.
- The HTR coefficient was maximized at one of the flow rates; it was initially maximized at the higher flow rate, whereas the maximum HTR coefficient occurred at the medium flow rate at longer times.
- The average temperature of the panel declined by 1.82 °C at t = 100 min as the flow rate doubled. The highest average temperature was 302.45 K and occurred at the lower flow rate at t = 100, while the lowest average temperature was observed to be 300.63 K and occurred at the highest flow rate.
- The maximum temperature of the panel reduced by 1.85 °C at t = 100 min as the flow rate doubled.
6. Challenges and Prospects
- The impact of changing the use of these materials on the efficiency of the solar panel can be examined by changing the type of nanofluid and PCM.
- It is possible to assess the performance of the solar system during liquid-to-solid phase change to examine the thermal efficiency of the solar panel.
- The effect of using fins with different shapes and different numbers in PCM can be considered.
Author Contributions
Funding
Institutional Review Board Statement
Informed Consent Statement
Data Availability Statement
Acknowledgments
Conflicts of Interest
Nomenclature
| C | Mushy constant | Greek symbols | |
| Cp | Specific heat | Thermal diffusivity | |
| F | Faraday’s constant | Volume fraction | |
| Fi | Volume fraction | Dynamic viscosity | |
| g | Gravitational acceleration [m/s2] | Density | |
| H | Enthalpy [kJ/kg] | ||
| k | Thermal conductivity | ||
| Pressure | Subscripts | ||
| PCM | Phase change material | bf | Pure fluid |
| Re | Reynolds number | dr | Drift |
| t | Time (s) | HRT | Heat transfer rate |
| T | Temperature [K] | m | Mixture |
| u, v, w | Velocity components | nfs | Nanofluid |
| x, y, z | Cartesian coordinates | pf | Solid nanoparticle |
References
- Mustafa, J.; Alqaed, S.; Almehmadi, F.A.; Jamil, B. Development and comparison of parametric models to predict global solar radiation: A case study for the southern region of Saudi Arabia. J. Therm. Anal. Calorim. 2022, 147, 9559–9589. [Google Scholar] [CrossRef]
- Mustafa, J.; Alqaed, S.; Sharifpur, M. Numerical study on performance of double-fluid parabolic trough solar collector occupied with hybrid non-Newtonian nanofluids: Investigation of effects of helical absorber tube using deep learning. Eng. Anal. Bound. Elem. 2022, 140, 562–580. [Google Scholar] [CrossRef]
- Ojike, O.J.C.J.R.E. Characterization of flat plate double glazed solar collectors. Cont. J. Renew. Energy 2011, 2, 10–18. [Google Scholar]
- Amjad, M.; Jin, H.; Du, X.; Wen, D. Experimental photothermal performance of nanofluids under concentrated solar flux. Sol. Energy Mater. Sol. Cells 2018, 182, 255–262. [Google Scholar] [CrossRef]
- Hassan, H.M.A.; Amjad, M.; Tahir, Z.R.; Qamar, A.; Noor, F.; Hu, Y.; Yaqub, T.B.; Filho, E.P.B. Performance analysis of nanofluid-based water desalination system using integrated solar still, flat plate and parabolic trough collectors. J. Braz. Soc. Mech. Sci. Eng. 2022, 44, 427. [Google Scholar] [CrossRef]
- Sattar, A.; Farooq, M.; Amjad, M.; Saeed, M.A.; Nawaz, S.; Mujtaba, M.A.; Anwar, S.; El-Sherbeeny, A.M.; Soudagar, M.E.M.; Bandarra Filho, E.P.; et al. Performance Evaluation of a Direct Absorption Collector for Solar Thermal Energy Conversion. Energies 2020, 13, 4956. [Google Scholar] [CrossRef]
- Pordanjani, A.H.; Aghakhani, S.; Afrand, M.; Sharifpur, M.; Meyer, J.P.; Xu, H.; Ali, H.M.; Karimi, N.; Cheraghian, G. Nanofluids: Physical phenomena, applications in thermal systems and the environment effects—A critical review. J. Clean. Prod. 2021, 320, 128573. [Google Scholar] [CrossRef]
- Hajatzadeh Pordanjani, A.; Aghakhani, S.; Afrand, M.; Mahmoudi, B.; Mahian, O.; Wongwises, S. An updated review on application of nanofluids in heat exchangers for saving energy. Energy Convers. Manag. 2019, 198, 111886. [Google Scholar] [CrossRef]
- Mustafa, J.; Alqaed, S.; Sharifpur, M. Incorporating nano-scale material in solar system to reduce domestic hot water energy demand. Sustain. Energy Technol. Assess. 2022, 49, 101735. [Google Scholar] [CrossRef]
- Kılkış, B. Development of a composite PVT panel with PCM embodiment, TEG modules, flat-plate solar collector, and thermally pulsing heat pipes. Sol. Energy 2020, 200, 89–107. [Google Scholar] [CrossRef]
- Kalogirou, S.A.; Tripanagnostopoulos, Y. Hybrid PV/T solar systems for domestic hot water and electricity production. Energy Convers. Manag. 2006, 47, 3368–3382. [Google Scholar] [CrossRef]
- Cui, W.; Li, X.; Li, X.; Si, T.; Lu, L.; Ma, T.; Wang, Q. Thermal performance of modified melamine foam/graphene/paraffin wax composite phase change materials for solar-thermal energy conversion and storage. J. Clean. Prod. 2022, 367, 133031. [Google Scholar] [CrossRef]
- Bahaidarah, H.; Subhan, A.; Gandhidasan, P.; Rehman, S. Performance evaluation of a PV (photovoltaic) module by back surface water cooling for hot climatic conditions. Energy 2013, 59, 445–453. [Google Scholar] [CrossRef]
- Khanjari, Y.; Pourfayaz, F.; Kasaeian, A.B. Numerical investigation on using of nanofluid in a water-cooled photovoltaic thermal system. Energy Convers. Manag. 2016, 122, 263–278. [Google Scholar] [CrossRef]
- Alqaed, S. Effect of annual solar radiation on simple façade, double-skin facade and double-skin facade filled with phase change materials for saving energy. Sustain. Energy Technol. Assess. 2022, 51, 101928. [Google Scholar] [CrossRef]
- Aghakhani, S.; Afrand, M.; Karimipour, A.; Kalbasi, R.; Mehdi Razzaghi, M. Numerical study of the cooling effect of a PVT on its thermal and electrical efficiency using a Cu tube of different diameters and lengths. Sustain. Energy Technol. Assess. 2022, 52, 102044. [Google Scholar] [CrossRef]
- Ahmadi, R.; Monadinia, F.; Maleki, M. Passive/active photovoltaic-thermal (PVT) system implementing infiltrated phase change material (PCM) in PS-CNT foam. Sol. Energy Mater. Sol. Cells 2021, 222, 110942. [Google Scholar] [CrossRef]
- Khodadadi, M.; Sheikholeslami, M. Numerical simulation on the efficiency of PVT system integrated with PCM under the influence of using fins. Sol. Energy Mater. Sol. Cells 2021, 233, 110942. [Google Scholar] [CrossRef]
- Zhang, X.; Tang, Y.; Zhang, F.; Lee, C.-S. A Novel Aluminum–Graphite Dual-Ion Battery. Adv. Energy Mater. 2016, 6, 1502588. [Google Scholar] [CrossRef]
- Tong, X.; Zhang, F.; Ji, B.; Sheng, M.; Tang, Y. Carbon-coated porous aluminum foil anode for high-rate, long-term cycling stability, and high energy density dual-ion batteries. J. Adv. Mater. 2016, 28, 9979–9985. [Google Scholar] [CrossRef]
- Ji, B.; Zhang, F.; Song, X.; Tang, Y. A Novel Potassium-Ion-Based Dual-Ion Battery. Adv. Mater. 2017, 29, 1700519. [Google Scholar] [CrossRef] [PubMed]
- Wang, M.; Jiang, C.; Zhang, S.; Song, X.; Tang, Y.; Cheng, H.-M. Reversible calcium alloying enables a practical room-temperature rechargeable calcium-ion battery with a high discharge voltage. Nat. Chem. 2018, 10, 667–672. [Google Scholar] [CrossRef] [PubMed]
- Mu, S.; Liu, Q.; Kidkhunthod, P.; Zhou, X.; Wang, W.; Tang, Y. Molecular grafting towards high-fraction active nanodots implanted in N-doped carbon for sodium dual-ion batteries. Natl. Sci. Rev. 2020, 8, nwaa178. [Google Scholar] [CrossRef]
- Li, L.; Zhang, D.; Deng, J.; Gou, Y.; Fang, J.; Cui, H.; Zhao, Y.; Cao, M. Carbon-based materials for fast charging lithium-ion batteries. Carbon 2021, 183, 721–734. [Google Scholar] [CrossRef]
- Gong, S.; Sheng, X.; Li, X.; Sheng, M.; Wu, H.; Lu, X.; Qu, J. A Multifunctional Flexible Composite Film with Excellent Multi-Source Driven Thermal Management, Electromagnetic Interference Shielding, and Fire Safety Performance, Inspired by a “Brick–Mortar” Sandwich Structure. J. Adv. Funct. Mater. 2022, 32, 2200570. [Google Scholar] [CrossRef]
- Dai, Z.; Xie, J.; Liu, W.; Wang, X.; Zhang, L.; Zhou, Z.; Li, J.; Ren, X. Effective strategy to achieve excellent energy storage properties in lead-free BaTiO3-based bulk ceramics. J. ACS Appl. Mater. Interfaces 2020, 12, 30289–30296. [Google Scholar] [CrossRef]
- Dai, Z.; Li, D.; Zhou, Z.; Zhou, S.; Liu, W.; Liu, J.; Wang, X.; Ren, X. A strategy for high performance of energy storage and transparency in KNN-based ferroelectric ceramics. Chem. Eng. J. 2022, 427, 131959. [Google Scholar] [CrossRef]
- Yang, L.; Dai, Q.; Liu, L.; Shao, D.; Luo, K.; Jamil, S.; Liu, H.; Luo, Z.; Chang, B.; Wang, X. Rapid sintering method for highly conductive Li7La3Zr2O12 ceramic electrolyte. Ceram. Int. 2020, 46, 10917–10924. [Google Scholar] [CrossRef]
- Zhu, N.; Li, S.; Hu, P.; Lei, F.; Deng, R. Numerical investigations on performance of phase change material Trombe wall in building. Energy 2019, 187, 116057. [Google Scholar] [CrossRef]
- Al-Waeli, A.H.A.; Chaichan, M.T.; Sopian, K.; Kazem, H.A.; Mahood, H.B.; Khadom, A.A. Modeling and experimental validation of a PVT system using nanofluid coolant and nano-PCM. Sol. Energy 2019, 177, 178–191. [Google Scholar] [CrossRef]
- Cui, W.; Si, T.; Li, X.; Li, X.; Lu, L.; Ma, T.; Wang, Q. Heat transfer analysis of phase change material composited with metal foam-fin hybrid structure in inclination container by numerical simulation and artificial neural network. Energy Rep. 2022, 8, 10203–10218. [Google Scholar] [CrossRef]
- Enibe, S.O. Performance of a natural circulation solar air heating system with phase change material energy storage. Renew. Energy 2002, 27, 69–86. [Google Scholar] [CrossRef]
- Agathokleous, R.A.; Kalogirou, S.A. Double skin facades (DSF) and building integrated photovoltaics (BIPV): A review of configurations and heat transfer characteristics. Renew. Energy 2016, 89, 743–756. [Google Scholar] [CrossRef]
- Kaloudis, E.; Papanicolaou, E.; Belessiotis, V. Numerical simulations of a parabolic trough solar collector with nanofluid using a two-phase model. Renew. Energy 2016, 97, 218–229. [Google Scholar] [CrossRef]
- Jin, H.; Lin, G.; Bai, L.; Zeiny, A.; Wen, D. Steam generation in a nanoparticle-based solar receiver. Nano Energy 2016, 28, 397–406. [Google Scholar] [CrossRef]
- Aghakhani, S.; Afrand, M. Experimental study of the effect of simultaneous application of the air- and water-cooled flow on efficiency in a Photovoltaic thermal solar collector with porous plates. Appl. Therm. Eng. 2022, 217, 119161. [Google Scholar] [CrossRef]
- Sadeghi, G.; Pisello, A.L.; Nazari, S.; Jowzi, M.; Shama, F. Empirical data-driven multi-layer perceptron and radial basis function techniques in predicting the performance of nanofluid-based modified tubular solar collectors. J. Clean. Prod. 2021, 295, 126409. [Google Scholar] [CrossRef]
- Sadeghi, G.; Nazari, S. Retrofitting a thermoelectric-based solar still integrated with an evacuated tube collector utilizing an antibacterial-magnetic hybrid nanofluid. Desalination 2021, 500, 114871. [Google Scholar] [CrossRef]
- Aghakhani, S.; Ghaffarkhah, A.; Arjmand, M.; Karimi, N.; Afrand, M. Phase change materials: Agents towards energy performance improvement in inclined, vertical, and horizontal walls of residential buildings. J. Build. Eng. 2022, 56, 104656. [Google Scholar] [CrossRef]
- Mustafa, J.; Alqaed, S.; Kalbasi, R. Challenging of using CuO nanoparticles in a flat plate solar collector—Energy saving in a solar-assisted hot process stream. J. Taiwan Inst. Chem. Eng. 2021, 124, 258–265. [Google Scholar] [CrossRef]
- Alqaed, S.; Almehmadi, F.A.; Mustafa, J.; Husain, S.; Cheraghian, G. Effect of nano phase change materials on the cooling process of a triangular lithium battery pack. J. Energy Storage 2022, 51, 104326. [Google Scholar] [CrossRef]
- Alqaed, S.; Mustafa, J.; Almehmadi, F.A. The effect of using phase change materials in a solar wall on the number of times of air conditioning per hour during day and night in different thicknesses of the solar wall. J. Build. Eng. 2022, 51, 104227. [Google Scholar] [CrossRef]
- Wang, X.; Li, C.; Zhang, Y.; Said, Z.; Debnath, S.; Sharma, S.; Yang, M.; Gao, T. Influence of texture shape and arrangement on nanofluid minimum quantity lubrication turning. Int. J. Adv. Manuf. Technol. 2021, 119, 631–646. [Google Scholar] [CrossRef]
- Li, H.; Zhang, Y.; Li, C.; Zhou, Z.; Nie, X.; Chen, Y.; Cao, H.; Liu, B.; Zhang, N.; Said, Z.; et al. Extreme pressure and antiwear additives for lubricant: Academic insights and perspectives. Int. J. Adv. Manuf. Technol. 2022, 120, 1–27. [Google Scholar] [CrossRef]
- Jia, D.; Zhang, Y.; Li, C.; Yang, M.; Gao, T.; Said, Z.; Sharma, S. Lubrication-enhanced mechanisms of titanium alloy grinding using lecithin biolubricant. Tribol. Int. 2022, 169, 107461. [Google Scholar] [CrossRef]
- Wang, X.; Li, C.; Zhang, Y.; Ali, H.M.; Sharma, S.; Li, R.; Yang, M.; Said, Z.; Liu, X. Tribology of enhanced turning using biolubricants: A comparative assessment. Tribol. Int. 2022, 174, 107766. [Google Scholar] [CrossRef]
- Liu, M.; Li, C.; Zhang, Y.; An, Q.; Yang, M.; Gao, T.; Mao, C.; Liu, B.; Cao, H.; Xu, X.; et al. Cryogenic minimum quantity lubrication machining: From mechanism to application. Front. Mech. Eng. 2021, 16, 649–697. [Google Scholar] [CrossRef]
- Mashayekhi, R.; Khodabandeh, E.; Bahiraei, M.; Bahrami, L.; Toghraie, D.; Akbari, O.A. Application of a novel conical strip insert to improve the efficacy of water–Ag nanofluid for utilization in thermal systems: A two-phase simulation. Energy Convers. Manag. 2017, 151, 573–586. [Google Scholar] [CrossRef]
- Li, M. A nano-graphite/paraffin phase change material with high thermal conductivity. Appl. Energy 2013, 106, 25–30. [Google Scholar] [CrossRef]
- Moraveji, M.K.; Ardehali, R.M. CFD modeling (comparing single and two-phase approaches) on thermal performance of Al2o3/water nanofluid in mini-channel heat sink. Int. Commun. Heat Mass Transf. 2013, 44, 157–164. [Google Scholar] [CrossRef]
- Akbari, M.; Galanis, N.; Behzadmehr, A. Comparative analysis of single and two-phase models for CFD studies of nanofluid heat transfer. Int. J. Therm. Sci. 2011, 50, 1343–1354. [Google Scholar] [CrossRef]
- Sarafraz, M.M.; Hormozi, F. Intensification of forced convection heat transfer using biological nanofluid in a double-pipe heat exchanger. Exp. Therm. Fluid Sci. 2015, 66, 279–289. [Google Scholar] [CrossRef]
- Bizhaem, H.K.; Abbassi, A. Numerical study on heat transfer and entropy generation of developing laminar nanofluid flow in helical tube using two-phase mixture model. Adv. Powder Technol. 2017, 28, 2110–2125. [Google Scholar] [CrossRef]
- Aghakhani, S.; Afrand, M.; Karimipour, A.; Kalbasi, R.; Mehdi Razzaghi, M. Numerical and experimental study of thermal efficiency of a spiral flat plate solar collector by changing the spiral diameter, flow rate, and pipe diameter. Sustain. Energy Technol. Assess. 2022, 53, 102353. [Google Scholar] [CrossRef]
- Cheraghian, G.; Khalili Nezhad, S.S.; Bazgir, S. Improvement of thermal stability of polyacryl amide solution used as a nano-fluid in enhanced oil recovery process by nanoclay. Int. J. Nanosci. Nanotechnol. 2015, 11, 201–208. [Google Scholar]
- Abidi, A.; Rawa, M.; Khetib, Y.; Sindi, H.F.A.; Sharifpur, M.; Cheraghian, G. Simulation of melting and solidification of graphene nanoparticles-PCM inside a dual tube heat exchanger with extended surface. J. Energy Storage 2021, 44, 103265. [Google Scholar] [CrossRef]


| PCMs Type | Melting Point (°C) | ||
|---|---|---|---|
| 27.73 | 202.1 | 0.365 |
| ds (mn) | μ (kg/m·s) | ρ (kg/m3) | cp (kg·k) | k (W/m·K) | |
|---|---|---|---|---|---|
| Water | - | 0.001 | 997.1 | 4179 | 0.613 |
| EG | - | 0.0141 | 1088 | 2430.8 | 0.2532 |
| Ag | 40 | - | 10500 | 235 | 429 |
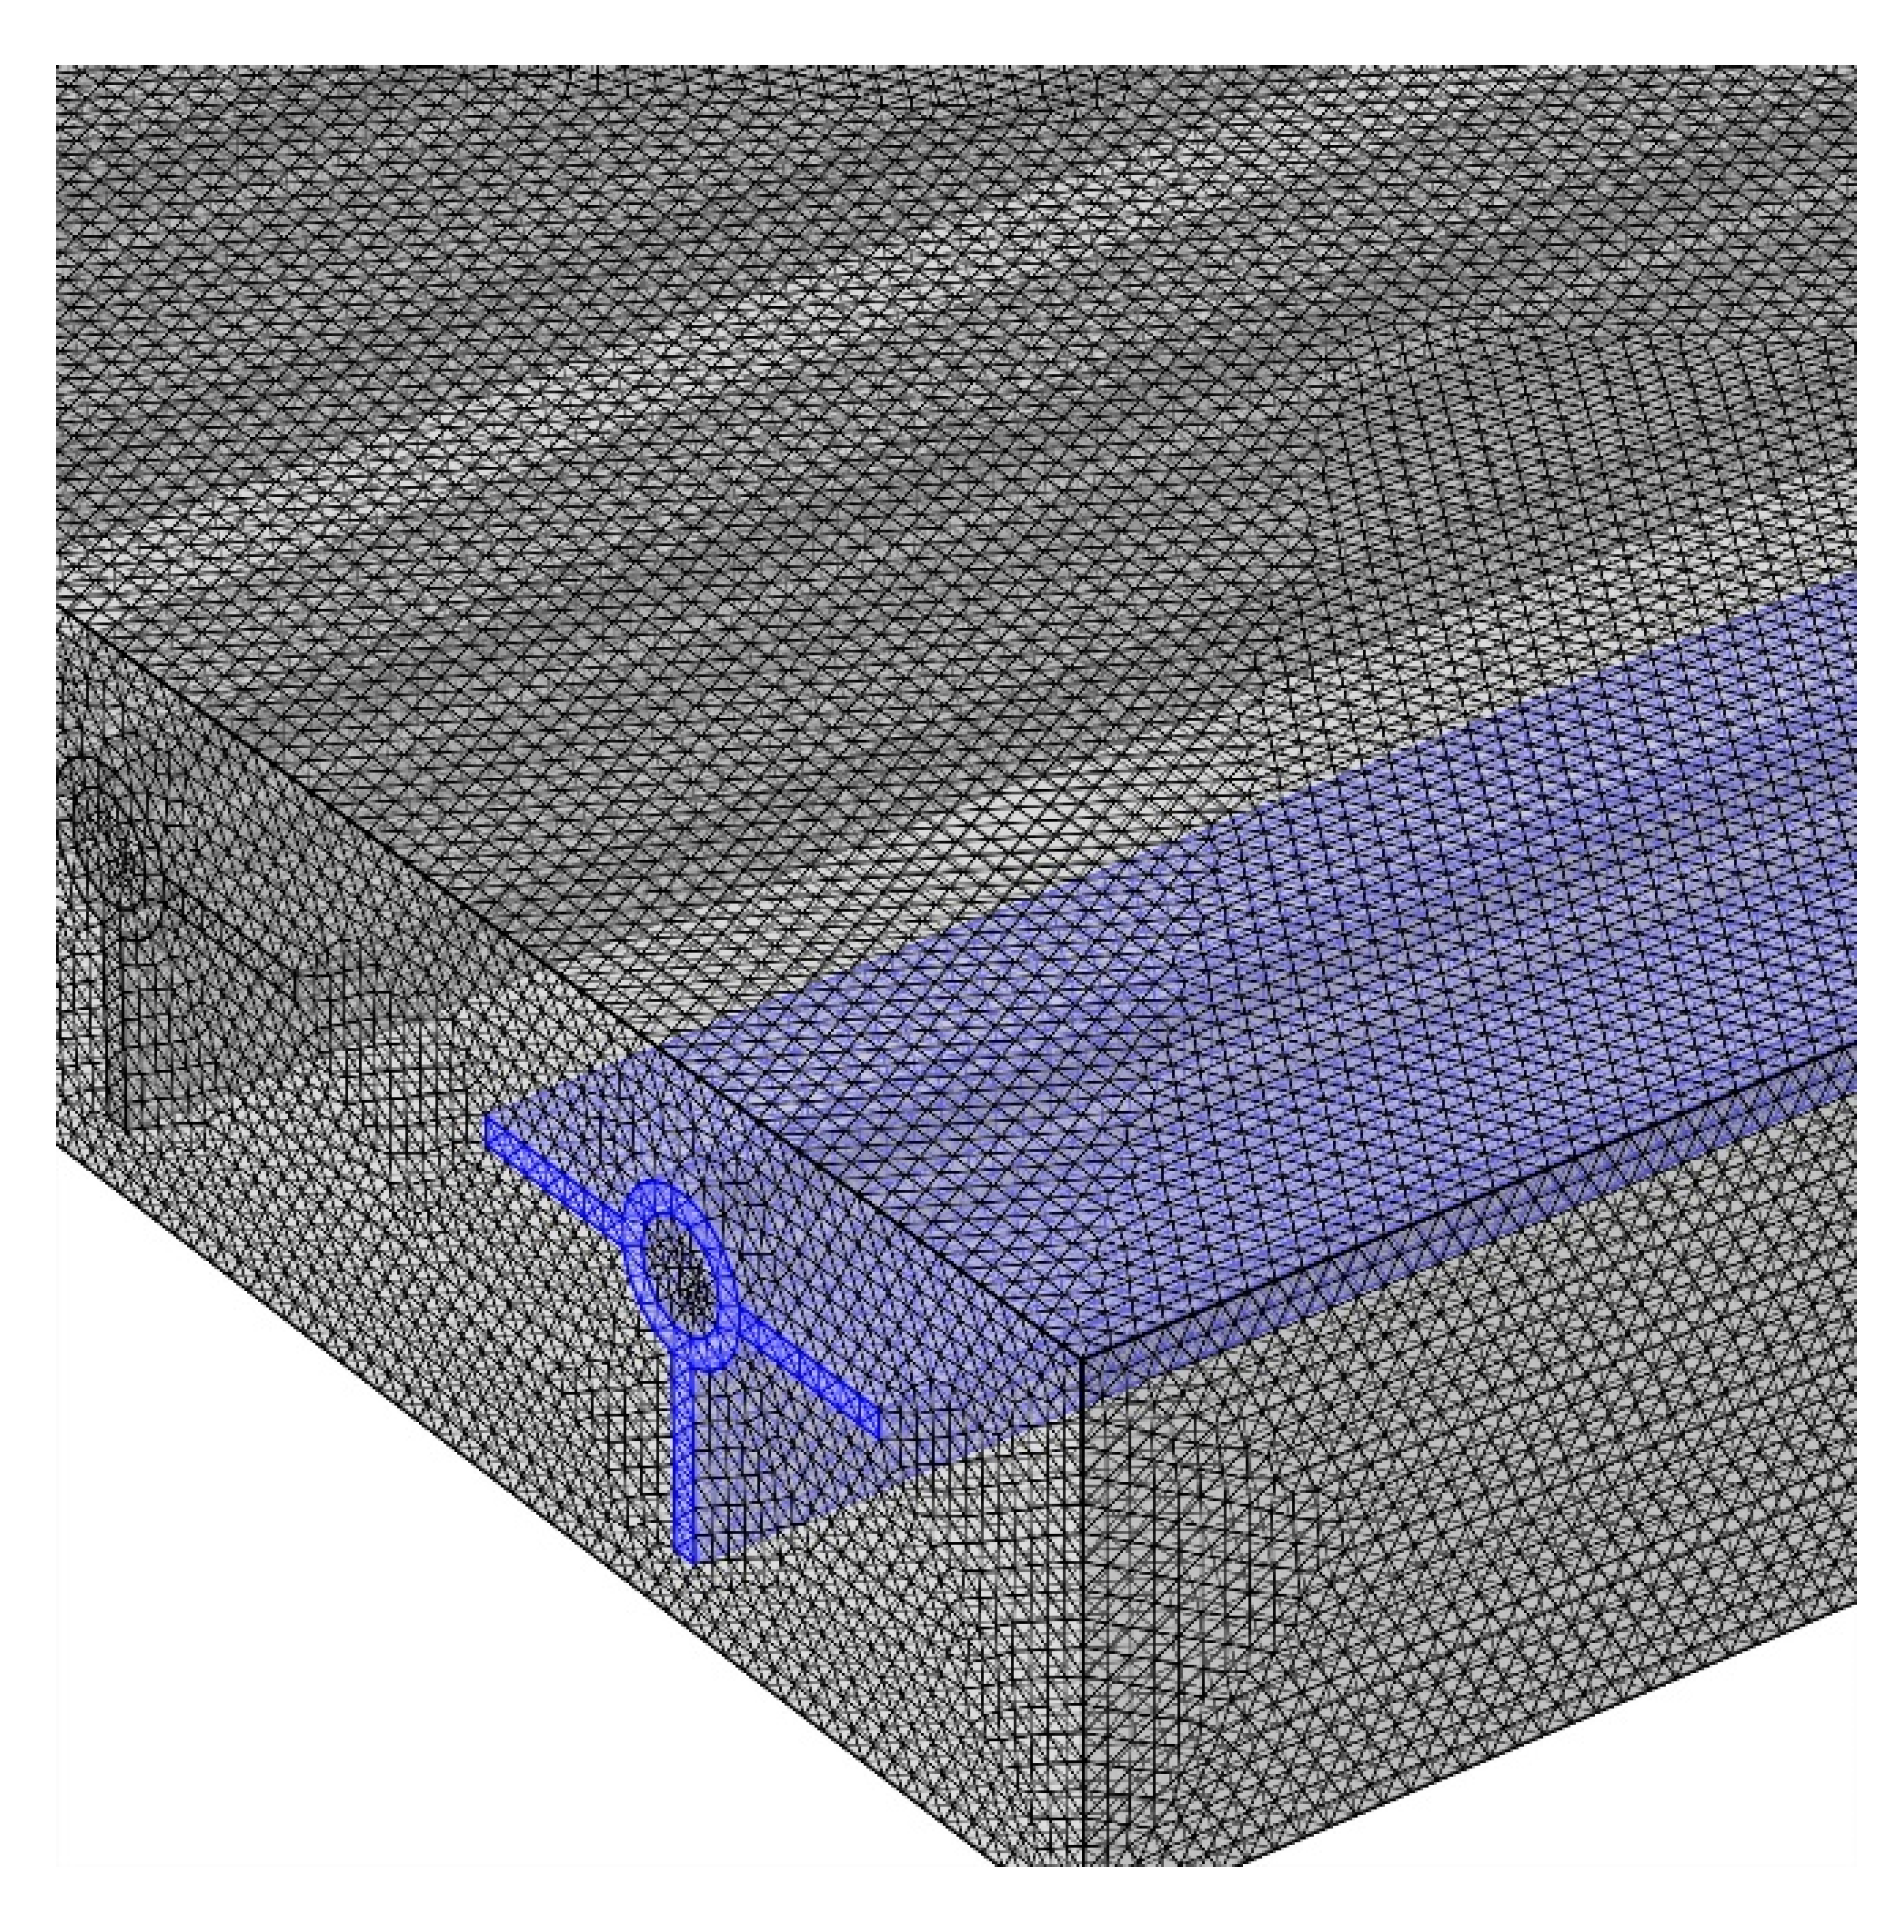
| Element number | 908,035 | 1,013,730 | 1,144,853 | 1,291,256 |
| V-Max (m/s) | 0.0020 | 0.0019 | 0.0018 | 0.0018 |
| T-mid (K) | 300.38 | 300.61 | 300.74 | 300.74 |
| Re | 200 | 500 | 1000 |
|---|---|---|---|
| = 1% | |||
| Ref. [53] | 5.56 | 5.31 | 5.17 |
| This paper | 5.42 | 5.19 | 4.98 |
| %Err | 2.25 | 2.2 | 3.6 |
| = 3% | |||
| Ref. [53] | 1.77 | 1.65 | 1.60 |
| This paper | 1.71 | 1.60 | 1.52 |
| %Err | 3.4 | 3.0 | 5.0 |
| Flow Rate | 0.5 | 1.5 | 2.5 |
|---|---|---|---|
| Ref. [54] | 304.26 K | 301.86 K | 296.50 K |
| This paper | 304.68 K | 301.67 K | 296.11 K |
| Difference | 0.42 K | 0.19 K | 0.39 K |
Publisher’s Note: MDPI stays neutral with regard to jurisdictional claims in published maps and institutional affiliations. |
© 2022 by the authors. Licensee MDPI, Basel, Switzerland. This article is an open access article distributed under the terms and conditions of the Creative Commons Attribution (CC BY) license (https://creativecommons.org/licenses/by/4.0/).
Share and Cite
Alqaed, S.; Mustafa, J.; Almehmadi, F.A.; Alharthi, M.A.; Sharifpur, M.; Cheraghian, G. Investigating the Effect of Tube Diameter on the Performance of a Hybrid Photovoltaic–Thermal System Based on Phase Change Materials and Nanofluids. Materials 2022, 15, 7613. https://doi.org/10.3390/ma15217613
Alqaed S, Mustafa J, Almehmadi FA, Alharthi MA, Sharifpur M, Cheraghian G. Investigating the Effect of Tube Diameter on the Performance of a Hybrid Photovoltaic–Thermal System Based on Phase Change Materials and Nanofluids. Materials. 2022; 15(21):7613. https://doi.org/10.3390/ma15217613
Chicago/Turabian StyleAlqaed, Saeed, Jawed Mustafa, Fahad Awjah Almehmadi, Mathkar A. Alharthi, Mohsen Sharifpur, and Goshtasp Cheraghian. 2022. "Investigating the Effect of Tube Diameter on the Performance of a Hybrid Photovoltaic–Thermal System Based on Phase Change Materials and Nanofluids" Materials 15, no. 21: 7613. https://doi.org/10.3390/ma15217613
APA StyleAlqaed, S., Mustafa, J., Almehmadi, F. A., Alharthi, M. A., Sharifpur, M., & Cheraghian, G. (2022). Investigating the Effect of Tube Diameter on the Performance of a Hybrid Photovoltaic–Thermal System Based on Phase Change Materials and Nanofluids. Materials, 15(21), 7613. https://doi.org/10.3390/ma15217613