
Analysis of Elastic Properties of Al/PET Isotropic Composite Materials Using Finite Element Method


Abstract
:1. Introduction
2. Materials and Methods
2.1. Workflow Chart
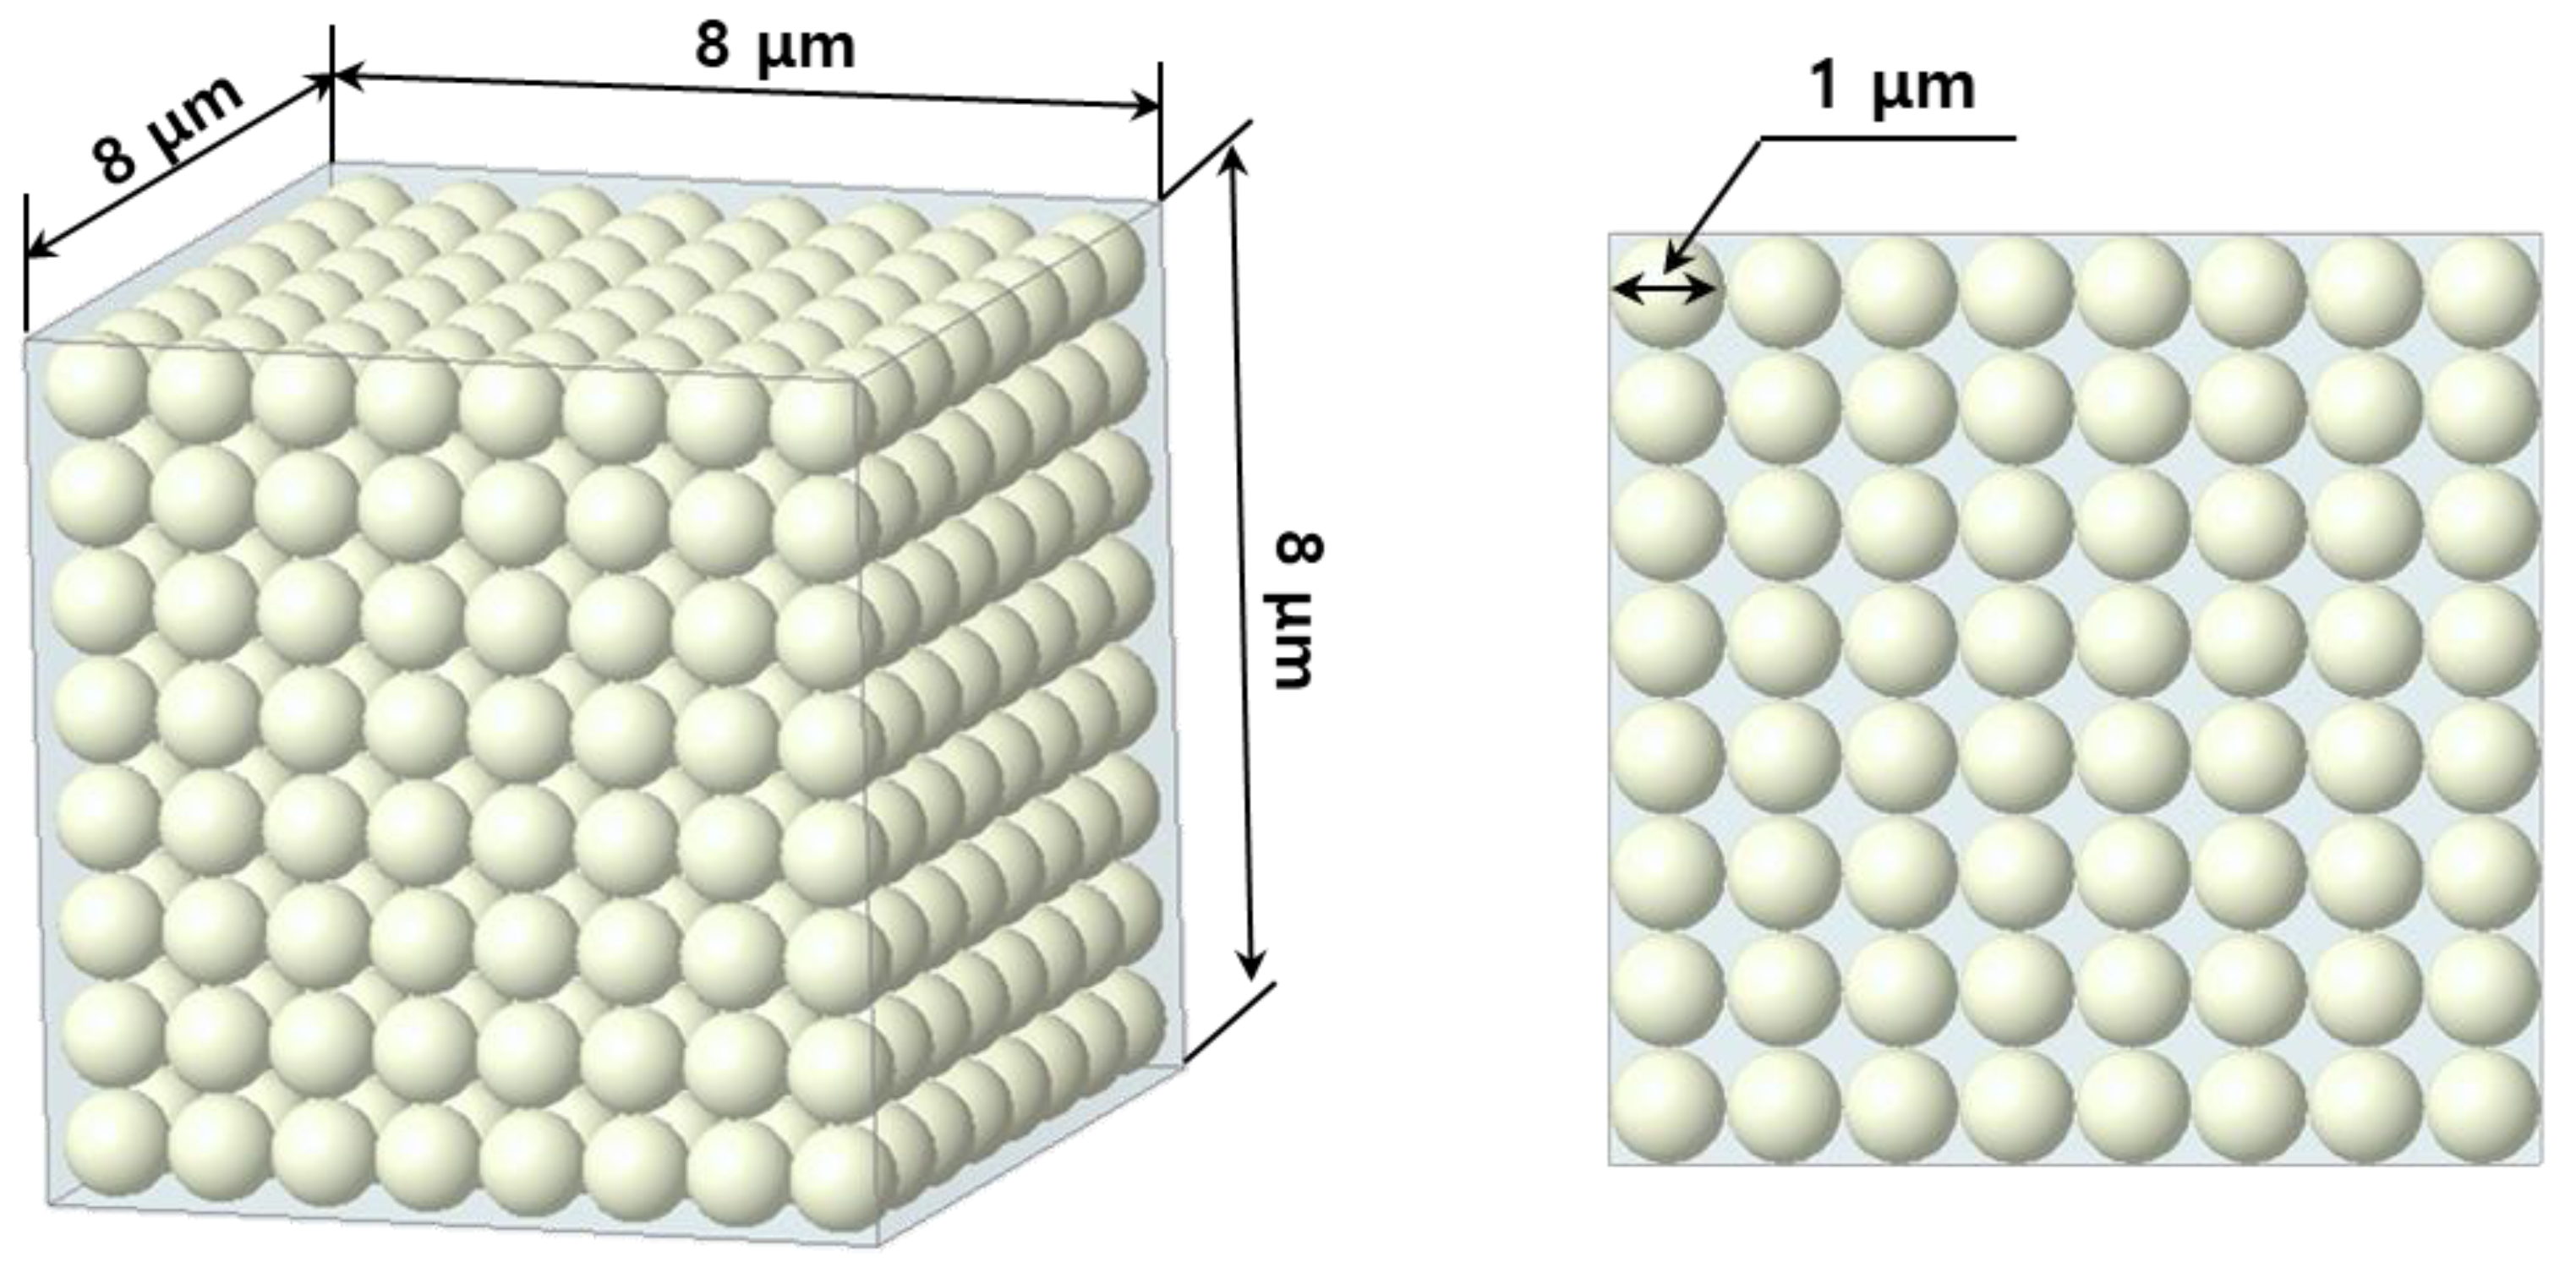
2.2. Analysis Model
2.3. Homogenization Method
2.4. Numerical Analysis Model
3. Results
4. Conclusions
Author Contributions
Funding
Institutional Review Board Statement
Informed Consent Statement
Data Availability Statement
Conflicts of Interest
References
- Essabir, H.; Raji, M.; Essassi, E.M.; Rodrigue, D.; Bouhfid, R.; Qaiss, A.E. Morphological, thermal, mechanical, electrical and magnetic properties of ABS/PA6/SBR blends with Fe3O4 nano-particles. J. Mater. Sci. Mater. Electron. 2017, 28, 17120–17130. [Google Scholar] [CrossRef]
- Raji, M.; Mekhzoum, M.E.M.; Qaiss, A.E.K.; Bouhfid, R. Nanoclay modification and functionalization for nanocomposites development: Effect on the structural, morphological, mechanical and rheological properties. In Nanoclay Reinforced Polymer Composites; Springer: Singapore, 2016; pp. 1–34. [Google Scholar]
- Raji, M.; Essabir, H.; Essassi, E.M.; Rodrigue, D.; Bouhfid, R.; Qaiss, A.E.K. Morphological, thermal, mechanical, and rheological properties of high density polyethylene reinforced with illite clay. Polym. Compos. 2018, 39, 1522–1533. [Google Scholar] [CrossRef]
- Laaziz, S.A.; Raji, M.; Hilali, E.; Essabir, H.; Rodrigue, D.; Bouhfid, R. Bio-composites based on polylactic acid and argan nut shell: Production and properties. Int. J. Biol. Macromol. 2017, 104, 30–42. [Google Scholar] [CrossRef] [PubMed]
- Abdellaoui, H.; Bensalah, H.; Raji, M.; Rodrigue, D.; Bouhfid, R. Laminated epoxy biocomposites based on clay and jute fibers. J. Bionic Eng. 2017, 14, 379–389. [Google Scholar] [CrossRef]
- Yun, J.H.; Jeon, Y.J.; Kang, M.S. Prediction of the Elastic Properties of Ultra High Molecular-Weight Polyethylene Particle-Reinforced Polypropylene Composite Materials through Homogenization. Appl. Sci. 2022, 12, 7699. [Google Scholar] [CrossRef]
- Nguyen, D.M.; Vu, T.N.; Nguyen, T.M.L.; Nguyen, T.D.; Thuc, C.N.H.; Bui, Q.B.; Colin, J.; Perré, P. Synergistic influences of stearic acid coating and recycled PET microfibers on the enhanced properties of composite materials. Materials 2020, 13, 1461. [Google Scholar] [CrossRef] [Green Version]
- Kuzmanović, M.; Delva, L.; Cardon, L.; Ragaert, K. The effect of injection molding temperature on the morphology and mechanical properties of PP/PET blends and microfibrillar composites. Polymers 2016, 8, 355. [Google Scholar] [CrossRef] [Green Version]
- Hung, F.S. Material application of a transformer box: A study on the electromagnetic shielding characteristics of Al–Ta coating film with plasma-spray process. Coatings 2019, 9, 495. [Google Scholar] [CrossRef] [Green Version]
- Wang, T.; Chen, G.; Wu, C.; Wu, D. Study on the graphite nanosheets/resin shielding coatings. Prog. Org. Coat. 2007, 59, 101–105. [Google Scholar] [CrossRef]
- Vardelle, A.; Vardelle, M.; Fauchais, P. Influence of velocity and surface temperature of alumina particles on the properties of plasma-sprayed coatings. Plasma Chem. Plasma Process. 1982, 2, 255–291. [Google Scholar] [CrossRef]
- Moglie, F.; Micheli, D.; Laurenzi, S.; Marchetti, M.; Primiani, V.M. Electromagnetic shielding performance of carbon foams. Carbon 2012, 50, 1972–1980. [Google Scholar] [CrossRef]
- Jalali, M.; Dauterstedt, S.; Michaud, A.; Wuthrich, R. Electromagnetic shielding of polymer–matrix composites with metallic nanoparticles. Compos. Part B Eng. 2011, 42, 1420–1426. [Google Scholar] [CrossRef]
- Jou, W.S.; Cheng, H.Z.; Hsu, C.F. The electromagnetic shielding effectiveness of carbon nanotubes polymer composites. J. Alloys Compd. 2007, 434, 641–645. [Google Scholar] [CrossRef]
- Mathew, S.; Rejikumar, P.R.; Yohannan, J.; Mathew, K.T.; Unnikrishnan, N.V. Microwave studies on the dielectric properties of Sm3+ and Sm3+/CdTe doped sol–gel silica glasses. J. Alloys Compd. 2008, 462, 456–459. [Google Scholar] [CrossRef]
- Hung, F.S.; Hung, F.Y.; Chiang, C.M. Crystallization and annealing effects of sputtered tin alloy films on electromagnetic interference shielding. Appl. Surf. Sci. 2011, 257, 3733–3738. [Google Scholar] [CrossRef]
- Hung, F.S.; Hung, F.Y.; Chiang, C.M.; Lui, T.S. Electromagnetic interference shielding characteristics of Sn-Al powder coating layers. Mater. Trans. 2008, 49, 655–660. [Google Scholar] [CrossRef] [Green Version]
- Lee, H.S.; Park, J.H.; Singh, J.K.; Choi, H.J.; Mandal, S.; Jang, J.M.; Yang, H.M. Electromagnetic shielding performance of carbon black mixed concrete with Zn–Al metal thermal spray coating. Materials 2020, 13, 895. [Google Scholar] [CrossRef] [Green Version]
- Wang, L.L.; Tay, B.K.; See, K.Y.; Sun, Z.; Tan, L.K.; Lua, D. Electromagnetic interference shielding effectiveness of carbon-based materials prepared by screen printing. Carbon 2009, 47, 1905–1910. [Google Scholar] [CrossRef]
- Wen, S.; Chung, D.D.L. Electromagnetic interference shielding reaching 70 dB in steel fiber cement. Cement Concr. Res. 2004, 34, 329–332. [Google Scholar] [CrossRef]
- Cheng, K.B.; Ramakrishna, S.; Lee, K.C. Electromagnetic shielding effectiveness of copper/glass fiber knitted fabric reinforced polypropylene composites. Compos. Part A Appl. Sci. Manuf. 2000, 31, 1039–1045. [Google Scholar] [CrossRef]
- Lee, D.; Kim, J.; Park, B.; Jo, I.; Lee, S.K.; Kim, Y.; Lee, S.B.; Cho, S. Mechanical and thermal neutron absorbing properties of B4C/aluminum alloy composites fabricated by stir casting and hot rolling process. Metals 2021, 11, 413. [Google Scholar] [CrossRef]
- Ma, X.; Zhang, Q.; Luo, Z.; Lin, X.; Wu, G. A novel structure of Ferro-Aluminum based sandwich composite for magnetic and electromagnetic interference shielding. Mater. Des. 2016, 89, 71–77. [Google Scholar] [CrossRef]
- Xu, Z.; Hao, H. Electromagnetic interference shielding effectiveness of aluminum foams with different porosity. J. Alloys Compd. 2014, 617, 207–213. [Google Scholar] [CrossRef]
- Xia, C.; Yu, J.; Shi, S.Q.; Qiu, Y.; Cai, L.; Wu, H.F.; Ren, H.; Nie, X.; Zhang, H. Natural fiber and aluminum sheet hybrid composites for high electromagnetic interference shielding performance. Compos. Part B Eng. 2017, 114, 121–127. [Google Scholar] [CrossRef]
- Luo, X.; Chung, D.D.L. Electromagnetic interference shielding using continuous carbon-fiber carbon-matrix and polymer-matrix composites. Compos. Part B Eng. 1999, 30, 227–231. [Google Scholar] [CrossRef]
- Jeon, Y.J.; Yun, J.H.; Kang, M.S. Analysis of Electromagnetic Shielding Properties of a Material Developed Based on Silver-Coated Copper Core-Shell Spraying. Materials 2022, 15, 5448. [Google Scholar] [CrossRef]
- Luo, X.; Chung, D.D.L. Electromagnetic interference shielding reaching 130 dB using flexible graphite. MRS Online Proc. Libr. 1996, 445, 235–238. [Google Scholar] [CrossRef]
- Afilipoaei, C.; Teodorescu-Draghicescu, H. A review over electromagnetic shielding effectiveness of composite materials. Proceedings 2020, 63, 23. [Google Scholar]
- Voigt, W. Uberdie Beziehung Zwischenden Beiden Elastizitatskonstanten Isotroper Korper. Wied. Ann. 1889, 38, 573–587. [Google Scholar] [CrossRef] [Green Version]
- Reuß, A. Berechnung der fließgrenze von mischkristallen auf grund der plastizitätsbedingung für einkristalle. ZAMM-J. Appl. Math. Mech. Z. Angew. Math. Mech. 1929, 9, 49–58. [Google Scholar] [CrossRef]
- Affdl, J.H.; Kardos, J.L. The Halpin-Tsai equations: A review. Polym. Eng. Sci. 1976, 16, 344–352. [Google Scholar] [CrossRef]
- Chamis, C.C. Mechanics of Composite Materials: Past, Present and Future. In Proceedings of the 21st Annual Meeting of the Society for Engineering Science; No. E-3936, Blacksburg, VA, USA, 15–17 October 1984. [Google Scholar]
- Kushch, V.I. Elastic equilibrium of spherical particle composites with transversely isotropic interphase and incoherent material interface. Int. J. Solids Struct. 2021, 232, 111180. [Google Scholar] [CrossRef]
- Kushch, V.I.; Sevostianov, I. Conductivity and elastic stiffness of spherical particle composite with partially disordered microstructure. Int. J. Eng. Sci. 2021, 162, 103473. [Google Scholar] [CrossRef]
- Staropoli, M.; Rogé, V.; Moretto, E.; Didierjean, J.; Michel, M.; Duez, B.; Steiner, P.; Thielen, G.; Lenoble, D.; Thomann, J.S. Hybrid silica-based fillers in nanocomposites: Influence of isotropic/isotropic and isotropic/anisotropic fillers on mechanical properties of styrene-butadiene (SBR)-based rubber. Polymers 2021, 13, 2413. [Google Scholar] [CrossRef]
- Liu, J.T.; Xie, F.Y.; He, Q.C.; Tang, S.L.; Xiao, C.W. Effective elastic isotropic moduli of highly filled particulate composites with arbitrarily shaped inhomogeneities. Mech. Mater. 2019, 135, 35–45. [Google Scholar] [CrossRef]
- Lefèvre, V.; Lopez-Pamies, O. The effective shear modulus of a random isotropic suspension of monodisperse rigid n-spheres: From the dilute limit to the percolation threshold. Extreme Mech. Lett. 2022, 55, 101818. [Google Scholar] [CrossRef]
- Zhao, X.; Wu, Y.; Fan, Z.; Li, F. Three-dimensional simulations of the complex dielectric properties of random composites by finite element method. J. Appl. Phys. 2004, 95, 8110–8117. [Google Scholar] [CrossRef] [Green Version]
- Bayat, A.; Gordaninejad, F. Characteristic volume element for randomly particulate magnetoactive composites. J. Eng. Mater. Technol. 2018, 140, 011003. [Google Scholar] [CrossRef]
- Wang, X.; Chen, H.; Liu, H.; Li, P.; Yan, Z.; Huang, C.; Zhao, Z.; Gu, Y. Simulation and optimization of continuous laser transmission welding between PET and titanium through FEM, RSM, GA and experiments. Opt. Lasers Eng. 2013, 51, 1245–1254. [Google Scholar] [CrossRef]
- Martínez-Barrera, G.; Martínez-López, M.; del Coz-Díaz, J.J.; López-Gayarre, F.; Varela-Guerrero, V. Waste polymers and gamma radiation on the mechanical improvement of polymer mortars: Experimental and calculated results. Case Stud. Constr. Mater. 2019, 11, e00273. [Google Scholar] [CrossRef]
- Kahraman, R.; Sunar, M.; Yilbas, B. Influence of adhesive thickness and filler content on the mechanical performance of aluminum single-lap joints bonded with aluminum powder filled epoxy adhesive. J. Mater. Process. Technol. 2008, 205, 183–189. [Google Scholar] [CrossRef]
- Tavman, I.H. Thermal and mechanical properties of aluminum powder-filled high-density polyethylene composites. J. Appl. Polym. Sci. 1996, 62, 2161–2167. [Google Scholar] [CrossRef]
- Babu, K.P.; Mohite, P.M.; Upadhyay, C.S. Development of an RVE and its stiffness predictions based on mathematical homogenization theory for short fibre composites. Int. J. Solids Struct. 2018, 130, 80–104. [Google Scholar] [CrossRef]
- Luo, Y. Microstructure-free finite element modeling for elasticity characterization and design of fine-particulate composites. J. Compos. Sci. 2022, 6, 35. [Google Scholar] [CrossRef]
- Gort, N.; Zhilyaev, I.; Brauner, C. Incremental Numerical Approach for Modeling the Macroscopic Viscoelastic Behavior of Fiber-Reinforced Composites Using a Representative Volume Element. Materials 2022, 15, 6724. [Google Scholar] [CrossRef] [PubMed]
- Ammarullah, M.I.; Santoso, G.; Sugiharto, S.; Supriyono, T.; Kurdi, O.; Tauviqirrahman, M.; Winarni, T.I.; Jamari, J. Tresca stress study of CoCrMo-on-CoCrMo bearings based on body mass index using 2D computational model. J. Tribol. 2022, 33, 31–38. [Google Scholar]
- Bary, B.; Haha, M.B.; Adam, E.; Montarnal, P. Numerical and analytical effective elastic properties of degraded cement pastes. Cement Concr. Res. 2009, 39, 902–912. [Google Scholar] [CrossRef]
- Huang, J.; Krabbenhoft, K.; Lyamin, A.V. Statistical homogenization of elastic properties of cement paste based on X-ray microtomography images. Int. J. Solids Struct. 2013, 50, 699–709. [Google Scholar] [CrossRef] [Green Version]
- Bernard, O.; Ulm, F.J.; Lemarchand, E. A multiscale micromechanics-hydration model for the early-age elastic properties of cement-based materials. Cement Concr. Res. 2003, 33, 1293–1309. [Google Scholar] [CrossRef]
- Hu, C.; Li, Z. Micromechanical investigation of Portland cement paste. Constr. Build. Mater. 2014, 71, 44–52. [Google Scholar] [CrossRef]
- Lavergne, F.; Fraj, A.B.; Bayane, I.; Barthélémy, J.F. Estimating the mechanical properties of hydrating blended cementitious materials: An investigation based on micromechanics. Cement Concr. Res. 2018, 104, 37–60. [Google Scholar] [CrossRef] [Green Version]
- Yu, P.; Duan, Y.H.; Chen, E.; Tang, S.W.; Wang, X.R. Microstructure-based fractal models for heat and mass transport properties of cement paste. Int. J. Heat Mass Transf. 2018, 126, 432–447. [Google Scholar] [CrossRef]
- Essabir, H.; Bensalah, M.O.; Rodrigue, D.; Bouhfid, R.; Qaiss, A. Structural, mechanical and thermal properties of bio-based hybrid composites from waste coir residues: Fibers and shell particles. Mech. Mater. 2016, 93, 134–144. [Google Scholar] [CrossRef]
- Pinfold, M.K. Composite Mechanical Properties for Use in Structural Analysis. Doctoral Dissertation, University of Warwick, Coventry, UK, 1995. [Google Scholar]
- Liu, B.; Feng, X.; Zhang, S.M. The effective Young’s modulus of composites beyond the Voigt estimation due to the Poisson effect. Compos. Sci. Technol. 2009, 69, 2198–2204. [Google Scholar] [CrossRef]
- Essabir, H.; Bensalah, M.O.; Rodrigue, D.; Bouhfid, R. Biocomposites based on Argan nut shell and a polymer matrix: Effect of filler content and coupling agent. Carbohydr. Polym. 2016, 143, 70–83. [Google Scholar] [CrossRef]
- Watt, J.P.; Davies, G.F.; O’Connell, R.J. The elastic properties of composite materials. Rev. Geophys. 1976, 14, 541–563. [Google Scholar] [CrossRef]
- Halpin, J.C. Effects of Environmental Factors on Composite Materials; Air Force Materials Lab: Montgomery, OH, USA, 1969. [Google Scholar]
- Jones, R.M. Mechanics of Composite Materials Hemisphere; Scripta Book Co.: New York, NY, USA, 1975; pp. 32–33. [Google Scholar]
- Jakubas, A.; Łada-Tondyra, E.; Makówka, M.; Suchecki, Ł. A Study on the Possibility of Using Iron Scale in the Construction of Electromagnetic Field Shields. Energies 2022, 15, 1332. [Google Scholar] [CrossRef]


| Properties | PET | AP |
|---|---|---|
| Elastic modulus (GPa) | 3.700 | 68.950 |
| Shear modulus (GPa) | 1.285 | 25.863 |
| Poisson’s ratio | 0.440 | 0.330 |
| Density (kg/m3) | 1330 | 2700 |
| AP VF (%) | 5 | 10 | 20 | 30 | 40 | 50 | 60 | 70 |
|---|---|---|---|---|---|---|---|---|
| Node (Ea) | 64,228 | 253,638 | 383,873 | 485,350 | 497,062 | 497,698 | 523,377 | 530,611 |
| Element (Ea) | 114,903 | 177,825 | 271,362 | 342,201 | 350,961 | 351,389 | 368,330 | 372,962 |
| Particles (Ea) | 72 | 145 | 261 | 404 | 447 | 448 | 449 | 456 |
| AP VF (%) | 5 | 10 | 20 | 30 | 40 | 50 | 60 | 70 |
|---|---|---|---|---|---|---|---|---|
| Elastic modulus (GPa) | 4.113 | 4.583 | 5.773 | 7.400 | 8.141 | 8.197 | 8.216 | 8.282 |
| Shear modulus (GPa) | 1.430 | 1.602 | 2.026 | 2.613 | 2.855 | 2.898 | 2.916 | 2.926 |
| Poisson’s ratio | 0.437 | 0.432 | 0.425 | 0.414 | 0.411 | 0.410 | 0.410 | 0.408 |
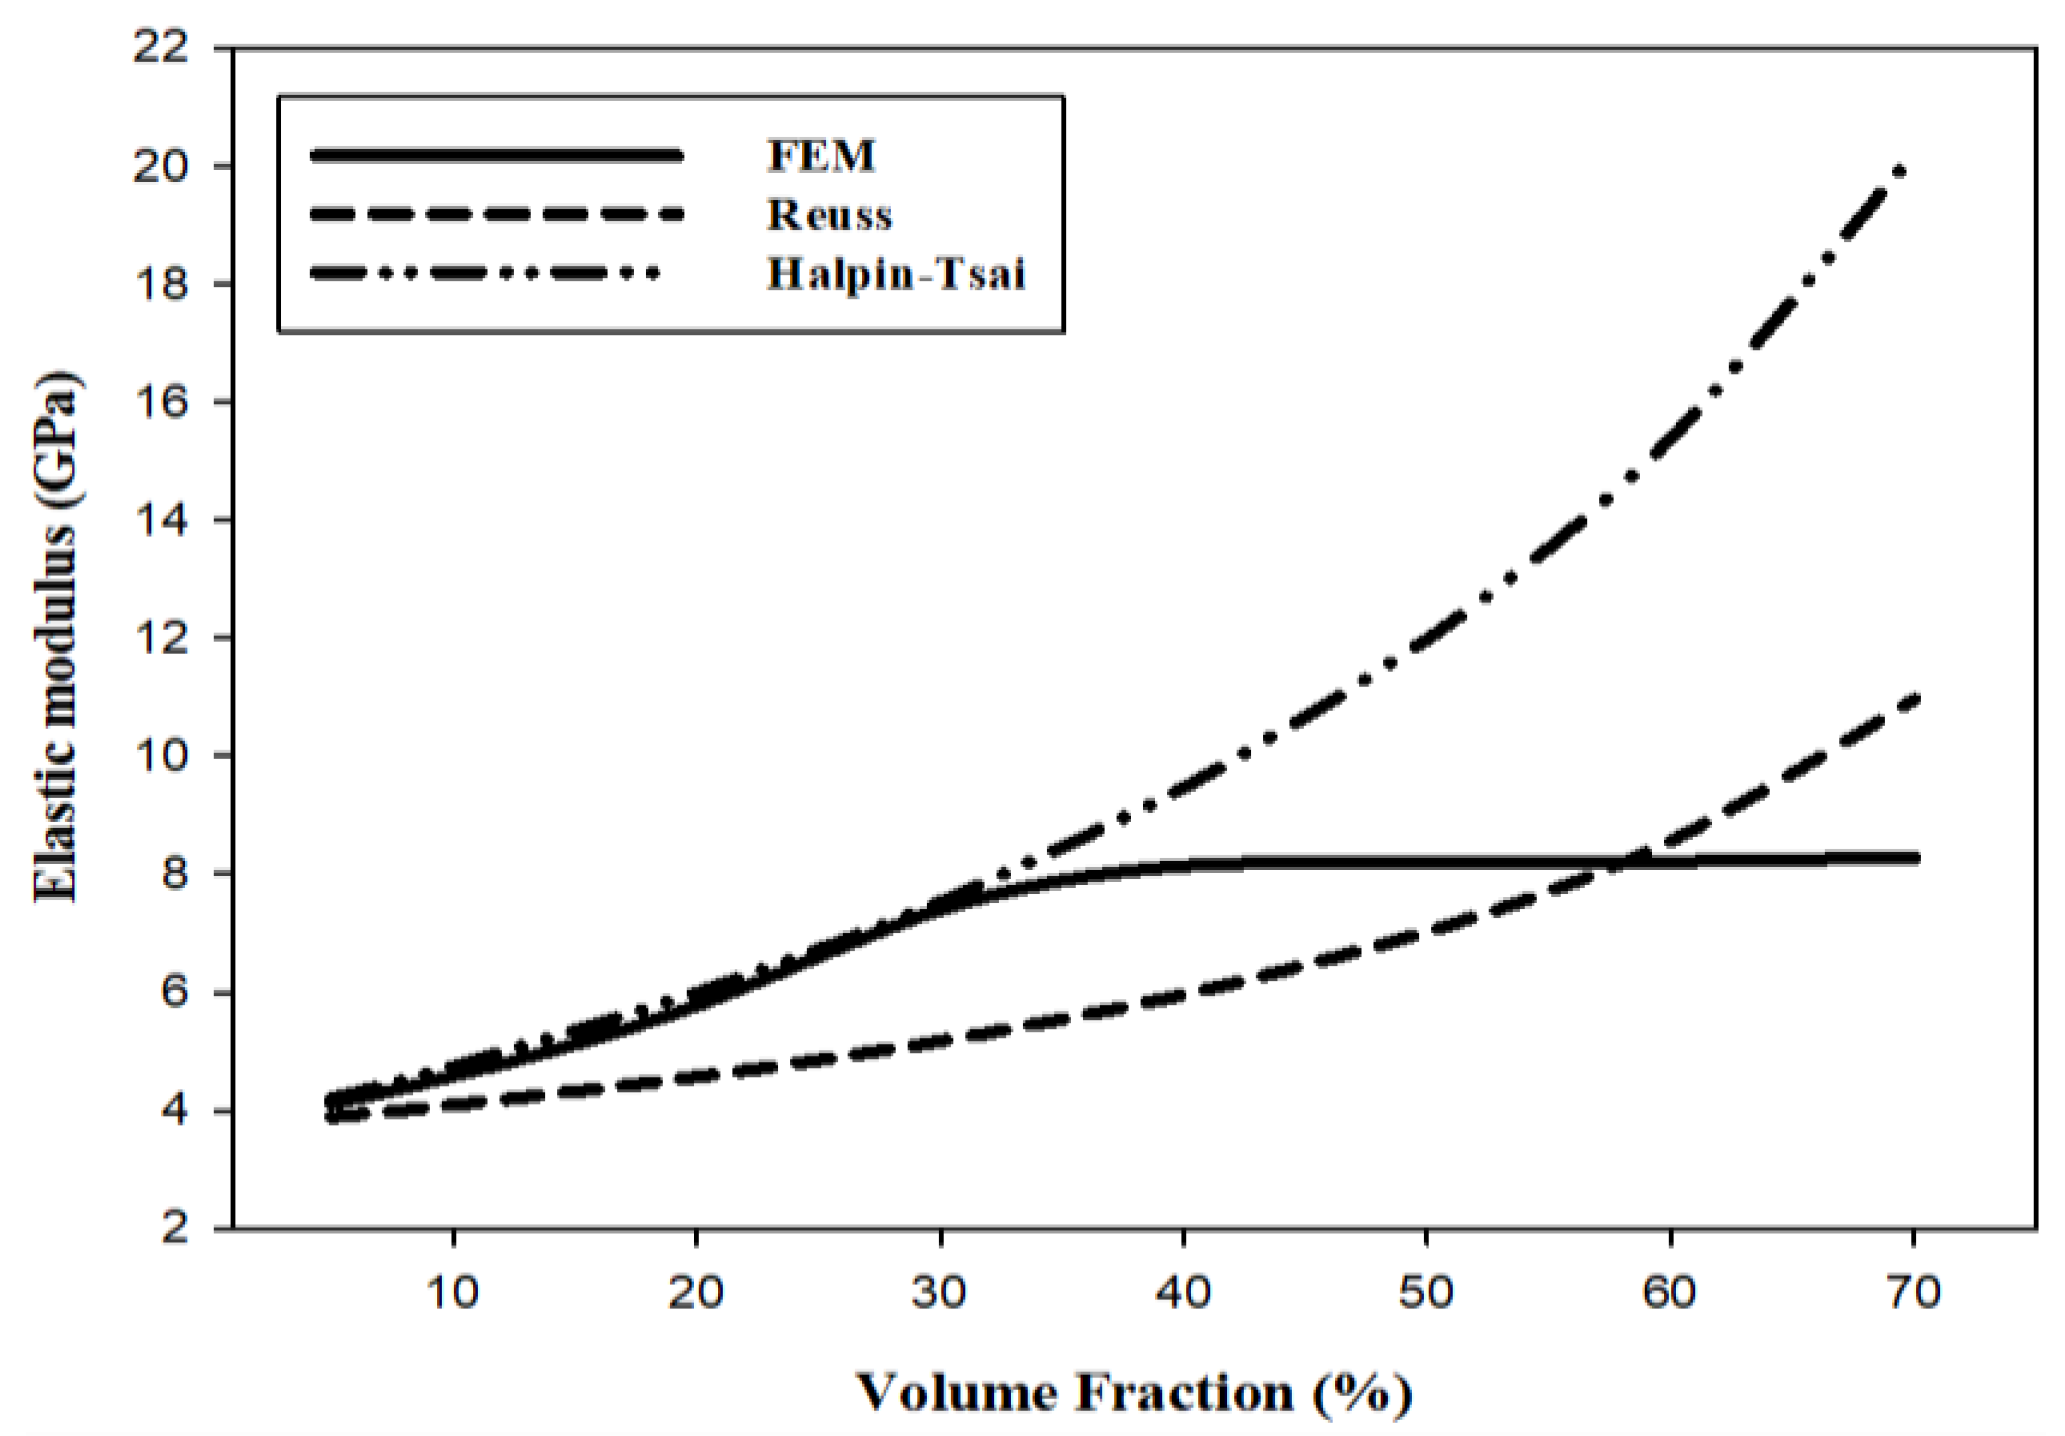
| AP VF (%) | 5 | 10 | 20 | 30 | 40 | 50 | 60 | 70 | |
|---|---|---|---|---|---|---|---|---|---|
| Elastic modulus (GPa) | FEM | 4.113 | 4.583 | 5.773 | 7.400 | 8.141 | 8.197 | 8.216 | 8.282 |
| Reuss | 3.884 | 4.087 | 4.564 | 5.167 | 5.954 | 7.023 | 8.561 | 10.961 | |
| Halpin-Tsai | 4.195 | 4.737 | 5.988 | 7.527 | 9.465 | 11.982 | 15.382 | 20.228 |
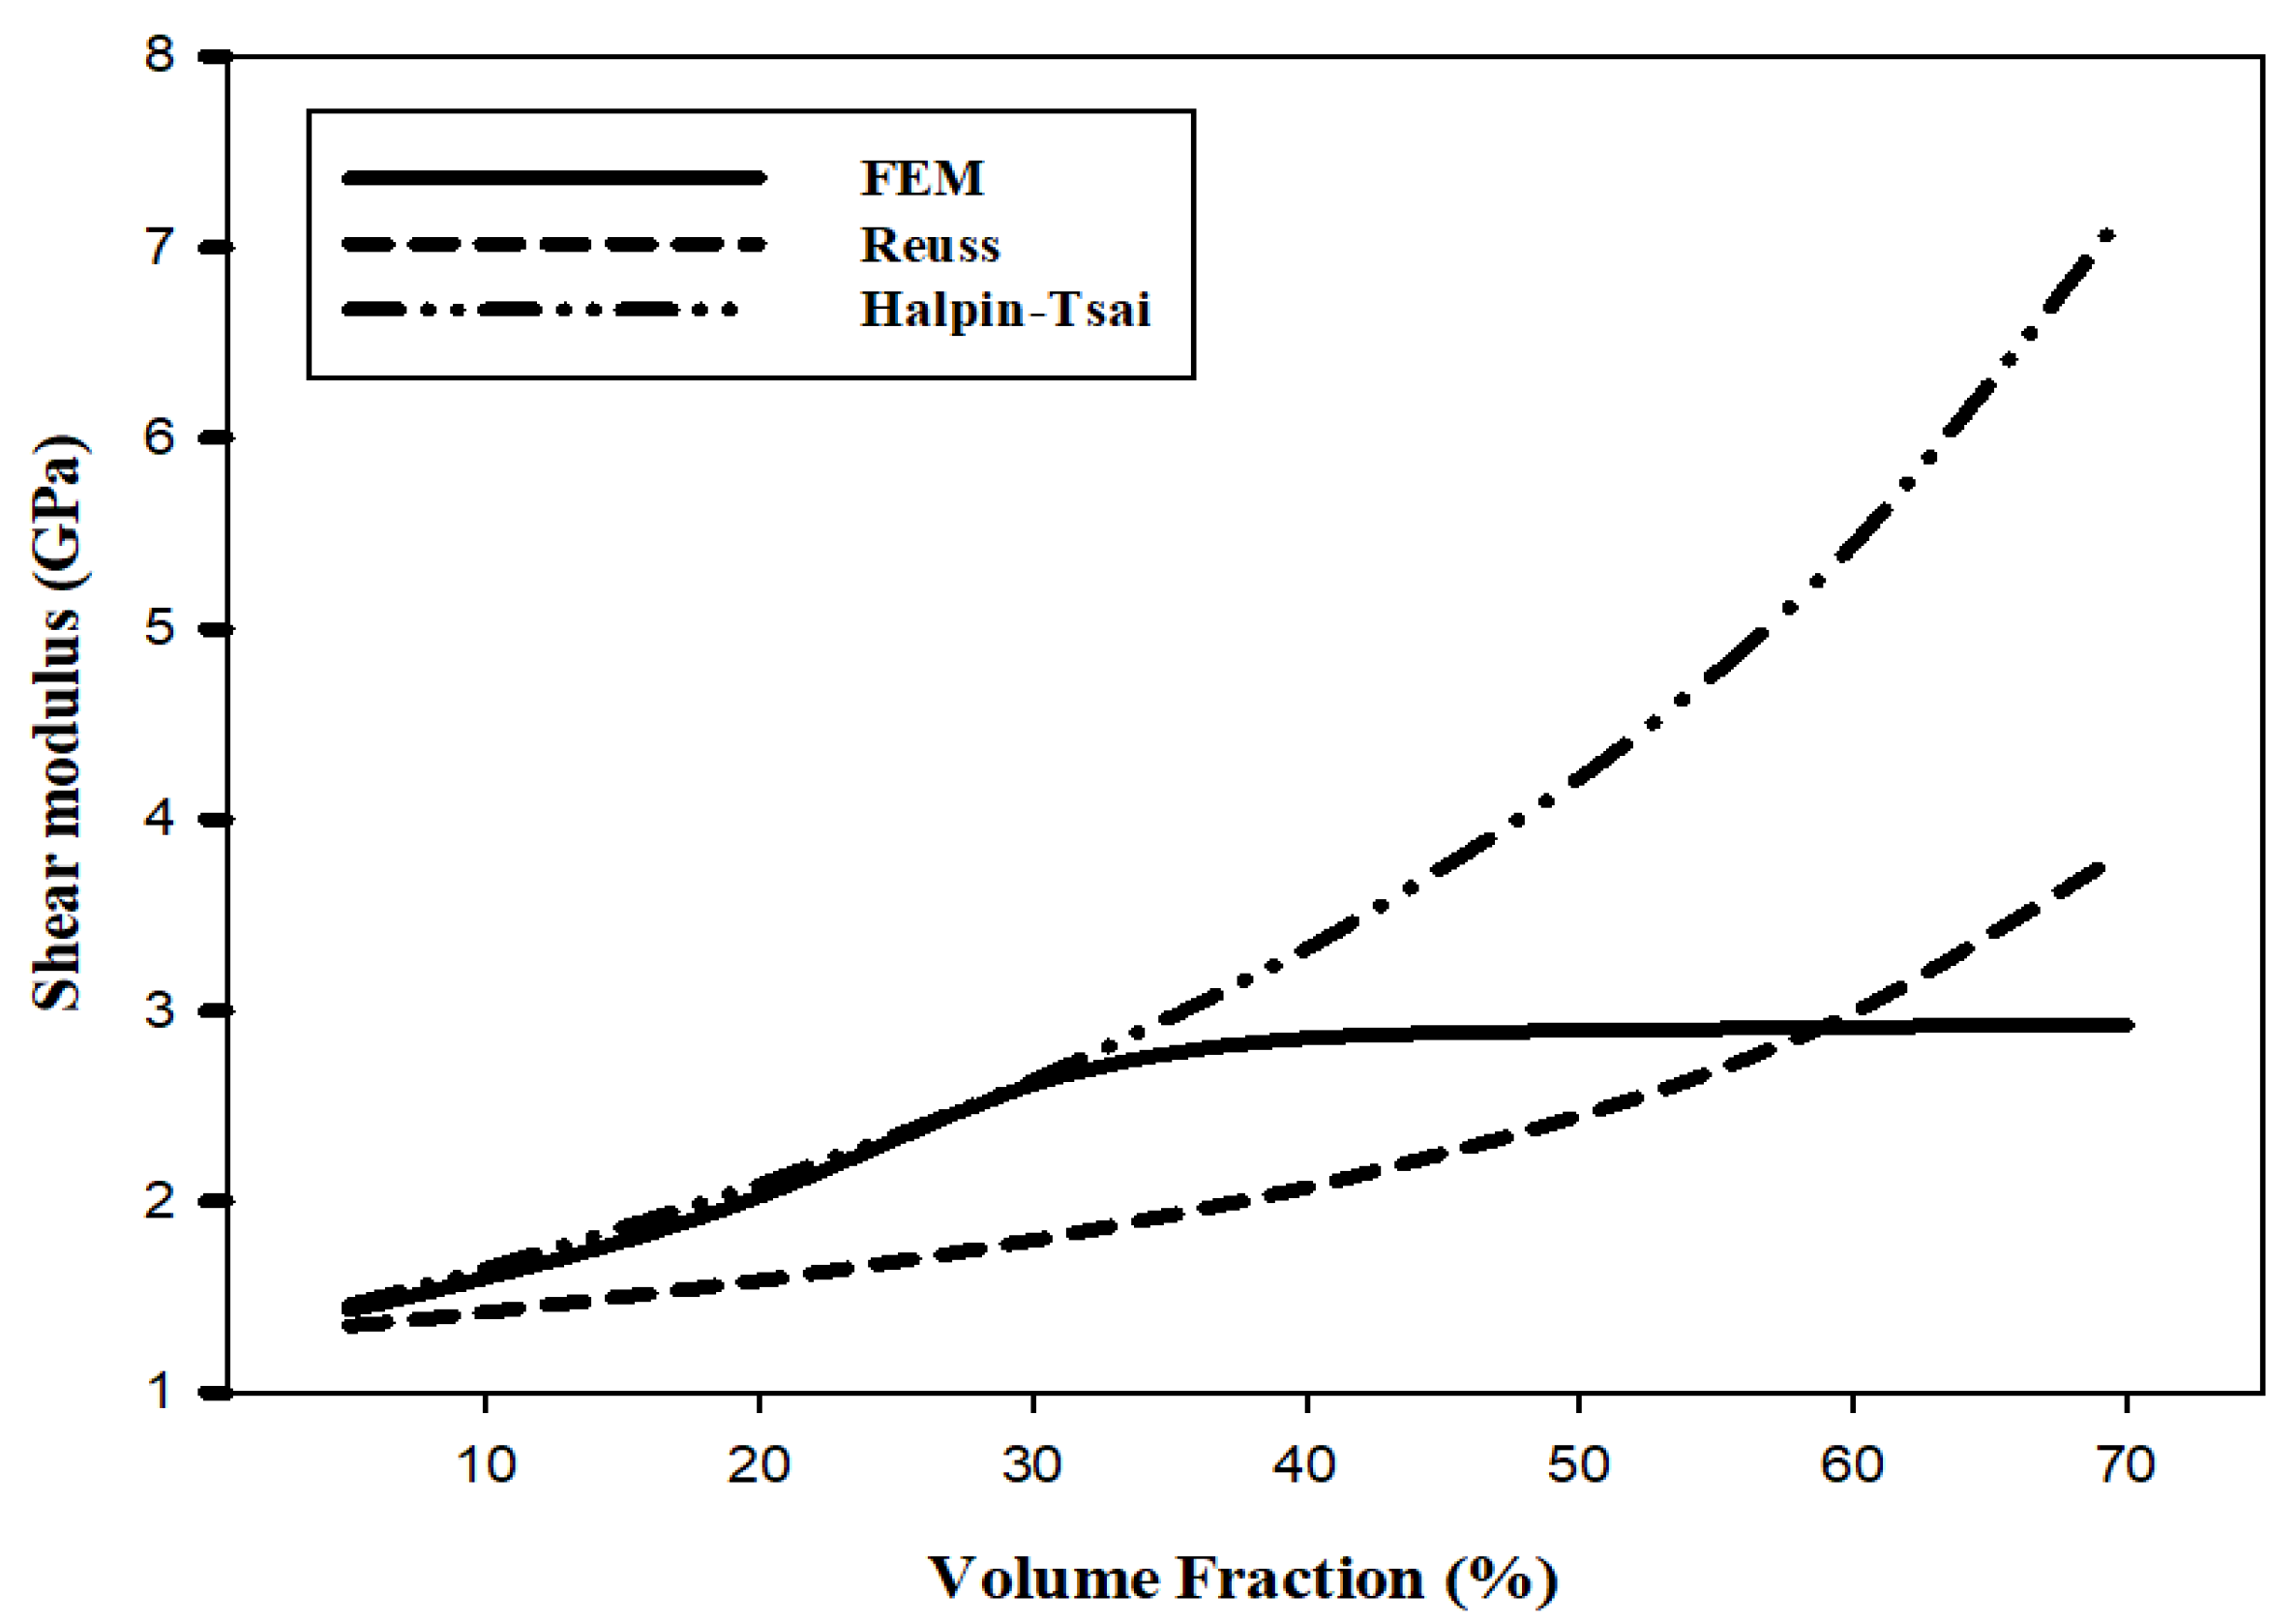
| AP VF (%) | 5 | 10 | 20 | 30 | 40 | 50 | 60 | 70 | |
|---|---|---|---|---|---|---|---|---|---|
| Shear modulus (GPa) | FEM | 1.430 | 1.602 | 2.026 | 2.613 | 2.855 | 2.927 | 2.898 | 2.916 |
| Reuss | 1.349 | 1.420 | 1.586 | 1.797 | 2.073 | 2.448 | 2.989 | 3.838 | |
| Halpin-Tsai | 1.459 | 1.649 | 2.090 | 2.634 | 3.322 | 4.219 | 5.438 | 7.191 |
| AP VF (%) | 5 | 10 | 20 | 30 | 40 | 50 | 60 | 70 | |
|---|---|---|---|---|---|---|---|---|---|
| Poisson’s ratio | FEM | 0.437 | 0.432 | 0.425 | 0.414 | 0.411 | 0.410 | 0.410 | 0.408 |
| Reuss | 0.433 | 0.426 | 0.413 | 0.401 | 0.390 | 0.379 | 0.369 | 0.359 | |
| Halpin-Tsai | 0.434 | 0.428 | 0.417 | 0.406 | 0.395 | 0.384 | 0.374 | 0.363 |
Publisher’s Note: MDPI stays neutral with regard to jurisdictional claims in published maps and institutional affiliations. |
© 2022 by the authors. Licensee MDPI, Basel, Switzerland. This article is an open access article distributed under the terms and conditions of the Creative Commons Attribution (CC BY) license (https://creativecommons.org/licenses/by/4.0/).
Share and Cite
Jeon, Y.-J.; Yun, J.-H.; Kang, M.-S. Analysis of Elastic Properties of Al/PET Isotropic Composite Materials Using Finite Element Method. Materials 2022, 15, 8007. https://doi.org/10.3390/ma15228007
Jeon Y-J, Yun J-H, Kang M-S. Analysis of Elastic Properties of Al/PET Isotropic Composite Materials Using Finite Element Method. Materials. 2022; 15(22):8007. https://doi.org/10.3390/ma15228007
Chicago/Turabian StyleJeon, Yu-Jae, Jong-Hwan Yun, and Min-Soo Kang. 2022. "Analysis of Elastic Properties of Al/PET Isotropic Composite Materials Using Finite Element Method" Materials 15, no. 22: 8007. https://doi.org/10.3390/ma15228007