
Synthesis of Chlorine- and Nitrogen-Containing Carbon Nanofibers for Water Purification from Chloroaromatic Compounds

 , , ,
, , ,  ,
,  , and
, and
Abstract
:1. Introduction
2. Materials and Methods
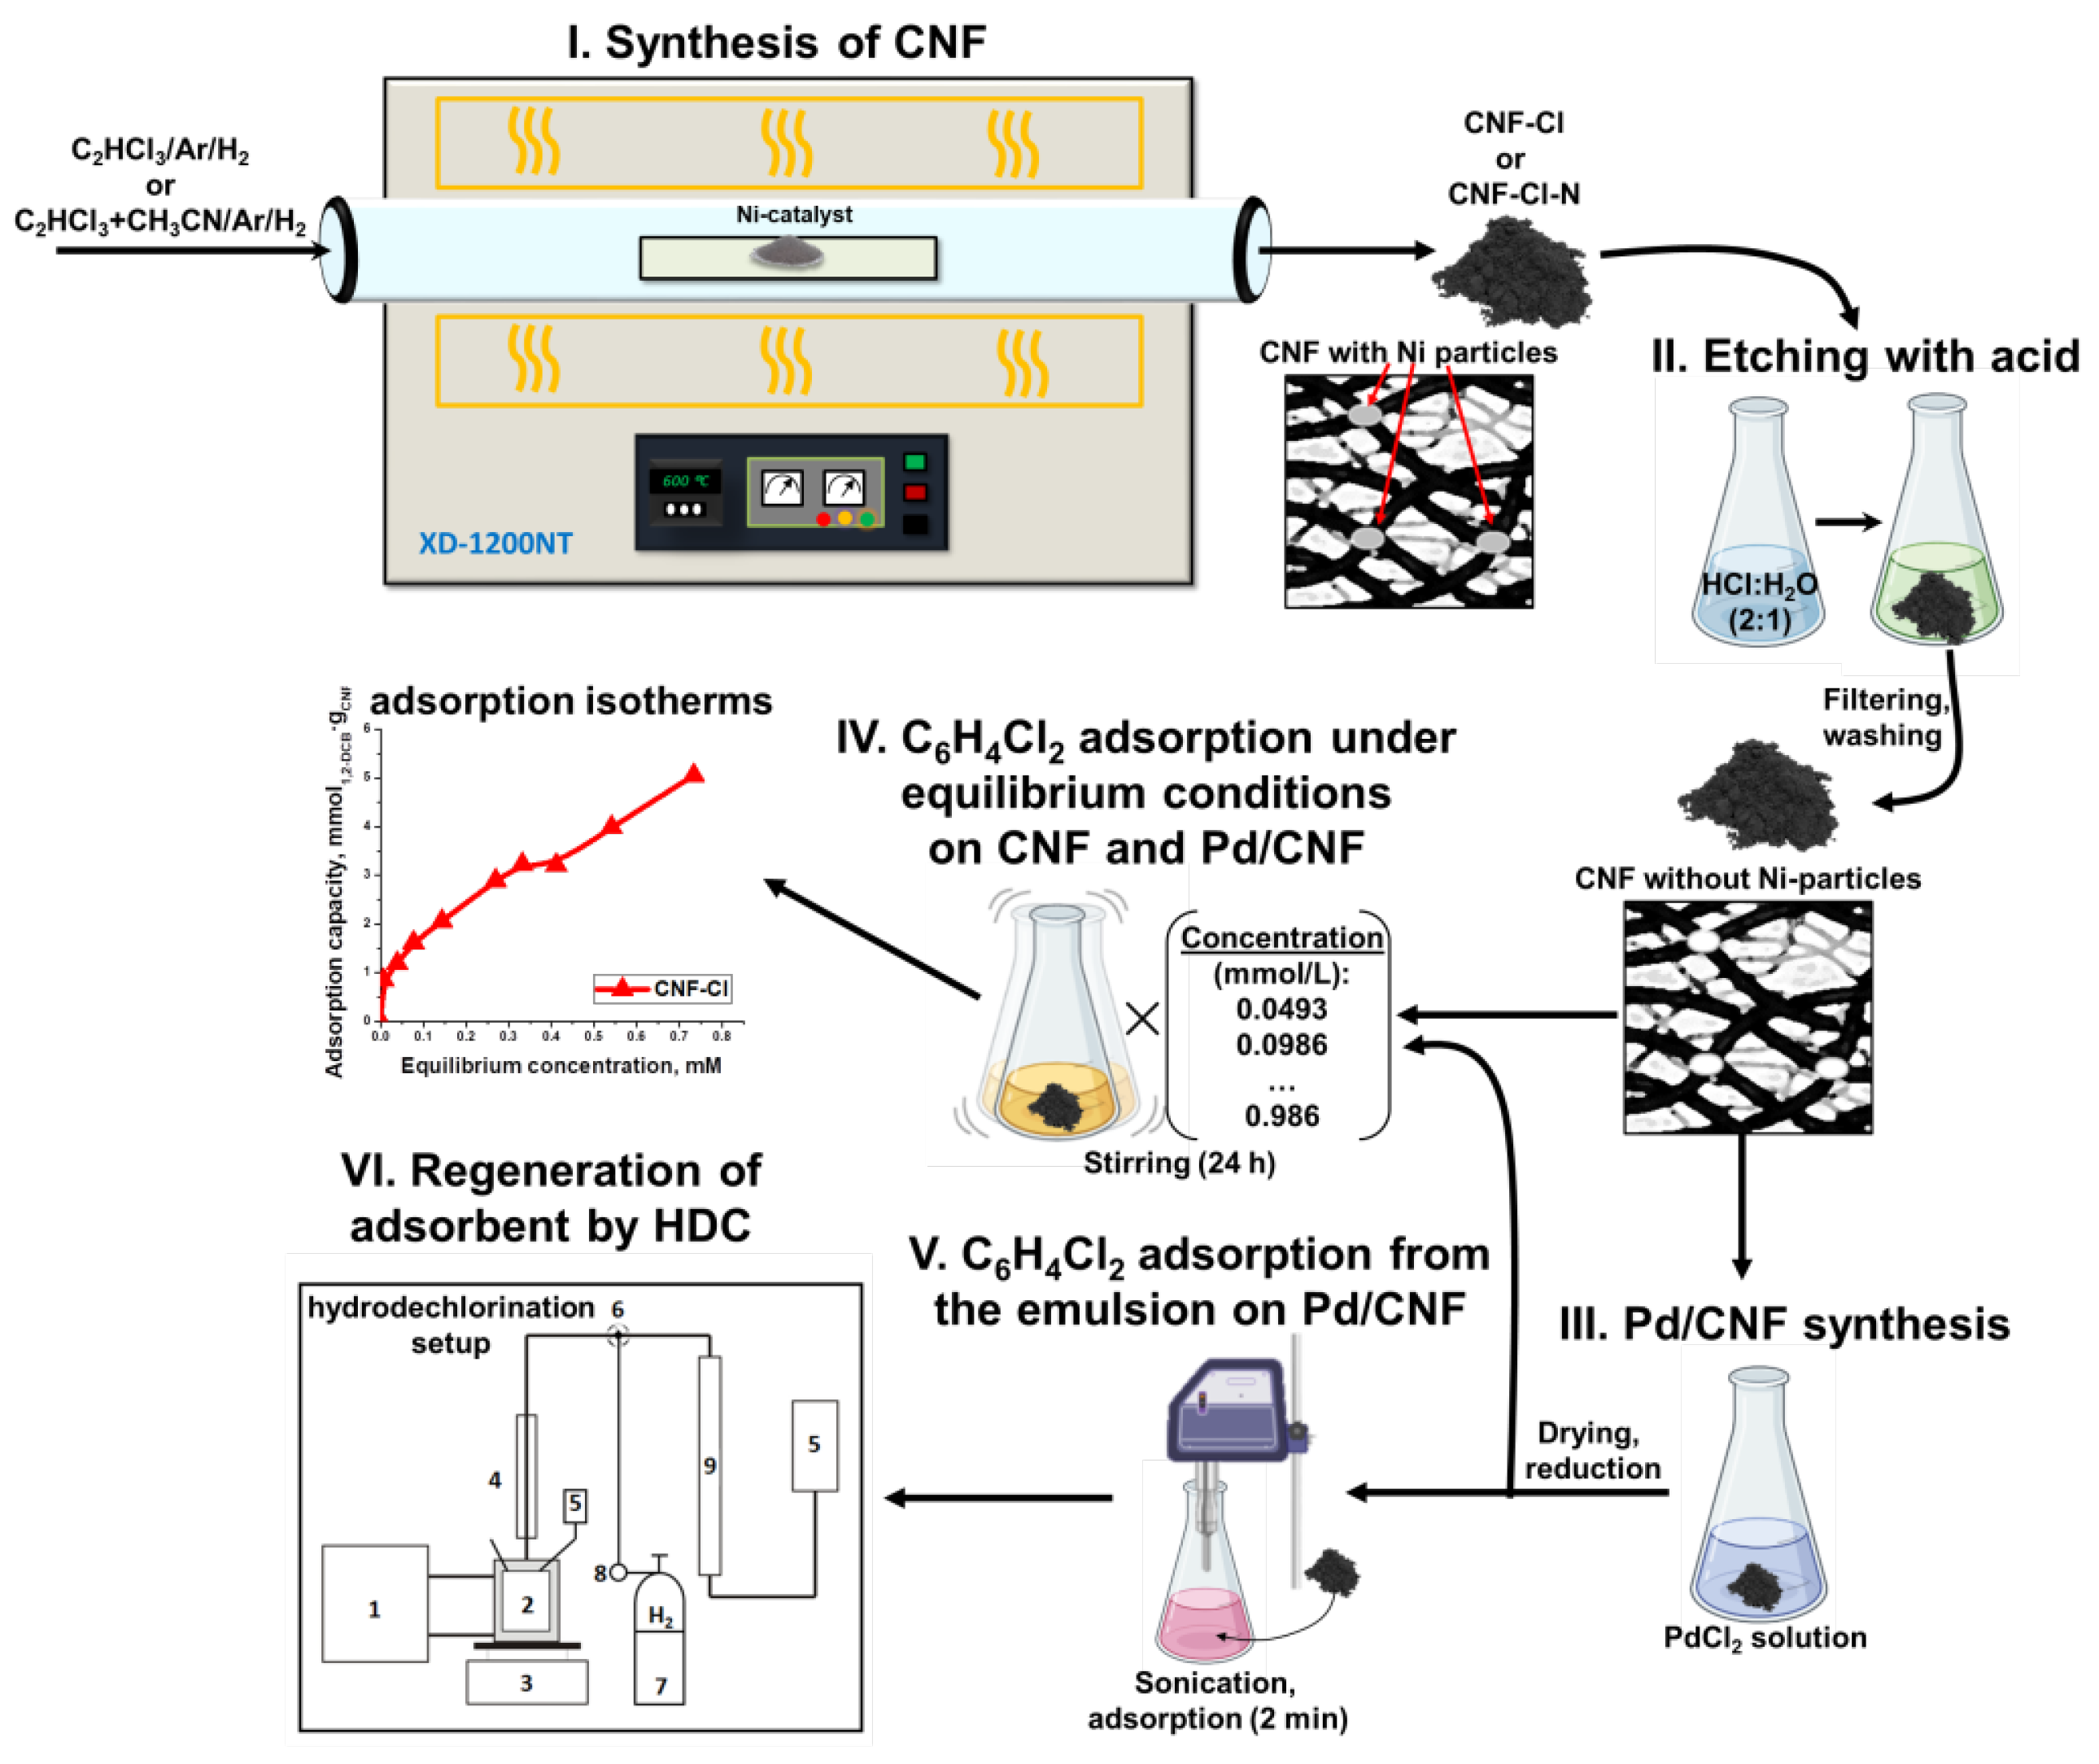
2.1. Synthesis of Functionalized CNFs
2.2. Synthesis of the Pd/CNF Adsorbent-Catalysts
2.3. Study on 1,2-DCB Adsorption from Aqueous Solution under Equilibrium Conditions
2.3.1. Measurement Procedure
2.3.2. Adsorption Isotherm Modeling
Langmuir Isotherm
Dubinin-Astakhov Isotherm
2.4. Testing Pd/CNF in the Adsorptive-Catalytic Cycle
2.5. Characterization of the Samples
3. Results and Discussion
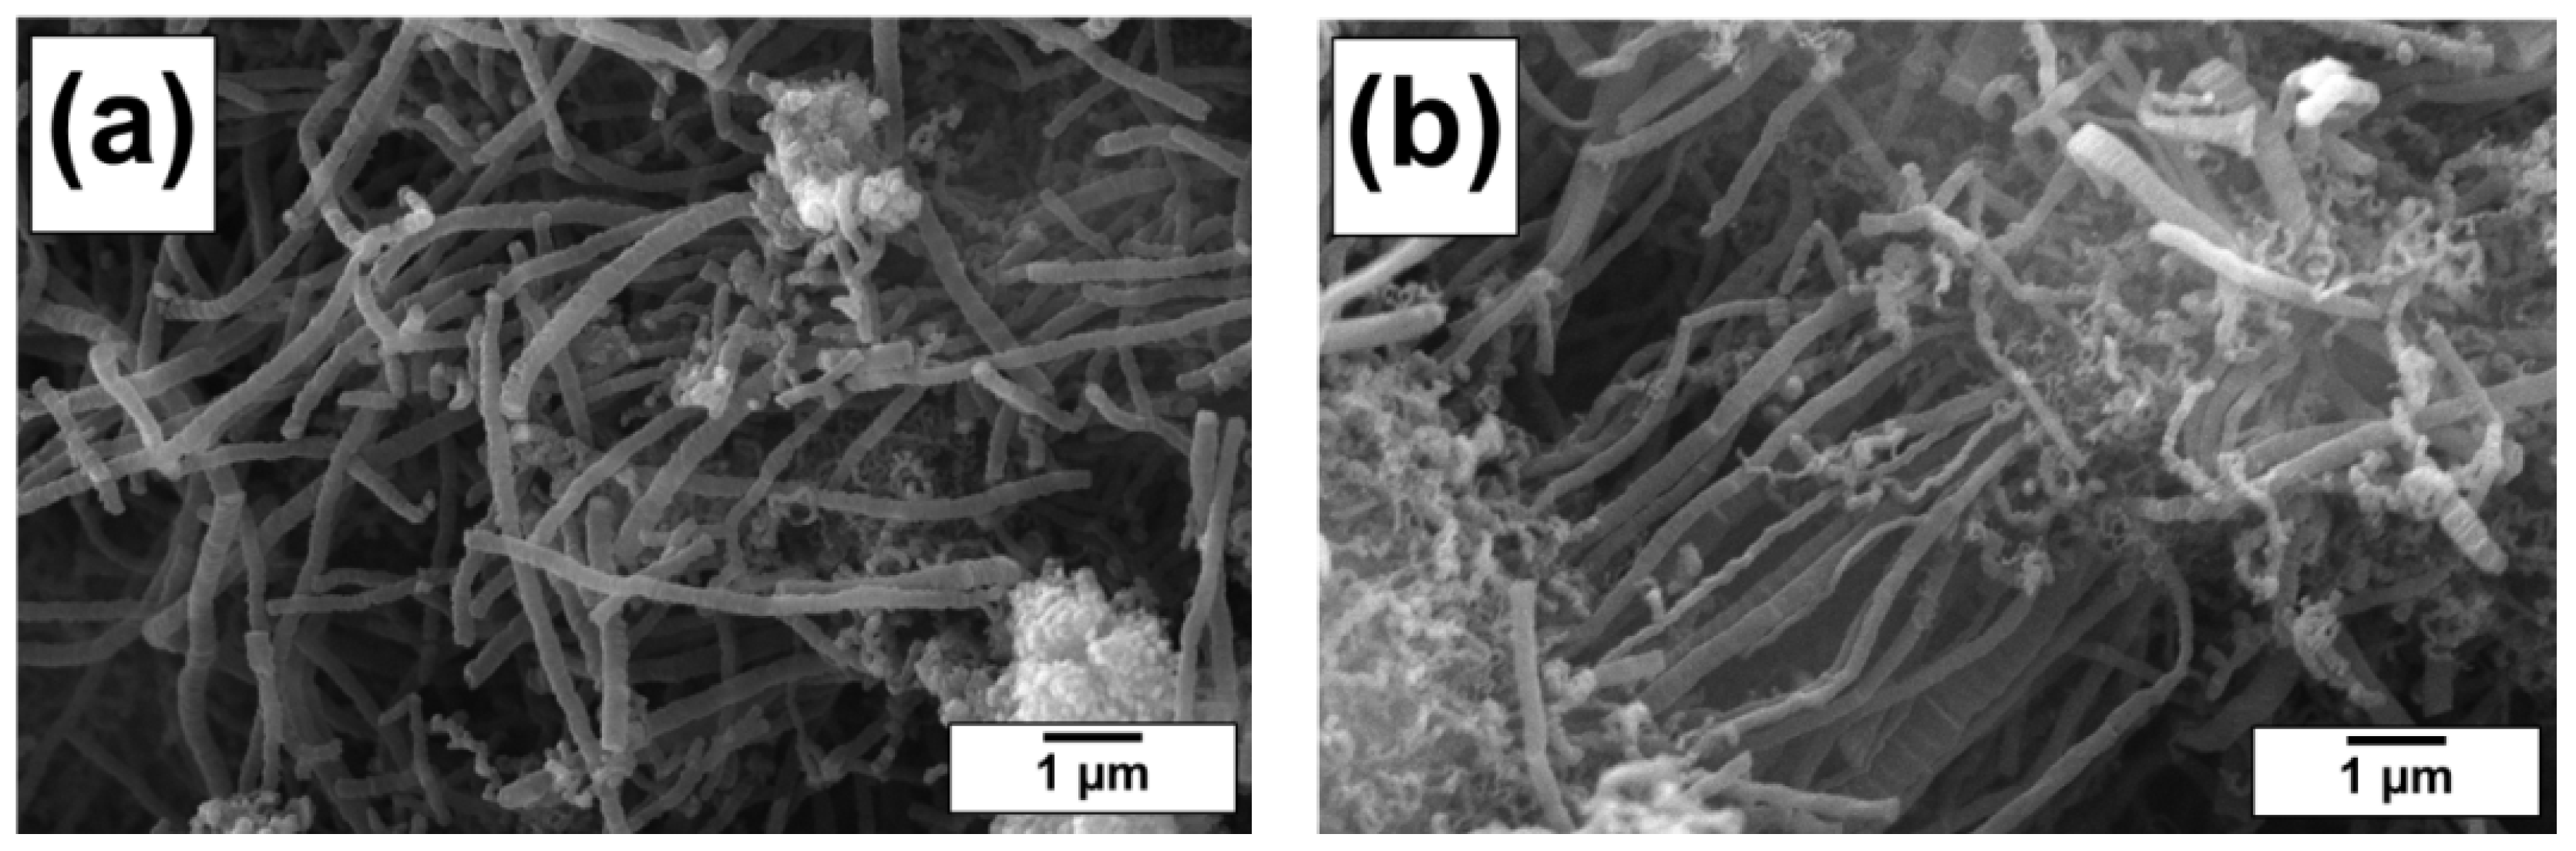
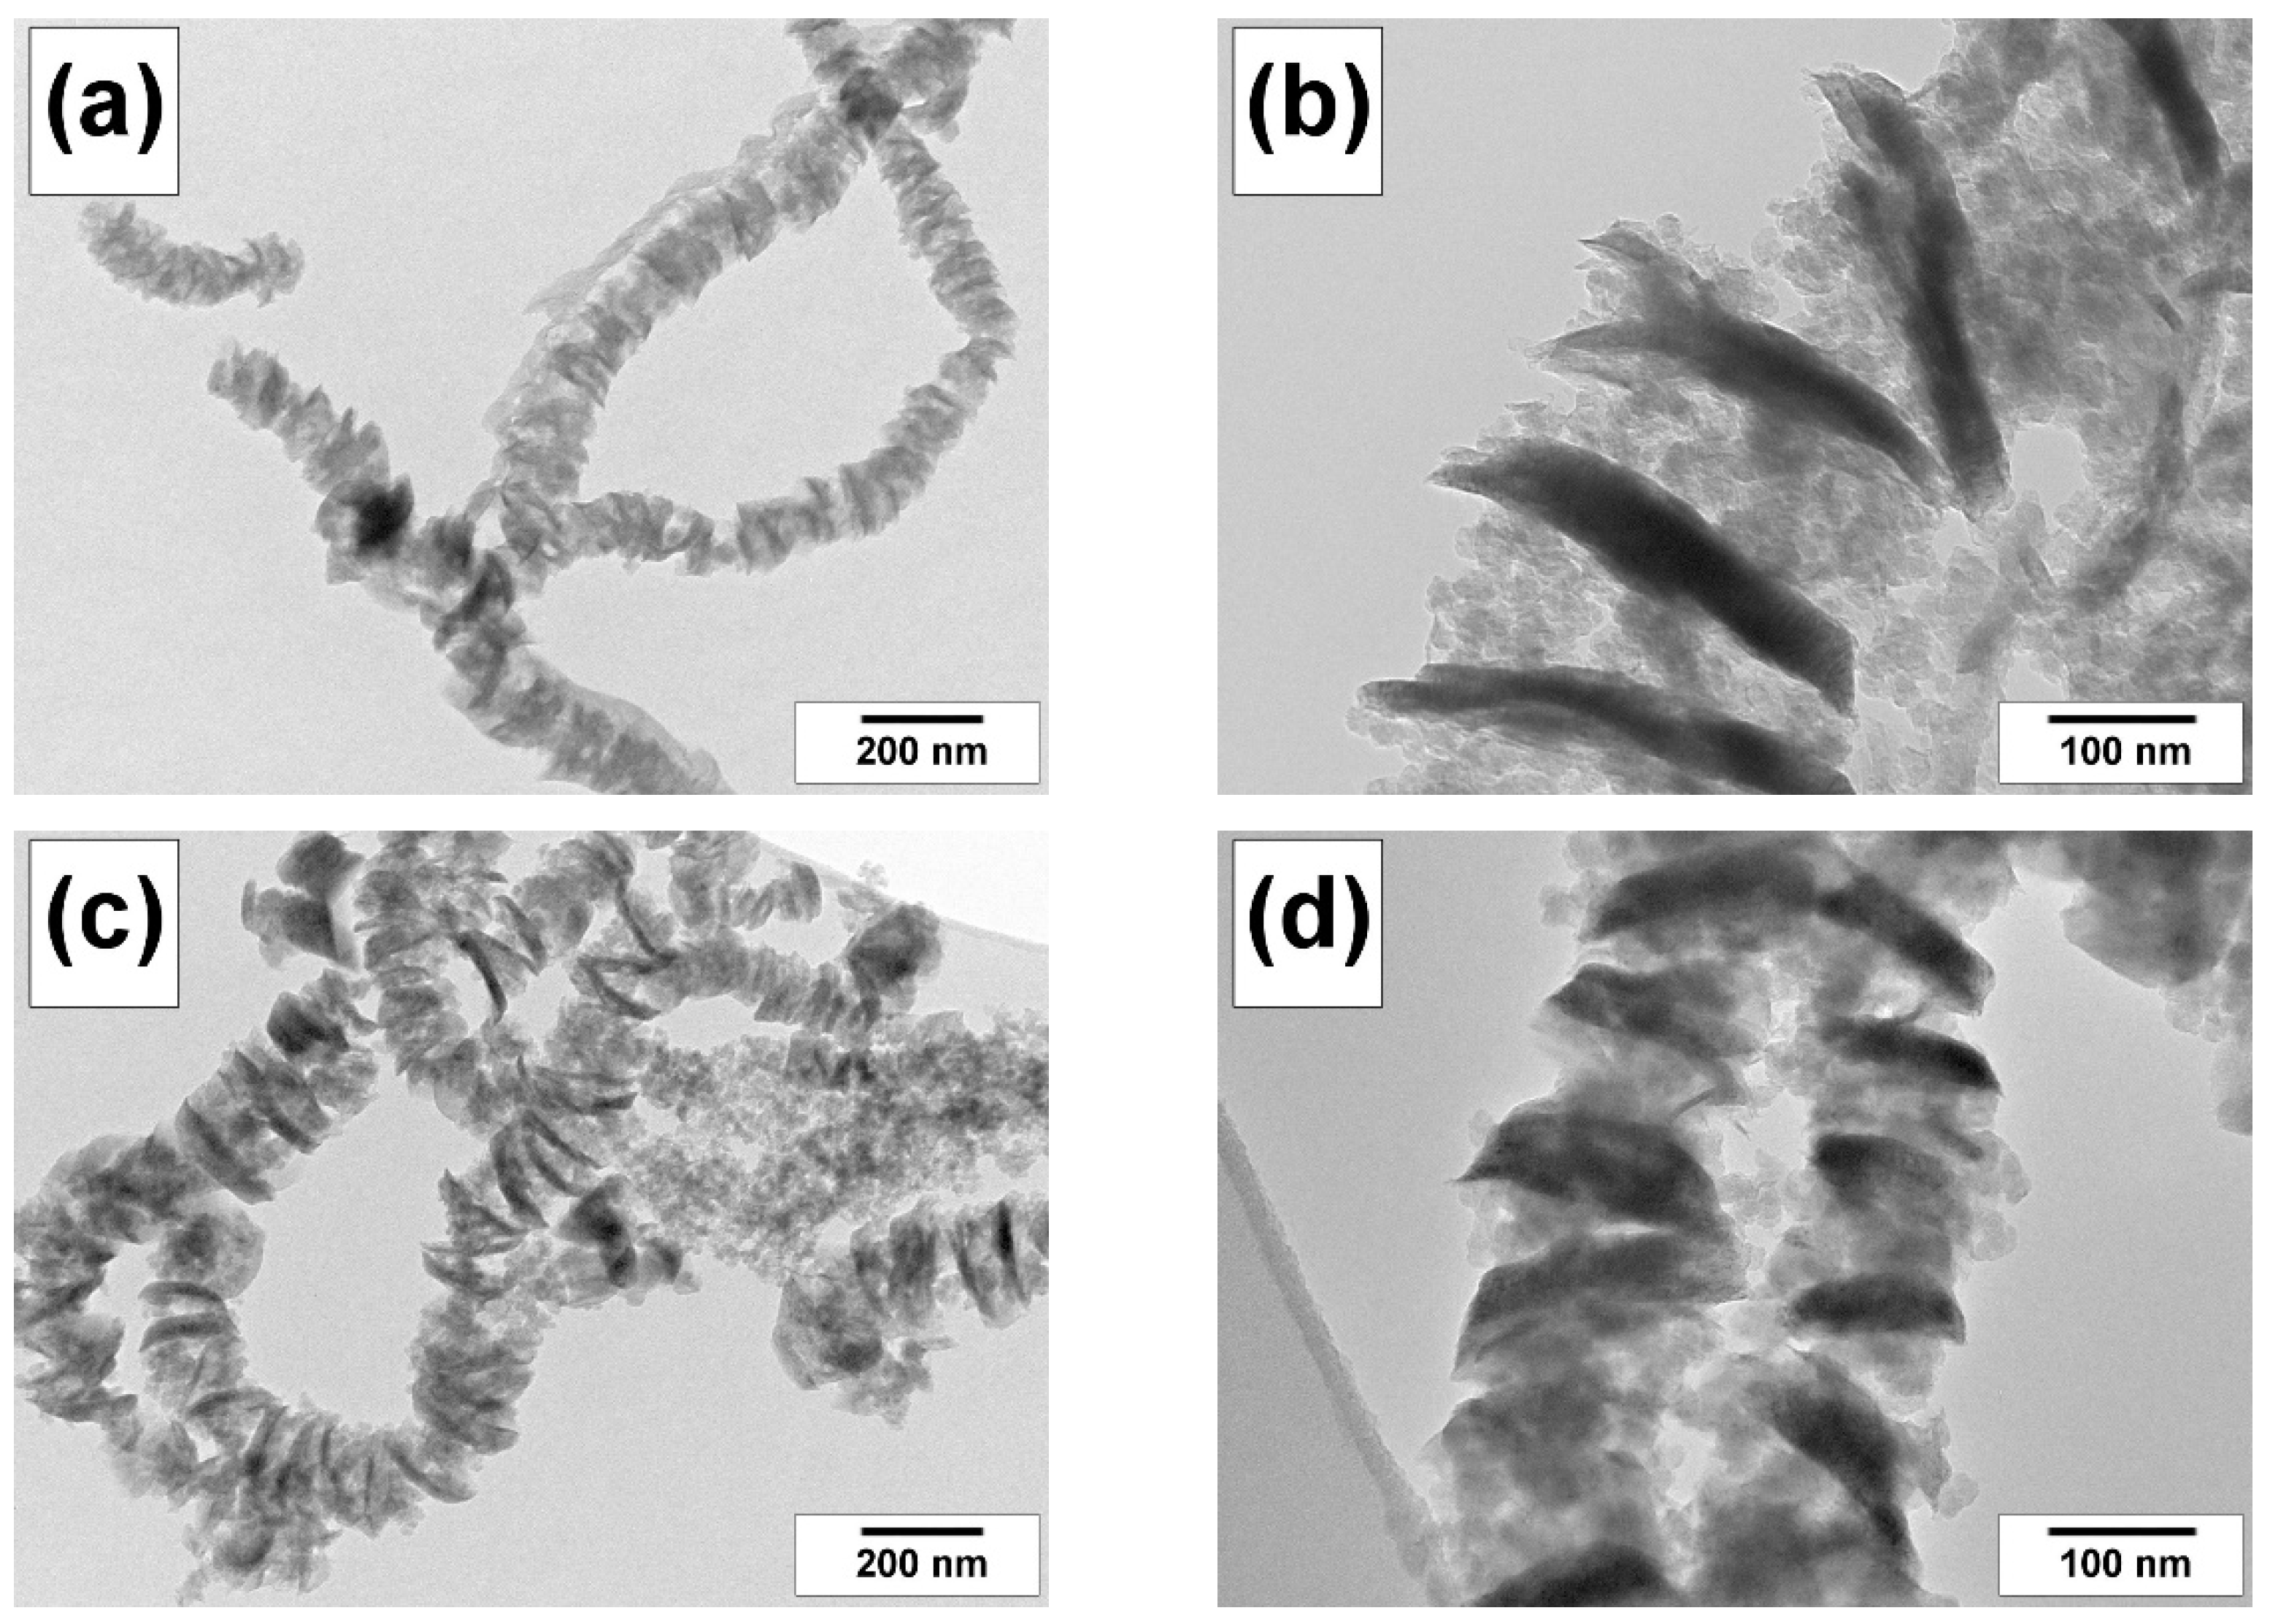
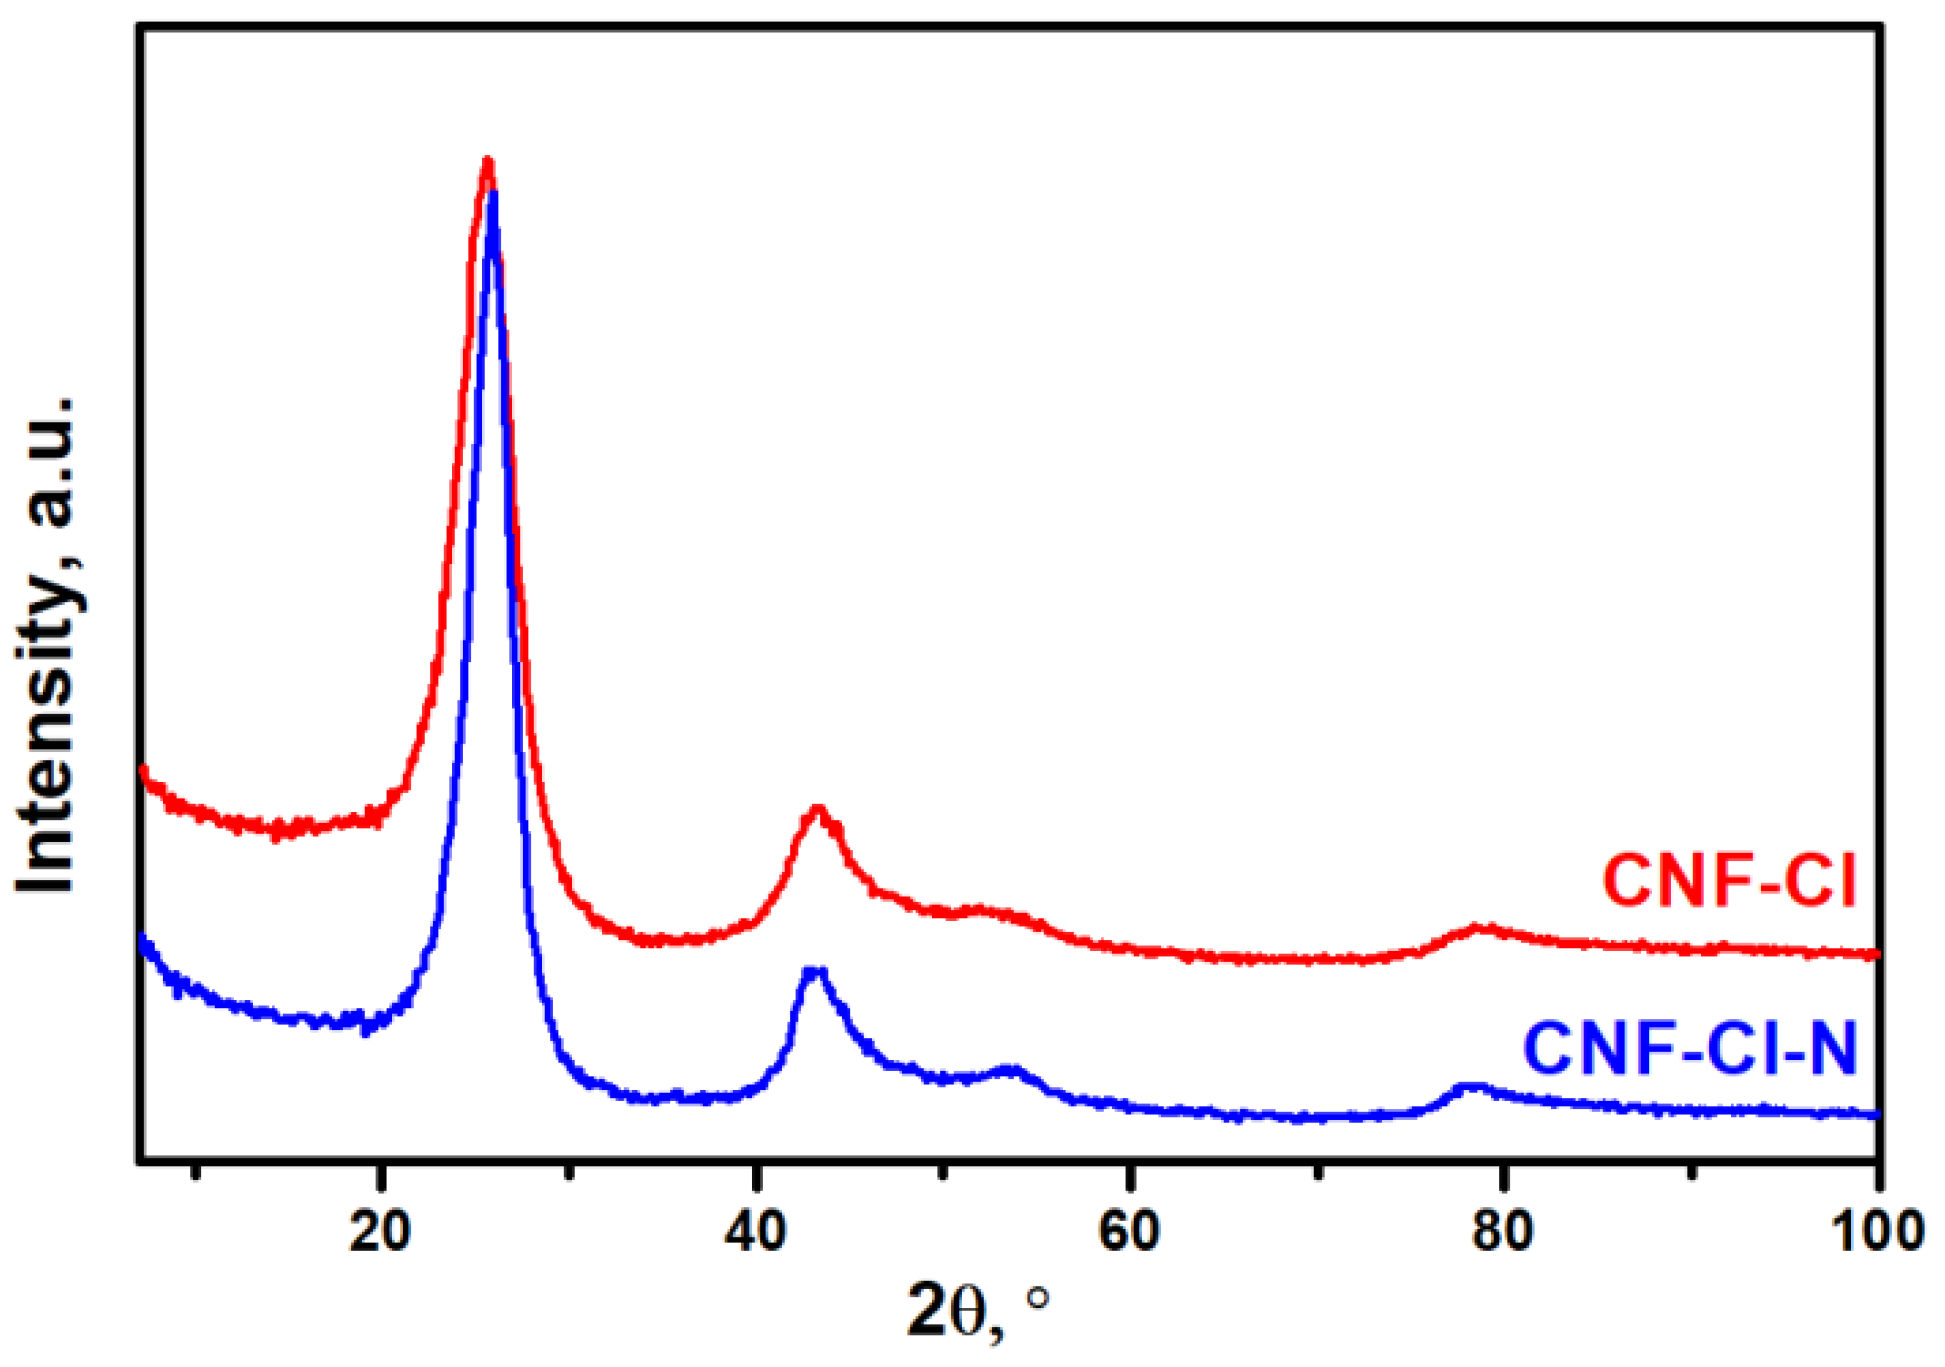
3.1. Characterization of CNF Samples
3.2. Adsorbtion of 1,2-DCB from Aqueous Solutions
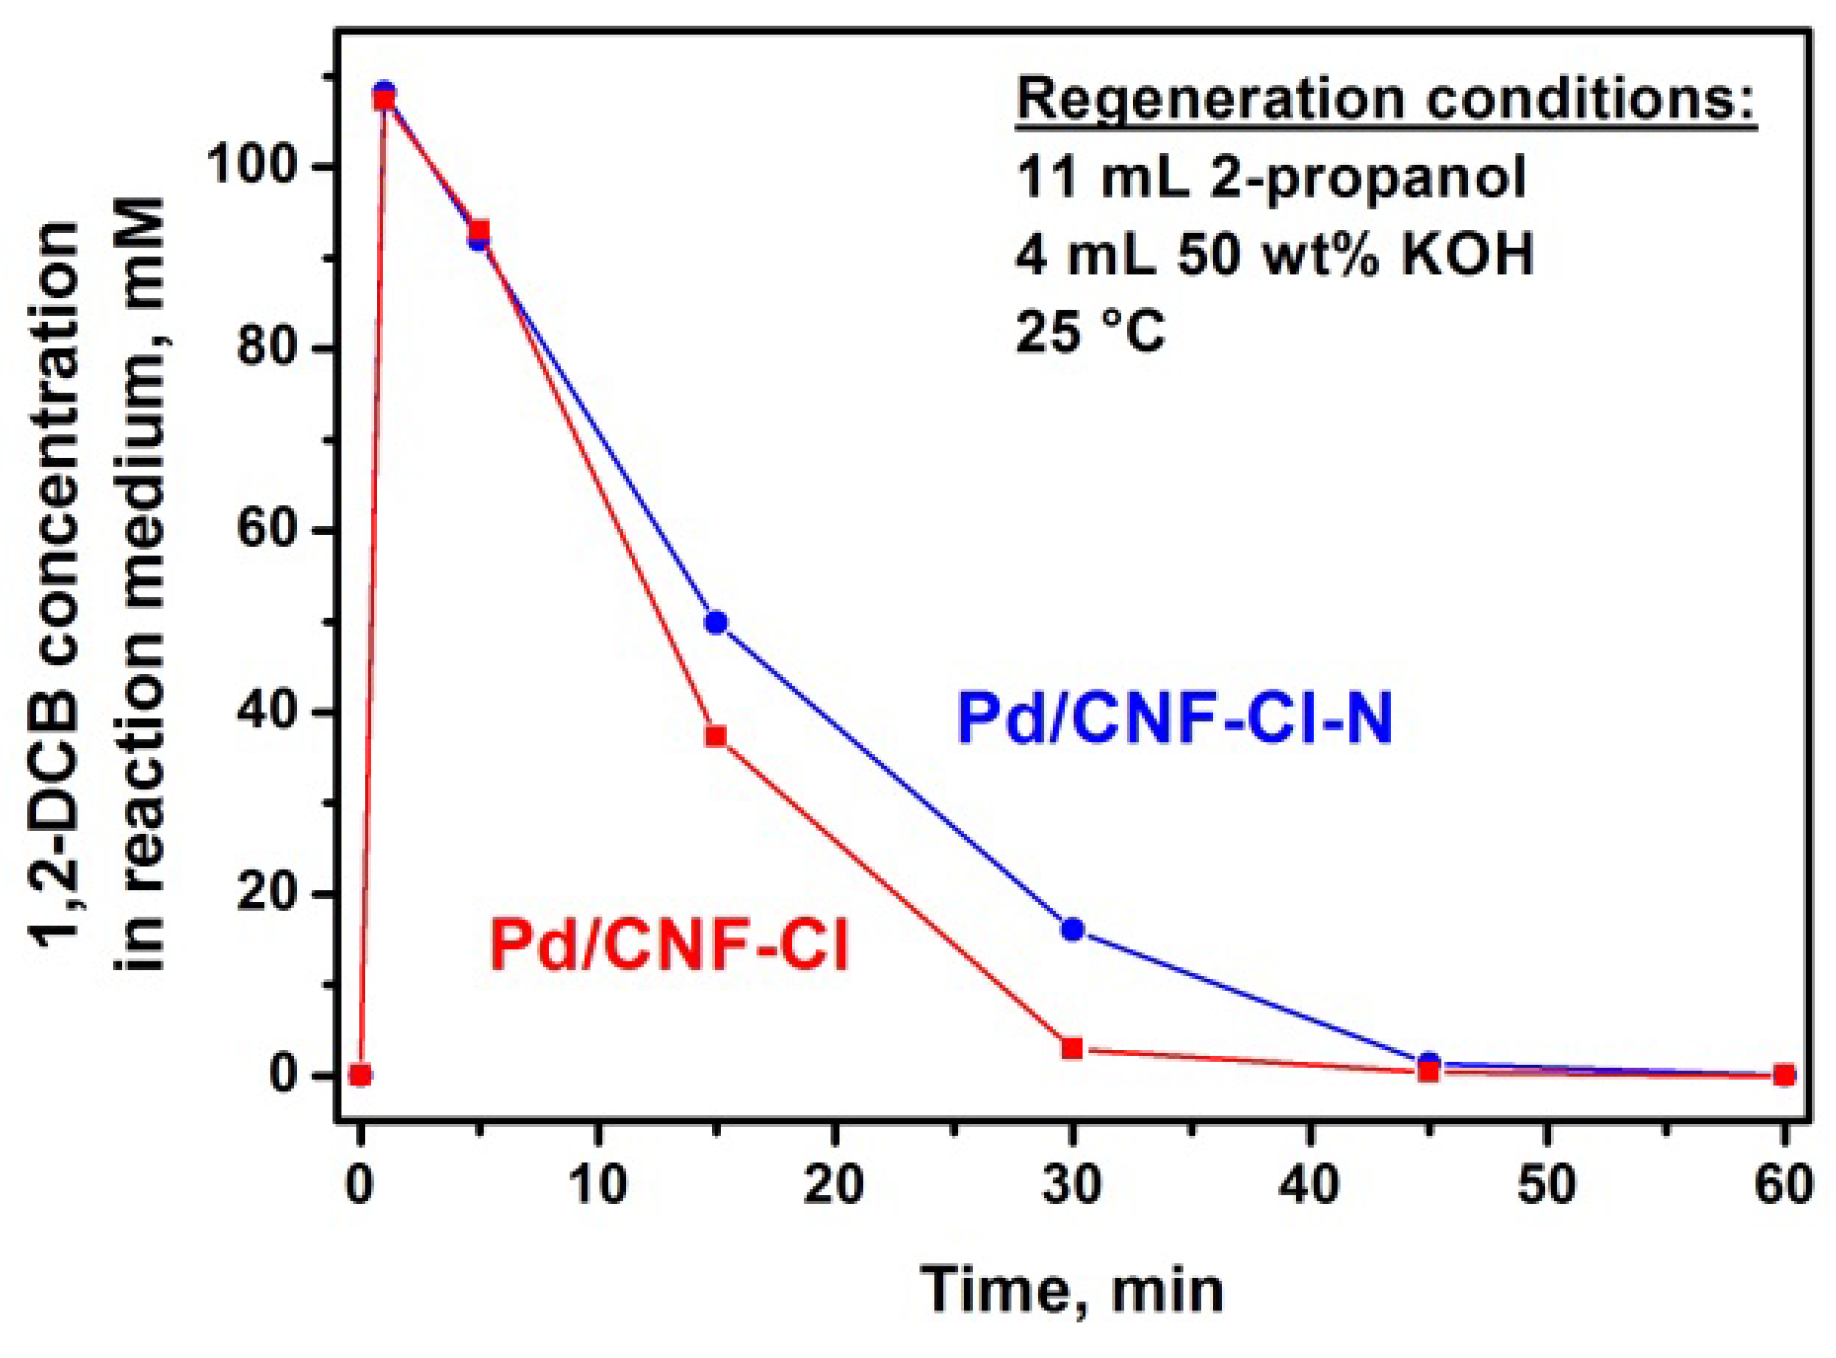
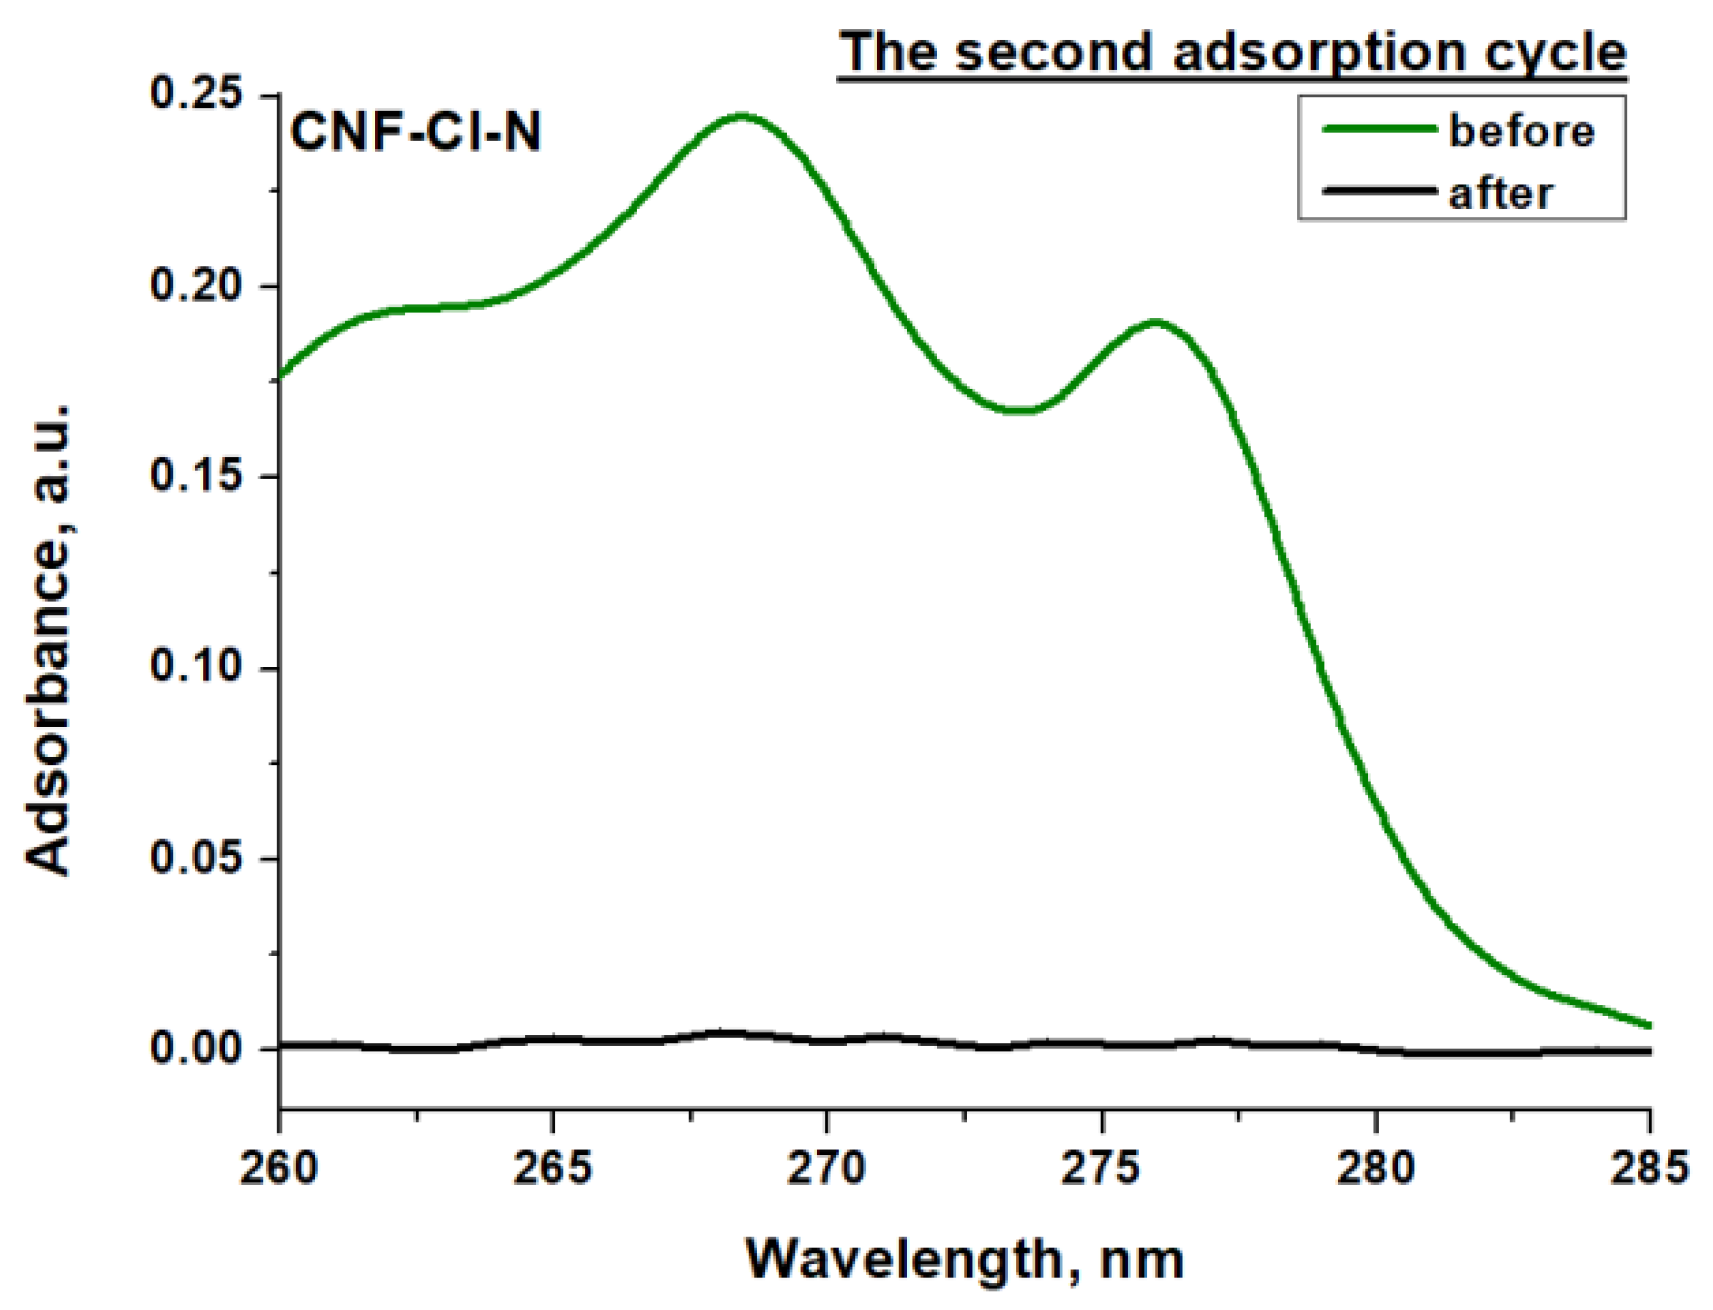
3.3. Adsorptive-Catalytic Cycle of the Purification of 1,2-DCB Aqueous Emulsions
4. Conclusions
Supplementary Materials
Author Contributions
Funding
Institutional Review Board Statement
Informed Consent Statement
Data Availability Statement
Acknowledgments
Conflicts of Interest
References
- Huang, B.; Lei, C.; Wei, C.; Zeng, G. Chlorinated volatile organic compounds (Cl-VOCs) in environment—Sources, potential human health impacts, and current remediation technologies. Environ. Int. 2014, 71, 118–138. [Google Scholar] [CrossRef] [PubMed]
- Somma, S.; Reverchon, E.; Baldino, L. Water purification of classical and emerging organic pollutants: An extensive review. ChemEngineering 2021, 5, 47. [Google Scholar] [CrossRef]
- Cazzolla, G.R. Why We Will Continue to Lose Our Battle with Cancers If We Do Not Stop Their Triggers from Environmental Pollution. Int. J. Environ. Res. Public Health 2021, 18, 6107. [Google Scholar] [CrossRef] [PubMed]
- Shumbula, P.; Maswanganyi, C.; Shumbula, N. Methods and Treatment of Organic Pollutants in Wastewater. In Persistent Organic Pollutants (POPs); Rashed, M.N., Ed.; IntechOpen: Rijeka, Croatia, 2021; Chapter 5. [Google Scholar]
- Aranzabal, A.; Pereda-Ayo, B.; González-Marcos, M.; González-Marcos, J.; López-Fonseca, R.; González-Velasco, J. State of the art in catalytic oxidation of chlorinated volatile organic compounds. Chem. Pap. 2014, 68, 1169–1186. [Google Scholar] [CrossRef]
- Dutta, N.; Usman, M.; Ashraf, M.A.; Luo, G.; Zhang, S. A Critical Review of Recent Advances in the Bio-remediation of Chlorinated Substances by Microbial Dechlorinators. Chem. Eng. J. Adv. 2022, 12, 100359. [Google Scholar] [CrossRef]
- Nguyen, V.H.; Smith, S.M.; Wantala, K.; Kajitvichyanukul, P. Photocatalytic remediation of persistent organic pollutants (POPs): A review. Arab. J. Chem. 2020, 13, 8309–8337. [Google Scholar] [CrossRef]
- Chen, Z.; Liu, Y.; Wei, W.; Ni, B.J. Recent advances in electrocatalysts for halogenated organic pollutant degradation. Environ. Sci. Nano 2019, 6, 2332–2366. [Google Scholar] [CrossRef] [Green Version]
- Rodrigues, R.; Betelu, S.; Colombano, S.; Tzedakis, T.; Masselot, G.; Ignatiadis, I. In situ chemical reduction of chlorinated organic compounds. In Environmental Soil Remediation and Rehabilitation; van Hullebusch, E., Huguenot, D., Pechaud, Y., Simonnot, M.O., Colombano, S., Eds.; Springer: Lyon, France, 2020; pp. 283–398. [Google Scholar]
- Des, L.E.; Dumée, L.F.; Kong, L. Nanofiber-based materials for persistent organic pollutants in water remediation by adsorption. Appl. Sci. 2018, 8, 166. [Google Scholar]
- Nazir, M.A.; Najam, T.; Jabeen, S.; Wattoo, M.A.; Bashir, M.S.; Shah, S.S.A.; Rehman, U.A. Facile synthesis of Tri-metallic layered double hydroxides (NiZnAl-LDHs): Adsorption of Rhodamine-B and methyl orange from water. Inorg. Chem. Commun. 2022, 145, 110008. [Google Scholar] [CrossRef]
- Nazir, M.A.; Najam, T.; Shahzad, K.; Wattoo, M.A.; Hussain, T.; Tufail, M.K.; Shah, S.S.A.; Rehman, U.A. Heterointerface engineering of water stable ZIF-8@ ZIF-67: Adsorption of rhodamine B from water. Surf. Interfaces 2022, 34, 102324. [Google Scholar] [CrossRef]
- Su, Y.; Fu, K.; Pang, C.; Zheng, Y.; Song, C.; Ji, N.; Ma, D.; Lu, X.; Liu, C.; Han, R. Recent Advances of Chlorinated Volatile Organic Compounds’ Oxidation Catalyzed by Multiple Catalysts: Reasonable Adjustment of Acidity and Redox Properties. Environ. Sci. Technol. 2022, 56, 9854–9871. [Google Scholar] [CrossRef] [PubMed]
- Hiraoka, T.; Kawakubo, T.; Kimura, J.; Taniguchi, R.; Okamoto, A.; Okazaki, T.; Sugai, T.; Ozeki, Y.; Yoshikawa, M.; Shinohara, H. Selective synthesis of double-wall carbon nanotubes by CCVD of acetylene using zeolite supports. Chem. Phys. Lett. 2003, 382, 679–685. [Google Scholar] [CrossRef]
- Kenzhin, R.M.; Bauman, Y.I.; Volodin, A.M.; Mishakov, I.V.; Vedyagin, A.A. Synthesis of carbon nanofibers by catalytic CVD of chlorobenzene over bulk nickel alloy. Appl. Surf. Sci. 2018, 427, 505–510. [Google Scholar] [CrossRef]
- Mishakov, I.; Chesnokov, V.; Buyanov, R.; Pakhomov, N. Decomposition of chlorinated hydrocarbons on iron-group metals. Kinet. Catal. 2001, 42, 543–548. [Google Scholar] [CrossRef]
- Mishakov, I.; Vedyagin, A.; Bauman, Y.; Shubin, Y.V.; Buyanov, R. Synthesis of carbon nanofibers via catalytic chemical vapor deposition of halogenated hydrocarbons. In Carbon Nanofibers: Synthesis, Applications and Performance; Nova Science Publishers, Inc.: Hauppauge, NY, USA, 2018; pp. 77–182. [Google Scholar]
- Wang, J.; Cutright, T.J. Potential waste minimization of trichloroethylene and perchloroethylene via aerobic biodegradation. J. Environ. Sci. Health A 2005, 40, 1569–1584. [Google Scholar] [CrossRef]
- Nasibulina, L.I.; Koltsova, T.S.; Joentakanen, T.; Nasibulin, A.G.; Tolochko, O.V.; Malm, J.E.M.; Karppinen, M.J.; Kauppinen, E.I. Direct synthesis of carbon nanofibers on the surface of copper powder. Carbon 2010, 48, 4559–4562. [Google Scholar] [CrossRef]
- Shaikjee, A.; Coville, N.J. Catalyst restructuring studies: The facile synthesis of tripod-like carbon fibers by the decomposition of trichloroethylene. Mater. Lett. 2012, 68, 273–276. [Google Scholar] [CrossRef]
- Netskina, O.V.; Tayban, E.S.; Moiseenko, A.P.; Komova, O.V.; Mukha, S.A.; Simagina, V.I. Removal of 1,2-dichlorobenzene from water emulsion using adsorbent catalysts and its regeneration. J. Hazard. Mater. 2015, 285, 84–93. [Google Scholar] [CrossRef]
- Gusain, R.; Kumar, N.; Ray, S.S. Recent advances in carbon nanomaterial-based adsorbents for water purification. Coord. Chem. Rev. 2020, 405, 213111. [Google Scholar] [CrossRef]
- Bauman, Y.I.; Lysakova, A.S.; Rudnev, A.V.; Mishakov, I.V.; Shubin, Y.V.; Vedyagin, A.A.; Buyanov, R.A. Synthesis of nanostructured carbon fibers from chlorohydrocarbons over Bulk Ni-Cr Alloys. Nanotechnol. Russ. 2014, 9, 380–385. [Google Scholar] [CrossRef]
- Potylitsyna, A.R.; Mishakov, I.V.; Bauman, Y.I.; Kibis, L.S.; Shubin, Y.V.; Volochaev, M.N.; Melgunov, M.S.; Vedyagin, A.A. Metal dusting as a key route to produce functionalized carbon nanofibers. React. Kinet. Mech. Catal. 2022, 135, 1387–1404. [Google Scholar] [CrossRef]
- Dhanya, V.; Arunraj, B.; Rajesh, N. Prospective application of phosphorylated carbon nanofibers with a high adsorption capacity for the sequestration of uranium from ground water. RSC Adv. 2022, 12, 13511–13522. [Google Scholar] [CrossRef] [PubMed]
- Rodríguez, A.; Ovejero, G.; Sotelo, J.; Mestanza, M.; García, J. Adsorption of dyes on carbon nanomaterials from aqueous solutions. J. Environ. Sci. Health 2010, 45, 1642–1653. [Google Scholar] [CrossRef] [PubMed]
- Machado, F.M.; Lima, É.C.; Jauris, I.M.; Adebayo, M.A. Carbon Nanomaterials for Environmental Applications. In Carbon Nanomaterials as Adsorbents for Environmental and Biological Applications; Bergmann, C.P., Machado, F.M., Eds.; Springer: Pelotas, RS, Brazil, 2015; pp. 85–105. [Google Scholar]
- Tripathi, P.K.; Gan, L.; Liu, M.; Rao, N.N. Mesoporous carbon nanomaterials as environmental adsorbents. J. Nanosci. Nanotechnol. 2014, 14, 1823–1837. [Google Scholar] [CrossRef] [PubMed]
- Mishakov, I.V.; Bauman, Y.I.; Brzhezinskaya, M.; Netskina, O.V.; Shubin, Y.V.; Kibis, L.S.; Stoyanovskii, V.O.; Larionov, K.B.; Serkova, A.N.; Vedyagin, A.A. Water Purification from Chlorobenzenes using Heteroatom-Functionalized Carbon Nanofibers Produced on Self-Organizing Ni-Pd Catalyst. J. Environ. Chem. Eng. 2022, 10, 107873. [Google Scholar] [CrossRef]
- Bauman, Y.I.; Netskina, O.; Mukha, S.; Mishakov, I.; Shubin, Y.V.; Stoyanovskii, V.; Nalivaiko, A.Y.; Vedyagin, A.; Gromov, A. Adsorption of 1, 2-Dichlorobenzene on a Carbon Nanomaterial Prepared by Decomposition of 1, 2-Dichloroethane on Nickel Alloys. Russ. J. Appl. Chem. 2020, 93, 1873–1882. [Google Scholar] [CrossRef]
- Aramendıa, M.; Borau, V.; Garcıa, I.; Jiménez, C.; Lafont, F.; Marinas, A.; Marinas, J.; Urbano, F. Liquid-phase hydrodechlorination of chlorobenzene over palladium-supported catalysts: Influence of HCl formation and NaOH addition. J. Mol. Catal. A Chem. 2002, 184, 237–245. [Google Scholar] [CrossRef]
- Matatov-Meytal, Y.; Sheintuch, M. Catalytic regeneration of chloroorganics-saturated activated carbon using hydrodechlorination. Ind. Eng. Chem. Res. 2000, 39, 18–23. [Google Scholar] [CrossRef]
- Ma, X.; Liu, S.; Liu, Y.; Gu, G.; Xia, C. Comparative study on catalytic hydrodehalogenation of halogenated aromatic com-pounds over Pd/C and Raney Ni catalysts. Sci. Rep. 2016, 6, 25068. [Google Scholar] [CrossRef]
- Ruiz-García, C.; Heras, F.; Calvo, L.; Alonso-Morales, N.; Rodriguez, J.J.; Gilarranz, M.A. Platinum and N-doped carbon nanostructures as catalysts in hydrodechlorination reactions. Appl. Catal. B 2018, 238, 609–617. [Google Scholar] [CrossRef]
- Janiak, T.; Okal, J. Effectiveness and stability of commercial Pd/C catalysts in the hydrodechlorination of meta-substituted chlorobenzenes. Appl. Catal. B 2009, 92, 384–392. [Google Scholar] [CrossRef]
- Van, W.D.; Thompson, R.S.; Rooij, C.D.; Garny, V.; Lecloux, A.; Kanne, R. 1, 2-Dichlorobenzene marine risk assessment with special reference to the OSPARCOM region: North Sea. Environ. Monit. Assess. 2004, 97, 87–102. [Google Scholar]
- Rudneva, Y.V.; Shubin, Y.V.; Plyusnin, P.E.; Bauman, Y.I.; Mishakov, I.V.; Korenev, S.V.; Vedyagin, A.A. Preparation of highly dispersed Ni1-xPdx alloys for the decomposition of chlorinated hydrocarbons. J. Alloys Compd. 2019, 782, 716–722. [Google Scholar] [CrossRef]
- Li, X.; Chen, G. Surface modified graphite nanosheets used as adsorbent to remove 1, 2-dichlorobenzene from water. Mater. Lett. 2009, 63, 930–932. [Google Scholar] [CrossRef]
- Negrea, P.; Sidea, F.; Negrea, A.; Lupa, L.; Ciopec, M.; Muntean, C. Studies regarding the benzene, toluene and o-xylene removal from waste water. Chem. Bull. Politeh. Univ. 2008, 53, 144–146. [Google Scholar]
- Peng, X.; Li, Y.; Luan, Z.; Di, Z.; Wang, H.; Tian, B.; Jia, Z. Adsorption of 1, 2-dichlorobenzene from water to carbon nanotubes. Chem. Phys. Lett. 2003, 376, 154–158. [Google Scholar] [CrossRef]
- Zagoruiko, N.I.; Rodzivilova, I.S.; Artemenko, S.E.; Glukhova, L.G. Sorption studies of the pore structure of carbon fibres. Fibre Chem. 2001, 3, 499–501. [Google Scholar] [CrossRef]
- Langmuir, I. The Constitution and Fundamental Properties of Solids and Liquids. J. Am. Chem. Soc. 1917, 183, 102–105. [Google Scholar] [CrossRef]
- Webb, P.A. Introduction to Chemical Adsorption Analytical Techniques and Their Applications to Catalysis. MIC Tech. Publ. 2003, 13, 1–4. [Google Scholar]
- Podlesnyuk, V.; Levchenko, T.; Marutovskii, R.; Koganovskii, A. Adsorption of dissolved organic compounds on porous polymeric materials. Theor. Exp. Chem. 1985, 21, 363–365. [Google Scholar] [CrossRef]
- Bering, B.; Dubinin, M.; Serpinsky, V. Theory of volume filling for vapor adsorption. J. Colloid Interface Sci. 1966, 21, 378–393. [Google Scholar] [CrossRef]
- Dubinin, M. Adsorption properties and microporous structures of carbonaceous adsorbents. Carbon 1987, 25, 593–598. [Google Scholar] [CrossRef]
- Dubinin, M.M.; Astakhov, V.A. Development of the Concepts of Volume Filling of Micropores in the Adsorption of Gases and Vapors by Microporous Adsorbents. Bull. Acad. Sci. USSR Div. Chem. Sci. 1971, 20, 8–12. [Google Scholar] [CrossRef]
- Netskina, O.; Komova, O.; Tayban, E.; Oderova, G.; Mukha, S.; Kuvshinov, G.; Simagina, V. The influence of acid treatment of carbon nanofibers on the activity of palladium catalysts in the liquid-phase hydrodechlorination of dichlorobenzene. Appl. Catal. A-Gen. 2013, 467, 386–393. [Google Scholar] [CrossRef]
- Simagina, V.I.; Tayban, E.S.; Grayfer, E.D.; Gentsler, A.G.; Komova, O.V.; Netskina, O.V. Liquid-phase hydrodechlorination of chlorobenzene by molecular hydrogen: The influence of reaction medium on process efficiency. Pure Appl. Chem. 2009, 81, 2107–2114. [Google Scholar] [CrossRef]
- Gentsler, A.; Simagina, V.; Netskina, O.; Komova, O.; Tsybulya, S.; Abrosimov, O. Catalytic hydrodechlorination on palladium-containing catalysts. Kinet. Catal. 2007, 48, 60–66. [Google Scholar] [CrossRef]
- Krumm, S. An interactive Windows program for profile fitting and size/strain analysis. Mater. Sci. Forum. 1996, 183–190. [Google Scholar] [CrossRef]
- Moulder, J.F.; Stickle, W.F.; Sobol, P.E.; Bomben, K.D. Handbook of X-ray Photoelectron Spectroscopy; Chastain, J., Ed.; Perkin-Elmer Corp.: Eden Prairie, MN, USA, 1992. [Google Scholar]
- Chen, X.; Wang, X.; Fang, D. A review on C1s XPS-spectra for some kinds of carbon materials. Fuller. Nanotub. Carbon Nanostructures 2020, 28, 1048–1058. [Google Scholar] [CrossRef]
- Eng, A.Y.S.; Sofer, Z.; Sedmidubsky, D.; Pumera, M. Synthesis of carboxylated-graphenes by the Kolbe–Schmitt process. ACS Nano 2017, 11, 1789–1797. [Google Scholar] [CrossRef]
- Kuntumalla, M.K.; Attrash, M.; Akhvlediani, R.; Michaelson, S.; Hoffman, A. Nitrogen bonding, work function and thermal stability of nitrided graphite surface: An in situ XPS, UPS and HREELS study. Appl. Surf. Sci. 2020, 525, 146562. [Google Scholar] [CrossRef]
- Dementjev, A.; Graaf, A.D.; Sanden, M.V.D.; Maslakov, K.; Naumkin, A.; Serov, A. X-ray photoelectron spectroscopy reference data for identification of the C3N4 phase in carbon–nitrogen films. Diam. Relat. Mater. 2000, 9, 1904–1907. [Google Scholar] [CrossRef]
- Ayiania, M.; Smith, M.; Hensley, A.J.; Scudiero, L.; McEwen, J.S.; Garcia-Perez, M. Deconvoluting the XPS spectra for nitrogen-doped chars: An analysis from first principles. Carbon 2020, 162, 528–544. [Google Scholar] [CrossRef]
- Chen, C.M.; Zhang, Q.; Yang, M.G.; Huang, C.H.; Yang, Y.G.; Wang, M.Z. Structural evolution during annealing of thermally reduced graphene nanosheets for application in supercapacitors. Carbon 2012, 50, 3572–3584. [Google Scholar] [CrossRef]
- Oh, Y.J.; Yoo, J.J.; Kim, Y.I.; Yoon, J.K.; Yoon, H.N.; Kim, J.H.; Park, S.B. Oxygen functional groups and electrochemical capacitive behavior of incompletely reduced graphene oxides as a thin-film electrode of supercapacitor. Electrochim. Acta 2014, 116, 118–128. [Google Scholar] [CrossRef]
- Simonov, P.A.; Likholobov, V.A. Catalysis and Electrocatalysis at Nanoparticle Surfaces, In Physicochemical Aspects of Preparation of Carbon-Supported Noble Metal Catalysts; Wieckowski, A., Savinova, E.R., Vayenas, C.G., Eds.; CRC Press: Boca Raton, FL, USA, 2003; pp. 422–423. [Google Scholar]
- Jurkiewicz, M.; Pełech, R. Adsorption of 1, 2-Dichlorobenzene from the Aqueous Phase onto Activated Carbons and Modified Carbon Nanotubes. Int. J. Mol. Sci. 2021, 22, 13152. [Google Scholar] [CrossRef]
- Dubinin, M.I. Physical adsorption of gases and vapors in micropores. In Progress in Surface and Membrane Science; Elsevier: Moscow, Russia, 1975; Volume 9, pp. 1–70. [Google Scholar]
- Terzyk, A.P.; Gauden, P.A.; Kowalczyk, P. What kind of pore size distribution is assumed in the Dubinin–Astakhov adsorption isotherm equation? Carbon 2002, 40, 2879–2886. [Google Scholar] [CrossRef]


| CNF Sample | Content, wt% | ||
|---|---|---|---|
| N | O | Cl | |
| CNF-Cl | 0.07 | 2.65 | 0.09 |
| CNF-Cl-N | 0.39 | 1.47 | 0.17 |
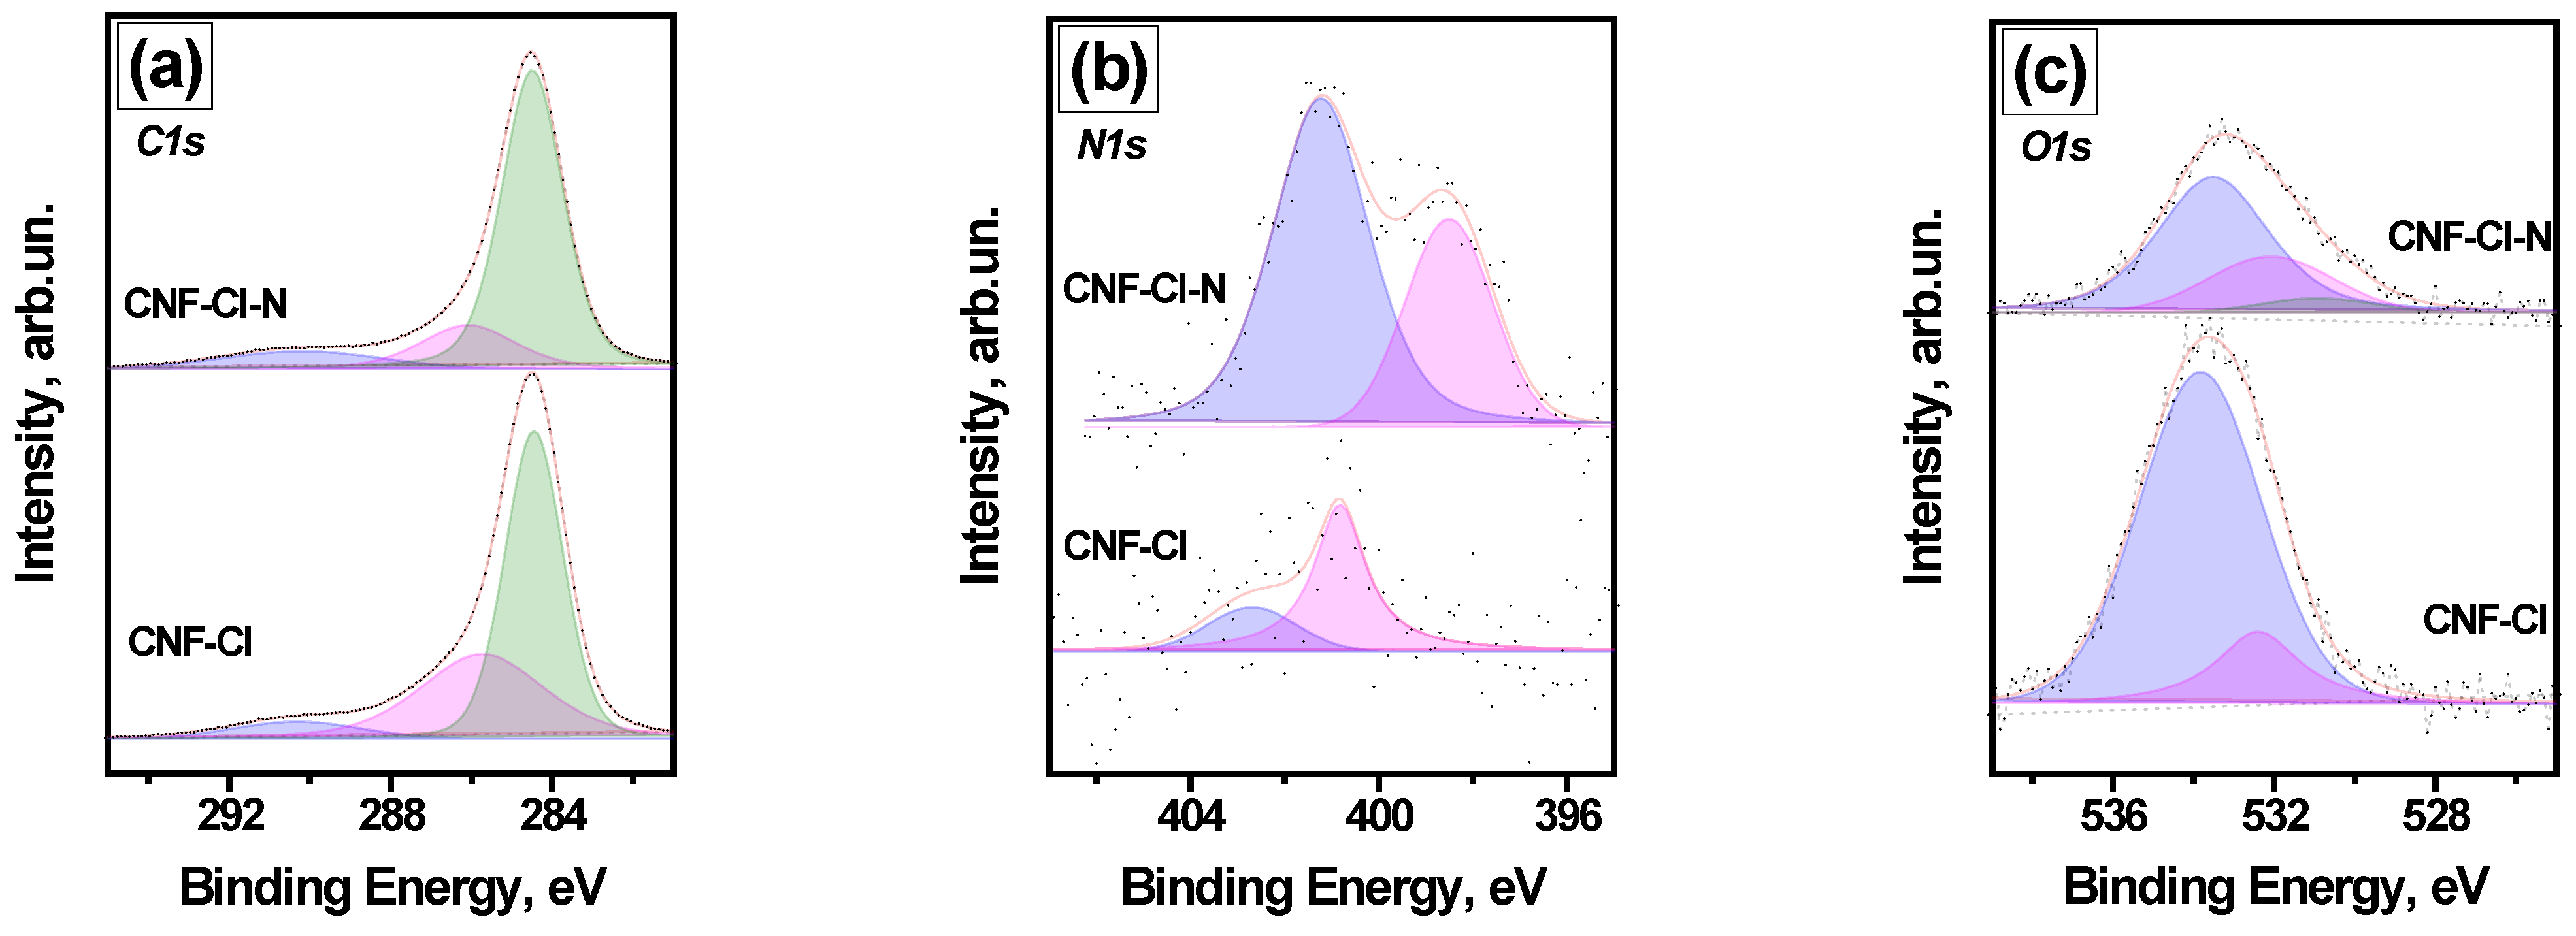
| CNF Sample | Element | BE, eV | Atomic Ratio to Carbon | State Portion | Total Atomic Ratio to Carbon |
|---|---|---|---|---|---|
| CNF-Cl | O1s | 532.4 | 0.0049 | 0.18 | 0.027 |
| 533.8 | 0.022 | 0.82 | |||
| N1s | 400.8 | 0.00057 | 0.75 | 0.00077 | |
| 402.7 | 0.00020 | 0.25 | |||
| CNF-Cl-N | O1s | 531.0 | 0.00088 | 0.059 | 0.015 |
| 532.1 | 0.0039 | 0.26 | |||
| 533.6 | 0.010 | 0.68 | |||
| N1s | 398.5 | 0.0013 | 0.33 | 0.0040 | |
| 401.2 | 0.0027 | 0.67 |
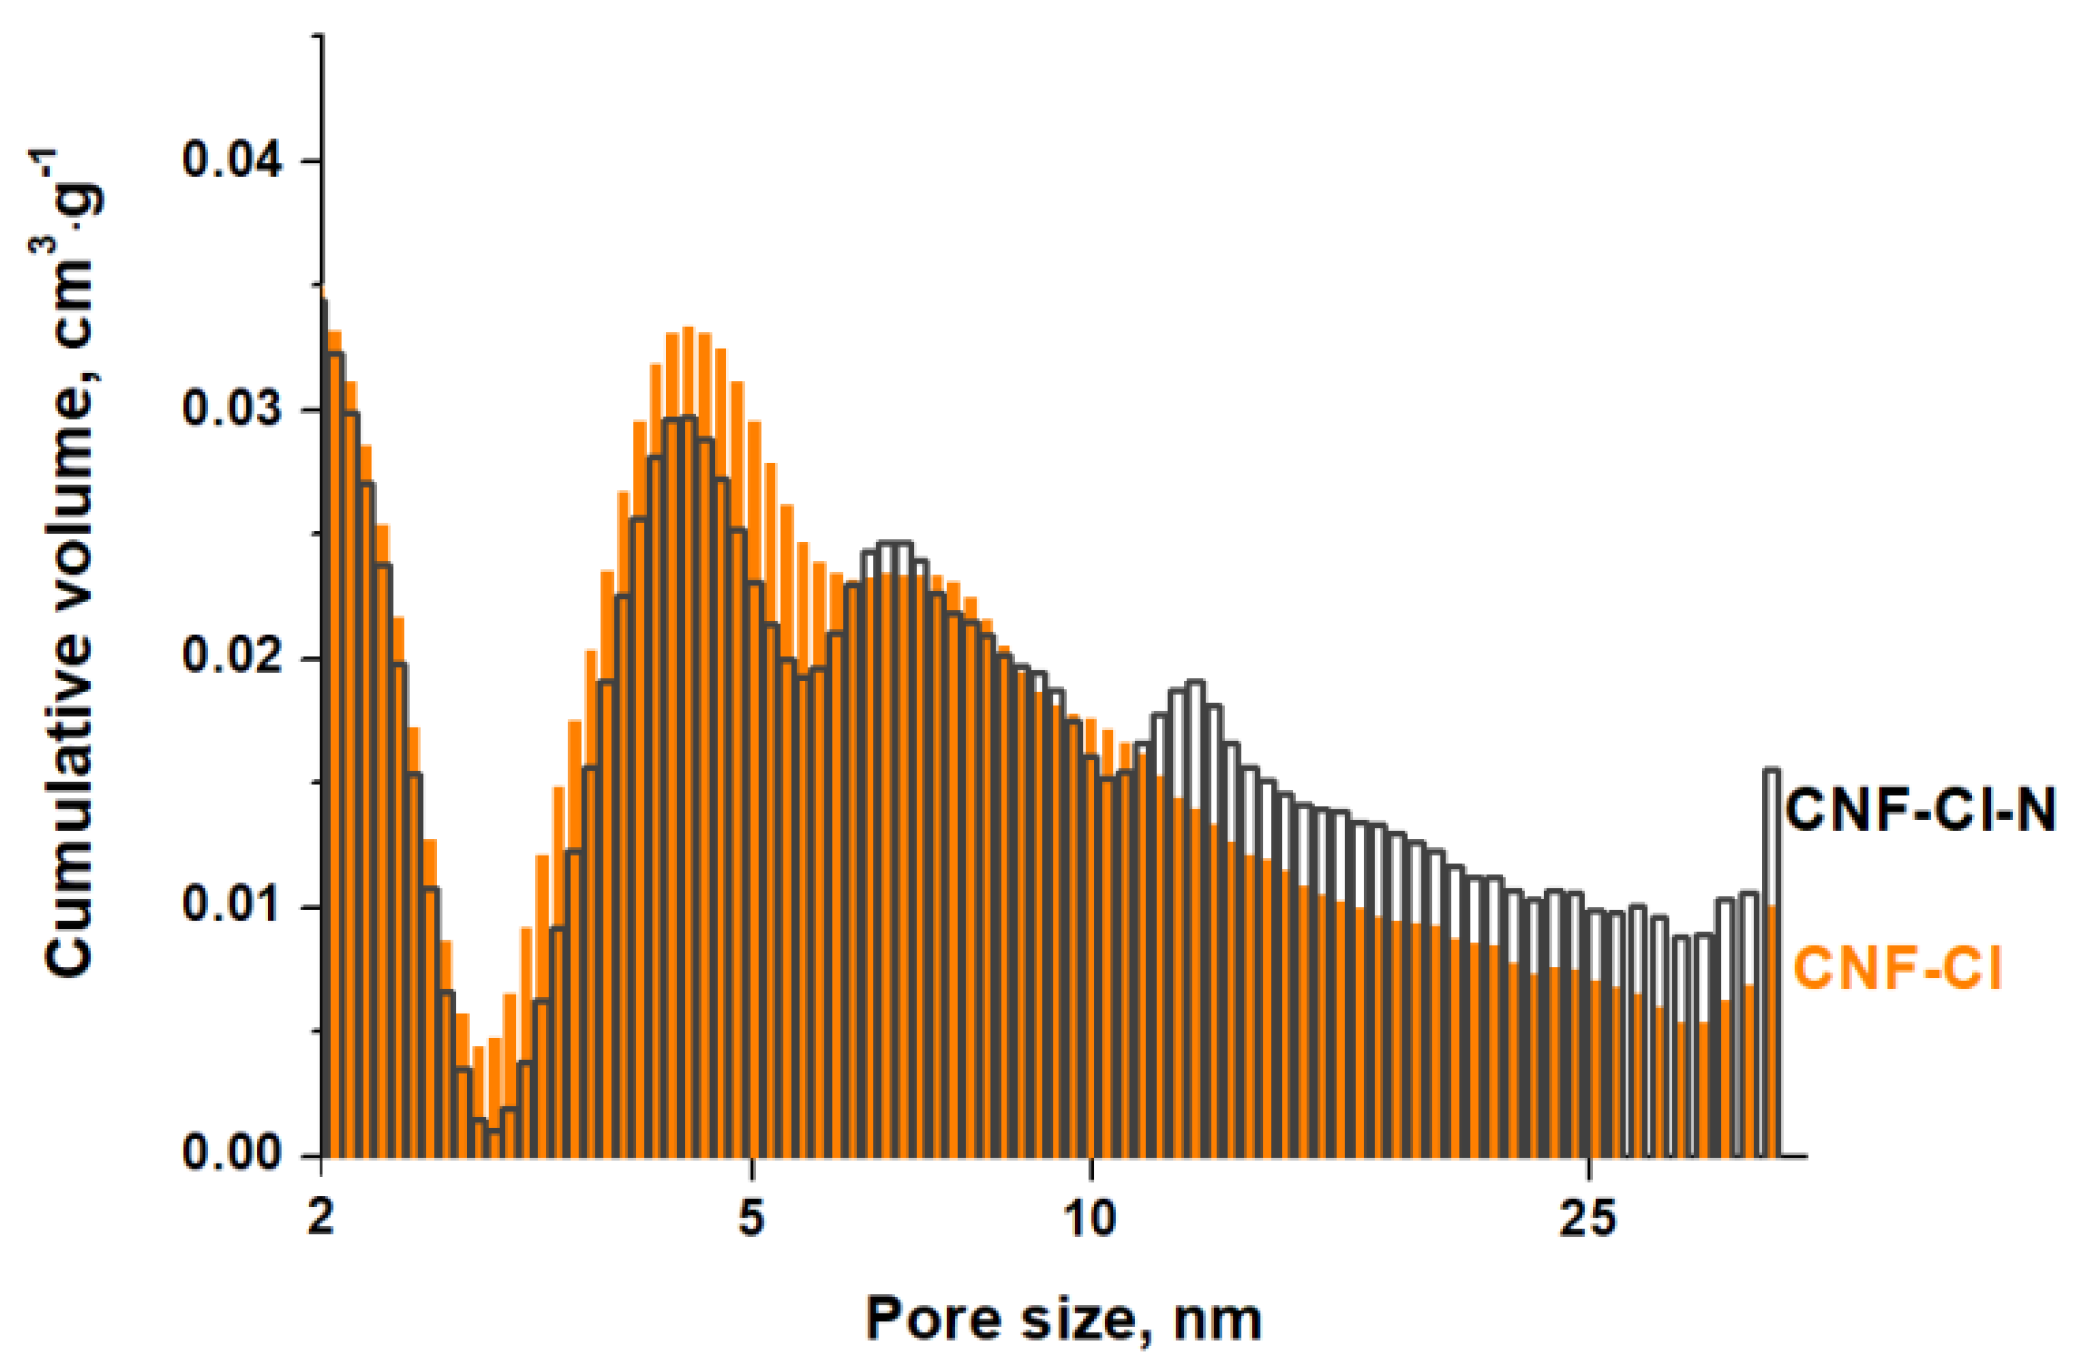
| Sample | SSA, m2·g−1 | V∑pore, cm3·g−1 | Vmicropore, cm3·g−1 | , nm |
|---|---|---|---|---|
| CNF-Cl | 297 | 0.55 | 0.017 | 7.4 |
| CNF-Cl-N | 292 | 0.69 | 0.019 | 9.4 |
| Isotherm | Linear Form | Parameter | Sample | ||||
|---|---|---|---|---|---|---|---|
| CNF-Cl | Pd/CNF-Cl | CNF-Cl-N | Pd/CNF-Cl-N | ||||
| Langmuir | (mol·g−1) | 0.0022 | 0.0034 | 0.0027 | 0.0030 | ||
| (nm2) | 0.22 | 0.14 | 0.18 | 0.16 | |||
| R2 | 0.710 | 0.965 | 0.714 | 0.840 | |||
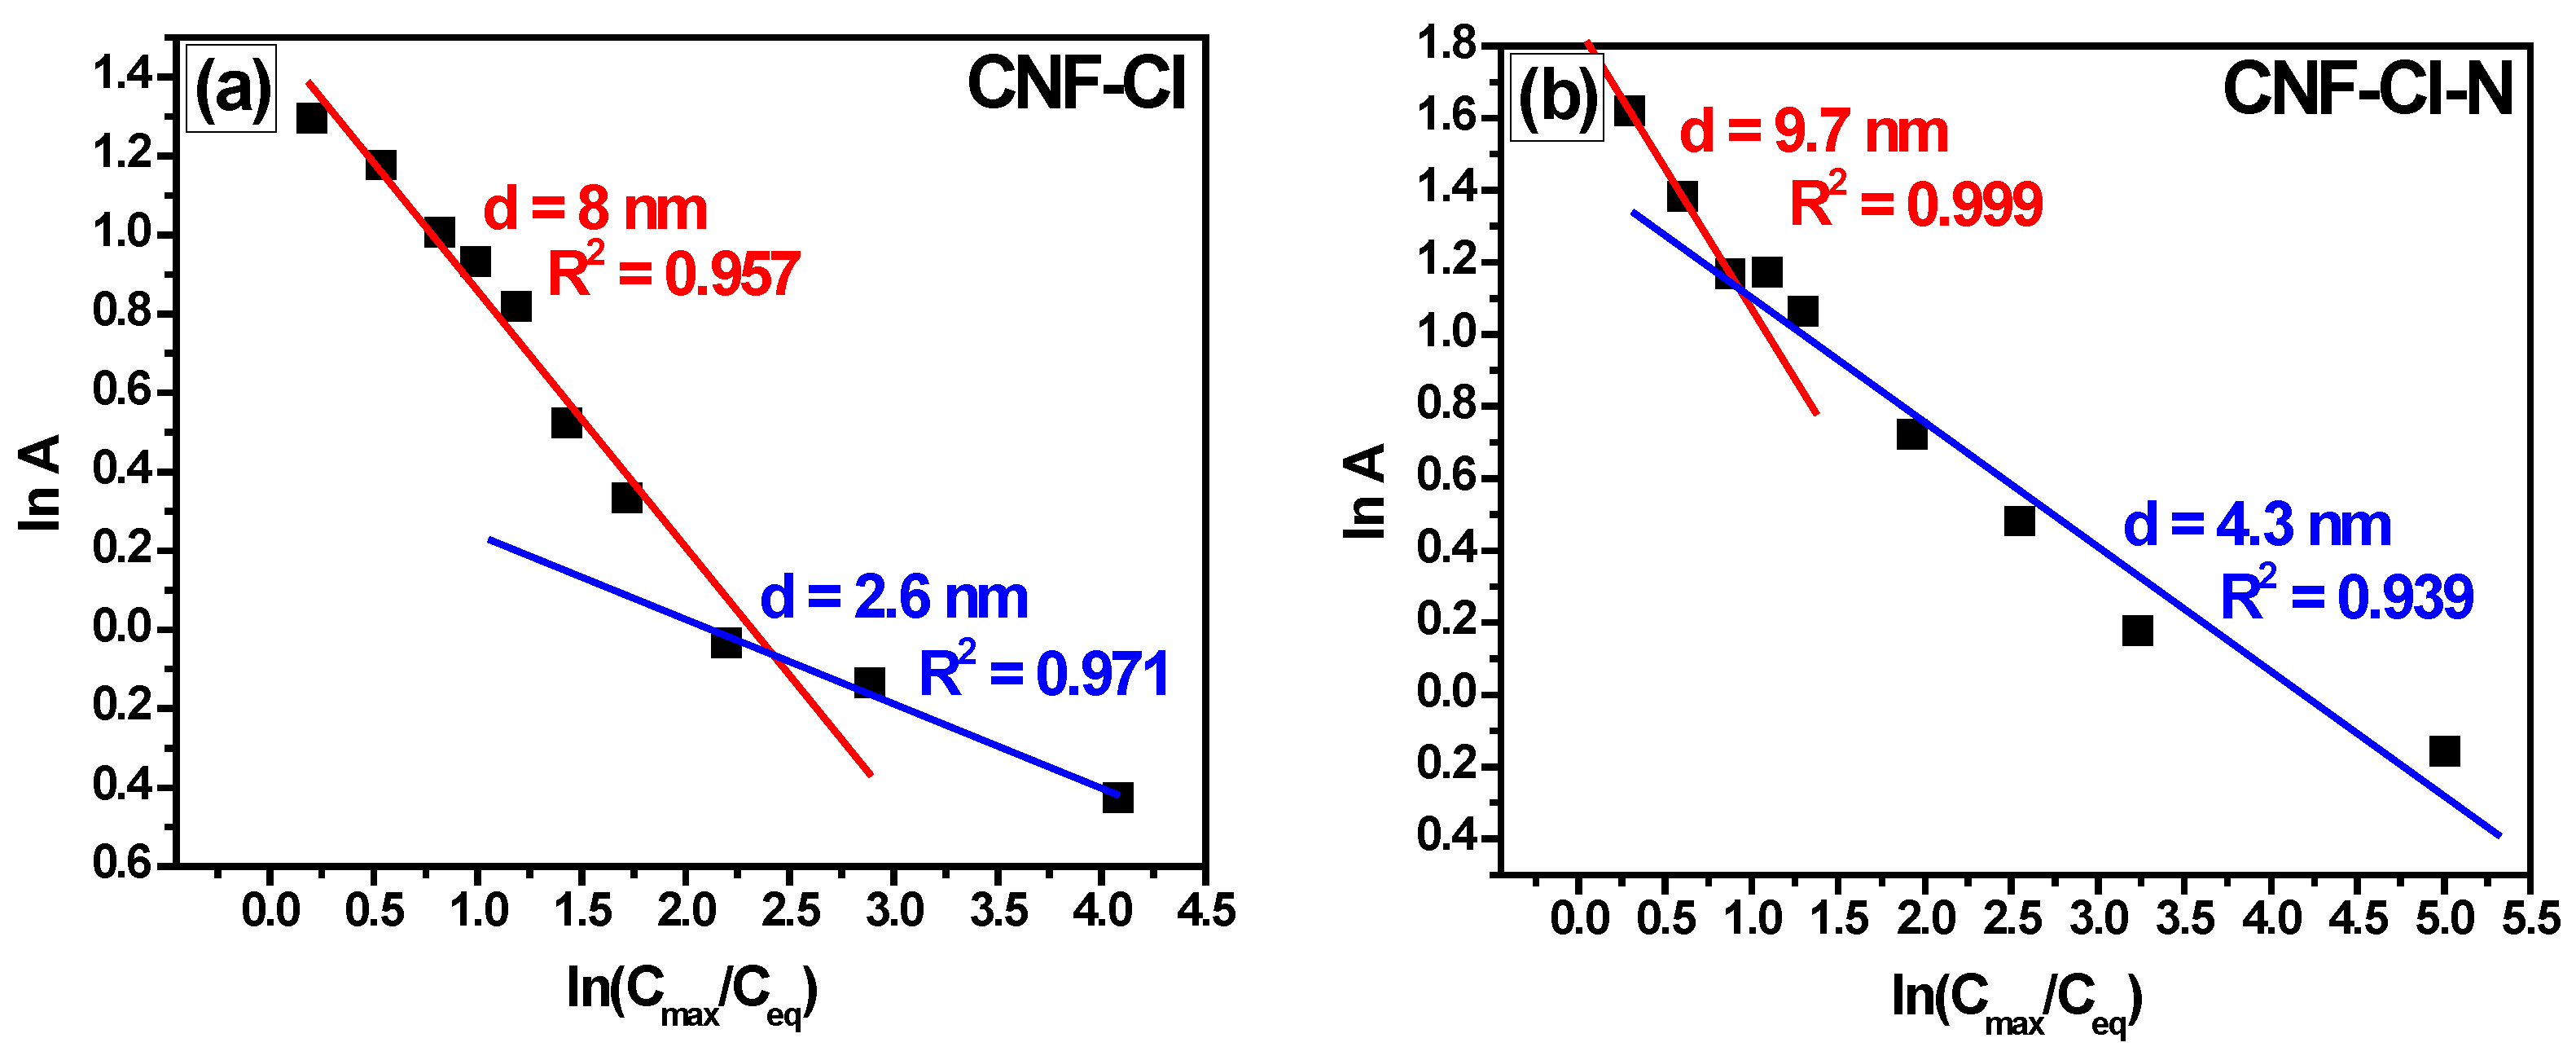
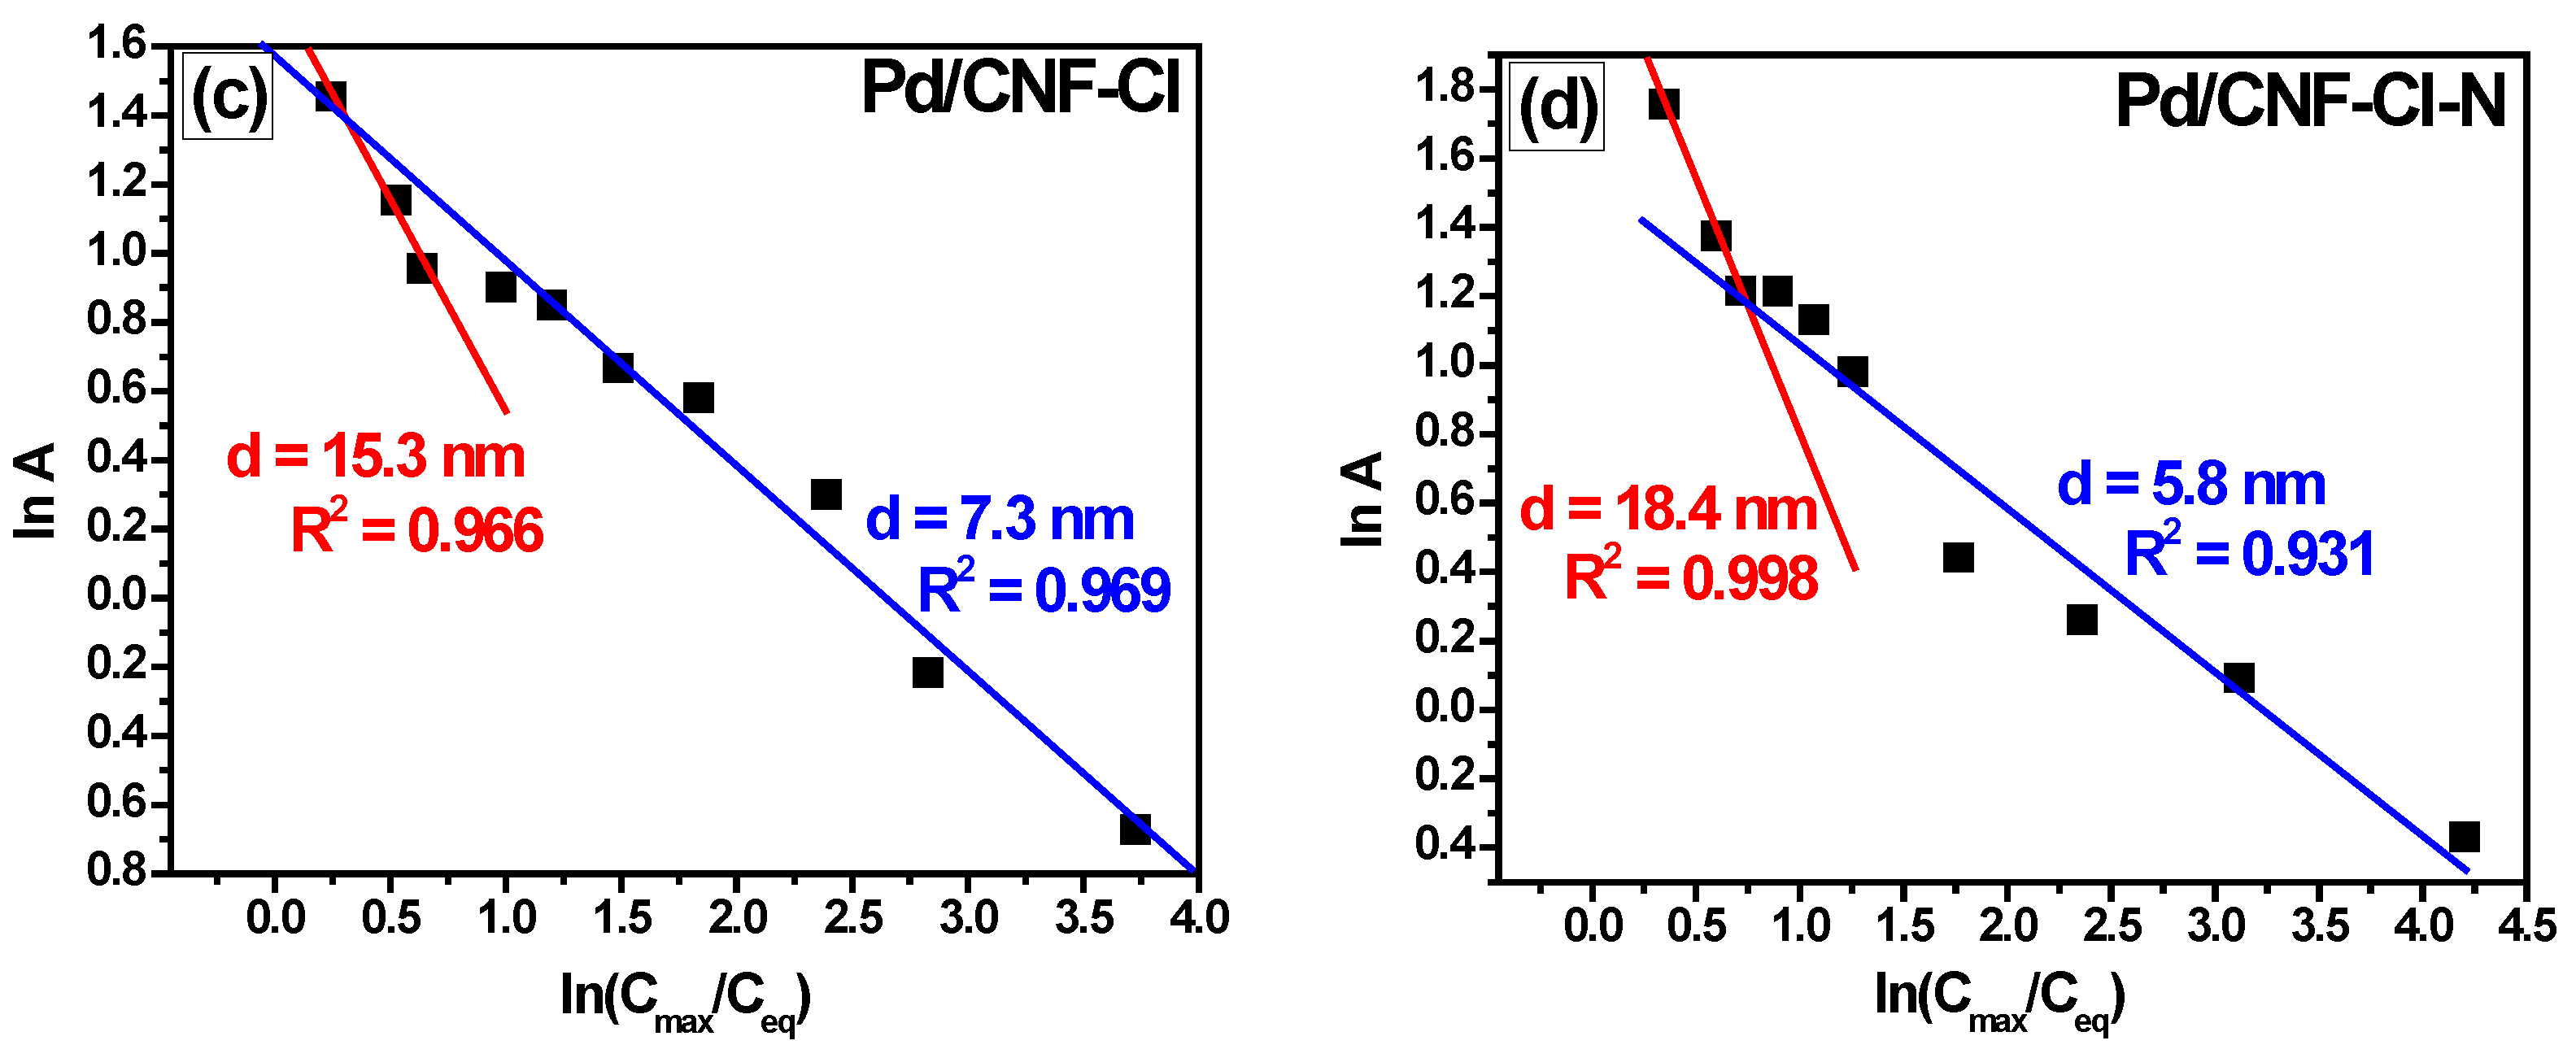
| Dubinin–Astakhov | n = 1 | (mol·g−1) | 0.0038 | 0.0045 | 0.0048 | 0.0053 | |
| (cm3·g−1) | 0.43 | 0.51 | 0.54 | 0.60 | |||
| (kJ·mol−1) * | 5.0 | 4.3 | 6.4 | 4.7 | |||
| d (nm) * | 6.2 | 7.1 | 8.5 | 6.6 | |||
| R2 | 0.924 | 0.969 | 0.950 | 0.935 | |||
| n = 2 | (mol·g−1) | 0.0025 | 0.0030 | 0.0033 | 0.0035 | ||
| (cm3·g−1) | 0.29 | 0.34 | 0.38 | 0.39 | |||
| (kJ·mol−1) * | 7.7 | 6.5 | 9.6 | 7.5 | |||
| d (nm) * | 4.0 | 4.7 | 3.2 | 4.1 | |||
| R2 | 0.733 | 0.927 | 0.765 | 0.783 | |||
Publisher’s Note: MDPI stays neutral with regard to jurisdictional claims in published maps and institutional affiliations. |
© 2022 by the authors. Licensee MDPI, Basel, Switzerland. This article is an open access article distributed under the terms and conditions of the Creative Commons Attribution (CC BY) license (https://creativecommons.org/licenses/by/4.0/).
Share and Cite
Ozerova, A.M.; Potylitsyna, A.R.; Bauman, Y.I.; Tayban, E.S.; Lipatnikova, I.L.; Nartova, A.V.; Vedyagin, A.A.; Mishakov, I.V.; Shubin, Y.V.; Netskina, O.V. Synthesis of Chlorine- and Nitrogen-Containing Carbon Nanofibers for Water Purification from Chloroaromatic Compounds. Materials 2022, 15, 8414. https://doi.org/10.3390/ma15238414
Ozerova AM, Potylitsyna AR, Bauman YI, Tayban ES, Lipatnikova IL, Nartova AV, Vedyagin AA, Mishakov IV, Shubin YV, Netskina OV. Synthesis of Chlorine- and Nitrogen-Containing Carbon Nanofibers for Water Purification from Chloroaromatic Compounds. Materials. 2022; 15(23):8414. https://doi.org/10.3390/ma15238414
Chicago/Turabian StyleOzerova, Anna M., Arina R. Potylitsyna, Yury I. Bauman, Elena S. Tayban, Inna L. Lipatnikova, Anna V. Nartova, Aleksey A. Vedyagin, Ilya V. Mishakov, Yury V. Shubin, and Olga V. Netskina. 2022. "Synthesis of Chlorine- and Nitrogen-Containing Carbon Nanofibers for Water Purification from Chloroaromatic Compounds" Materials 15, no. 23: 8414. https://doi.org/10.3390/ma15238414