
Investigation of Soft Magnetic Material Fe-6.5Si Fracture Obtained by Additive Manufacturing

 and
and
Abstract
:1. Introduction
2. Materials and Methods
3. Results and Analysis
3.1. Powder Distribution
3.2. Microstructural Characterization and Mechanical Property Tests
3.3. Microelemenl Analysis
4. Discussion and Conclusions
5. Summary
Author Contributions
Funding
Conflicts of Interest
References
- Krings, B.A.; Cossale, M.; Tenconi, A.; Soulard, J.; Cavagnino, A.; Boglietti, A. Magnetic Materials Used in Electrical Machines. IEEE Ind. Appl. Mag. 2017, 23, 21–28. [Google Scholar] [CrossRef] [Green Version]
- Boglietti, A.; Cavagnino, A.; Krings, A. New Magnetic Materials for Electrical Machines and Power Converters. IEEE Trans. Ind. Electron. 2017, 64, 2402–2404. [Google Scholar] [CrossRef] [Green Version]
- Cardelli, E. Advances in Magnetic Hysteresis Modeling. Handb. Magn. Mater. 2015, 24, 323–409. [Google Scholar]
- De Campos, M.F.; Teixeira, J.C.; Landgraf, F.J.G. The optimum grain size for minimizing energy losses in iron. J. Magn. Magn. Mater. 2006, 301, 94–99. [Google Scholar] [CrossRef]
- Garibaldi, M.; Ashcroft, I.; Simonelli, M.; Hague, R. Metallurgy of high-silicon steel parts produced using Selective Laser Melting. Acta Mater. 2016, 110, 207–216. [Google Scholar] [CrossRef]
- Garibaldi, M.; Ashcroft, I.; Hillier, N.; Harmon, S.A.C.; Hague, R. Relationship between laser energy input, microstructures and magnetic properties of selective laser melted Fe-6.9%wt Si soft magnets. Mater. Charact. 2018, 143, 144–151. [Google Scholar] [CrossRef]
- Shokrollahi, H.; Janghorban, K. Soft magnetic composite materials (SMCs). J. Mater. Process. Technol. 2007, 189, 1–12. [Google Scholar] [CrossRef]
- Lemke, J.N.; Simonelli, M.; Garibaldi, M.; Ashcroft, I.; Hague, R.; Vedani, M.; Wildman, R.; Tuck, C. Calorimetric study and microstructure analysis of the order-disorder phase transformation in silicon steel built by SLM. J. Alloys Compd. 2017, 722, 293–301. [Google Scholar] [CrossRef] [Green Version]
- Goll, D.; Schuller, D.; Martinek, G.; Kunert, T.; Schurr, J.; Sinz, C.; Schubert, T.; Bernthaler, T.; Riegel, H.; Schneider, G. Additive manufacturing of soft magnetic materials and components. Addit. Manuf. 2019, 27, 428–439. [Google Scholar] [CrossRef]
- You, A.; Be, M.A.Y.; In, I. Commercial scale production of Fe-6.5 wt. % Si sheet and its magnetic properties. J. Appl. Phys. 1988, 64, 5367. [Google Scholar]
- Tellinghuisen, J. The D′ → A′ transition in I2. J. Mol. Spectrosc. 1982, 94, 231–252. [Google Scholar] [CrossRef]
- González, F.; Houbaert, Y. A review of ordering phenomena in iron-silicon alloys. Rev. Metal. 2013, 49, 178–199. [Google Scholar] [CrossRef]
- Enokizono, M.; Teshima, N.; Narita, K. Magnetic properties of 6.5 percent silicon-iron ribbon formed by a melt spinning technique. IEEE Trans. Magn. 1982, 18, 1007–1013. [Google Scholar] [CrossRef]
- Arai, K.I.; Yamashiro, Y. Annealing effect on grain texture of cold-rolled 4.5% Si-Fe ribbons prepared by a rapid quenching method. J. Appl. Phys. 1988, 64, 5373–5375. [Google Scholar] [CrossRef]
- Ros-Yanez, T.; Ruiz, D.; Barros, J.; Houbaert, Y.; Colás, R. Study of deformation and aging behaviour of iron-silicon alloys. Mater. Sci. Eng. A 2007, 447, 27–34. [Google Scholar] [CrossRef]
- Viala, B.; Degauque, J.; Fagot, M.; Baricco, M.; Ferrara, E.; Fiorillo, F. Study of the brittle behaviour of annealed Fe-6.5 wt%Si ribbons produced by planar flow casting. Mater. Sci. Eng. A 1996, 212, 62–68. [Google Scholar] [CrossRef]
- Jang, P.; Lee, B.; Choi, G. Effects of annealing on the magnetic properties of Fe-6.5%Si alloy powder cores. J. Appl. Phys. 2008, 103, 5–8. [Google Scholar] [CrossRef]
- Li, R.; Shen, Q.; Zhang, L.; Zhang, T. Magnetic properties of high silicon iron sheet fabricated by direct powder rolling. J. Magn. Magn. Mater. 2004, 281, 135–139. [Google Scholar] [CrossRef]
- Tsuya, N.; Shimanaka, H.; Kan, T. Ribbon-form silicon-iron alloy containing around 6% silicon. IEEE Trans. Magn. 1980, 16, 728–733. [Google Scholar] [CrossRef]
- Tian, G.; Bi, X. Fabrication and magnetic properties of Fe-6.5% Si alloys by magnetron sputtering method. J. Alloys Compd. 2010, 502, 1–4. [Google Scholar] [CrossRef]
- Fenineche, N.E.; Cherigui, M.; Aourag, H.; Coddet, C. Structure and magnetic properties study of iron-based thermallysprayed alloys. Mater. Lett. 2004, 58, 1797–1801. [Google Scholar] [CrossRef]
- Wróbel, R.; Mecrow, B.C. A Comprehensive Review of Additive Manufacturing in Construction of Electrical Machines. IEEE Trans. Energy Convers. 2020, 35, 1054–1064. [Google Scholar] [CrossRef]
- Wrobel, R.; Mecrow, B. Additive manufacturing in construction of electrical machines–a review. In Proceedings of the IEEE Workshop on Electrical Machines Design, Control and Diagnosis (WEMDCD), IEEE, Athens, Greece, 22–23 April 2019; pp. 15–22. [Google Scholar]
- Safin, A.R.; Behera, R.K. Additive manufacturing and topology optimization of magnetic materials for electrical machines. Power Eng. Res. Equip. Technol. 2021, 23, 14–33. [Google Scholar] [CrossRef]
- Di Schino, A. Manufacturing and application of stainless steels. Metals 2020, 10, 327. [Google Scholar] [CrossRef] [Green Version]
- Haines, M.; List, F.; Carver, K.; Leonard, D.; Plotkowski, A.; Fancher, C.; Dehoff, R.; Babu, S. Role of scan strategies and heat treatment on grain structure evolution in Fe-Si soft magnetic alloys made by laser-powder bed fusion. In Additive Manufacturing; Elsevier: Amsterdam, The Netherlands, 2022; Volume 50, p. 102578. ISSN 2214-8604. [Google Scholar] [CrossRef]
- Savolainen, J.; Collan, M. How Additive Manufacturing Technology Changes Business Models?—Review of Literature. Addit. Manuf. 2020, 32, 101070. [Google Scholar] [CrossRef]
- Sutton, A.T.; Kriewall, C.S.; Leu, M.C.; Newkirk, J.W.; Brown, B. Characterization of laser spatter and condensate generated during the selective laser melting of 304L stainless steel powder. Addit. Manuf. 2020, 31, 100904. [Google Scholar] [CrossRef]
- Sotov, A.V.; Agapovichev, A.V.; Smelov, V.G.; Kokareva, V.V.; Dmitrieva, M.O.; Melnikov, A.A.; Golanov, S.P.; Anurov, Y.M. Investigation of the IN-738 superalloy microstructure and mechan-ical properties for the manufacturing of gas turbine engine nozzle guide vane by selective laser melting. Int. J. Adv. Manuf. Technol. 2020, 107, 2525–2535. [Google Scholar] [CrossRef]
- Chua, C.K.; Leong, K.F. Printing and Additive Manufacturing: Principles and Applications (with Companion Media Pack)-Of Rapid Prototyping, 4th ed.; World Scientific Publishing Company: Singapore, 2015. [Google Scholar]
- Novik, F.S.; Arsov, Y.B. Optimization of the Processes in Technology of Metals by Experiment Planning Methods; Mashinostroenie: Moscow, Russia; Tekhnika: Sofia, Bulgaria, 1980. (In Russian)
- Kubaschewski, O. Phase Diagram of Binary Iron Alloys; Okamoto, H., Ed.; ASM International: Novelty, OH, USA, 1993; p. 380. [Google Scholar]
- Ohnuma, I.; Abe, S.; Shimenouchi, S.; Omori, T.; Kainuma, R.; Ishida, K. Experimental and Thermodynamic Studies of the Fe–Si Binary System. ISIJ Int. 2012, 52, 540–548. [Google Scholar] [CrossRef] [Green Version]
- Lacaze, J.; Sundman, B. An assessment of the Fe-C-Si system. Metall. Mater. Trans. A 1991, 22, 2211–2223. [Google Scholar] [CrossRef]
- Faivre, R.; Vigneron, B.; Degois, M. Hommes et Fonderie; EDIMA: Austin, TX, USA, 1972; Volume 23, pp. 13–25. [Google Scholar]
- Schiirmann, E.; Hirsch, J. Giesserei, Tech.-Wiss. Beih, Giessereiwes. Metallkd 1966, 18, 1–16. [Google Scholar]
- Khaimovich, A.; Erisov, Y.; Smelov, V.; Agapovichev, A.; Petrov, I.; Razhivin, V.; Bobrovskij, I.; Kokareva, V.; Kuzin, A. Interface Quality Indices of Al–10Si–Mg Aluminum Alloy and Cr18–Ni10–Ti Stainless-Steel Bimetal Fabricated via Selective Laser Melting. Metals 2021, 11, 172. [Google Scholar] [CrossRef]
- Khaimovich, A.; Shishkovsky, I.; Erisov, Y.; Agapovichev, A.; Smelov, V.; Razzhivin, V. Research on Cracked Conditions in Nickel Chrome Alloy Ni50Cr33W4.5Mo2.8TiAlNb, Obtained by Direct Laser Deposition. Metals 2022, 12, 1902. [Google Scholar] [CrossRef]
- Moracheskij, A.G.; Sladkov, I.B. Thermodynamic Calculations in Metallurgy; Metallurgiya: Moscow, Russia, 1985. [Google Scholar]
- Hallstedt, B.; Djurovic, D.; von Appen, J.; Dronskowski, R.; Dick, A.; Körmann, F.; Hickel, T.; Neugebauer, J. Thermodynamic properties of cementite (Fe3C). Calphad 2010, 34, 129–133. [Google Scholar] [CrossRef]
- Acker, J.; Bohmhammel, K.; van den Berg, G.J.K.; van Miltenburg, J.C.; Kloc, C. Thermodynamic properties of iron silicides FeSi and α-FeSi2. J. Chem. Thermodyn. 1999, 31, 1523–1536. [Google Scholar] [CrossRef]
- Gustafson, P. A thermodynamic evaluation of the Fe-C system. Scand. J. Metall. 1985, 14, 259–267. [Google Scholar] [CrossRef]
- Seltz, H.; McDonald, H.J.; Wells, C. Heat Capacity of Iron Carbide from 68 to 298 K. and the Thermodynamic Properties of Iron Carbide. Trans. AIME 1940, 140, 263–278. [Google Scholar]
- Naeser, G. Mitt. Kais.-Wilh.-Inst. Eisenforschg. Düsseld 1934, 16, 207–210. [Google Scholar]
- Miles, J.R.; Smith, T.F.; Finlayson, T.R. Low-Temperature thermophysical properties of Fe3Si. Philos. Mag. B 1992, 65, 1215–1222. [Google Scholar] [CrossRef]
- Wood, I.G.; Vocadlo, L.; Knight, K.S.; Dobson, D.P.; Marshall, W.G.; Price, G.D.; Brodholt, J. Thermal expansion and crystal structure of cementite, Fe3C, between 4 and 600 K determined by time-of-flight neutron powder diffraction. J. Appl. Crystallogr. 2004, 37, 82–90. [Google Scholar] [CrossRef]


| Change Range | Volume Energy Density VED, J/mm3 | Laser Power P, W | Scanning Speed V, mm/s | Hatch Distance h, mm | Layer Thickness, t, mm |
|---|---|---|---|---|---|
| Min | 100 | 80 | 500 | 0.04 | 0.04 |
| Max | 140 | 322 | 1000 | 0.05 | 0.05 |
| Sample № | Volume Energy Density, J/mm3 | Hatch Distance, mm | Scanning Speed, mm/s | Layer Thickness, mm | Laser Power, W | Crack Points: 1 Is for Small Cracks, 2 Are for Cracks, 3 Are for through Cracks | Non-Melting Areas 1 Point Is for Individual, 2 Points Are for Multiple | Cracks from the Surface to a Depth of 1 mm |
|---|---|---|---|---|---|---|---|---|
| 2 | 100 | 0.042 | 500 | 0.05 | 105 | * | 2 | 2 |
| 3 | 100 | 0.044 | 750 | 0.05 | 165 | 1 | * | * |
| 4 | 100 | 0.046 | 750 | 0.04 | 138 | * | 2 | 2 |
| 13 | 140 | 0.044 | 500 | 0.04 | 123 | * | 2 | 2 |
| 14 | 140 | 0.05 | 500 | 0.05 | 175 | 1 | * | * |
| 15 | 140 | 0.04 | 750 | 0.05 | 210 | 2 | 1 | * |
| 20 | 160 | 0.048 | 500 | 0.05 | 192 | 1 | * | * |
| 21 | 160 | 0.042 | 750 | 0.05 | 252 | 1 | * | * |
| 23 | 160 | 0.05 | 1000 | 0.04 | 320 | 1 | * | * |
| 26 | 180 | 0.046 | 500 | 0.05 | 207 | 1 | * | * |
| 27 | 180 | 0.05 | 750 | 0.05 | 338 | 2 | * | * |
| 30 | 180 | 0.042 | 1000 | 0.05 | 378 | 2 | * | * |
| 32 | 200 | 0.044 | 500 | 0.05 | 220 | 3 | * | * |
| 33 | 200 | 0.048 | 750 | 0.05 | 360 | 2 | * | * |
| 34 | 200 | 0.042 | 750 | 0.04 | 252 | 3 | * | * |
| 35 | 200 | 0.046 | 1000 | 0.04 | 368 | 3 | * | * |
| 36 | 200 | 0.04 | 1000 | 0.05 | 400 | 2 | * | * |
| *—not tested | ||||||||
| Factors/ Experiment Response Characteristics | h, mm | V, mm/s | t, mm | P, W | Crack Points | Non-Melting Areas | Cracks from the Surface to a Depth of 1 mm |
|---|---|---|---|---|---|---|---|
| VED, J/mm3 | 0.03 | 0.31 | 0.02 | 0.77 | 0.80 | −0.67 | −0.63 |
| h, mm | 1.00 | −0.14 | −0.13 | 0.05 | −0.14 | −0.24 | −0.13 |
| V, mm/s | −0.14 | 1.00 | −0.27 | 0.78 | 0.39 | −0.32 | −0.34 |
| t, mm | −0.13 | −0.27 | 1,00 | 0.05 | 0.05 | −0.32 | −0.38 |
| P, W | 0.05 | 0.78 | 0.05 | 1.00 | 0.66 | −0.65 | −0.62 |
| Crack points | −0.14 | 0.39 | 0.05 | 0.66 | 1.00 | −0.65 | −0.70 |
| Non-melting areas | −0.24 | −0.32 | −0.32 | −0.65 | −0.65 | 1.00 | 0.95 |
| Cracks from the surface to a depth of 1 mm | −0.13 | −0.34 | −0.38 | −0.62 | −0.70 | 0.95 | 1.00 |
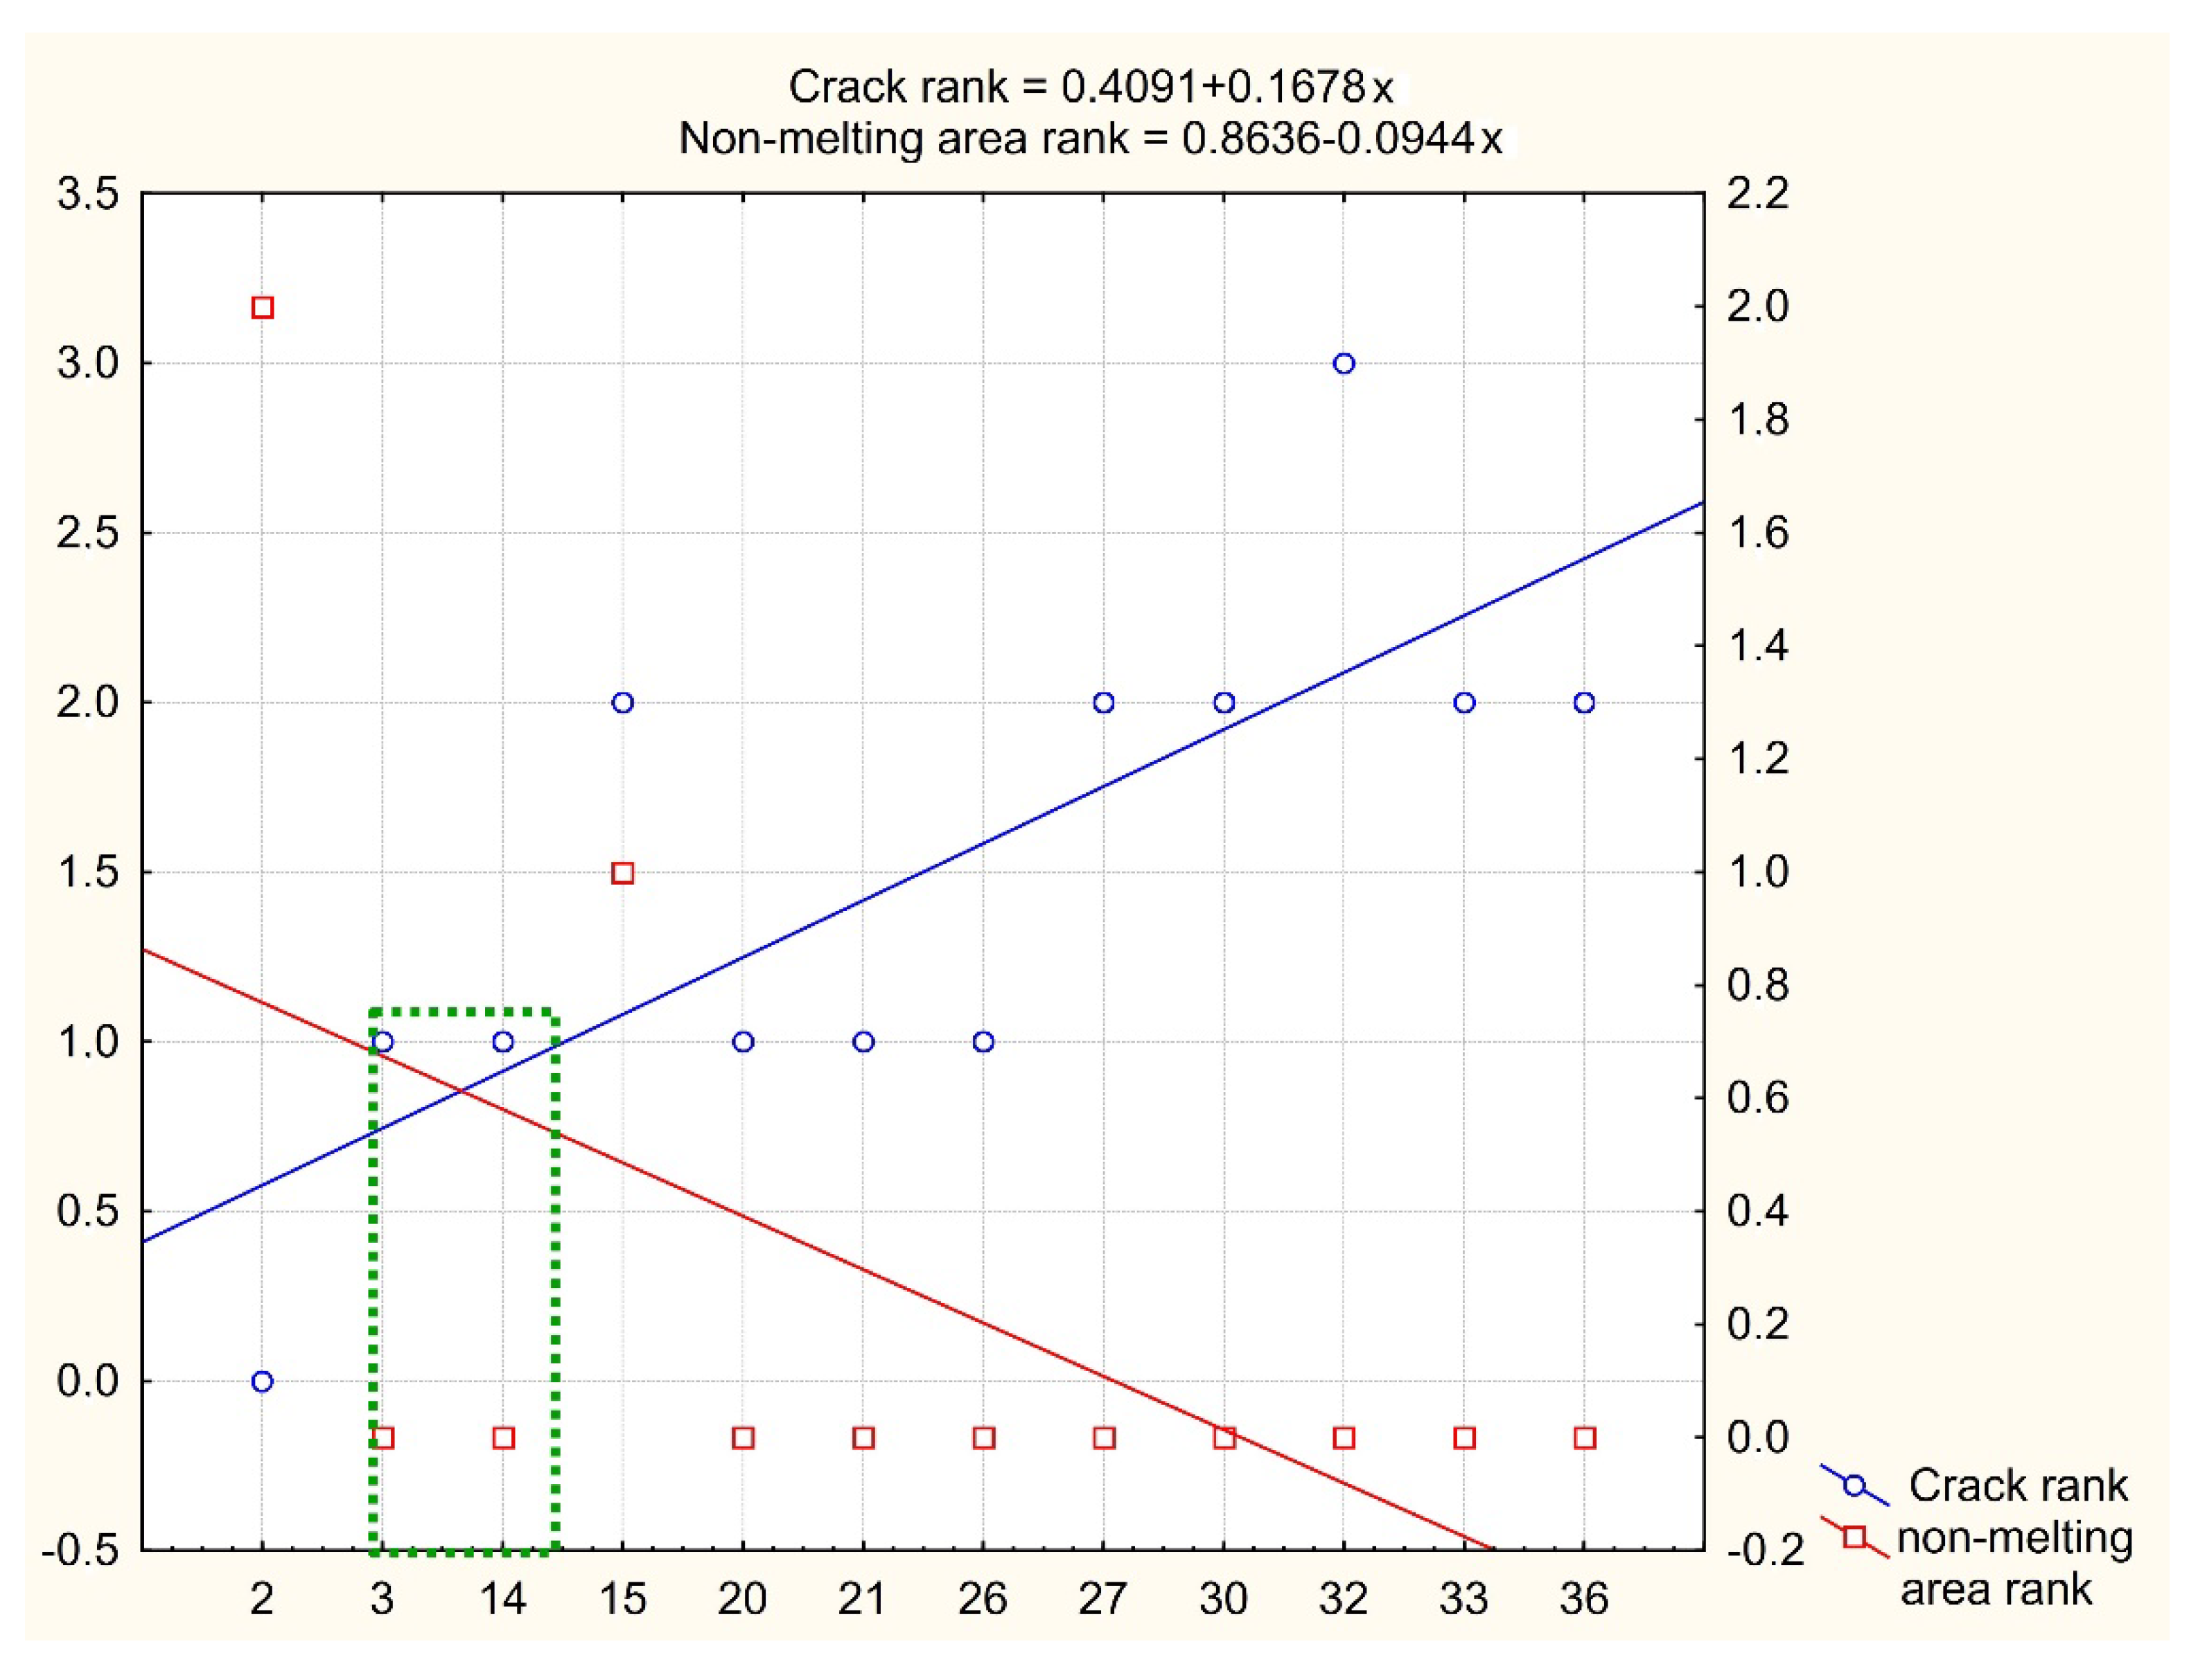
| Regression Dependence | Correlation Coefficient-R, Error Probability at Determining Regression Coefficients-p | Sensitivity of Crack Rank/Non-Melting Area Rank in Relation to Power Density |
|---|---|---|
| Cracks rank = −2.111 + 0.0222⋅VED | R = 0.8 p < 0.009 | 1.52 |
| Non-melting area rank = 2.758 − 0.0146⋅VED | R = 0.8 p < 0.004 |
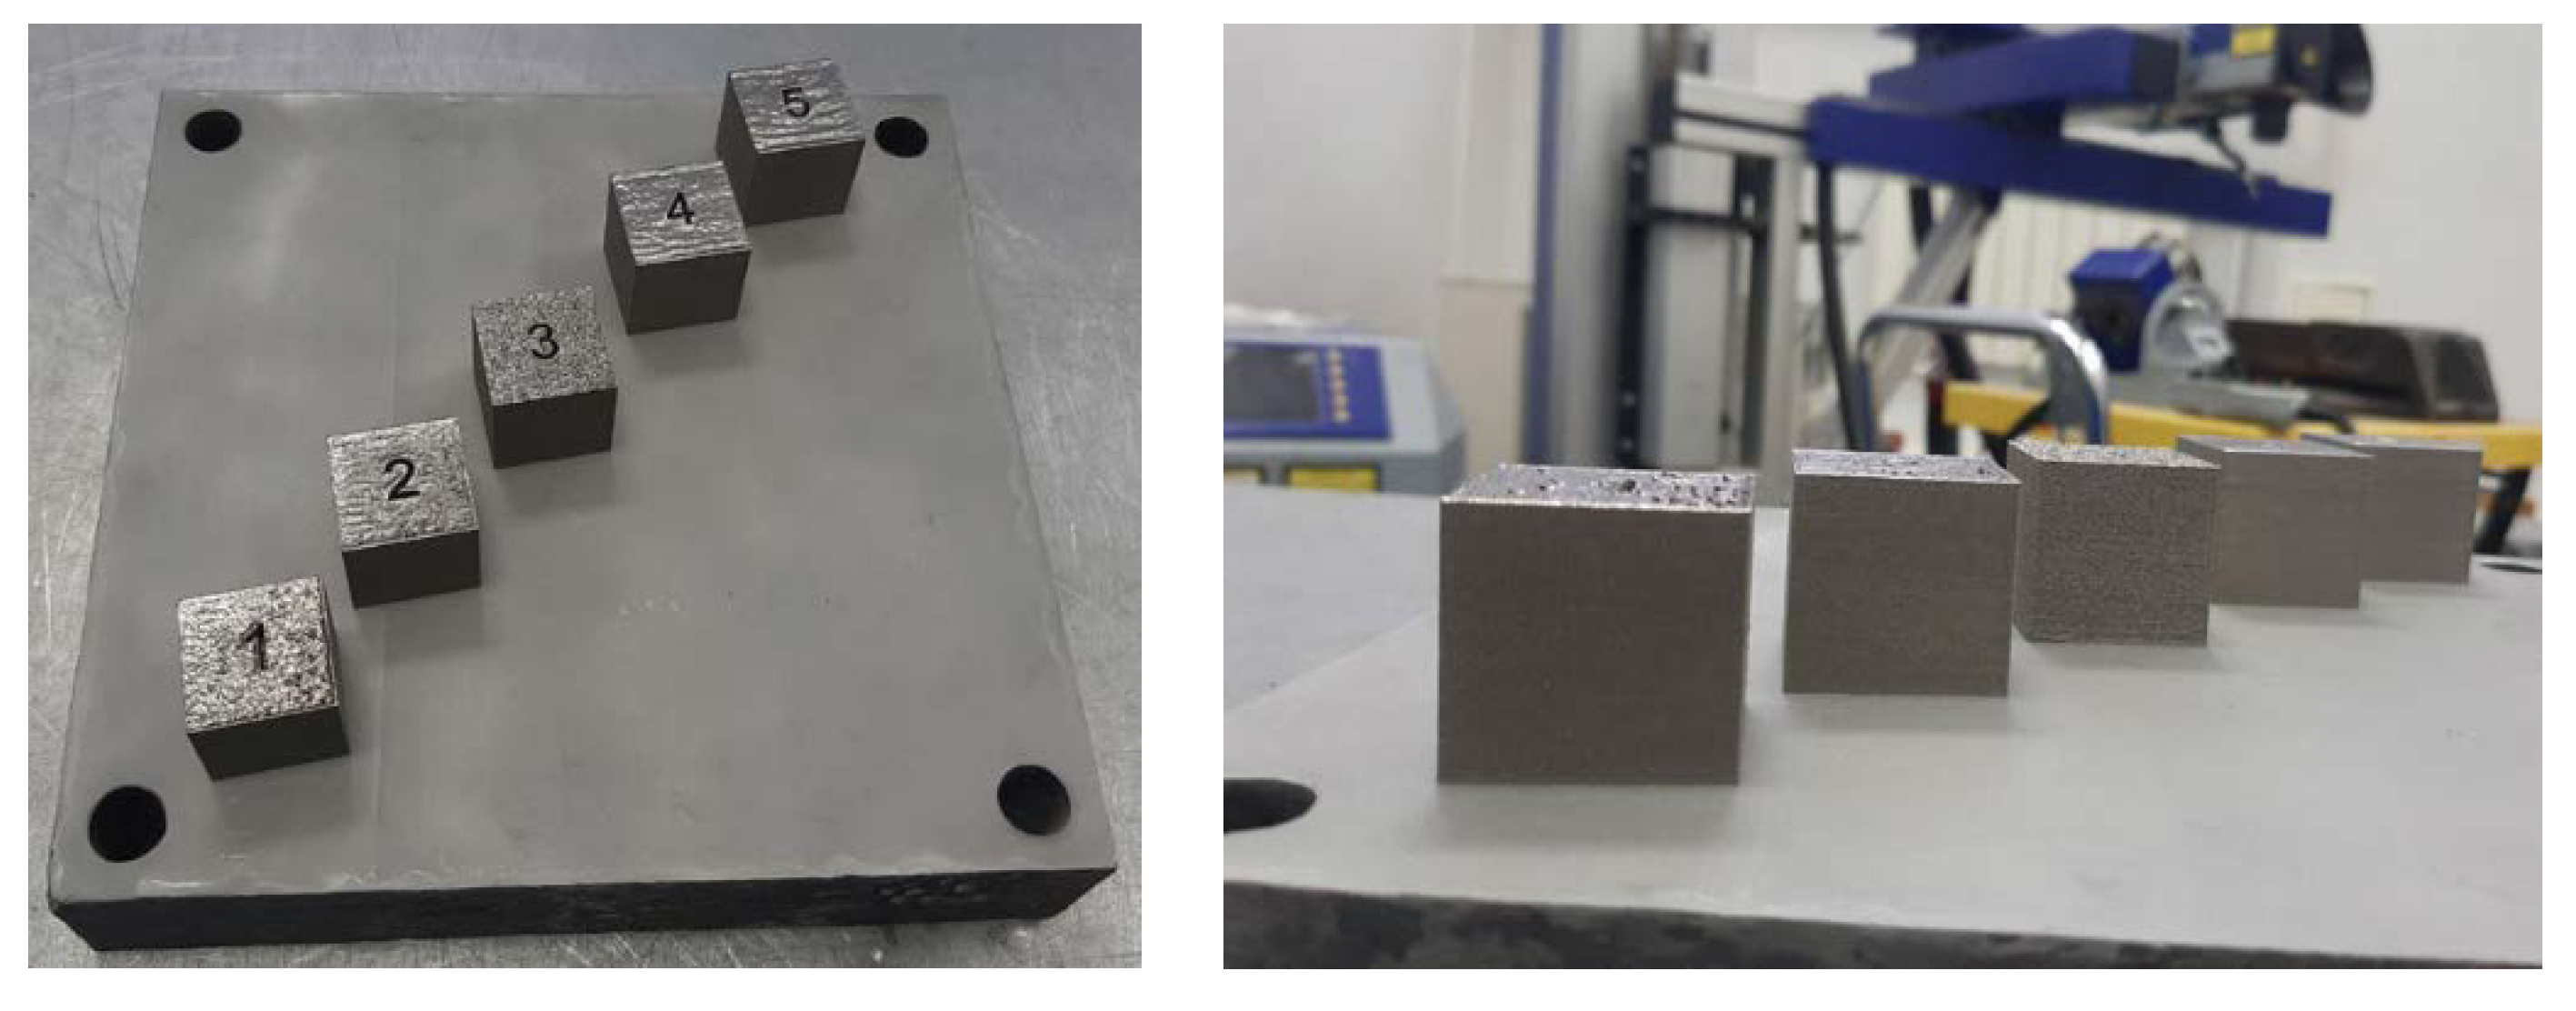
| Sample № | Volume Energy Density VED, J/mm3 | Scanning Speed V, mm/s |
|---|---|---|
| 1 | 100 | 750 |
| 2 | 100 | 750 |
| 3 | 100 | 500 |
| 4 | 120 | 750 |
| 5 | 120 | 750 |
| 6 | 120 | 500 |
| 7 | 140 | 750 |
| 8 | 140 | 750 |
| 9 | 140 | 500 |
| Element/ Point Number | At Points along the Perimeter of the Crack | Outside the Perimeter | ||||||||||
|---|---|---|---|---|---|---|---|---|---|---|---|---|
| 1 | 2 | 3 | 4 | 5 | 6 | 7 | 8 | 9 | 10 | 11 | 12 | |
| Fe | 67.22 | 71.18 | 46.35 | 43.84 | 50.35 | 49.43 | 74.75 | 54.93 | 70.65 | 59.39 | 85.27 | 85.2 |
| Fe3C + C | 22.1 | 21.16 | 46.2 | 49.23 | 42.09 | 43.44 | 15.98 | 37.96 | 20.15 | 33.33 | 0 | 0 |
| Si | 10.69 | 7.67 | 7.44 | 6.92 | 7.56 | 7.13 | 9.27 | 7.11 | 9.2 | 7.29 | 14.73 | 14.44 |
| FeSi | Fe3Si | Fe3C | |
|---|---|---|---|
| Isobaric heat capacity , J/mol/K | 60 [41] | 24.58 [45] | 110 [40] |
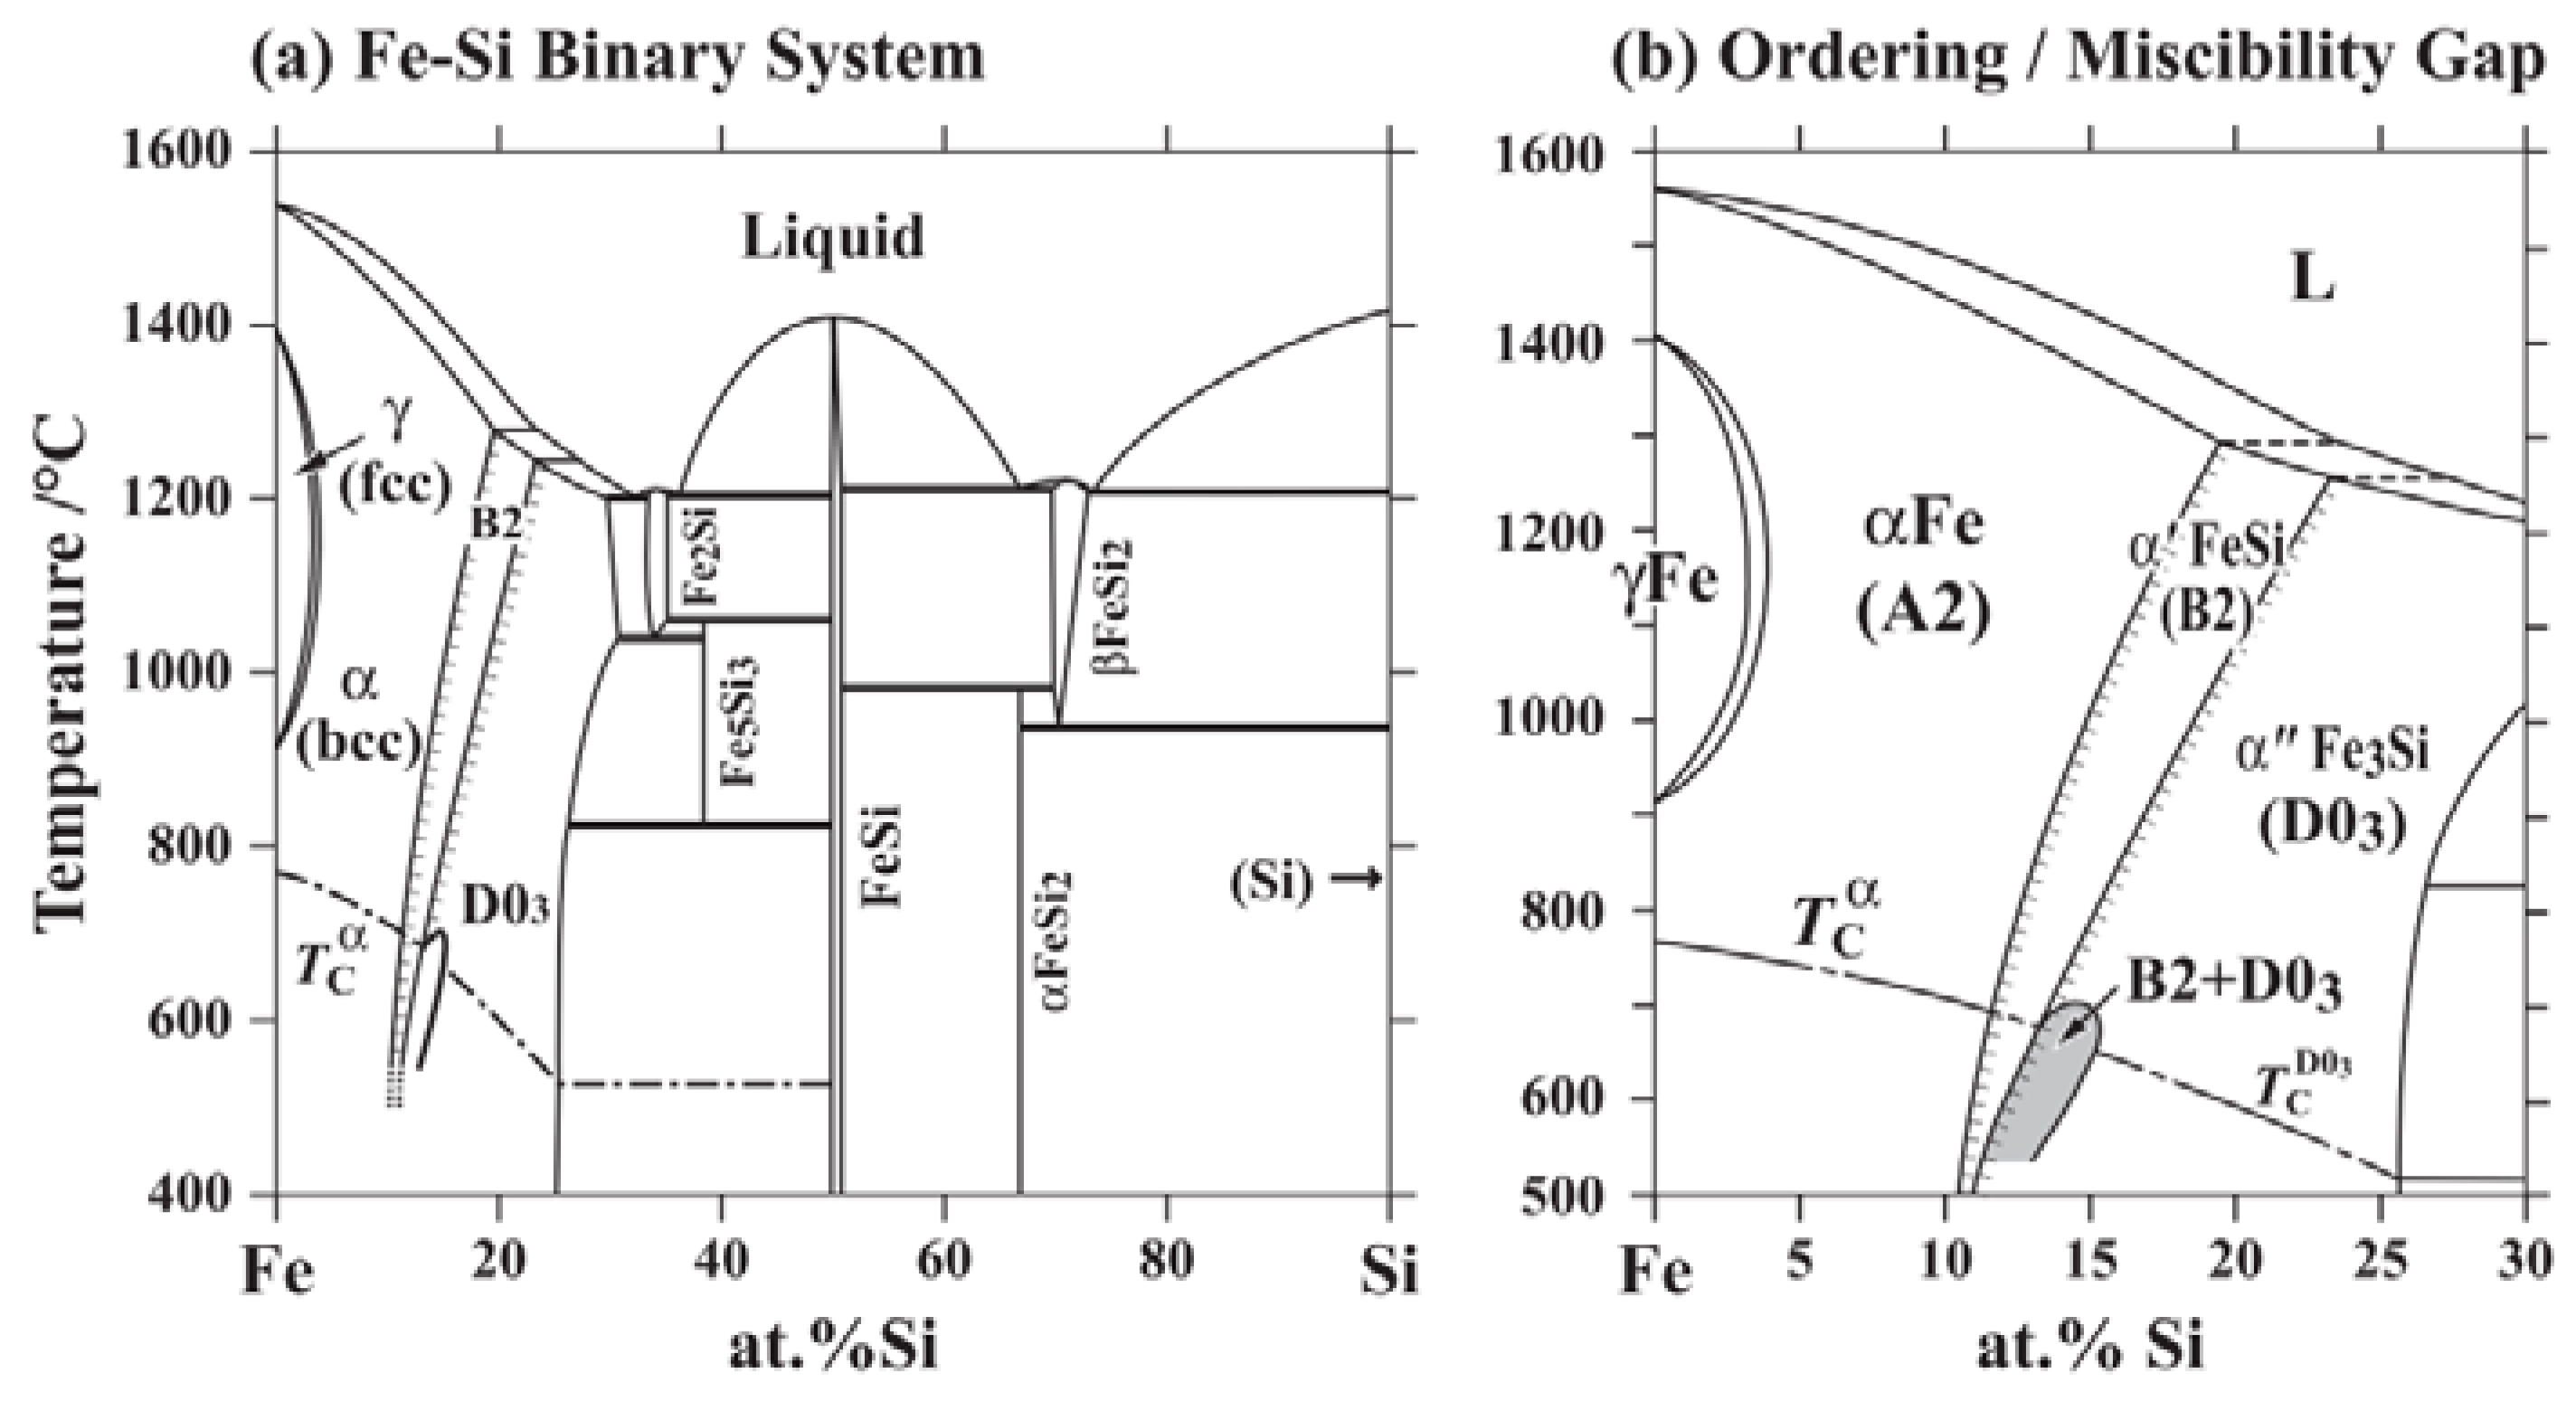
| Melting temperature Tm, K | 1300 ([33], Figure 1) | 1600 [45] | 1147 [Fe-Fe3C diagram] |
| CTE, K−1 | 1.62 × 10⁻⁵ [41] | 1.3 × 10⁻⁵ [45] | 1.90 × 10⁻⁵ [46] |
| CPC continuity condition | CPC for FeSi 0.0282 (Exp. 2) | CPC for Fe3Si 0.0069 (Exp. 2) | |
| CPC for interface | Fe3C/FeSi 0.0246 (Exp. 1) | Fe3C/Fe3Si 0.0201 (Exp. 1) | |
| CIC | 0.127 (Exp 3) | 1.92 (Exp 3) |
Publisher’s Note: MDPI stays neutral with regard to jurisdictional claims in published maps and institutional affiliations. |
© 2022 by the authors. Licensee MDPI, Basel, Switzerland. This article is an open access article distributed under the terms and conditions of the Creative Commons Attribution (CC BY) license (https://creativecommons.org/licenses/by/4.0/).
Share and Cite
Agapovichev, A.V.; Khaimovich, A.I.; Erisov, Y.A.; Ryazanov, M.V. Investigation of Soft Magnetic Material Fe-6.5Si Fracture Obtained by Additive Manufacturing. Materials 2022, 15, 8915. https://doi.org/10.3390/ma15248915
Agapovichev AV, Khaimovich AI, Erisov YA, Ryazanov MV. Investigation of Soft Magnetic Material Fe-6.5Si Fracture Obtained by Additive Manufacturing. Materials. 2022; 15(24):8915. https://doi.org/10.3390/ma15248915
Chicago/Turabian StyleAgapovichev, Anton V., Alexander I. Khaimovich, Yaroslav A. Erisov, and Mikhail V. Ryazanov. 2022. "Investigation of Soft Magnetic Material Fe-6.5Si Fracture Obtained by Additive Manufacturing" Materials 15, no. 24: 8915. https://doi.org/10.3390/ma15248915