
Application of an Artificial Neural Network in the Modelling of Heat Curing Effects on the Strength of Adhesive Joints at Elevated Temperature with Imprecise Adhesive Mix Ratios


Abstract
:1. Introduction
2. Materials and Methods
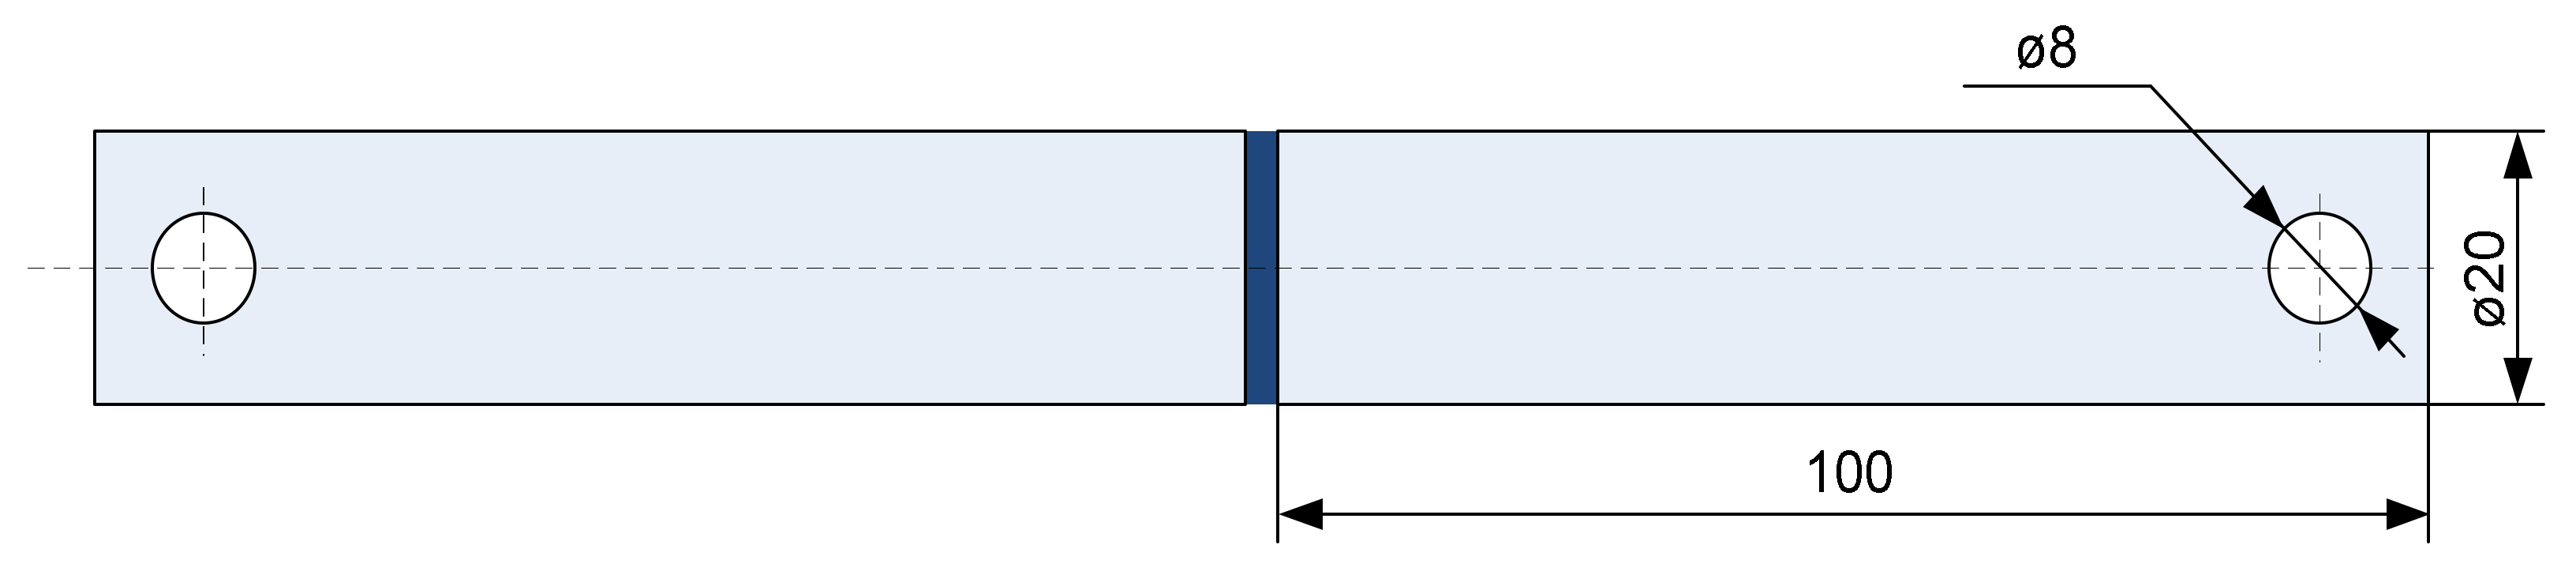
2.1. Materials and Sample Preparation
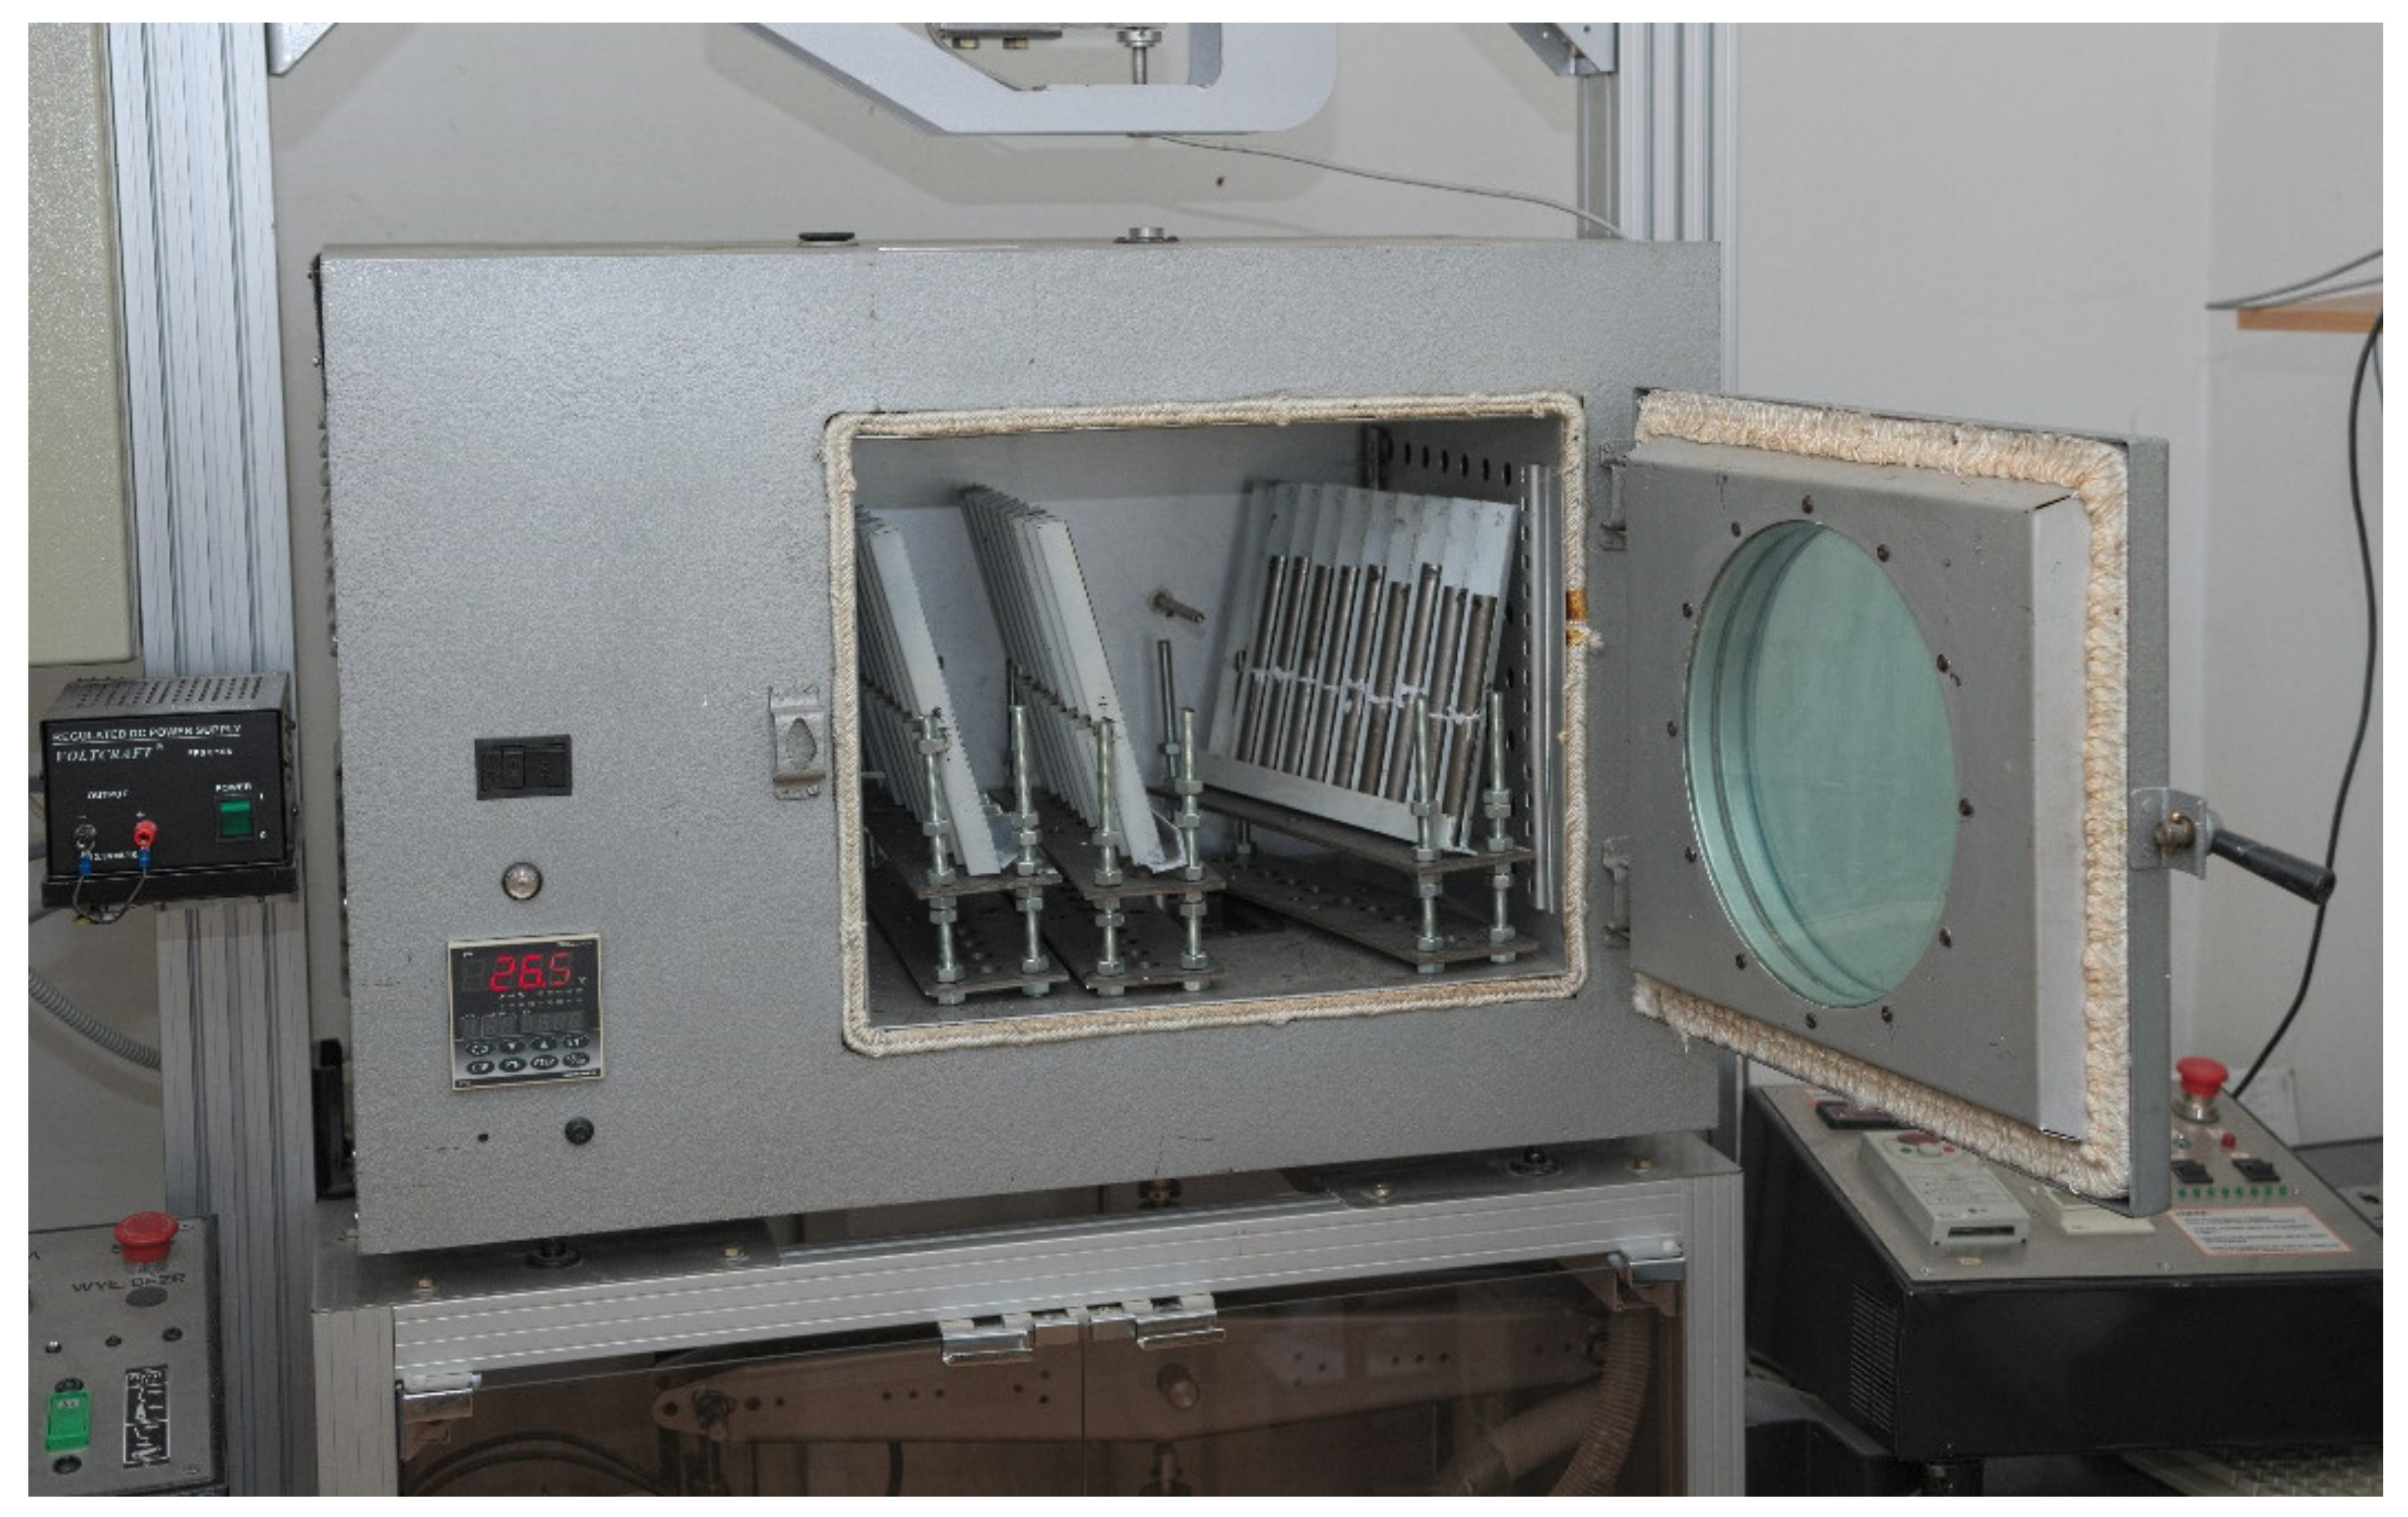
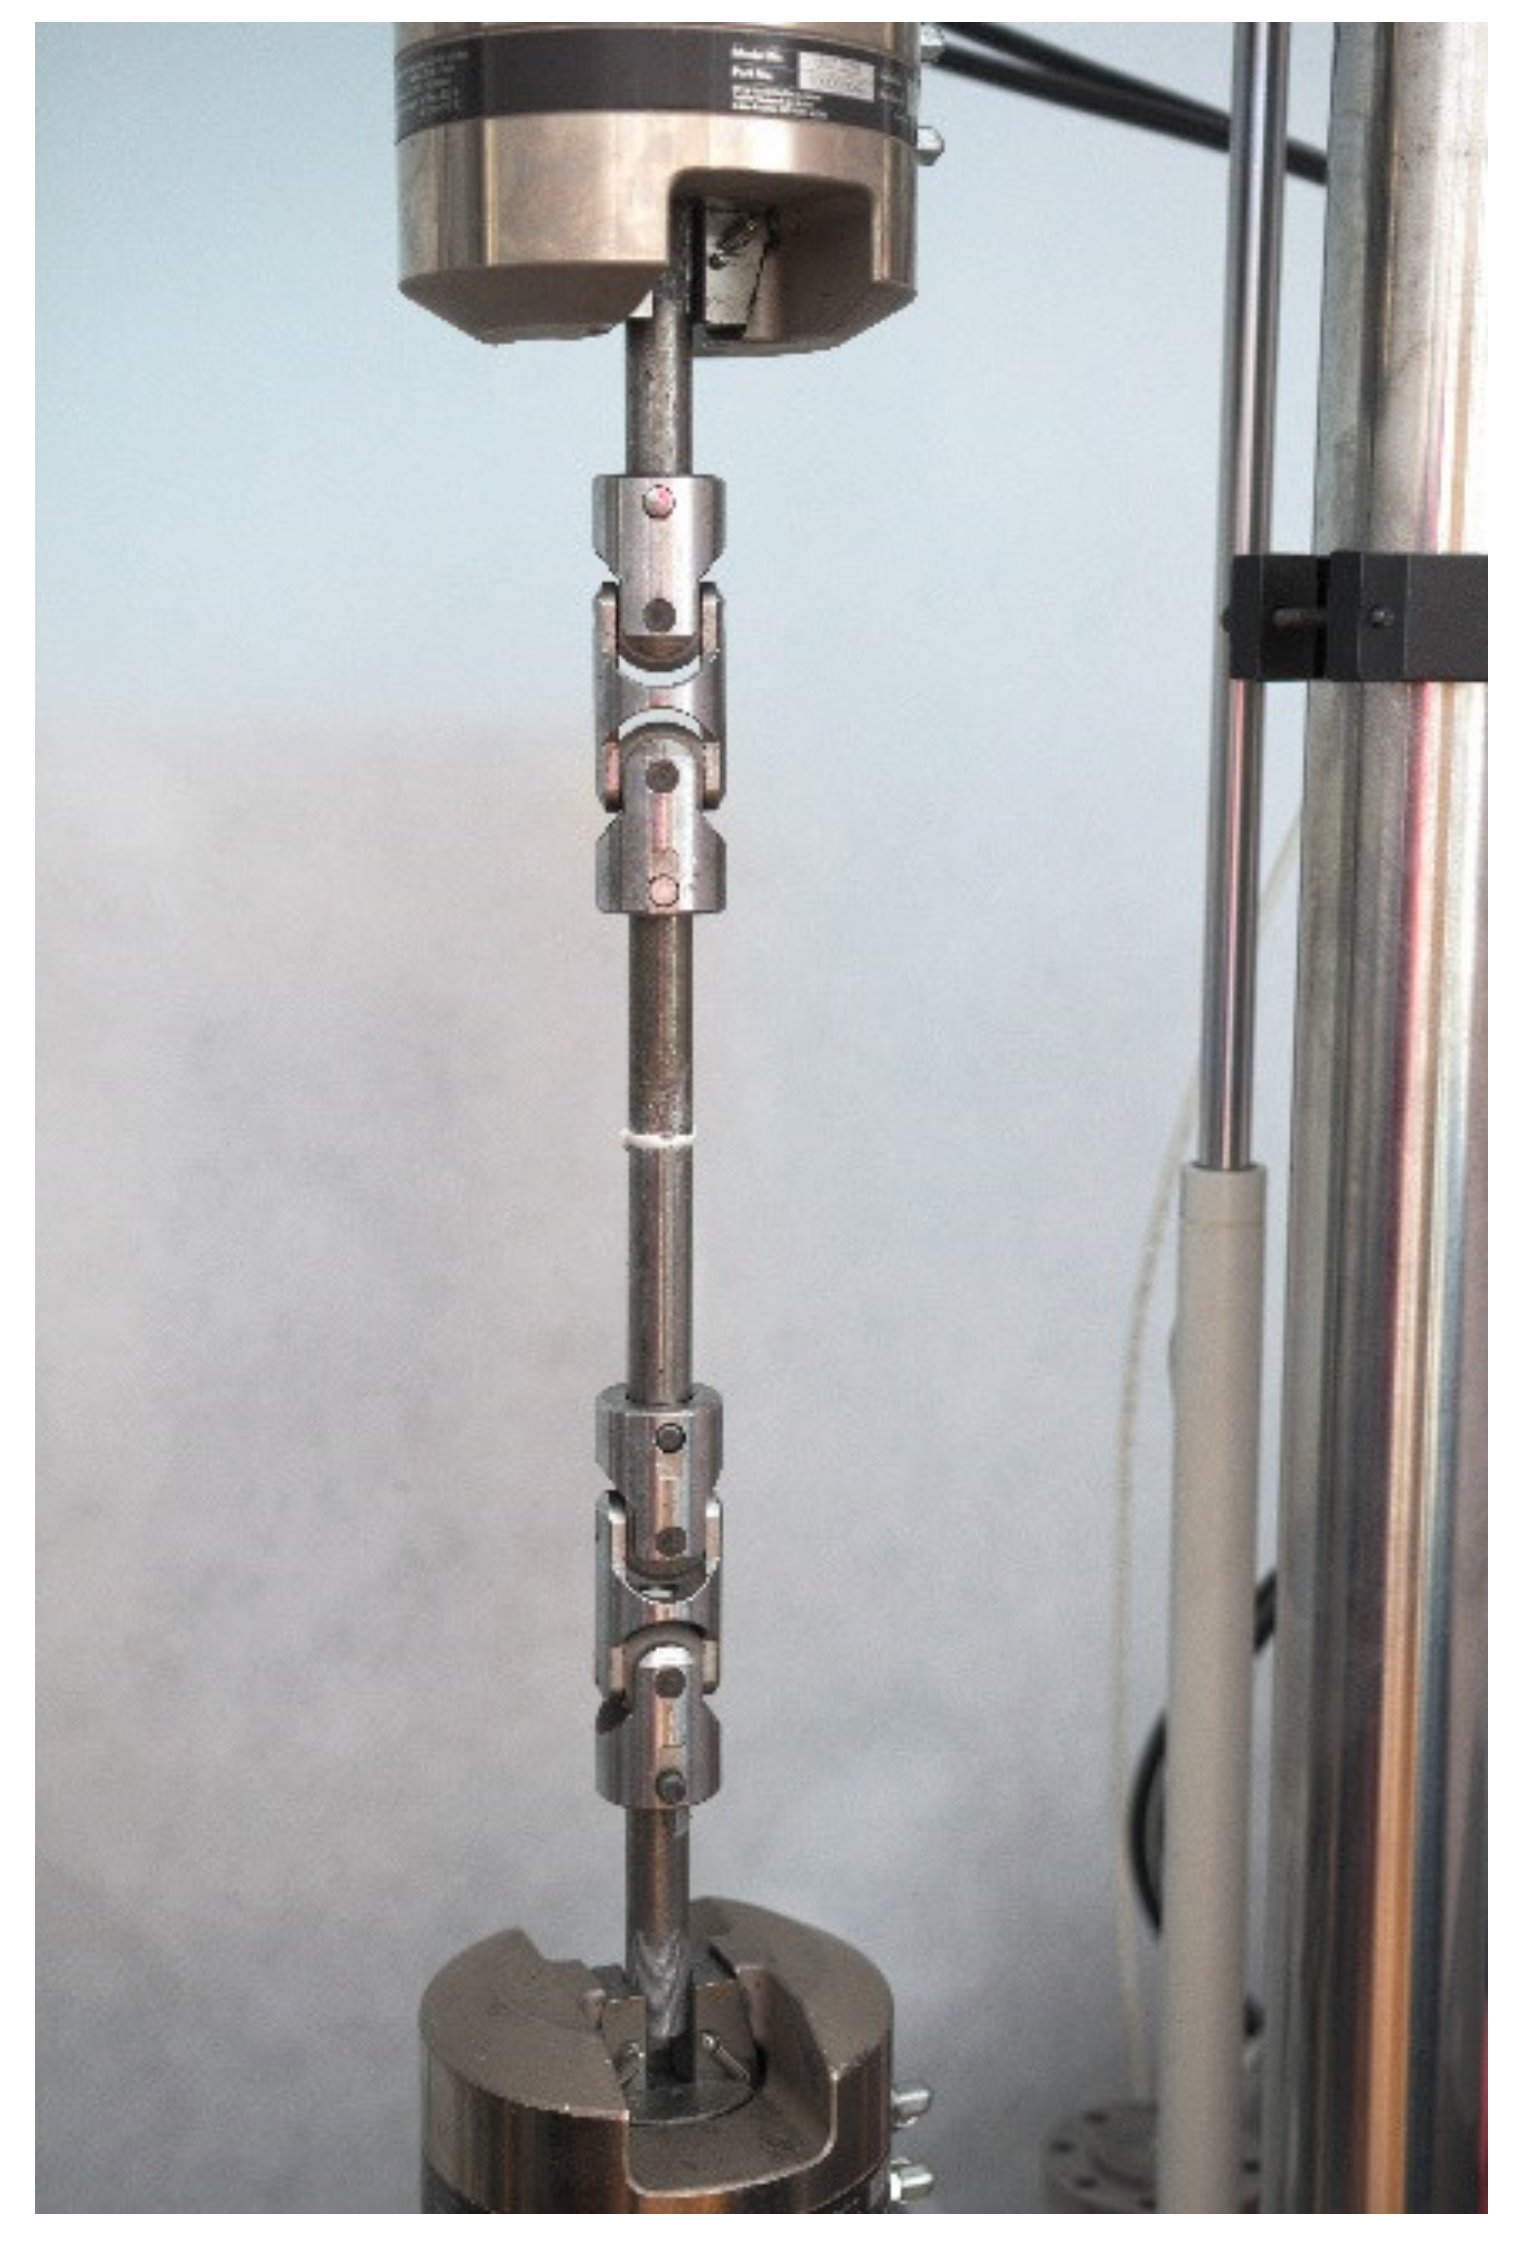
2.2. Mechanical Testing
2.3. Statistical Analysis
- The Shapiro–Wilk W-test (for the normality of distribution in the produced series of resultant joint strength test values);
- The tests by Fisher, Levene, and Brown–Forsythe (for the equality of group variances); and
- Student’s t-test (for the results characterised by normality of distribution and equality of variances to analyse the equality of the average resultant joint strength values at the adopted significance level).
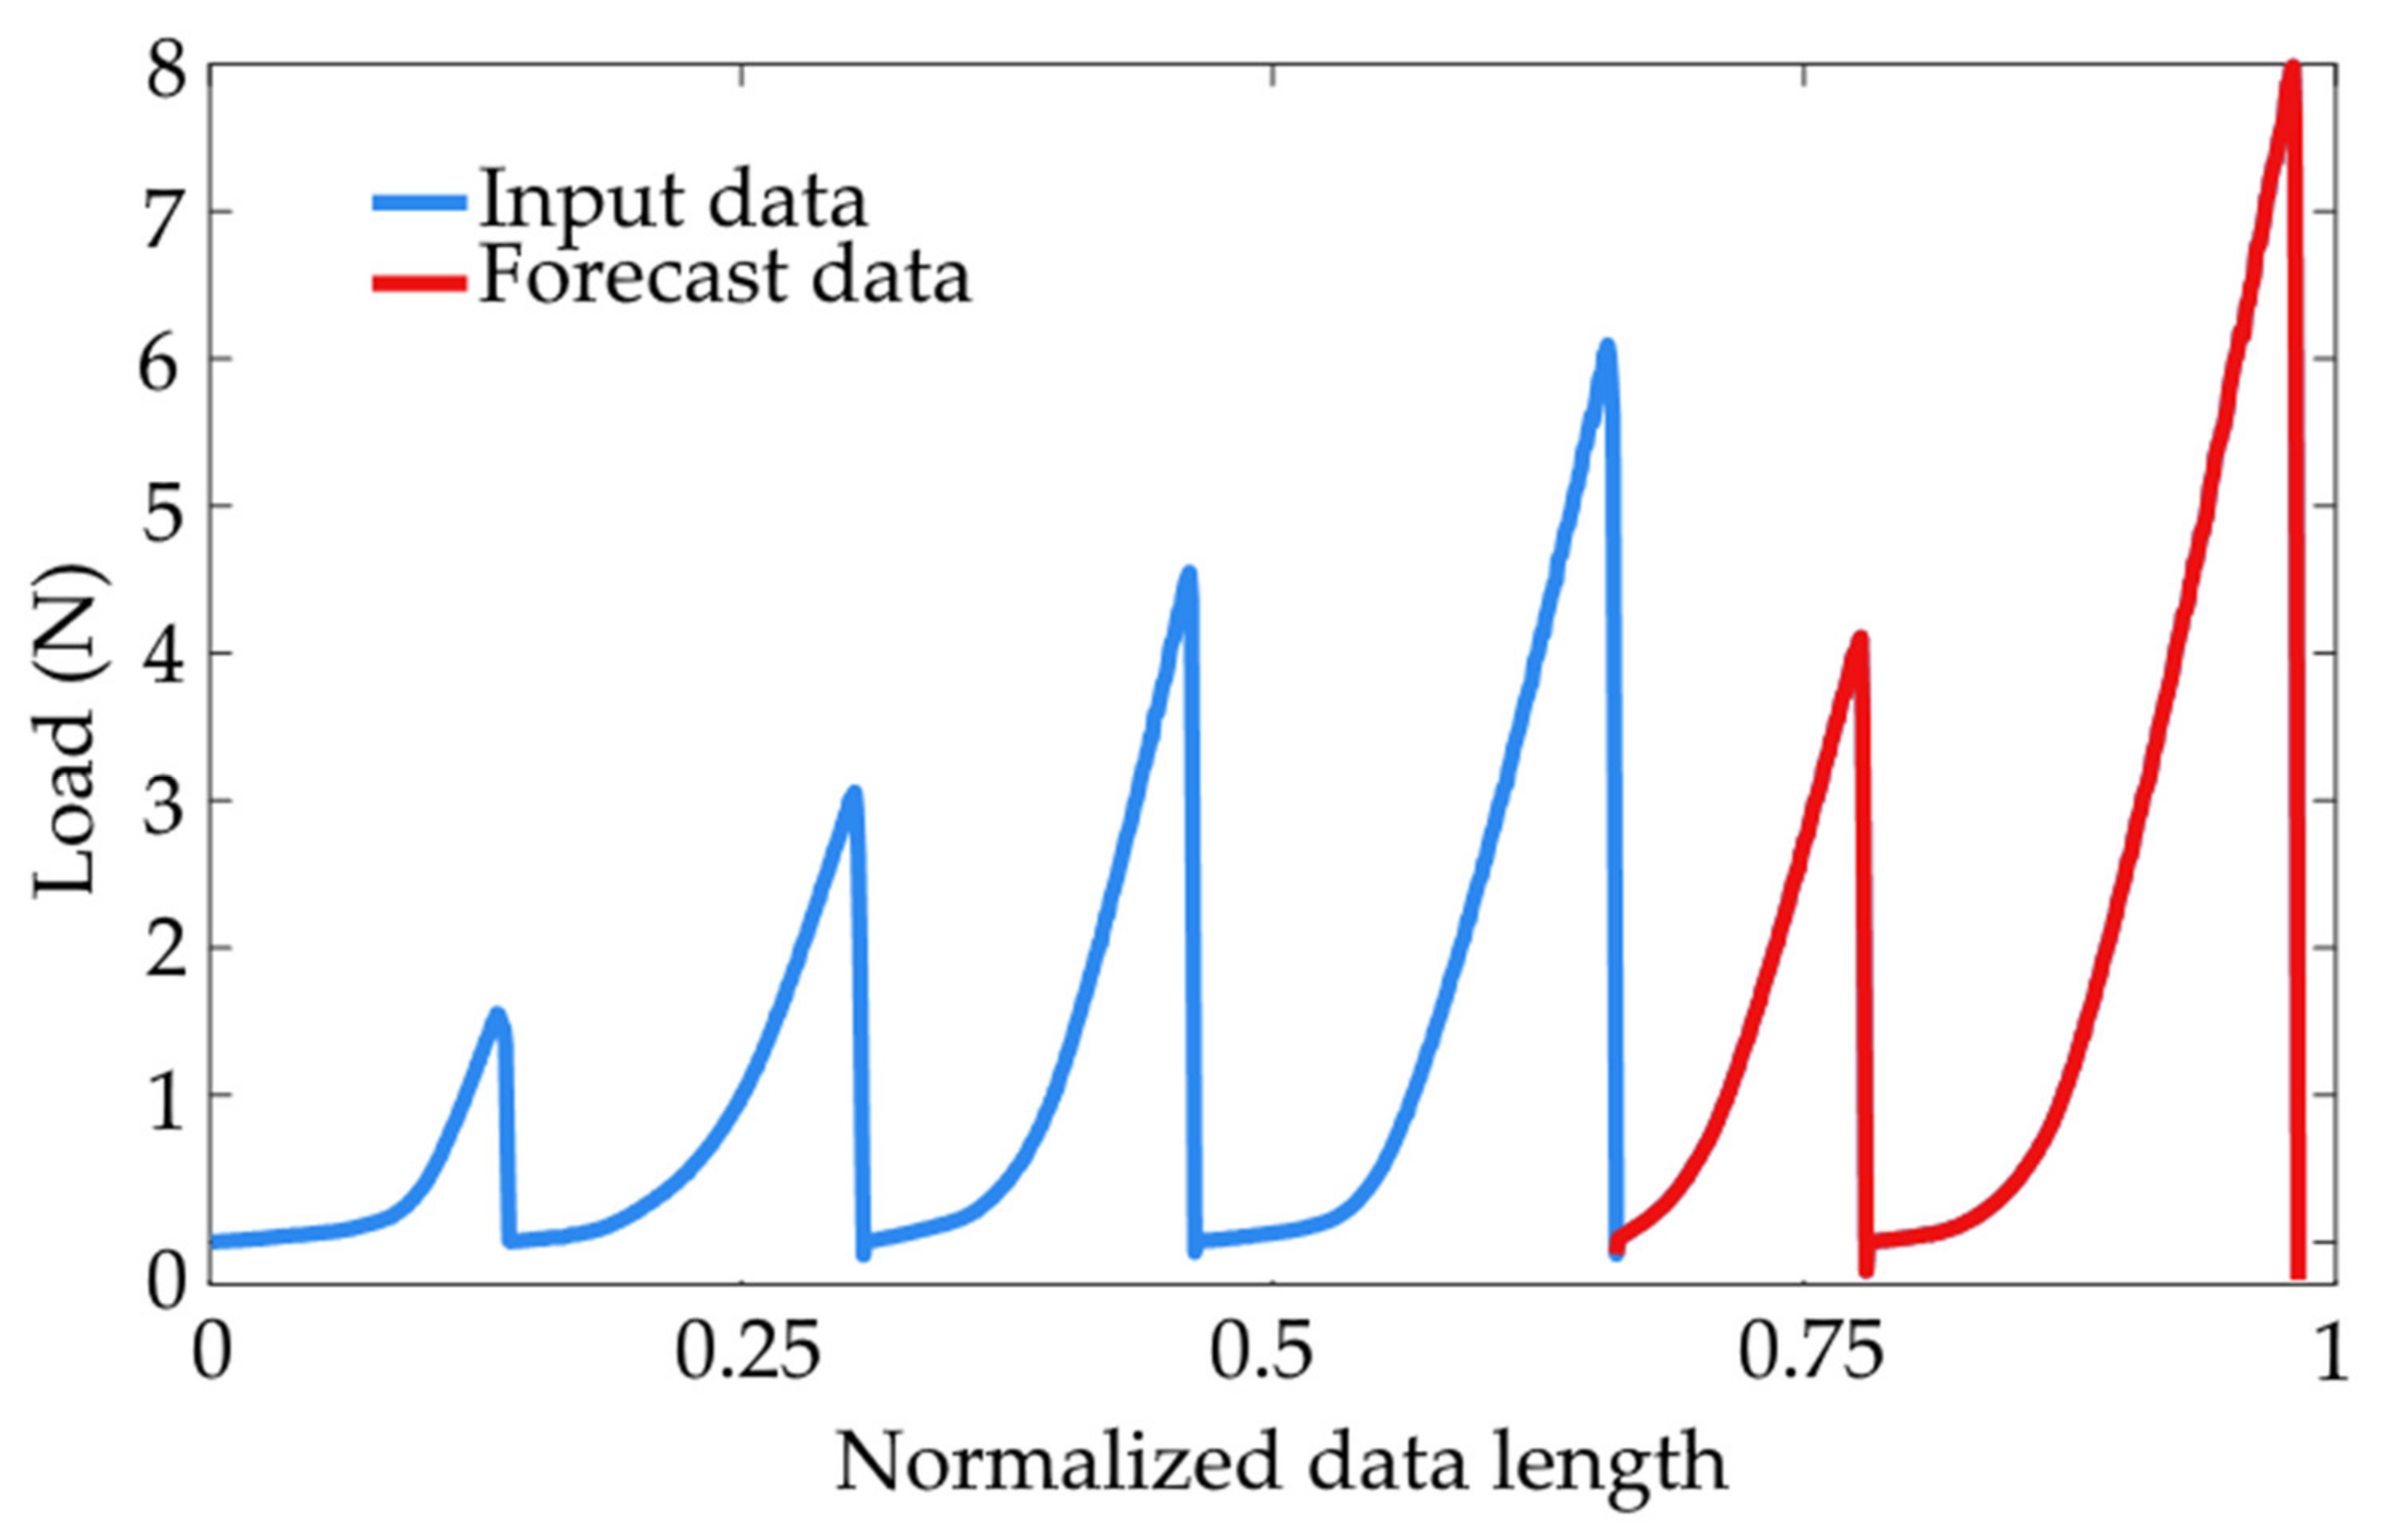
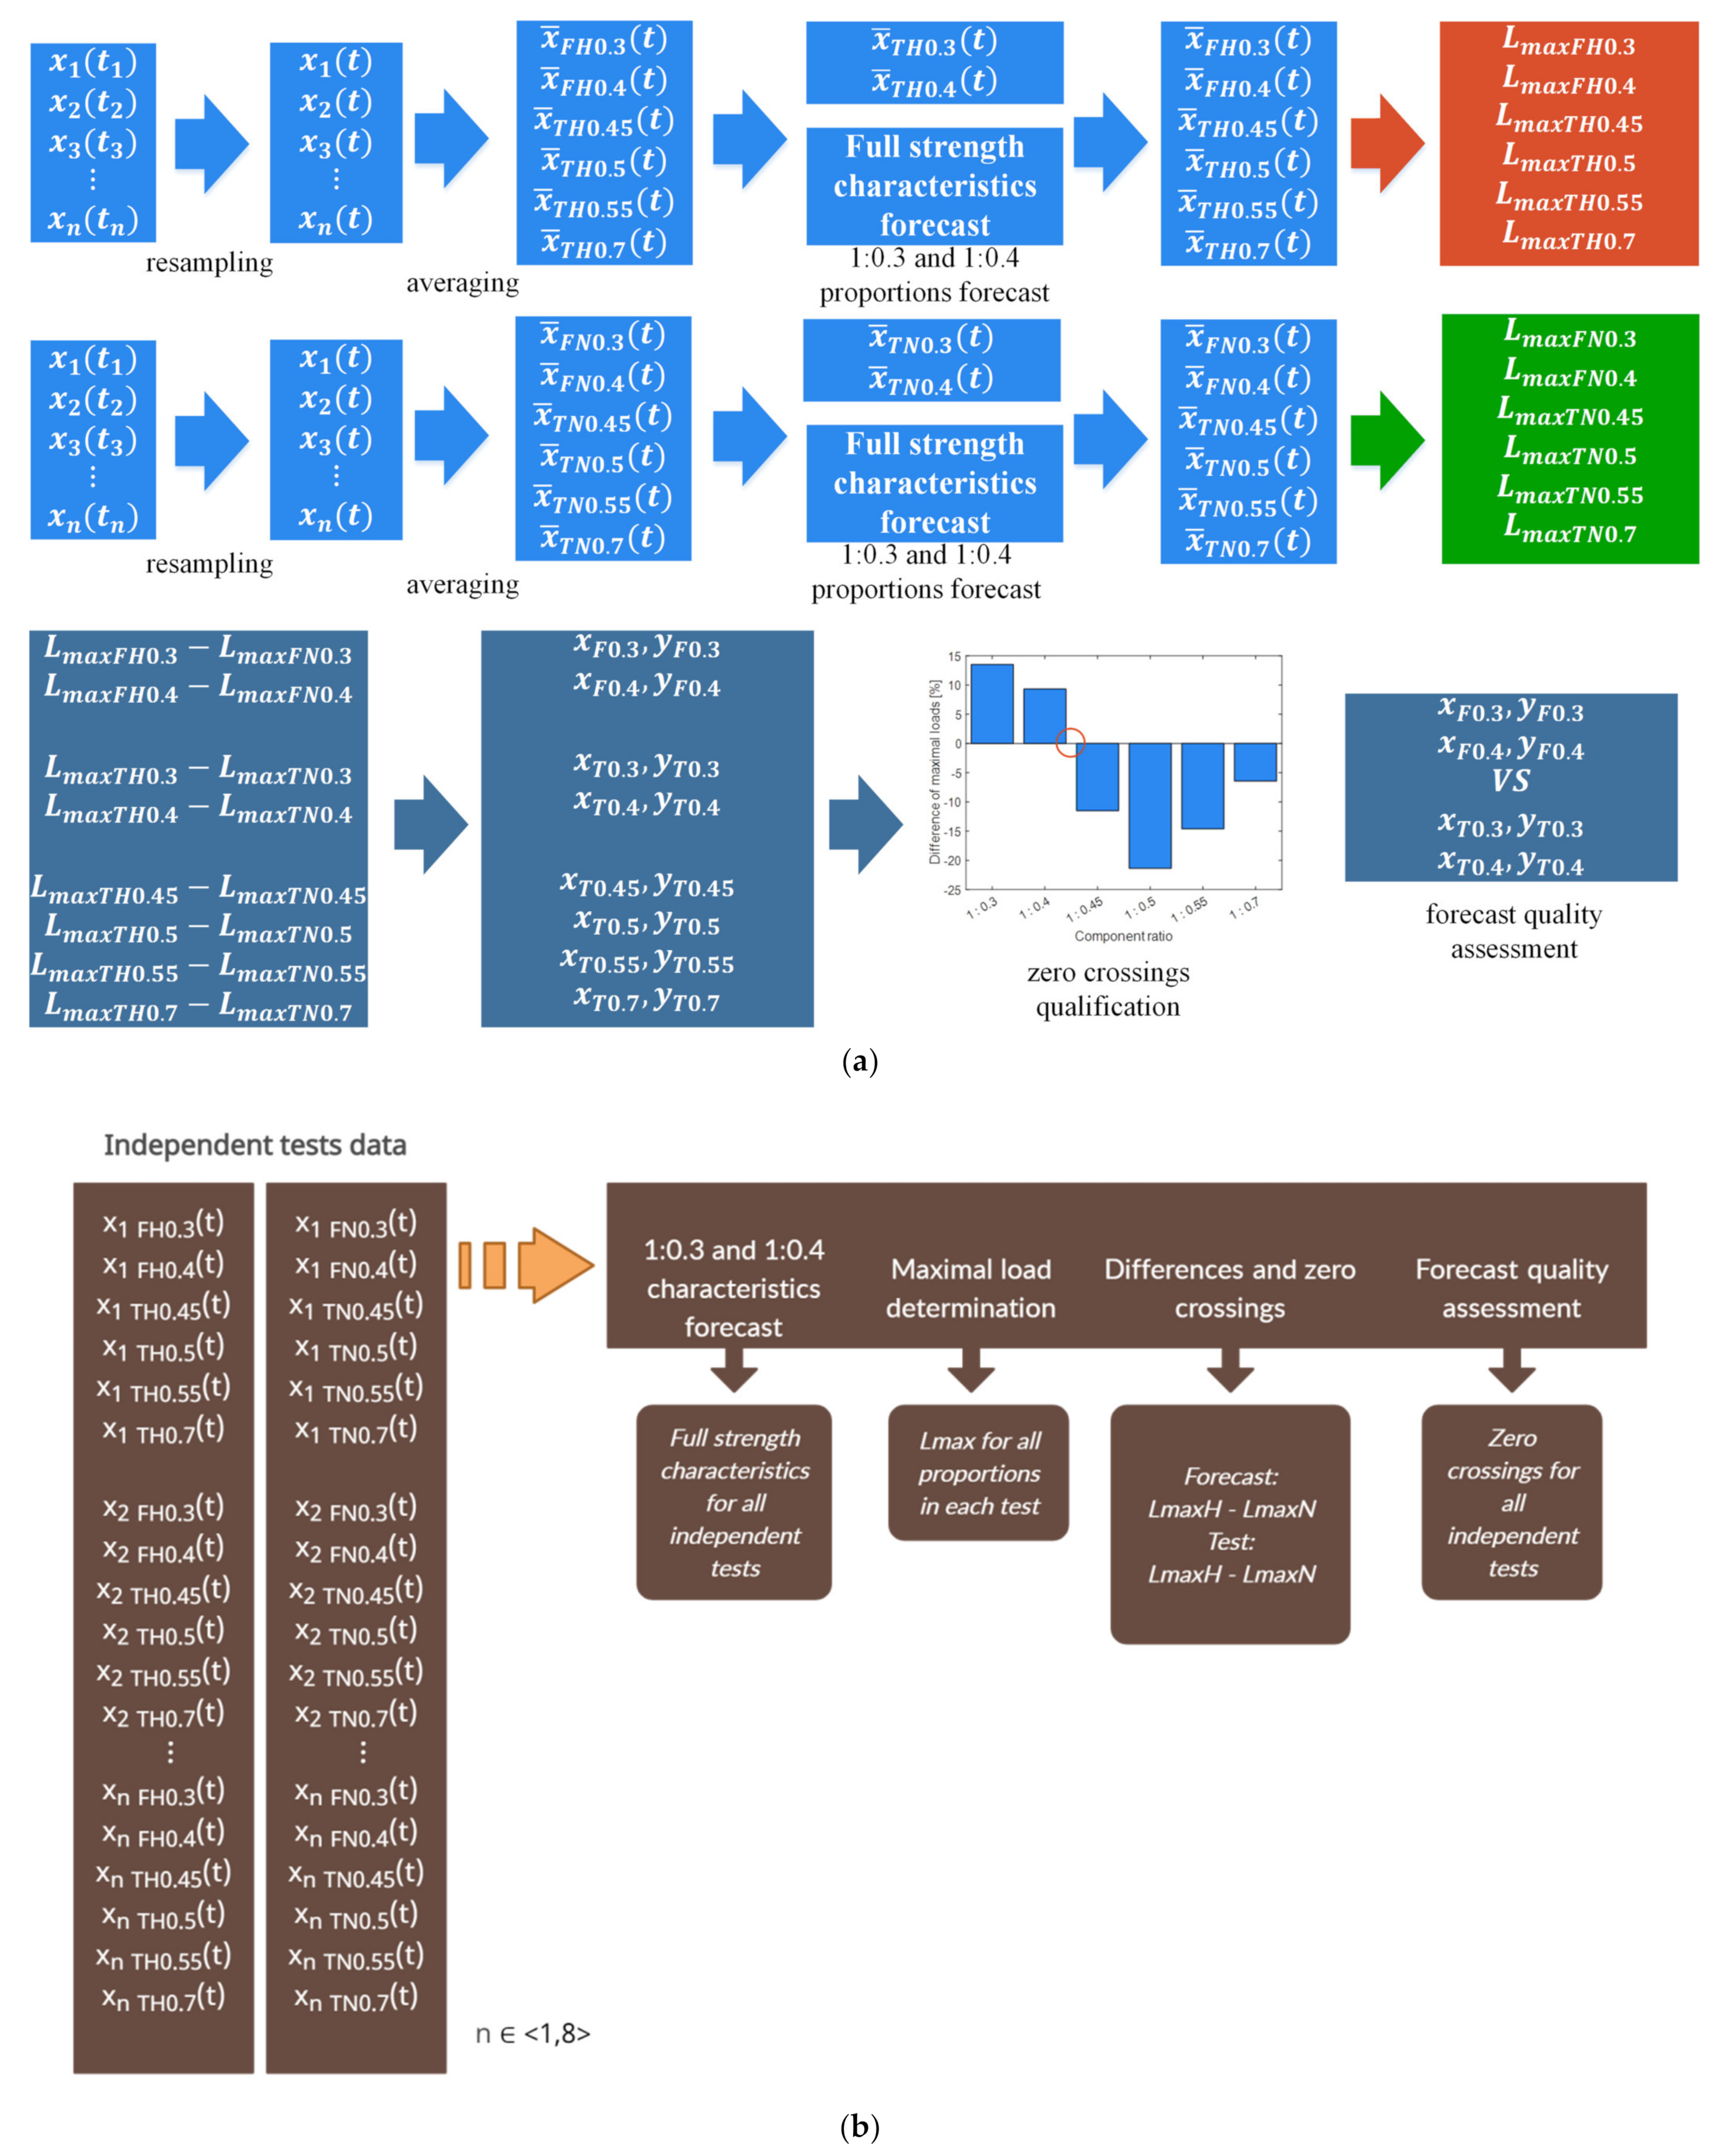
2.4. Long Short-Term Memory Artificial Recurrent Neural Network
3. Results and Discussion
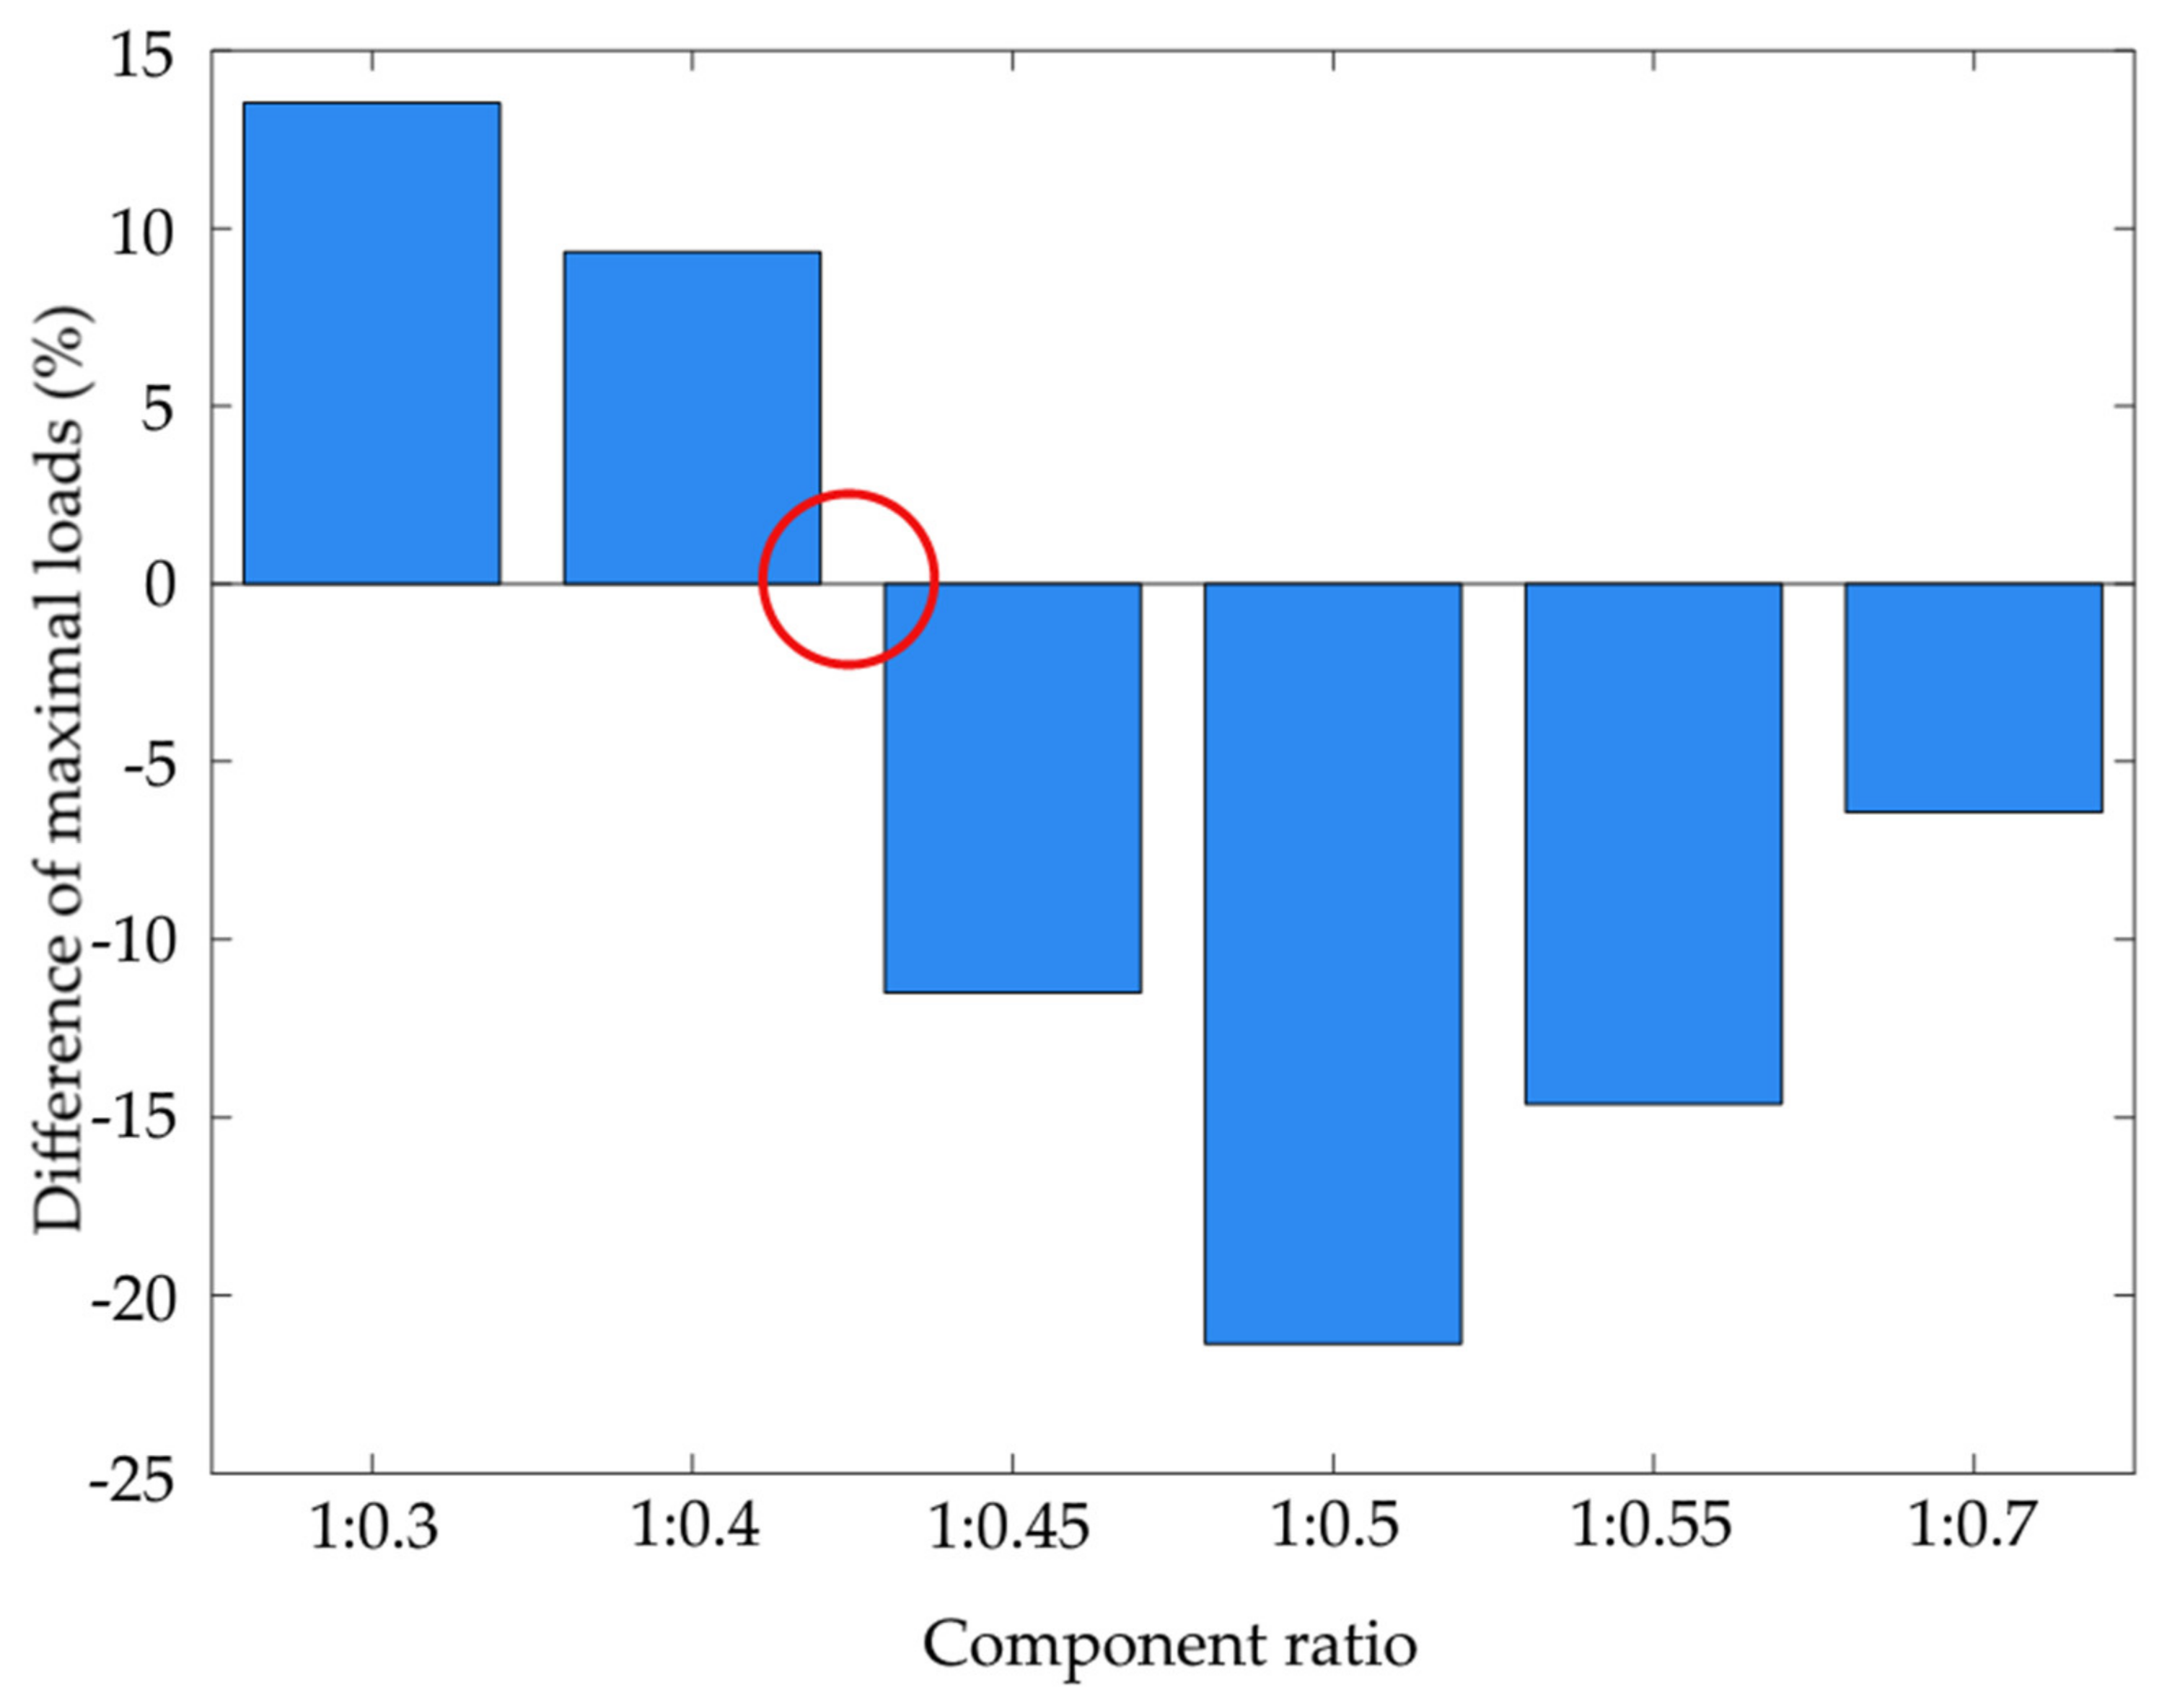
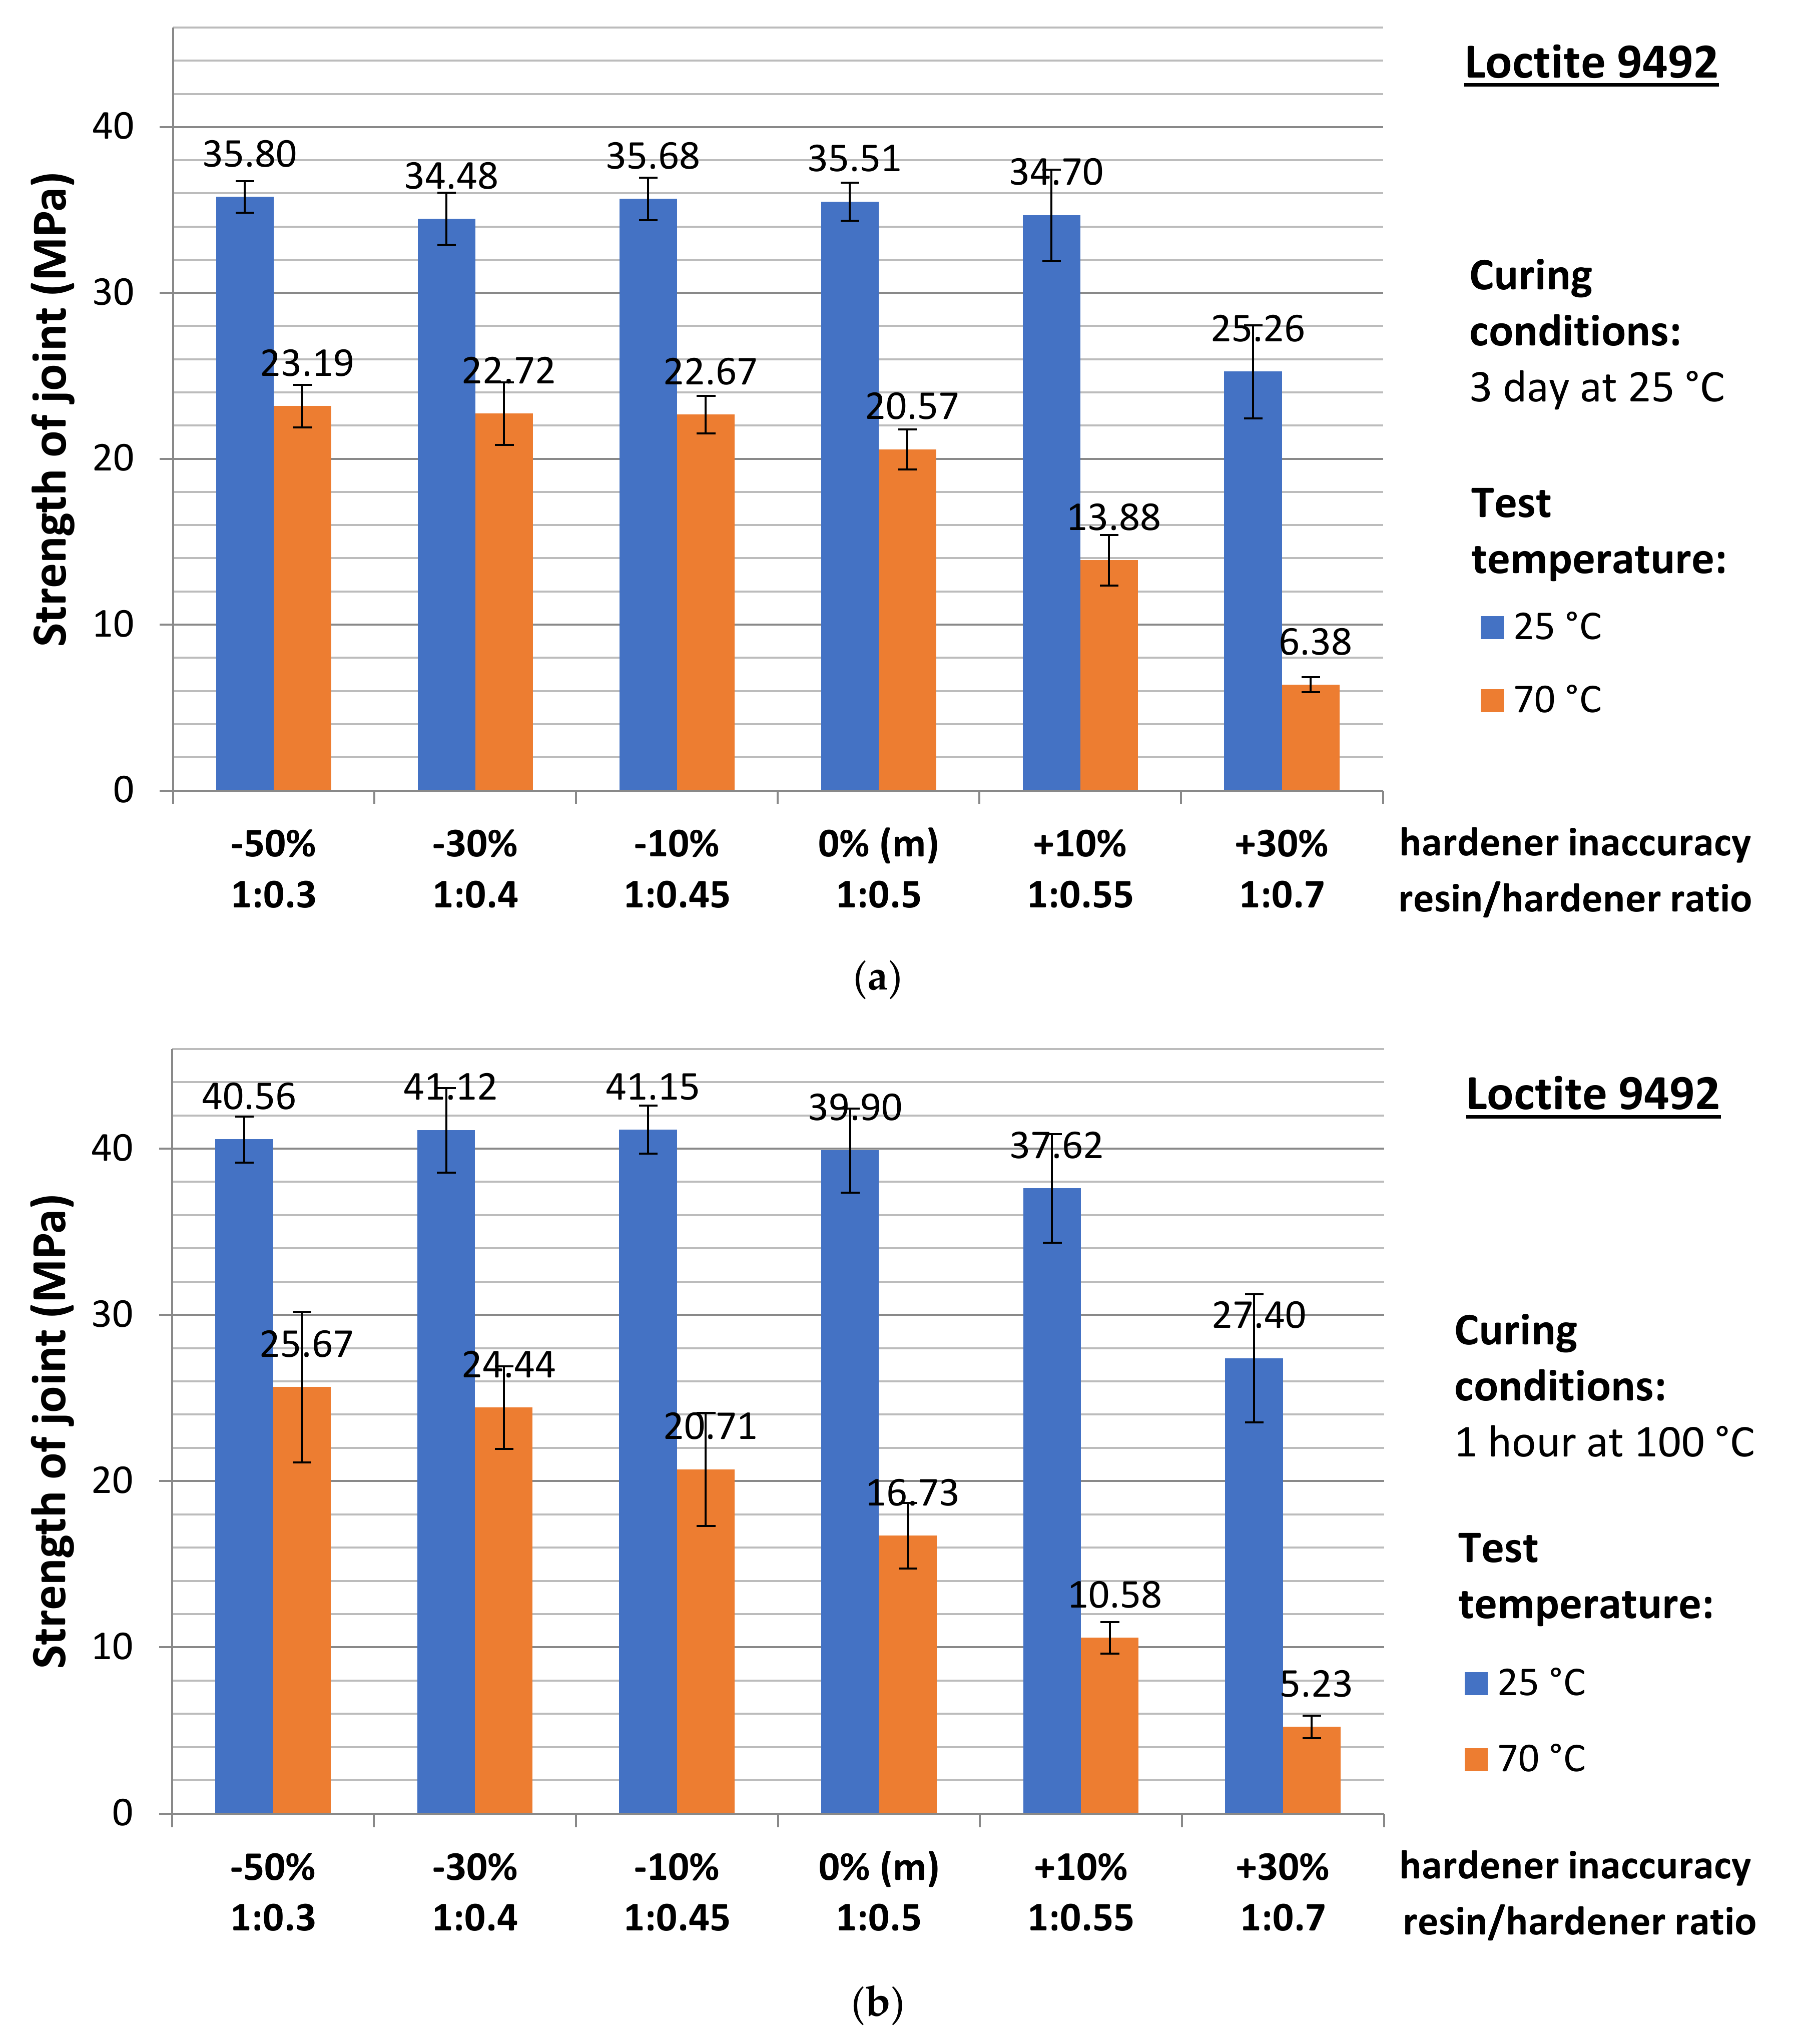
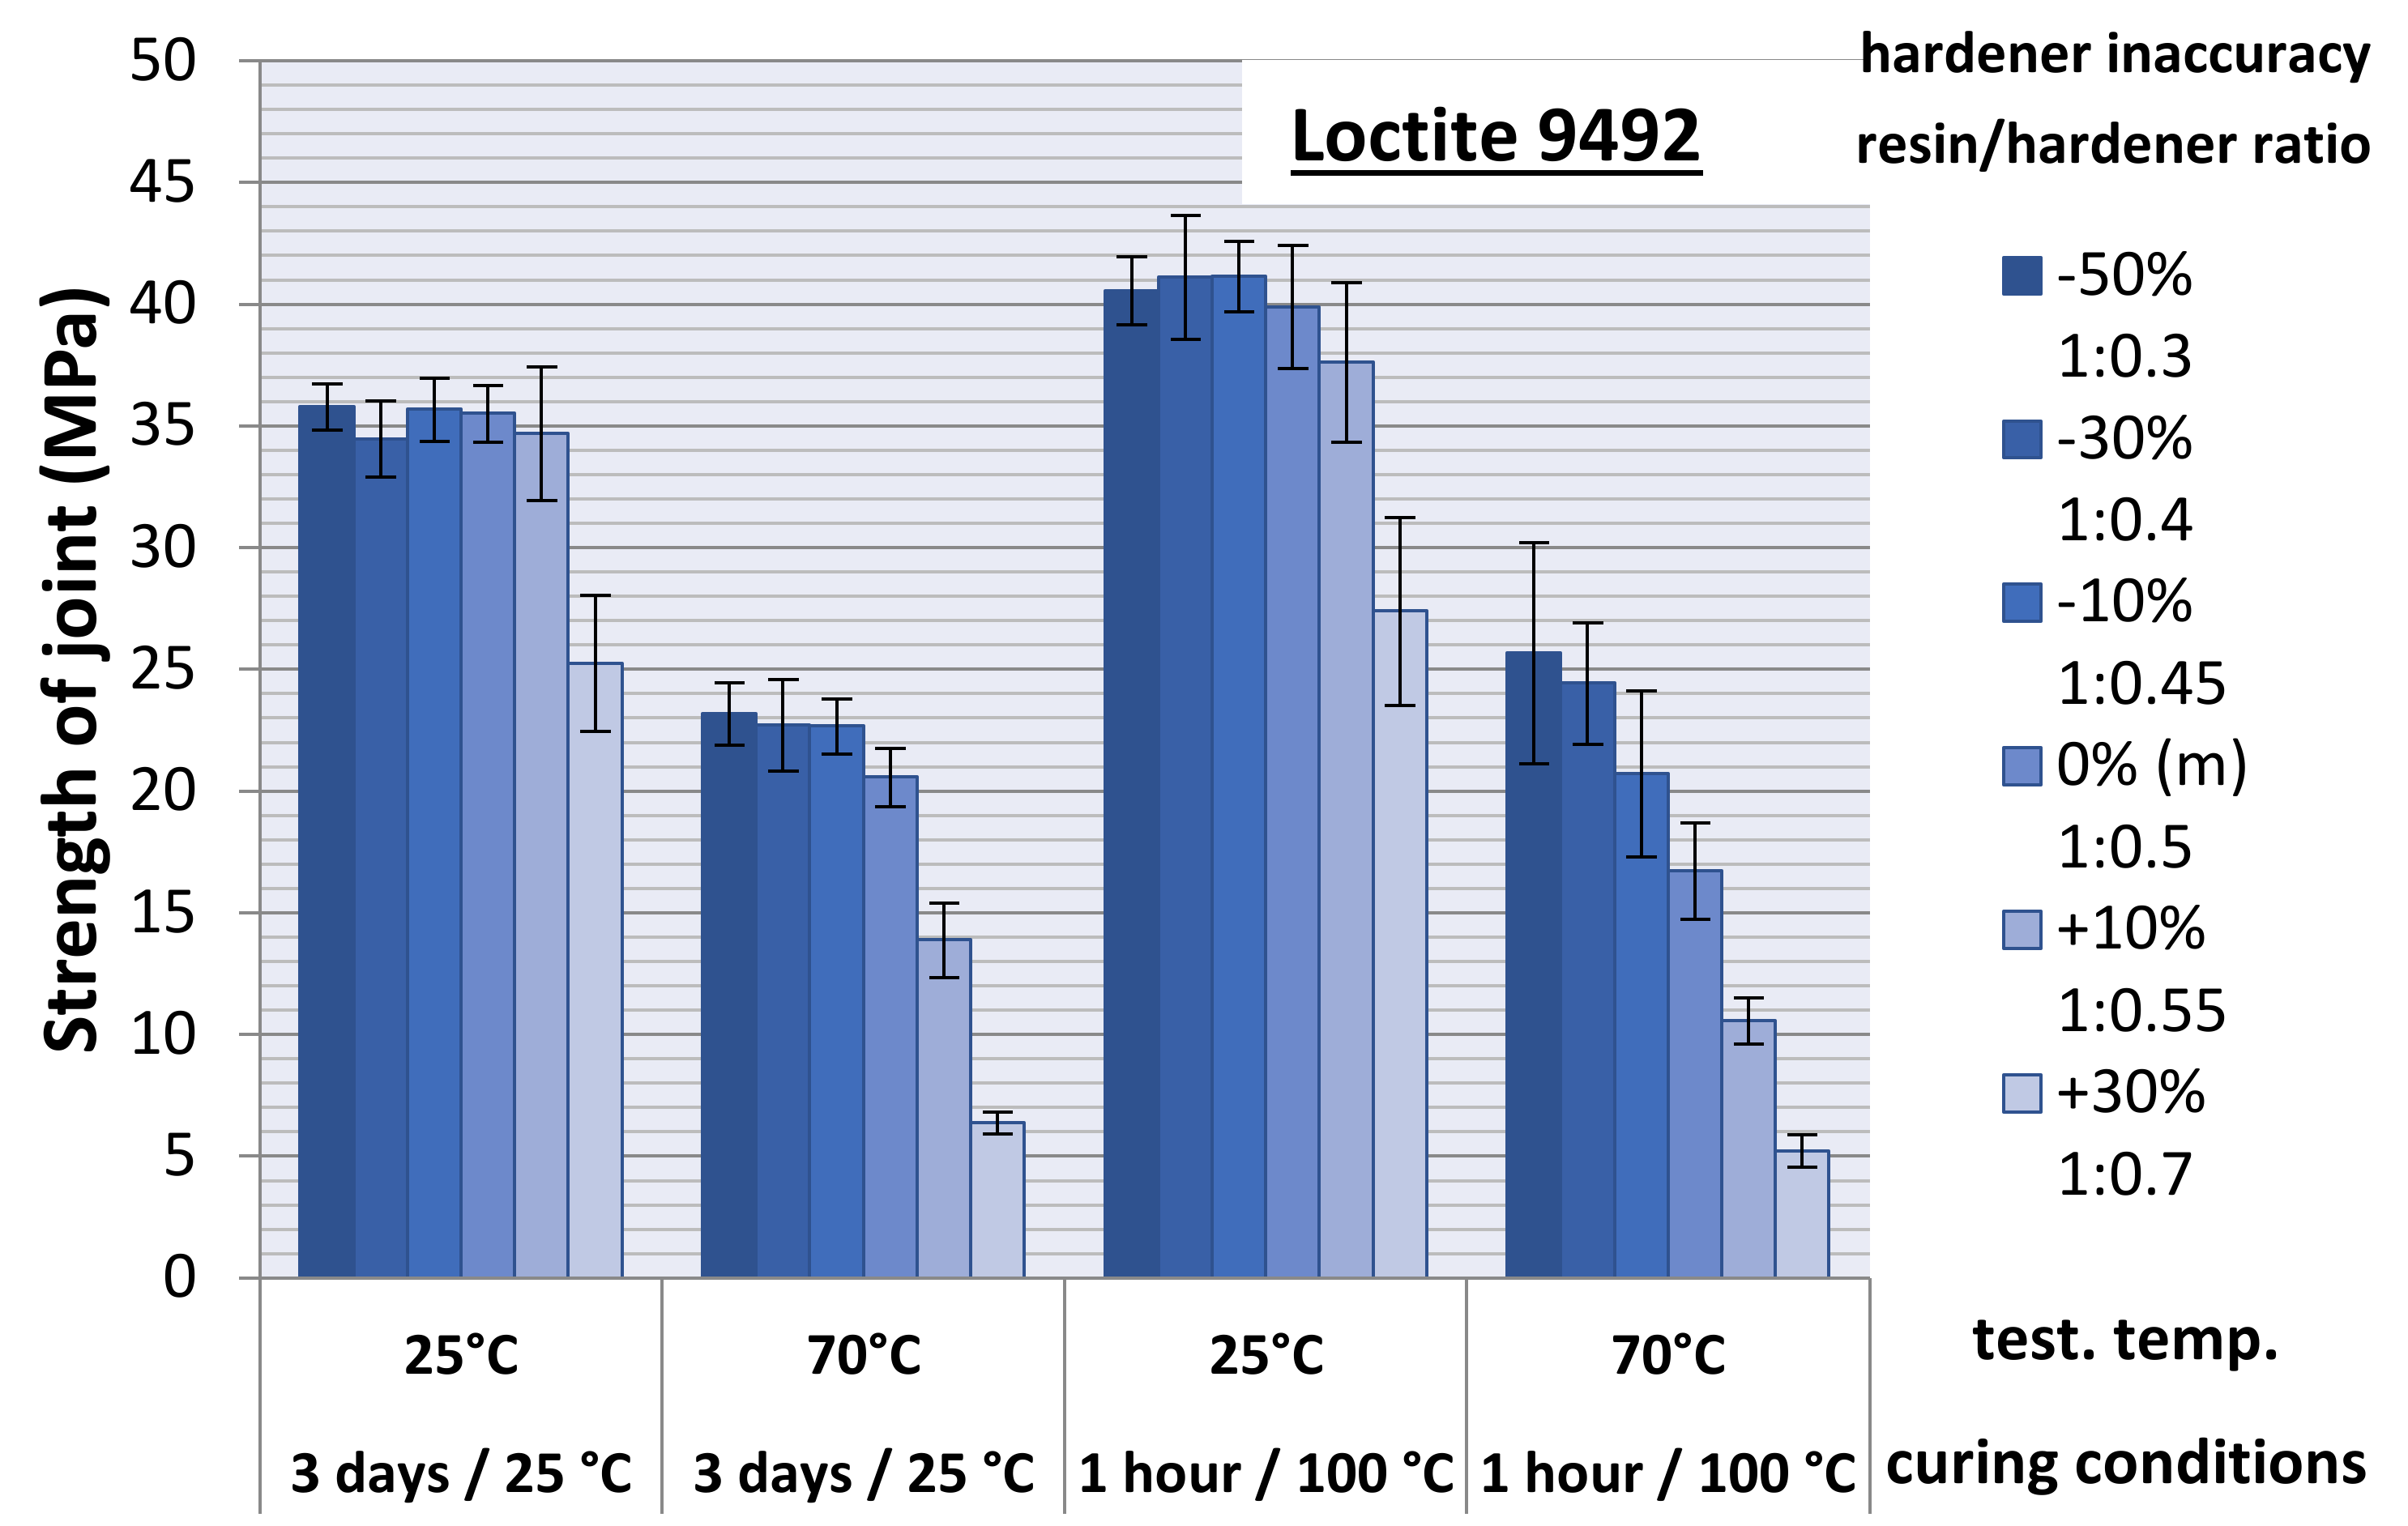
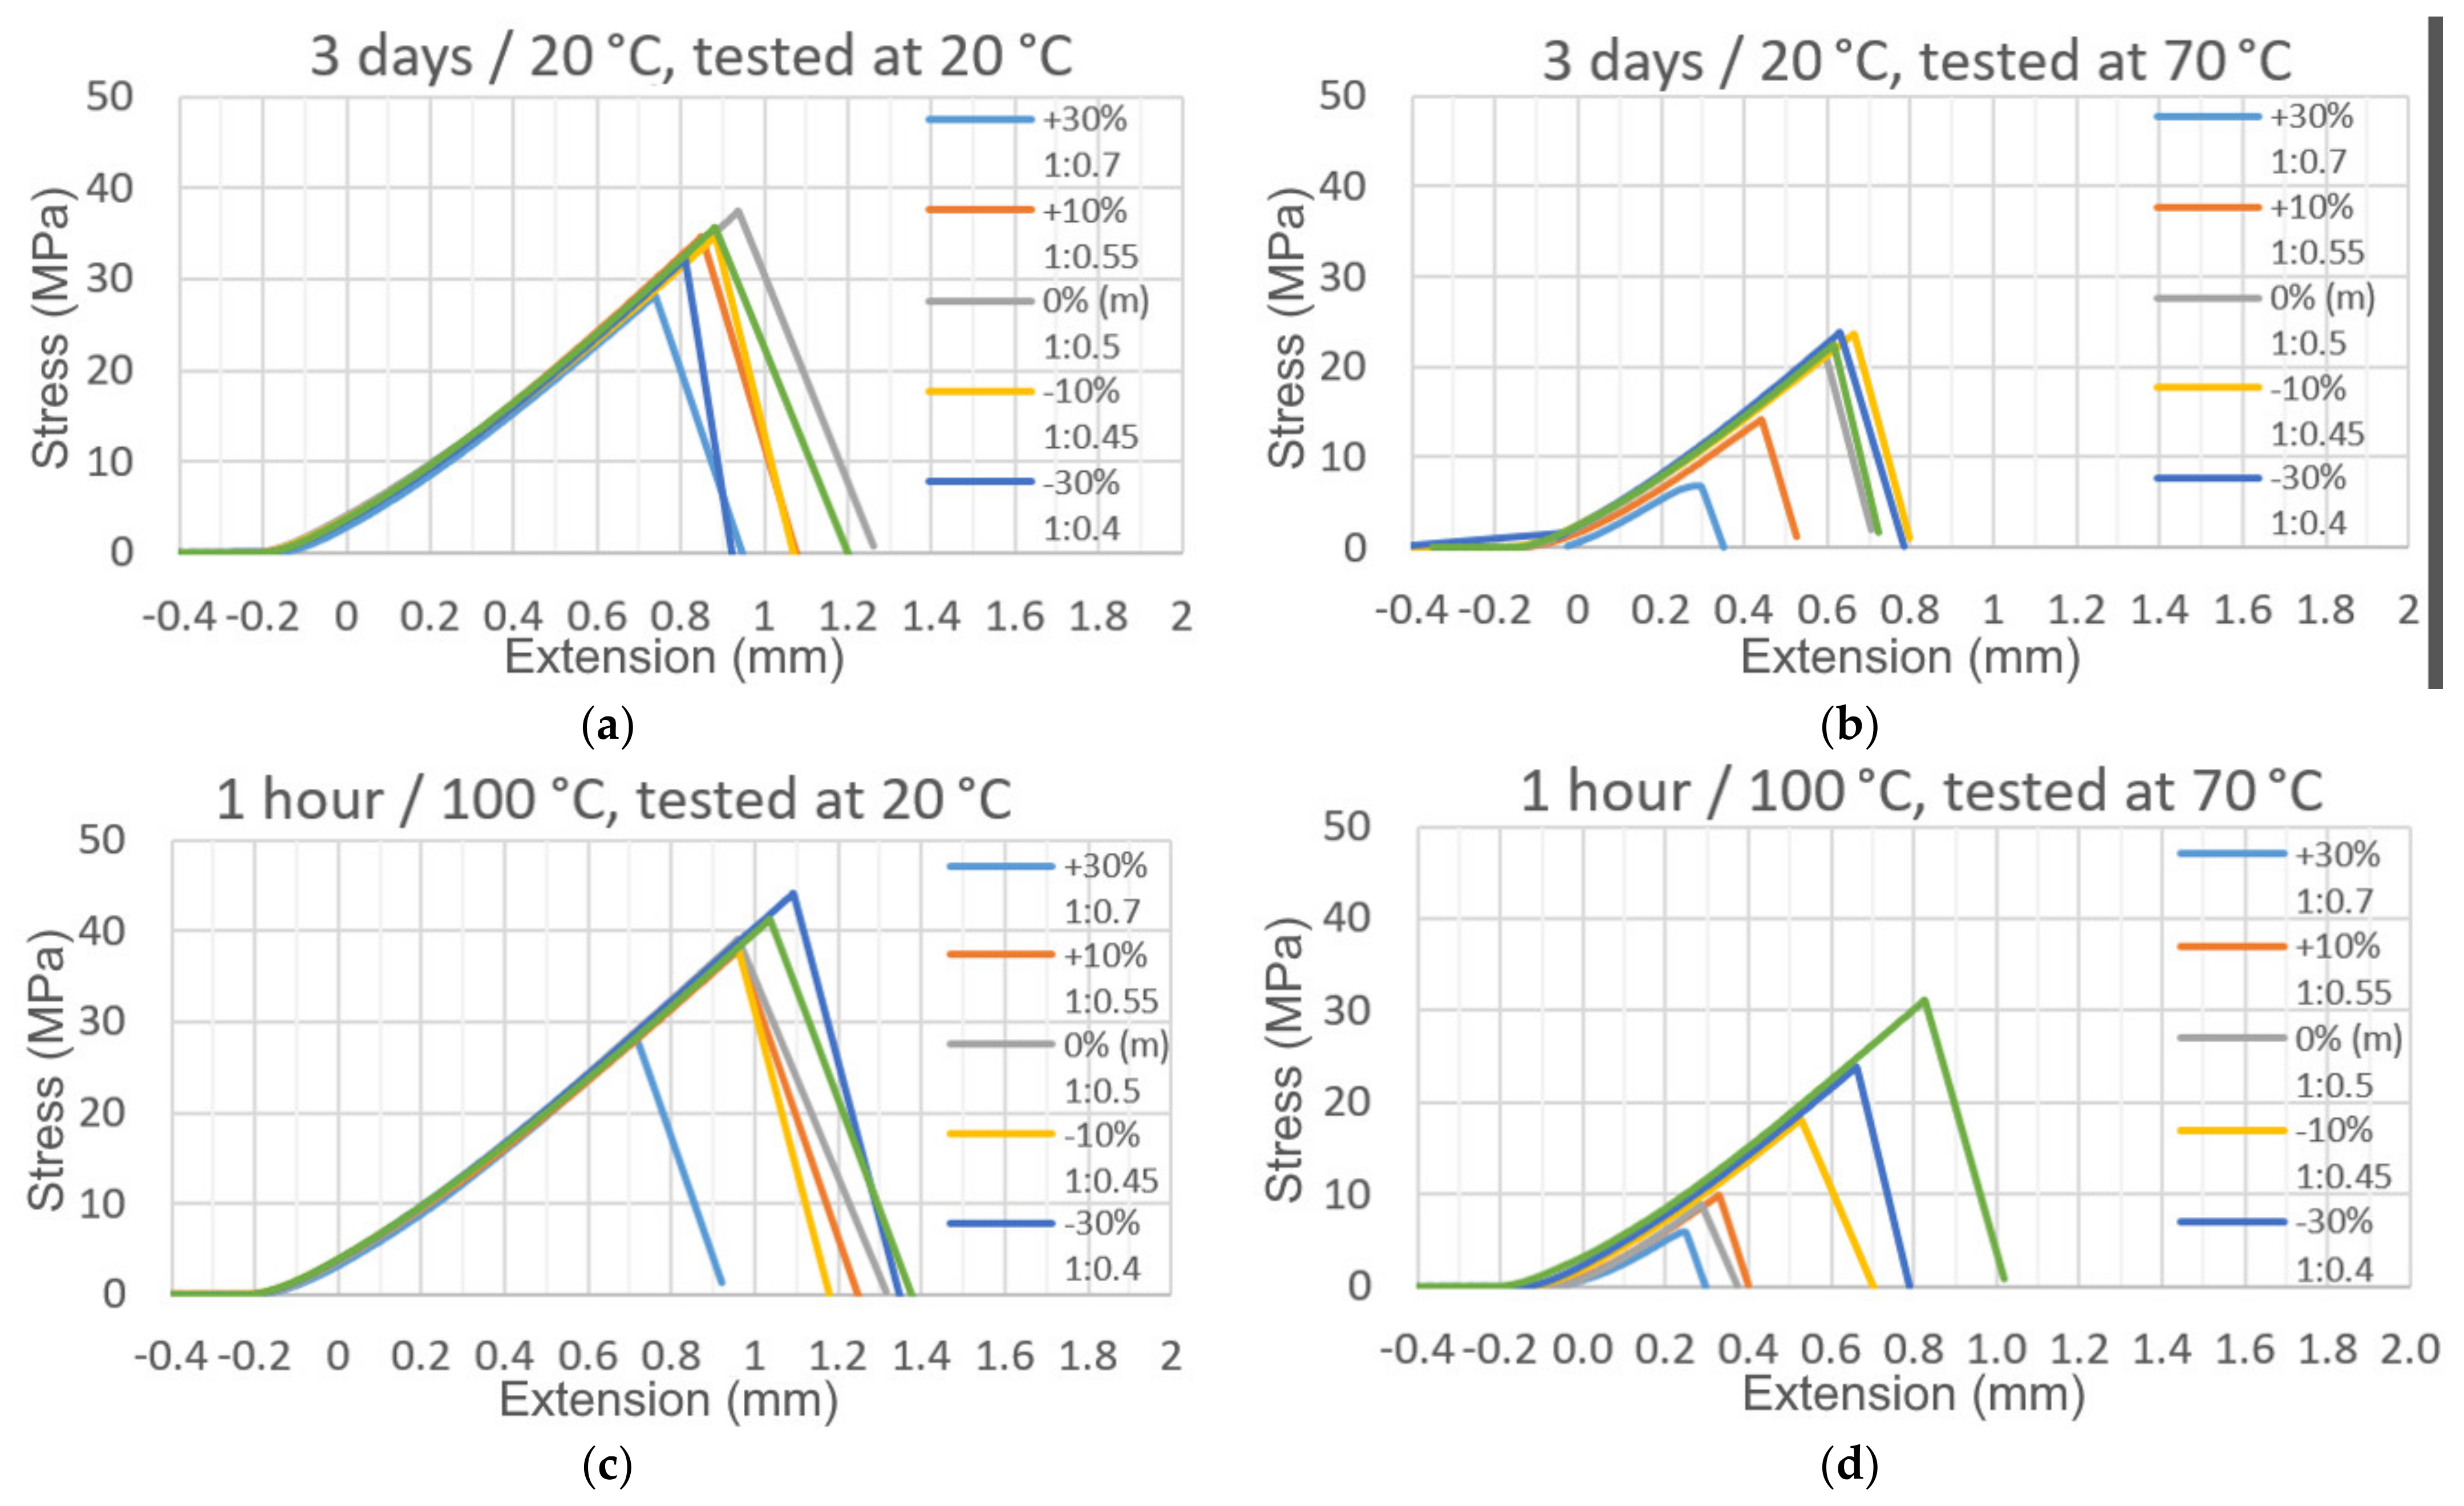
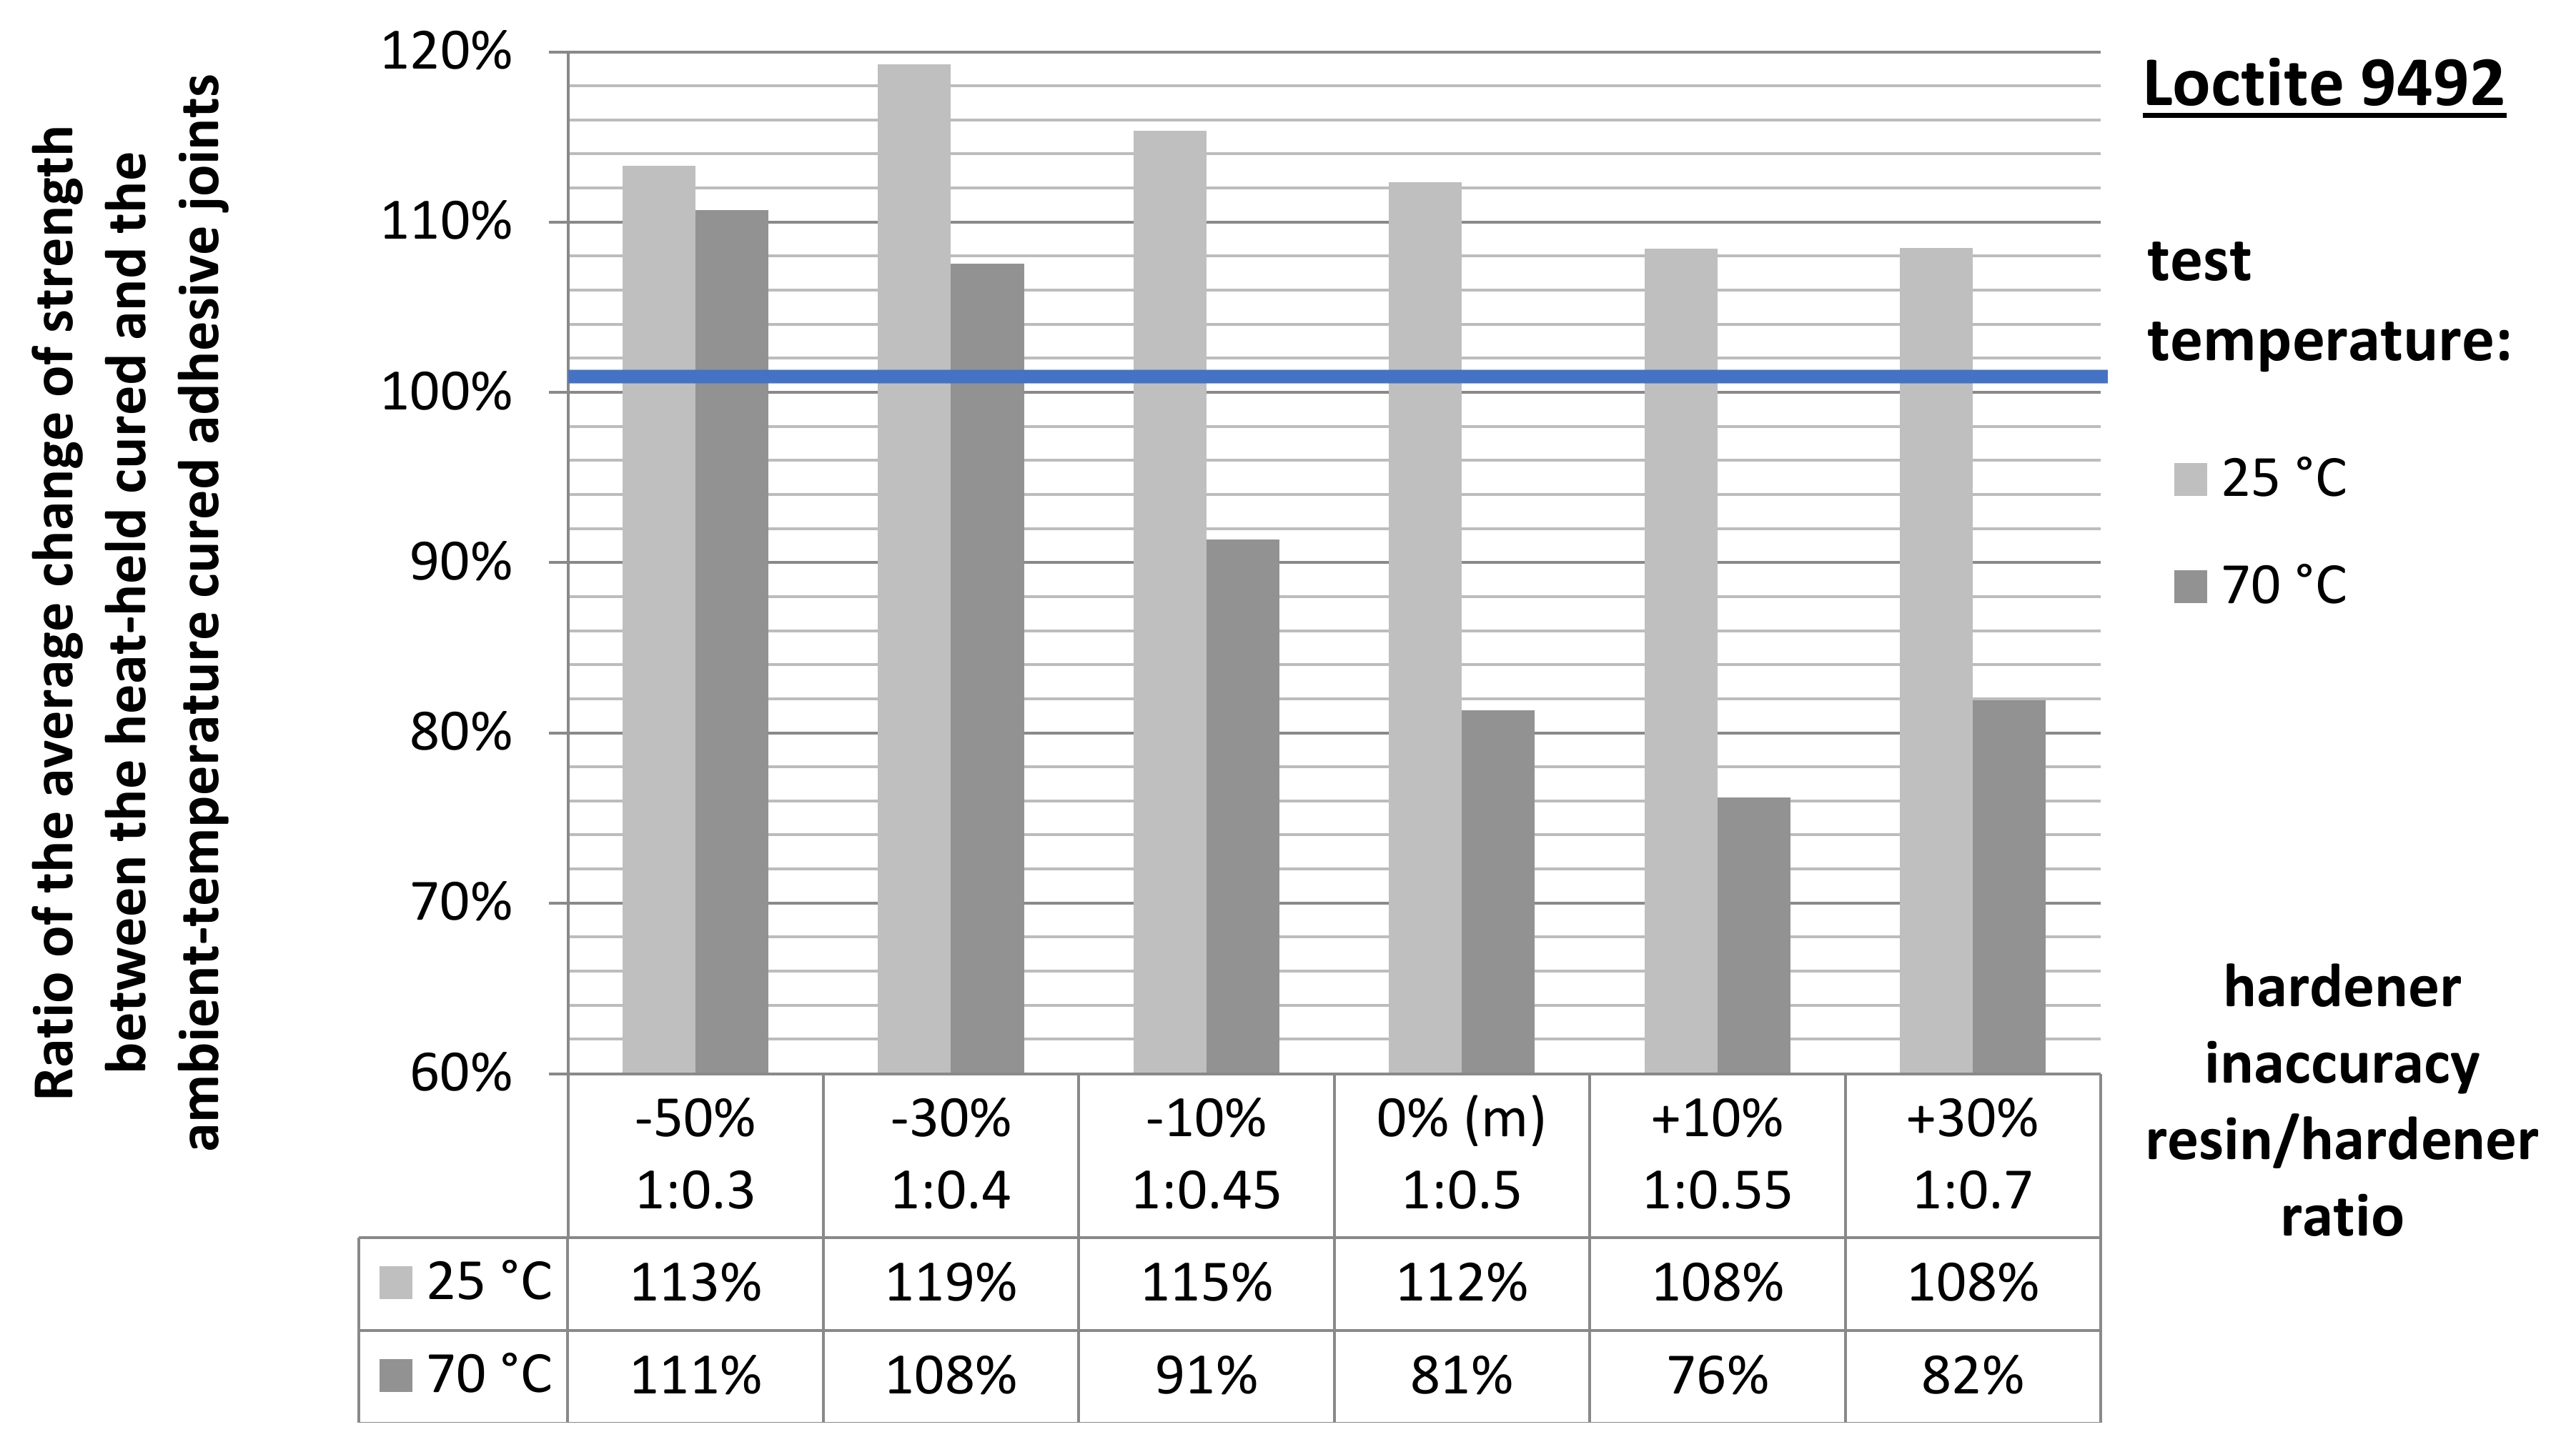
3.1. Mechanical Testing
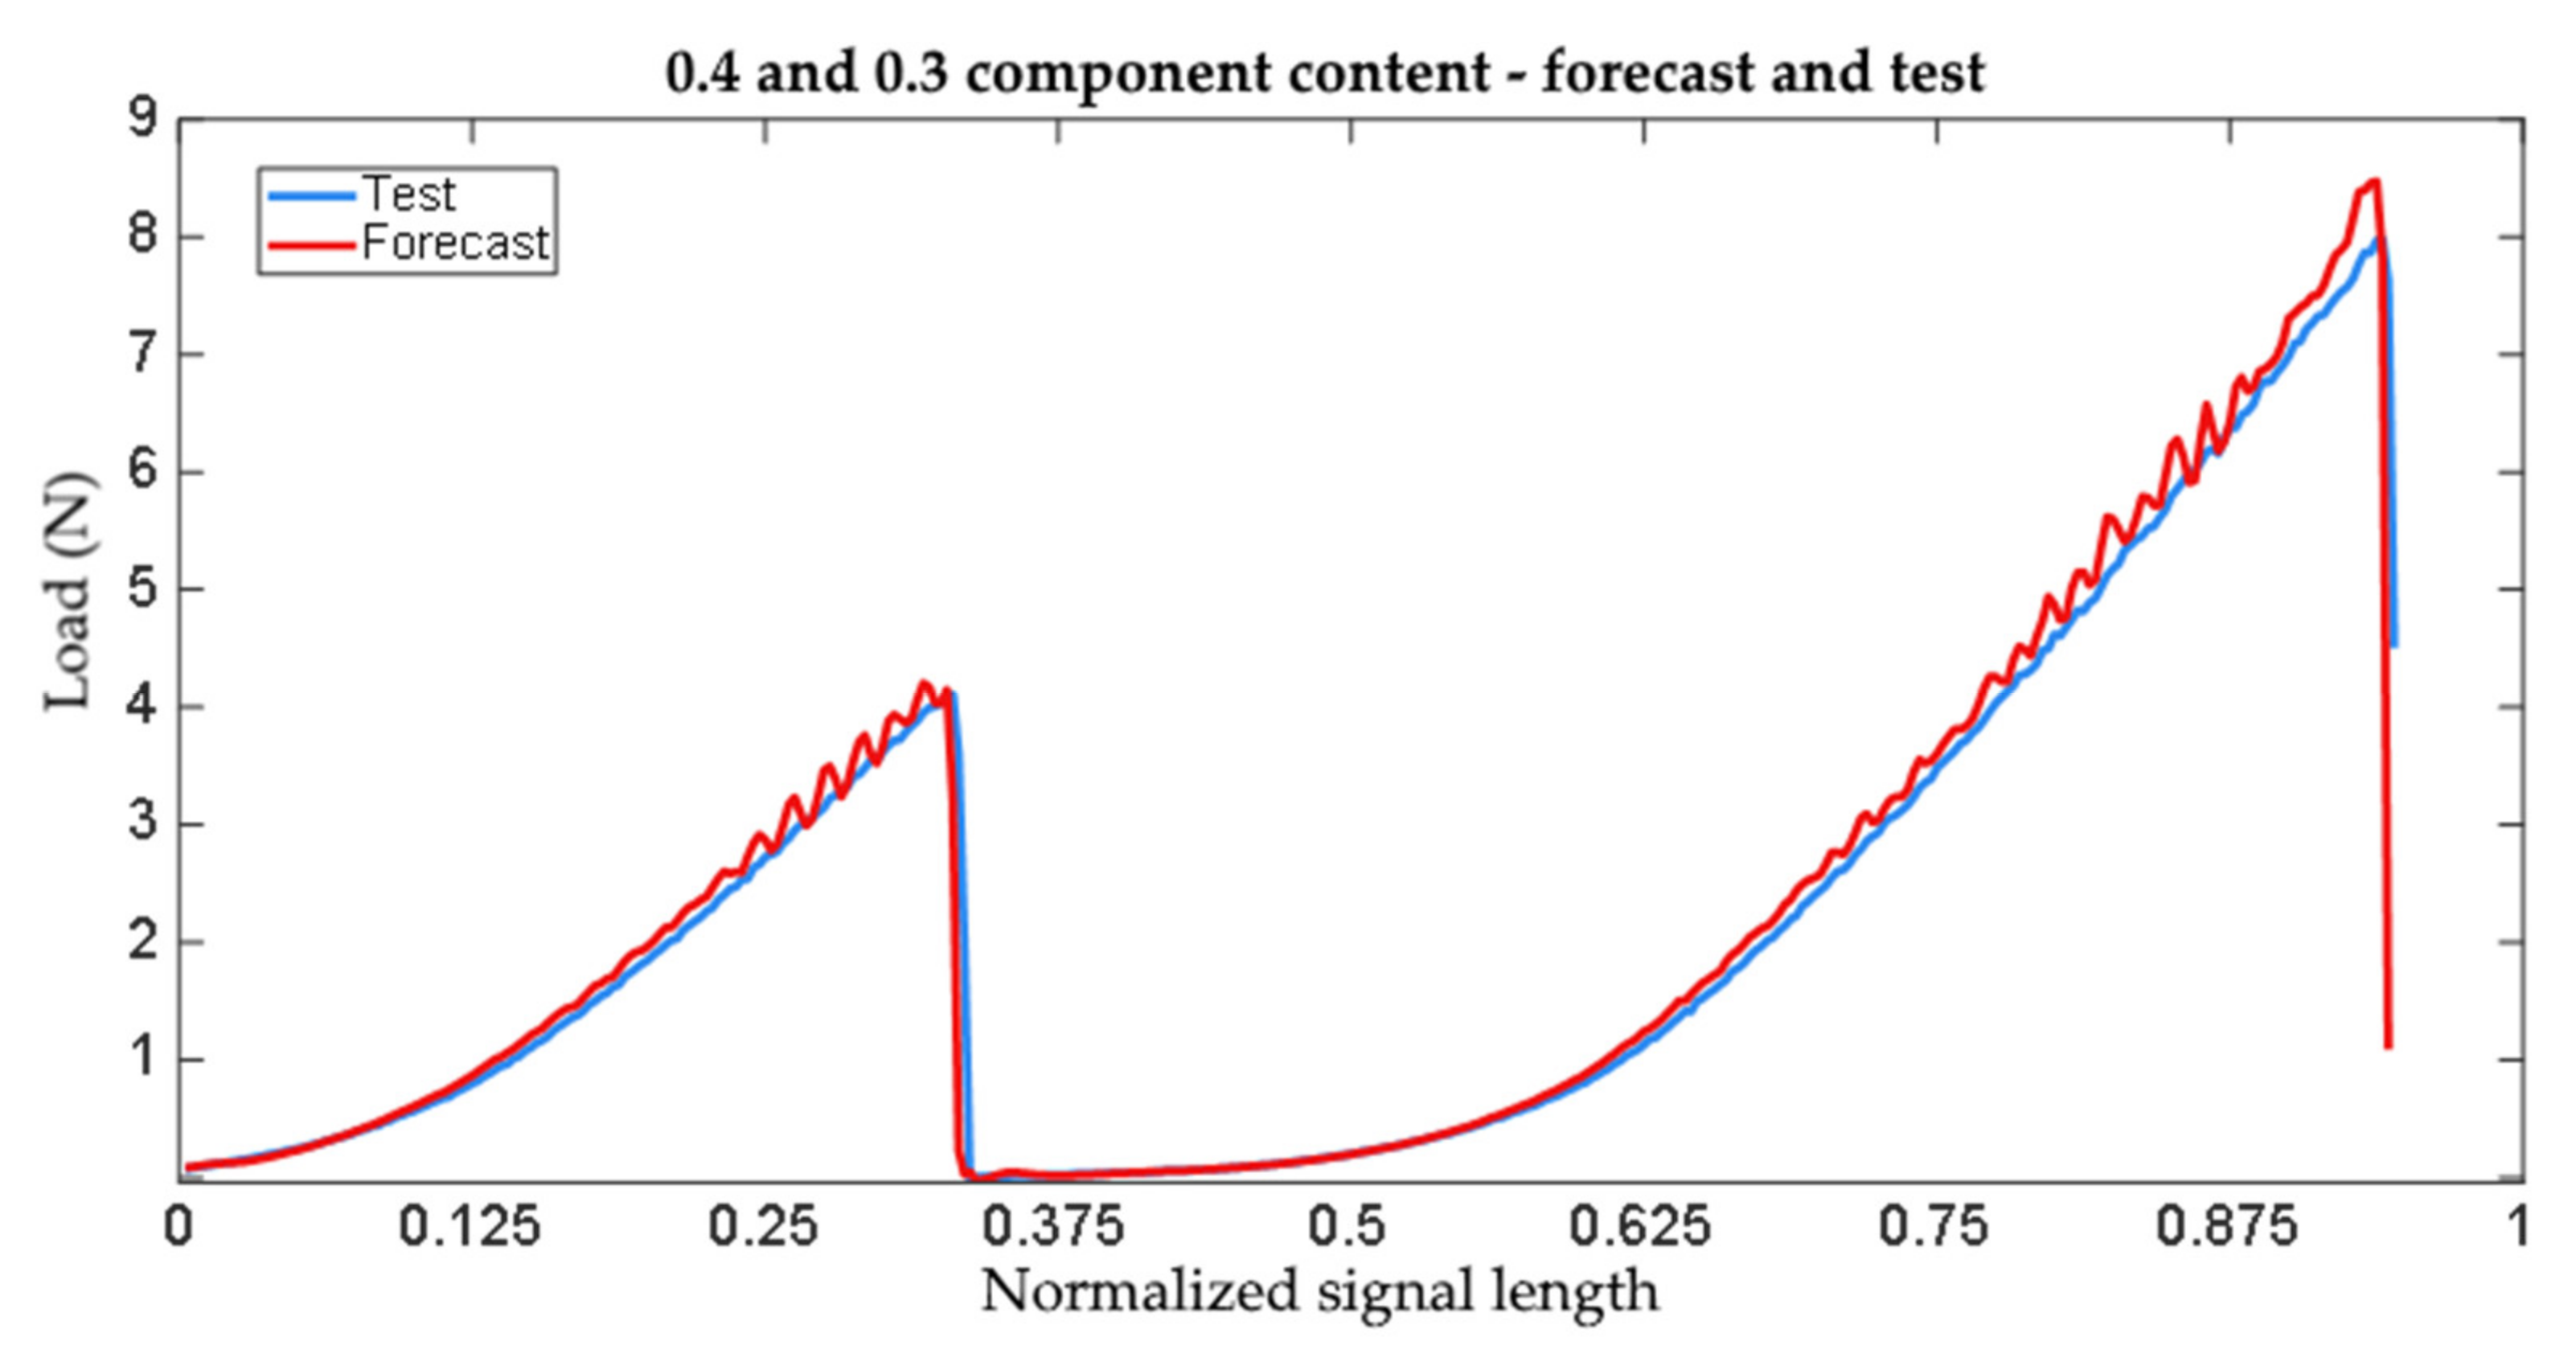
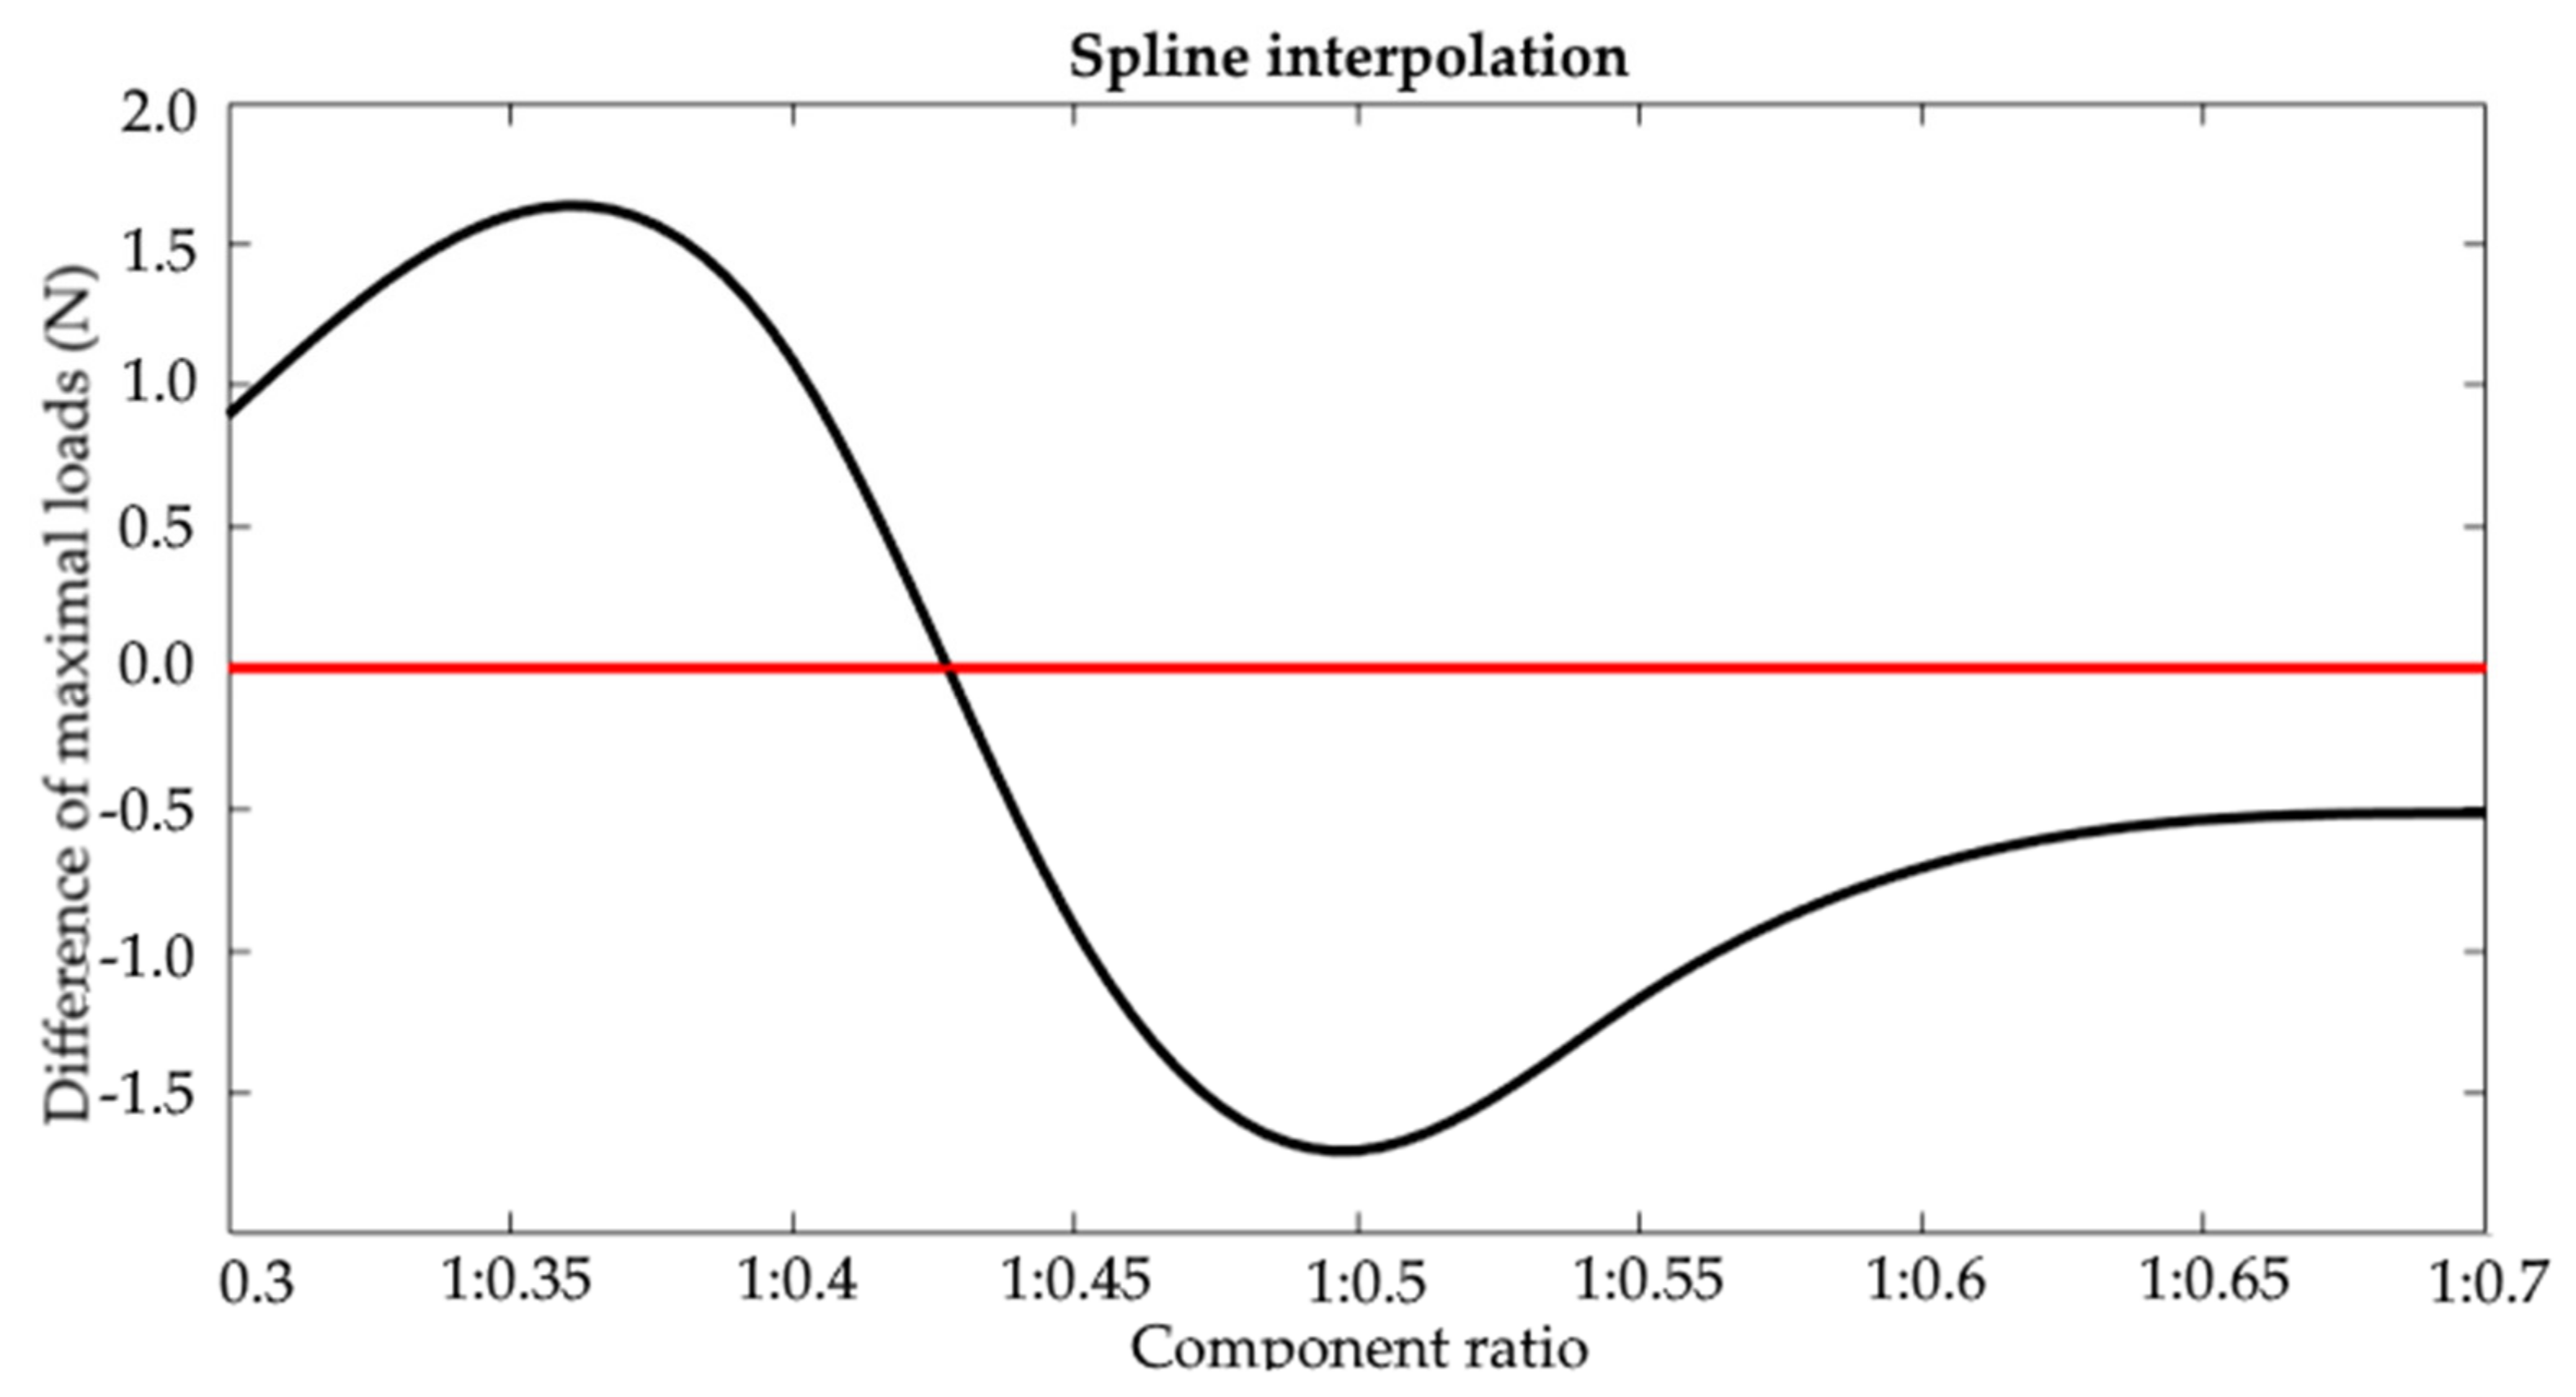
3.2. LSTM Forecast Adhesive Joint Strength Values at Elevated Temperature
4. Conclusions
Author Contributions
Funding
Data Availability Statement
Conflicts of Interest
References
- Doluk, E.; Rudawska, A.; Stančeková, D.; Mrázik, J. Influence of surface treatment on the strength of adhesive joints. Manuf. Technol. 2021, 21, 585–591. [Google Scholar] [CrossRef]
- Rudawska, A.; Miturska-Barańska, I.; Doluk, E. Influence of Surface Treatment on Steel Adhesive Joints Strength—Varnish Coats. Materials 2021, 14, 6938. [Google Scholar] [CrossRef]
- Miturska, I.; Rudawska, A.; Niedziałkowski, P.; Szabelski, J.; Grzesiczak, D. Selected Strength Aspects of Adhesive Lap Joints and Butt Welded Joints of Various Structural Materials. Adv. Sci. Technol. Res. J. 2018, 12, 135–141. [Google Scholar] [CrossRef]
- Szabelski, J. Effect of incorrect mix ratio on strength of two component adhesive Butt-Joints tested at elevated temperature. MATEC Web Conf. 2018, 244, 01019. [Google Scholar] [CrossRef] [Green Version]
- Adhesives and Adhesive Joints in Industry Applications; Rudawska, A. (Ed.) IntechOpen: London, UK, 2019; ISBN 978-1-78984-898-4. [Google Scholar]
- Da Silva, L.F.M.; Adams, R.D.; Sato, C.; Dilger, K. (Eds.) Industrial Applications of Adhesives: 1st International Conference on Industrial Applications of Adhesives; Lecture Notes in Mechanical Engineering; Springer: Singapore, 2021; ISBN 9789811567667. [Google Scholar]
- Petrie, E.M. Handbook of Adhesives and Sealants, 3rd ed.; McGraw-Hill: New York, NY, USA, 2021; ISBN 978-1-260-44044-7. [Google Scholar]
- Rudawska, A.; Sikora, J.; Müller, M.; Valášek, P. The effect of environmental ageing at lower and sub-zero temperatures on the adhesive joint strength. Int. J. Adhes. Adhes. 2020, 97, 102487. [Google Scholar] [CrossRef]
- Müller, M.; Valášek, P. Influence of Environment Temperature on Strength of Quick-Setting Adhesives Based on Cyanoacrylates. Adv. Mater. Res. 2014, 1030-1032, 272–275. [Google Scholar] [CrossRef]
- Özer, H. (Ed.) Applied Adhesive Bonding in Science and Technology; InTech: Rijeka, Croatia, 2018; ISBN 978-953-51-3839-6. [Google Scholar]
- Pizzi, A.; Mittal, K.L. Handbook of Adhesive Technology; CRC Press: Boca Raton, FL, USA, 2020; ISBN 978-0-367-57239-6. [Google Scholar]
- Kuczmaszewski, J. Fundamentals of Metal-Metal Adhesive Joint Design; Polish Academy of Sciences: Lublin, Poland, 2006; ISBN 978-83-89293-11-4. [Google Scholar]
- Shields, J. Adhesives Handbook; Elsevier: Amsterdam, The Netherlands, 2013; ISBN 1-4831-9227-X. [Google Scholar]
- Minty, R.F.; Yang, L.; Thomason, J. The influence of hardener-to-epoxy ratio on the interfacial strength in glass fibre reinforced epoxy composites. Compos. Part A Appl. Sci. Manuf. 2018, 112, 64–70. [Google Scholar] [CrossRef] [Green Version]
- Rudawska, A. Mechanical Properties of Epoxy Compounds Based on Bisphenol a Aged in Aqueous Environments. Polymers 2021, 13, 952. [Google Scholar] [CrossRef]
- Rudawska, A.; Frigione, M. Cold-Cured Bisphenolic Epoxy Adhesive Filled with Low Amounts of CaCO3: Effect of the Filler on the Durability to Aqueous Environments. Materials 2021, 14, 1324. [Google Scholar] [CrossRef] [PubMed]
- Packham, D.E. (Ed.) Handbook of Adhesion, 2nd ed.; John Wiley: Hoboken, NJ, USA, 2005; ISBN 978-0-471-80874-9. [Google Scholar]
- Rudawska, A.; Czarnota, M. Selected aspects of epoxy adhesive compositions curing process. J. Adhes. Sci. Technol. 2013, 27, 1933–1950. [Google Scholar] [CrossRef]
- Doyle, G.; Pethrick, R.A. Environmental effects on the ageing of epoxy adhesive joints. Int. J. Adhes. Adhes. 2009, 29, 77–90. [Google Scholar] [CrossRef]
- Shin, P.-S.; Wang, Z.-J.; Kwon, D.-J.; Choi, J.-Y.; Sung, I.; Jin, D.-S.; Kang, S.-W.; Kim, J.-C.; DeVries, K.L.; Park, J.-M. Optimum mixing ratio of epoxy for glass fiber reinforced composites with high thermal stability. Compos. Part B Eng. 2015, 79, 132–137. [Google Scholar] [CrossRef]
- Loctite Research, Development & Engineering, Technical Data Sheet: EA 9492 (Hysol). 2007. Available online: https://docs.rs-online.com/0399/0900766b812689d9.pdf (accessed on 17 November 2021).
- 3M Scotch-WeldTM Epoxy Adhesive 2216 B/A Technical Data 2018. Available online: https://multimedia.3m.com/mws/media/153955O/3mtm-scotch-weldtm-epoxy-adhesive-2216-b-a.pdf (accessed on 17 November 2021).
- Huntsman Araldite® 420 A/B Structural Adhesives Data Sheet 2012. Available online: https://samaro.fr/pdf/FT/Araldite_FT_420_AB_EN.pdf (accessed on 17 November 2021).
- Tsai, H.-Y.; Nakamura, Y.; Fujita, T.; Naito, M. Strengthening epoxy adhesives at elevated temperatures based on dynamic disulfide bonds. Mater. Adv. 2020, 1, 3182–3188. [Google Scholar] [CrossRef]
- Rozylo, P. Failure analysis of thin-walled composite structures using independent advanced damage models. Compos. Struct. 2021, 262, 113598. [Google Scholar] [CrossRef]
- Jonak, J.; Karpiński, R.; Wójcik, A. Influence of the Undercut Anchor Head Angle on the Propagation of the Failure Zone of the Rock Medium. Materials 2021, 14, 2371. [Google Scholar] [CrossRef] [PubMed]
- Jonak, J.; Karpiński, R.; Wójcik, A. Influence of the Undercut Anchor Head Angle on the Propagation of the Failure Zone of the Rock Medium—Part II. Materials 2021, 14, 3880. [Google Scholar] [CrossRef]
- Rozylo, P. Stability and failure of compressed thin-walled composite columns using experimental tests and advanced numerical damage models. Int. J. Numer. Methods Eng. 2021, 122, 5076–5099. [Google Scholar] [CrossRef]
- Falkowicz, K.; Debski, H. The post-critical behaviour of compressed plate with non-standard play orientation. Compos. Struct. 2020, 252, 112701. [Google Scholar] [CrossRef]
- Falkowicz, K.; Debski, H.; Wysmulski, P. Effect of extension-twisting and extension-bending coupling on a compressed plate with a cut-out. Compos. Struct. 2020, 238, 111941. [Google Scholar] [CrossRef]
- Cheng, A.H.-D.; Cheng, D.T. Heritage and early history of the boundary element method. Eng. Anal. Bound. Elements 2005, 29, 268–302. [Google Scholar] [CrossRef]
- Aliabadi, M.H. The Boundary Element Method, Volume 2: Applications in Solids and Structures; John Wiley & Sons: Hoboken, NJ, USA, 2002; Volume 2, ISBN 0-470-84298-9. [Google Scholar]
- Liu, Y.J.; Mukherjee, S.; Nishimura, N.; Schanz, M.; Ye, W.; Sutradhar, A.; Pan, E.; Dumont, N.A.; Frangi, A.; Saez, A. Recent Advances and Emerging Applications of the Boundary Element Method. Appl. Mech. Rev. 2011, 64, 030802. [Google Scholar] [CrossRef] [Green Version]
- Liu, Y. Fast Multipole Boundary Element Method: Theory and Applications in Engineering; Cambridge University Press: Cambridge, UK, 2009; ISBN 0-521-11659-7. [Google Scholar]
- Machrowska, A.; Karpiński, R.; Jonak, J.; Szabelski, J.; Krakowski, p. Numerical prediction of the component-ratio-dependent compressive strength of bone cement. Appl. Comput. Science 2020, 16, 88–101. [Google Scholar]
- Machrowska, A.; Szabelski, J.; Karpiński, R.; Krakowski, P.; Jonak, J.; Jonak, K. Use of Deep Learning Networks and Statistical Modeling to Predict Changes in Mechanical Parameters of Contaminated Bone Cements. Materials 2020, 13, 5419. [Google Scholar] [CrossRef]
- Rogala, M.K. Neural Networks in Crashworthiness Analysis of Thin-Walled Profile with Foam Filling. Adv. Sci. Technol. Res. J. 2020, 14, 93–99. [Google Scholar] [CrossRef]
- Rogala, M.; Gajewski, J.; Górecki, M. Study on the Effect of Geometrical Parameters of a Hexagonal Trigger on Energy Absorber Performance Using ANN. Materials 2021, 14, 5981. [Google Scholar] [CrossRef] [PubMed]
- Rogala, M.; Gajewski, J. Numerical analysis of porous materials subjected to oblique crushing force. J. Physics Conf. Ser. 2021, 1736, 012025. [Google Scholar] [CrossRef]
- Tucki, K.; Mruk, R.; Orynycz, O.; Botwińska, K.; Gola, A.; Bączyk, A. Toxicity of Exhaust Fumes (CO, NOx) of the Compression-Ignition (Diesel) Engine with the Use of Simulation. Sustainability 2019, 11, 2188. [Google Scholar] [CrossRef] [Green Version]
- Świć, A.; Wołos, D.; Gola, A.; Kłosowski, G. The Use of Neural Networks and Genetic Algorithms to Control Low Rigidity Shafts Machining. Sensors 2020, 20, 4683. [Google Scholar] [CrossRef]
- Sobaszek, Ł.; Gola, A.; Kozłowski, E. Prediction of variable technological operation times in production jobs scheduling. IFAC-PapersOnLine 2019, 52, 1301–1306. [Google Scholar] [CrossRef]
- Ciesla, B. Practical Application Of Fuzzy Logic In Production Control Systems Of Engineer To Order Smes. ACS 2021, 17, 17–25. [Google Scholar]
- Jonak, J.; Karpiński, R.; Siegmund, M.; Machrowska, A.; Prostański, D. Experimental Verification of Standard Recommendations for Estimating the Load-Carrying Capacity of Undercut Anchors in Rock Material. Adv. Sci. Technol. Res. J. 2021, 15, 230–244. [Google Scholar] [CrossRef]
- Świć, A.; Gola, A.; Sobaszek, Ł.; Orynycz, O. Control of Machining of Axisymmetric Low-Rigidity Parts. Materials 2020, 13, 5053. [Google Scholar] [CrossRef] [PubMed]
- Anggoro, P.; Purharyono, Y.; Anthony, A.A.; Tauviqirrahman, M.; Bayuseno, A. Jamari Optimisation of cutting parameters of new material orthotic insole using a Taguchi and response surface methodology approach. Alex. Eng. J. 2021, 61, 3613–3632. [Google Scholar] [CrossRef]
- Babu, K.A.; Jeyapaul, R. An Investigation into the Wear Behaviour of a Hybrid Metal Matrix Composite Under Dry Sliding Conditions Using Taguchi and ANOVA Methods. J. Bio-Tribo-Corros. 2021, 8, 1–12. [Google Scholar] [CrossRef]
- Esmaeili, J.; Andalibi, K.; Gencel, O. Mechanical characteristics of experimental multi-scale steel fiber reinforced polymer concrete and optimization by Taguchi methods. Constr. Build. Mater. 2021, 313, 125500. [Google Scholar] [CrossRef]
- Aydar, A.Y. Utilization of Response Surface Methodology in Optimization of Extraction of Plant Materials. In Statistical Approaches With Emphasis on Design of Experiments Applied to Chemical Processes; IntechOpen: London, UK, 2018. [Google Scholar] [CrossRef] [Green Version]
- Ashrafi, M.; Hamadanian, M.; Ghasemi, A.R. Epoxy/Polyethylene Glycol/TiO2: Design, Fabrication and Investigation of Mechanical Properties, Thermal Cycling Fatigue and Antibacterial Activity. J. Polym. Environ. 2021, 29, 3867–3877. [Google Scholar] [CrossRef]
- Dean, A.; Voss, D.; Draguljić, D. Response Surface Methodology. In Design and Analysis of Experiments; Springer Texts in Statistics; Springer International Publishing: New York, NY, USA, ; Cham, Switzerland, 2017; pp. 565–614. ISBN 978-3-319-52248-7. [Google Scholar]
- Alman, D.H.; Ningfang, L. Overtraining in back-propagation neural networks: A CRT color calibration example. Color Res. Appl. 2002, 27, 122–125. [Google Scholar] [CrossRef]
- Sjöberg, J.; Ljung, L. Overtraining, regularization and searching for a minimum, with application to neural networks. Int. J. Control 1995, 62, 1391–1407. [Google Scholar] [CrossRef] [Green Version]
- DiPietro, R.; Hager, G.D. Deep learning: RNNs and LSTM. In Handbook of Medical Image Computing and Computer Assisted Intervention; Elsevier BV: Amsterdam, The Netherlands, 2020; pp. 503–519. [Google Scholar]
- Hochreiter, S.; Schmidhuber, J. LSTM Can Solve Hard Long Time Lag Problems. Adv. Neural Inf. Process. Syst. 1997, 473–479. [Google Scholar]
- Goodfellow, I.; Bengio, Y.; Courville, A. Deep Learning; MIT Press: Cambridge, MA, USA, 2016; ISBN 0-262-33737-1. [Google Scholar]
- Loctite Research, Development & Engineering, Technical Data Sheet: LOCTITE® SF 7063TM. 2013. Available online: https://www.techsil.co.uk/media/pdf/TDS/HECL50002-tds.pdf (accessed on 17 November 2021).
- PN-EN 15870:2009E; Adhesives. Determination of Tensile Strength of Butt Joints. Polish Committee for Standardization: Warszawa, Poland, 2009.
- PN-EN ISO 10365:1998; Adhesives—Designation of Main Failure Patterns. Polish Committee for Standardization: Warszawa, Poland, 1998.
- Karpiński, R.; Szabelski, J.; Maksymiuk, J. Seasoning Polymethyl Methacrylate (PMMA) Bone Cements with Incorrect Mix Ratio. Materials 2019, 12, 3073. [Google Scholar] [CrossRef] [Green Version]
- Szabelski, J.F.; Domińczuk, J.; Kuczmaszewski, J.; Lubelska, P. Ciepla Na Właściwości Połączeń Klejowych Wpływ, Wydawnictwo; Wydawnictwo Politechniki Lubelskiej: Lublin, Poland, 2019; ISBN 978-83-7947-383-0. [Google Scholar]
- Meyer, F.; Sanz, G.; Eceiza, A.; Mondragon, I.; Mijović, J. The effect of stoichiometry and thermal history during cure on structure and properties of epoxy networks. Polymer 1995, 36, 1407–1414. [Google Scholar] [CrossRef]
- Poynton, G. Multi-Component Epoxy Resin Formulation for High Temperature Applications; The University of Manchester: Manchester, UK, 2014; ISBN 1-07-390326-5. [Google Scholar]
- Boye, J.; Martinez, J.; Demont, P.; Lacabanne, C. Molecular mobility associated with the Tg in DGEBAn-DDM networks. Thermochim. Acta 1991, 192, 147–154. [Google Scholar] [CrossRef]
- Guerrero, P.; De la Caba, K.; Valea, A.; Corcuera, M.; Mondragon, I. Influence of cure schedule and stoichiometry on the dynamic mechanical behaviour of tetrafunctional epoxy resins cured with anhydrides. Polymer 1996, 37, 2195–2200. [Google Scholar] [CrossRef]
- ISO 11357-1:2016; Plastics—Differential Scanning Calorimetry (DSC)—Part 1: General Principles. Beuth Verlag: Berlin,Germany, 2016.
- ISO 11357-2:2020; Plastics—Differential Scanning Calorimetry (DSC)—Part 2: Determination of Glass Transition Temperature and Step Height. ISO Copyright Office: Geneva, Switzerland, 2020.


| Adhesive Component A/B Mix Ratio (Resin/Hardener) | Curing Conditions | Test Temperature | ||
|---|---|---|---|---|
| 1.4:1/1:0.71 | x | 3 days/25 °C | x | 25 °C |
| 1.8:1/1:0.55 | ||||
| 2.0:1/1:0.50(manufacturer-specified “m”) | ||||
| 2.2:1/1:0.45 | 1 h/100 °C | 70 °C | ||
| 2.6:1/1:0.40 | ||||
| 3.0:1/1:0.33 |
| CF | AF + CF | ACFP | AF |
|---|---|---|---|
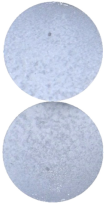 | 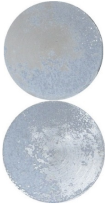 | 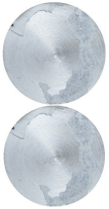 | 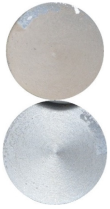 |
| A/B Mix Ratio (Resin/Hardener) | Cured 3 Days at 25 °C | Cured 1 h at 100 °C | ||
|---|---|---|---|---|
| Mean Tensile Strength (MPa) | Failure Mode | Mean Tensile Strength (MPa) | Failure Mode | |
| −50% 1:0.3 | 35.80 | CF | 40.56 | CF |
| −30% 1:0.4 | 34.48 | CF | 41.12 | CF |
| −10% 1:0.45 | 35.68 | CF | 41.15 | CF |
| m: 1:0.5 | 35.51 | CF | 39.90 | CF |
| +10% 1:0.55 | 34.70 | CF | 37.62 | 78% AF + CF, 22% CF |
| +30% 1:0.7 | 25.26 | 89% AF + CF, 11% CF | 27.40 | AF + CF |
| A/B Mix Ratio (Resin/Hardener) | Cured 3 Days at 25 °C | Cured 1 h at 100 °C | ||
|---|---|---|---|---|
| Mean Tensile Strength (MPa) | Failure Mode | Mean Tensile Strength (MPa) | Failure Mode | |
| −50% 1:0.3 | 23.19 | CF | 25.67 | CF |
| −30% 1:0.4 | 22.72 | AF + CF | 24.44 | AF + CF |
| −10% 1:0.45 | 22.67 | 78% CF, 22% AF + CF | 20.71 | AF + CF |
| m: 1:0.5 | 20.57 | 56% AF + CF, 44% CF | 16.73 | 78% AF + CF, 22% AF |
| +10% 1:0.55 | 13.88 | AF + CF | 10.58 | 56% AF + CF, 44% AF |
| +30% 1:0.7 | 6.38 | ACFP | 5.23 | AF |
| # | Test | Cubic Spline Forecast | Error (%) | Least-Squares Forecast | Error (%) |
|---|---|---|---|---|---|
| 1 | 0.424 | 0.352 | 16.98 | 0.353 | 16.75 |
| 2 | 0.392 | 0.400 | 2.04 | 0.398 | 1.53 |
| 3 | 0.465 | 0.465 | 0.00 | 0.465 | 0.00 |
| 4 | 0.438 | 0.437 | 0.23 | 0.437 | 0.23 |
| 5 | 0.431 | 0.432 | 0.23 | 0.432 | 0.23 |
| 6 | 0.417 | 0.416 | 0.23 | 0.417 | 0.00 |
| 7 | 0.475 | 0.476 | 0.23 | 0.476 | 0.23 |
| 8 | 0.418 | 0.417 | 0.23 | 0.418 | 0.00 |
Publisher’s Note: MDPI stays neutral with regard to jurisdictional claims in published maps and institutional affiliations. |
© 2022 by the authors. Licensee MDPI, Basel, Switzerland. This article is an open access article distributed under the terms and conditions of the Creative Commons Attribution (CC BY) license (https://creativecommons.org/licenses/by/4.0/).
Share and Cite
Szabelski, J.; Karpiński, R.; Machrowska, A. Application of an Artificial Neural Network in the Modelling of Heat Curing Effects on the Strength of Adhesive Joints at Elevated Temperature with Imprecise Adhesive Mix Ratios. Materials 2022, 15, 721. https://doi.org/10.3390/ma15030721
Szabelski J, Karpiński R, Machrowska A. Application of an Artificial Neural Network in the Modelling of Heat Curing Effects on the Strength of Adhesive Joints at Elevated Temperature with Imprecise Adhesive Mix Ratios. Materials. 2022; 15(3):721. https://doi.org/10.3390/ma15030721
Chicago/Turabian StyleSzabelski, Jakub, Robert Karpiński, and Anna Machrowska. 2022. "Application of an Artificial Neural Network in the Modelling of Heat Curing Effects on the Strength of Adhesive Joints at Elevated Temperature with Imprecise Adhesive Mix Ratios" Materials 15, no. 3: 721. https://doi.org/10.3390/ma15030721