
Investigation of the Effect of Temperature on the Wear Rate and Airborne Noise in Sliding Wear


Abstract
:1. Introduction
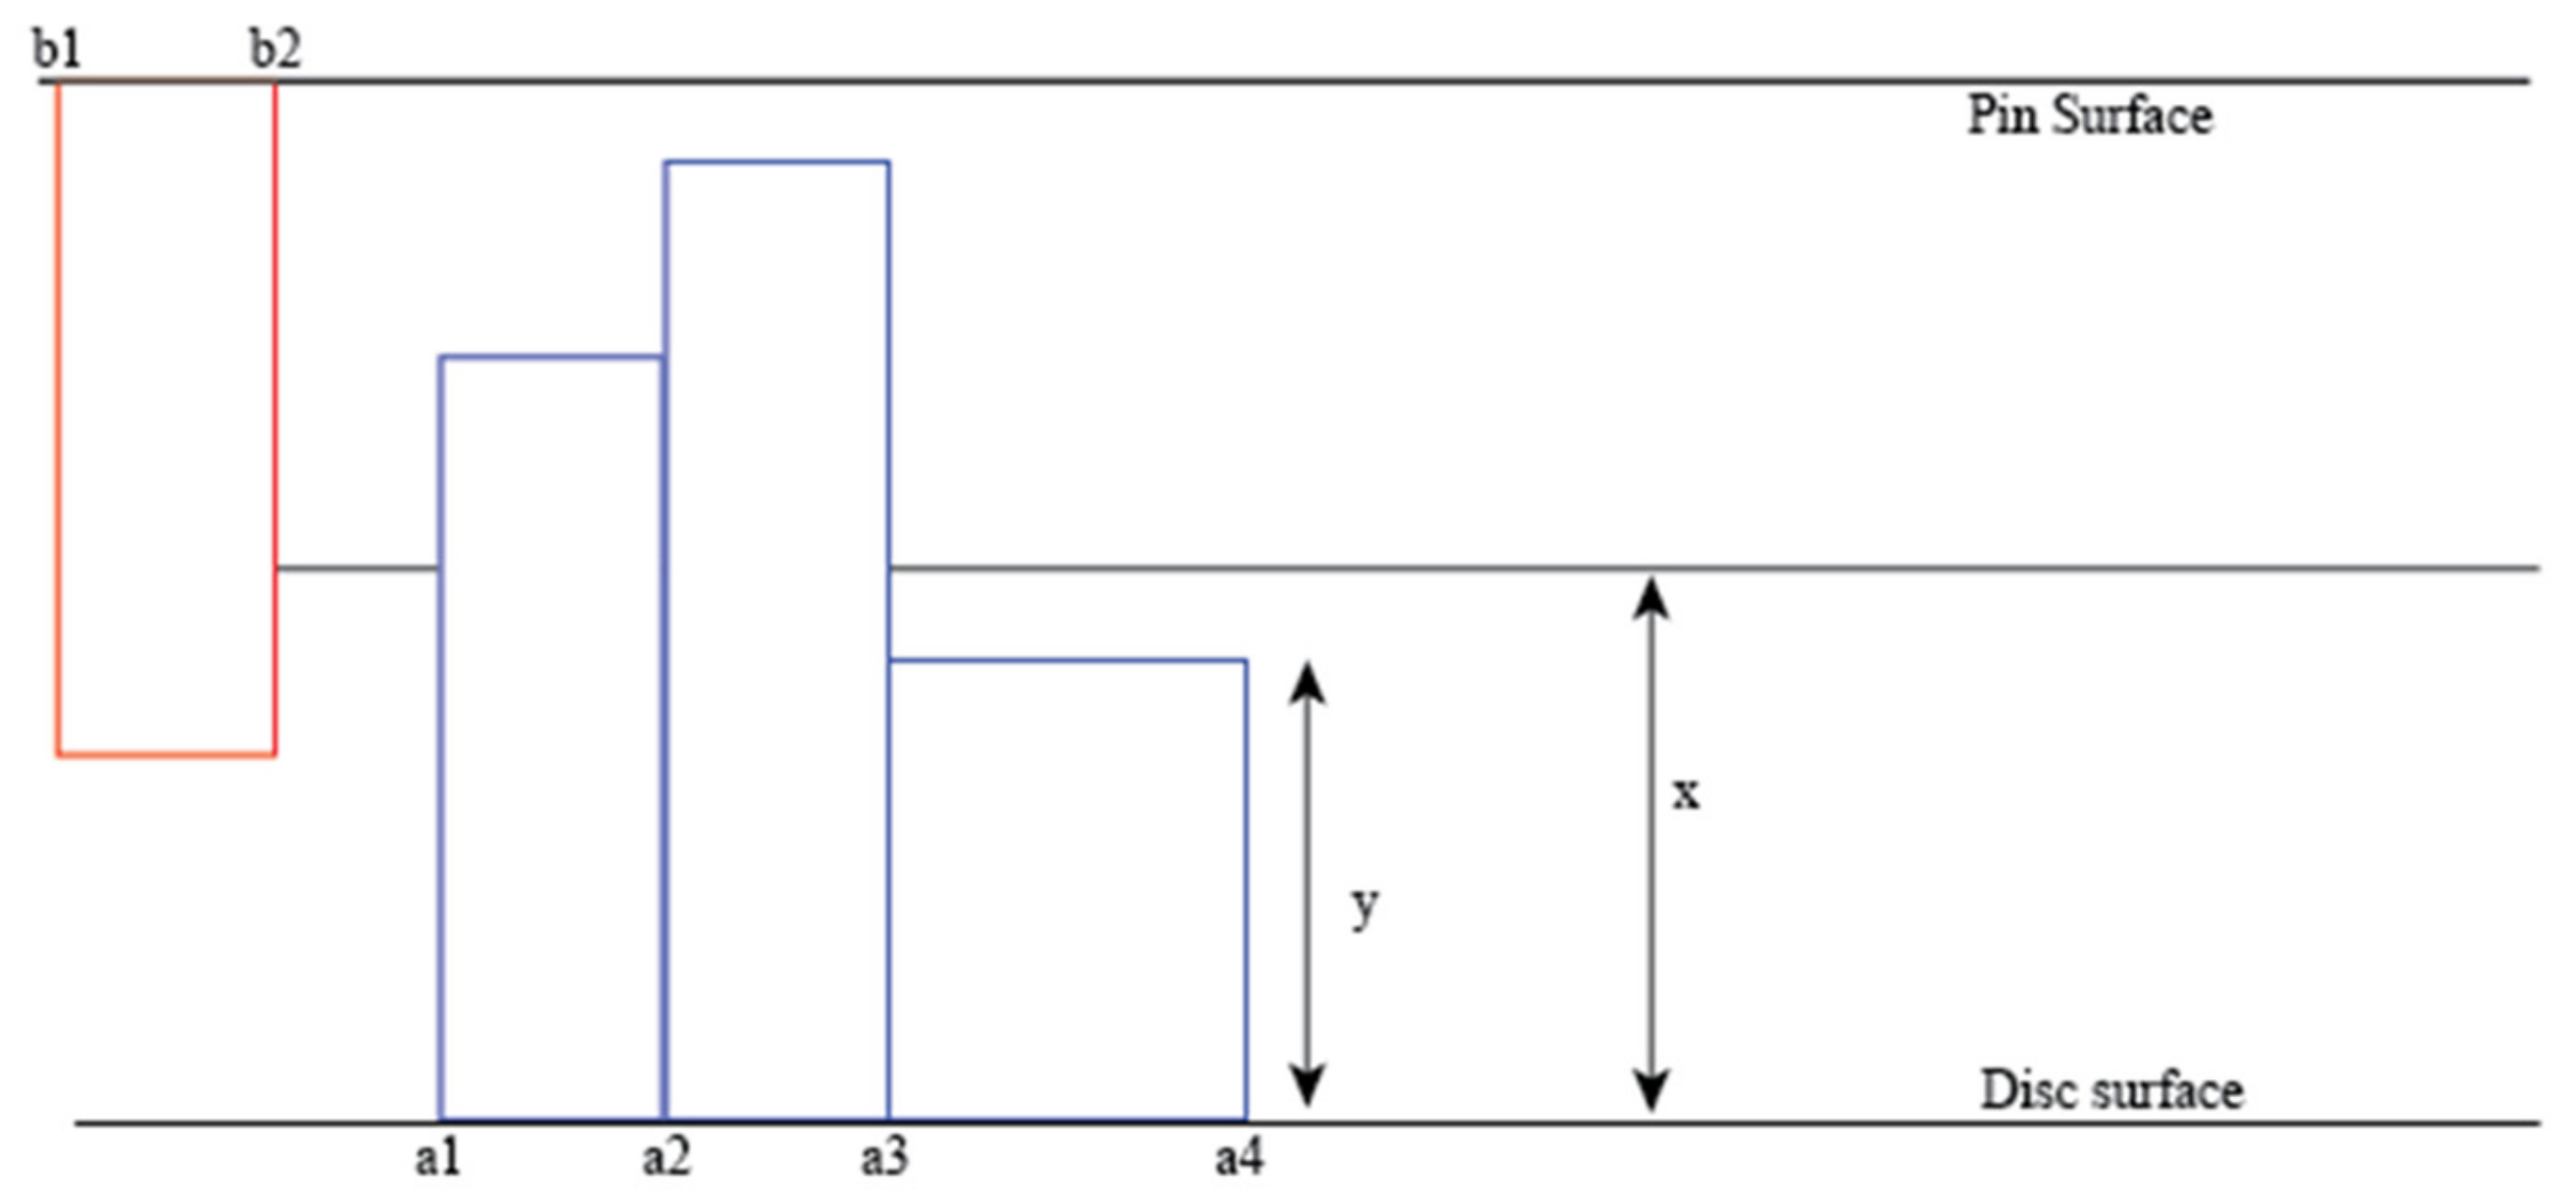
2. Theory
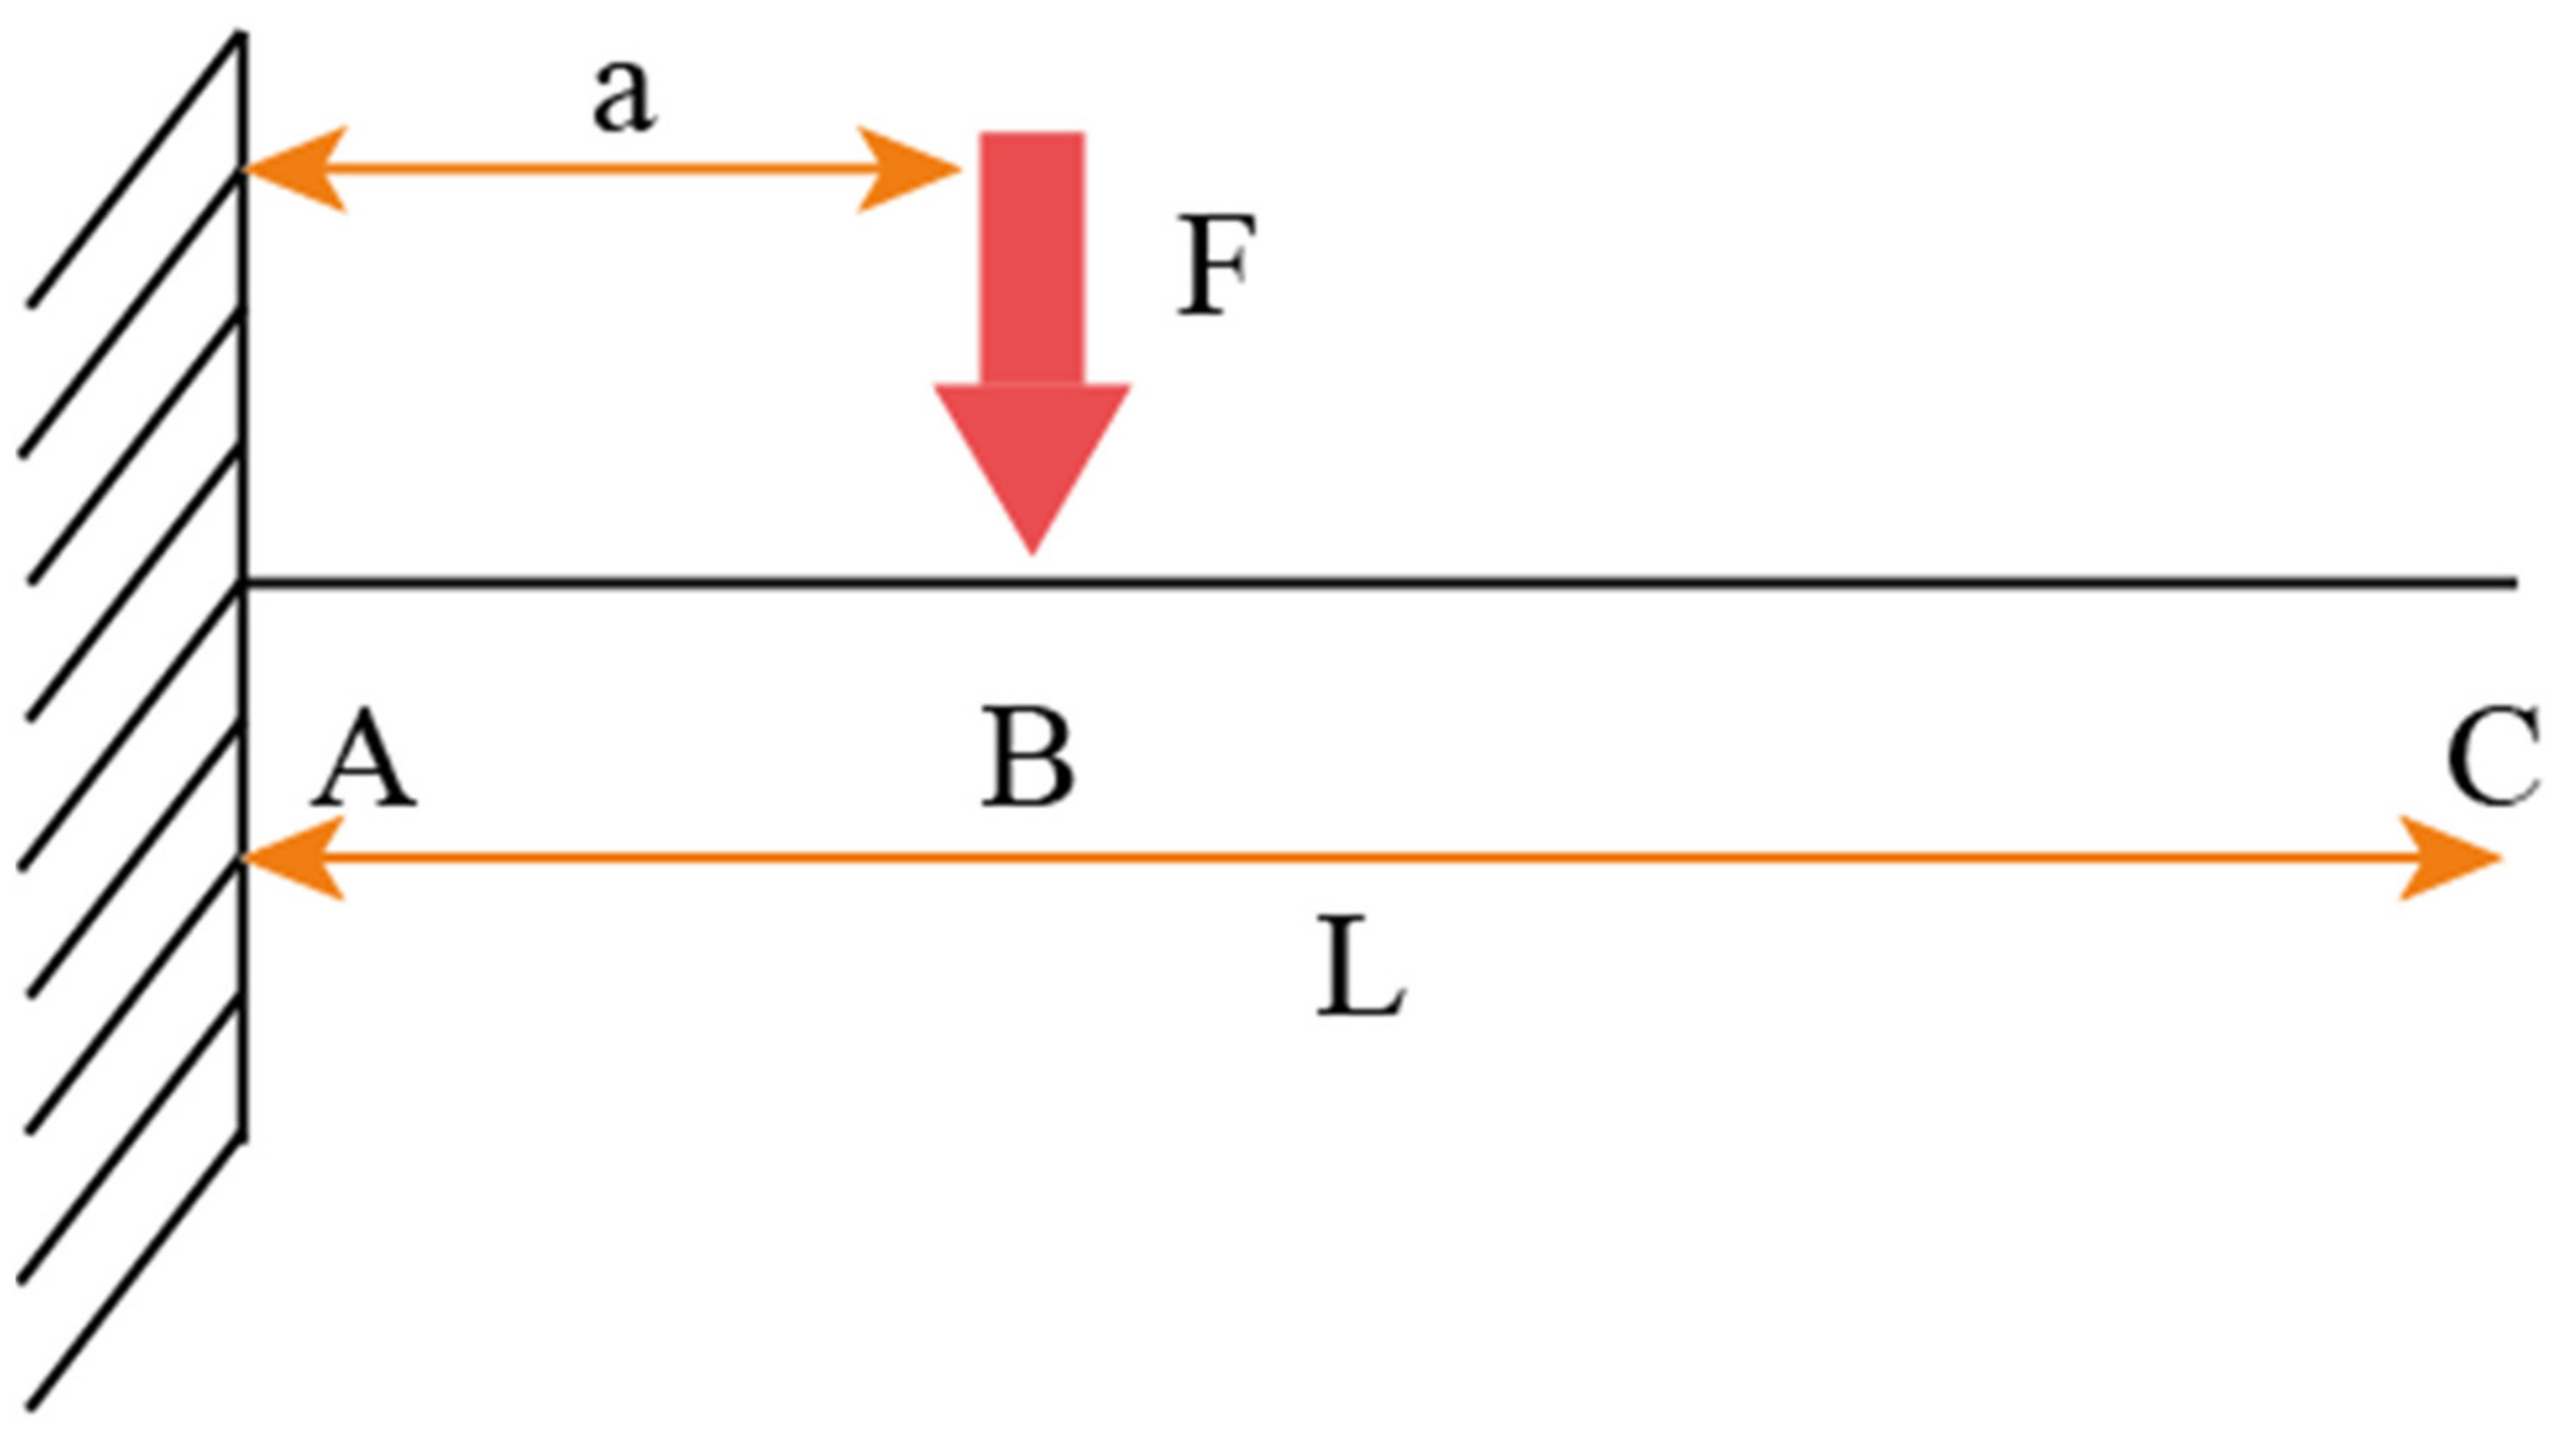
- The asperities are considered to behave as macroscopic cantilever beams.
- Asperities act independently of one another. This means that each asperity struck does not influence what happens to the next asperity.
- Macroscopic material properties are observed. This is because the asperities are on a mesoscopic scale and so macroscopic behaviour is a reasonable approximation to make.
- The asperities do not undergo elastoplastic deformation. This is because elastoplastic behaviour does not contribute significantly to the wear or the noise.
- Only one asperity was modelled on the pin.
- The disc is not modelled as a continuous counter-profile.
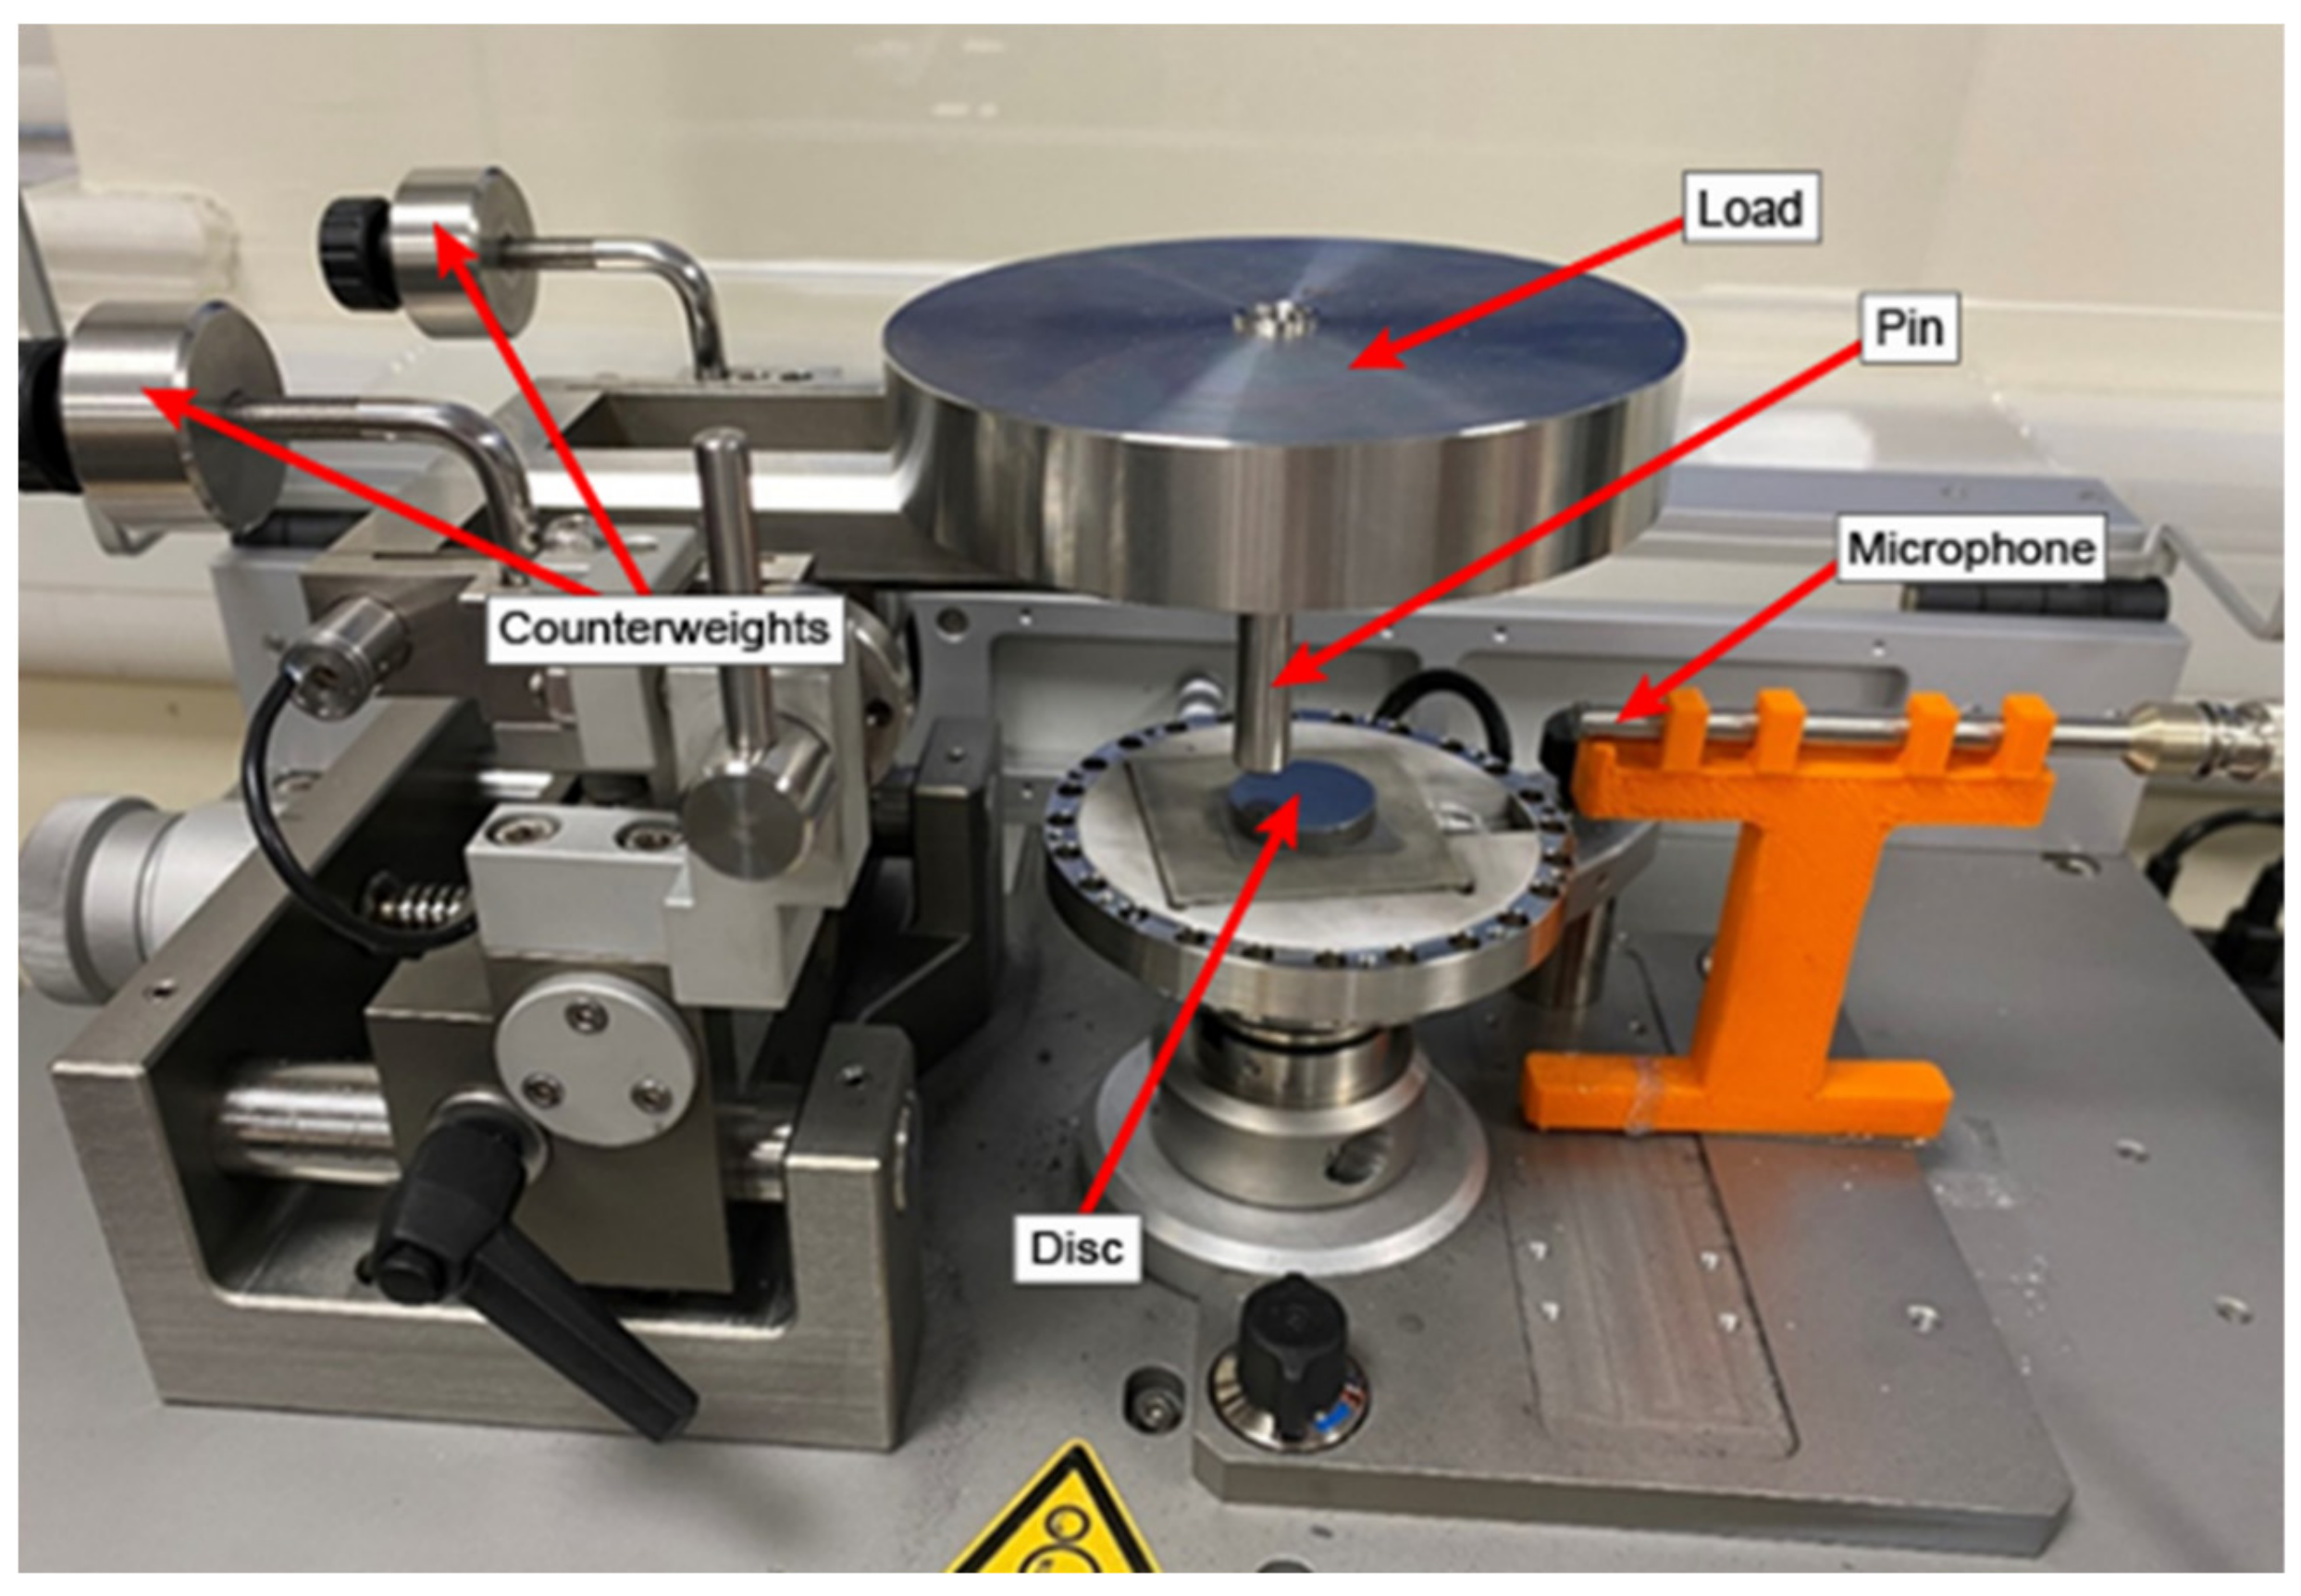
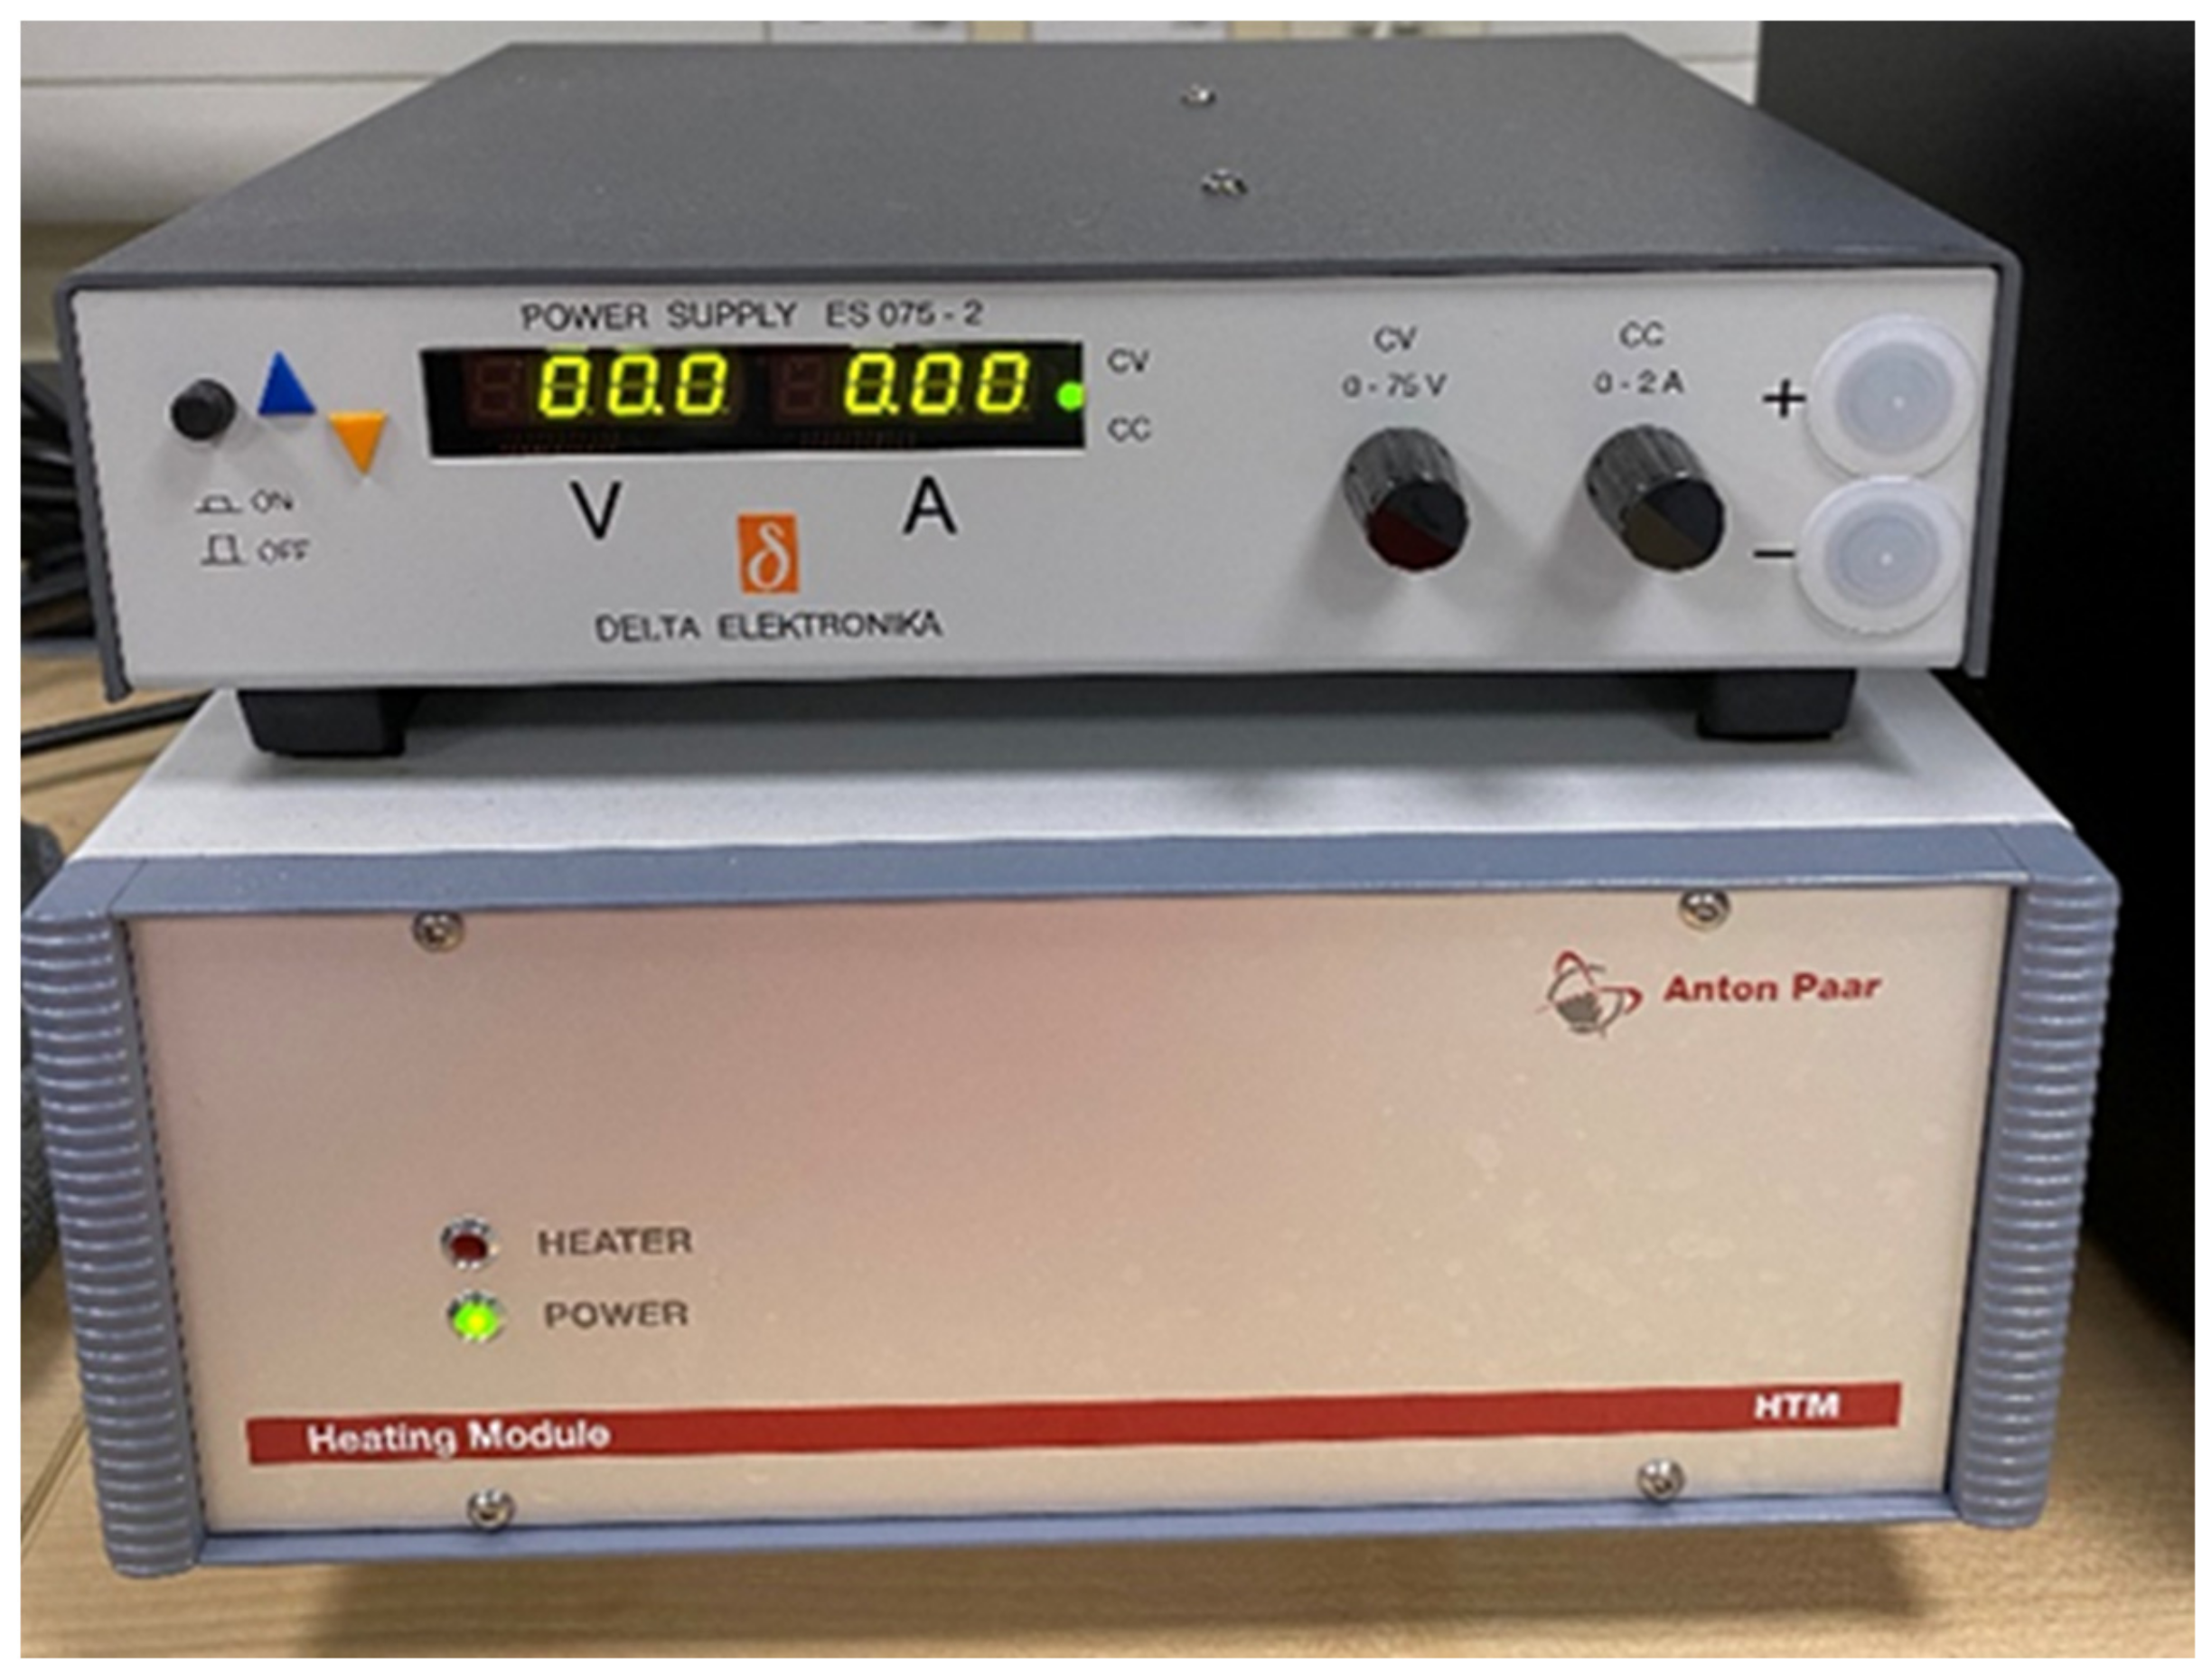
3. Methodology
4. Results
5. Discussion
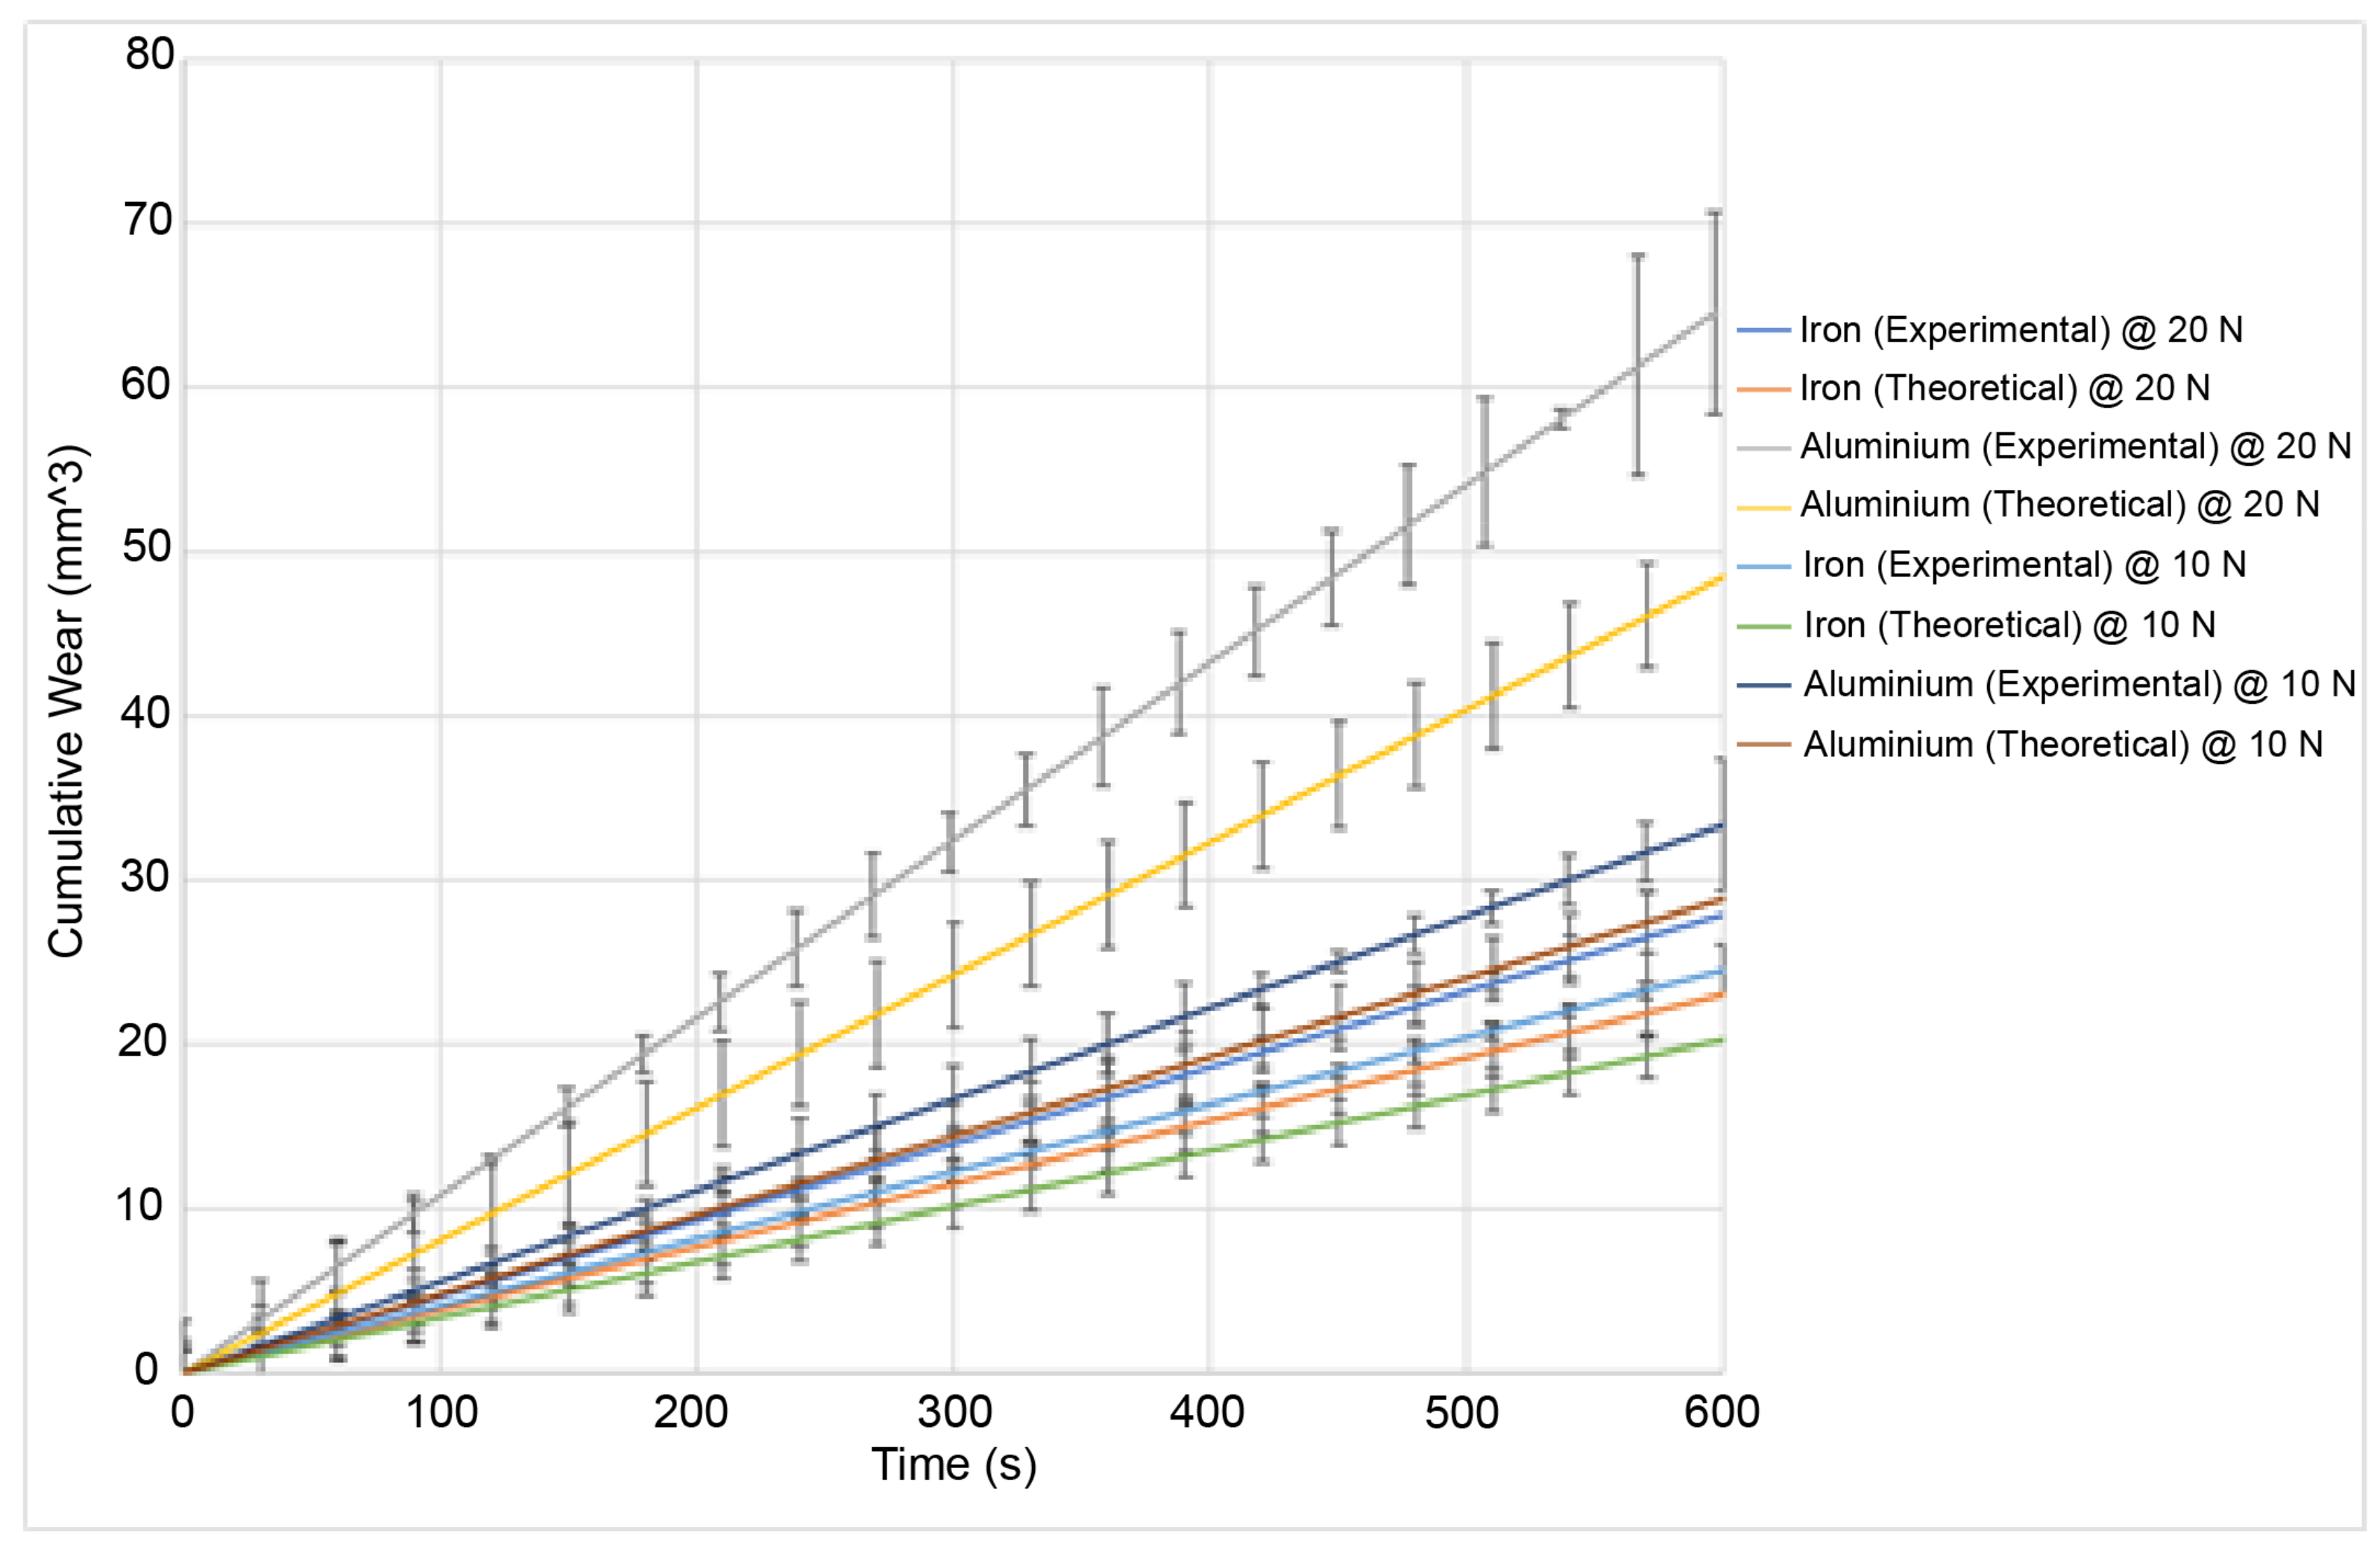
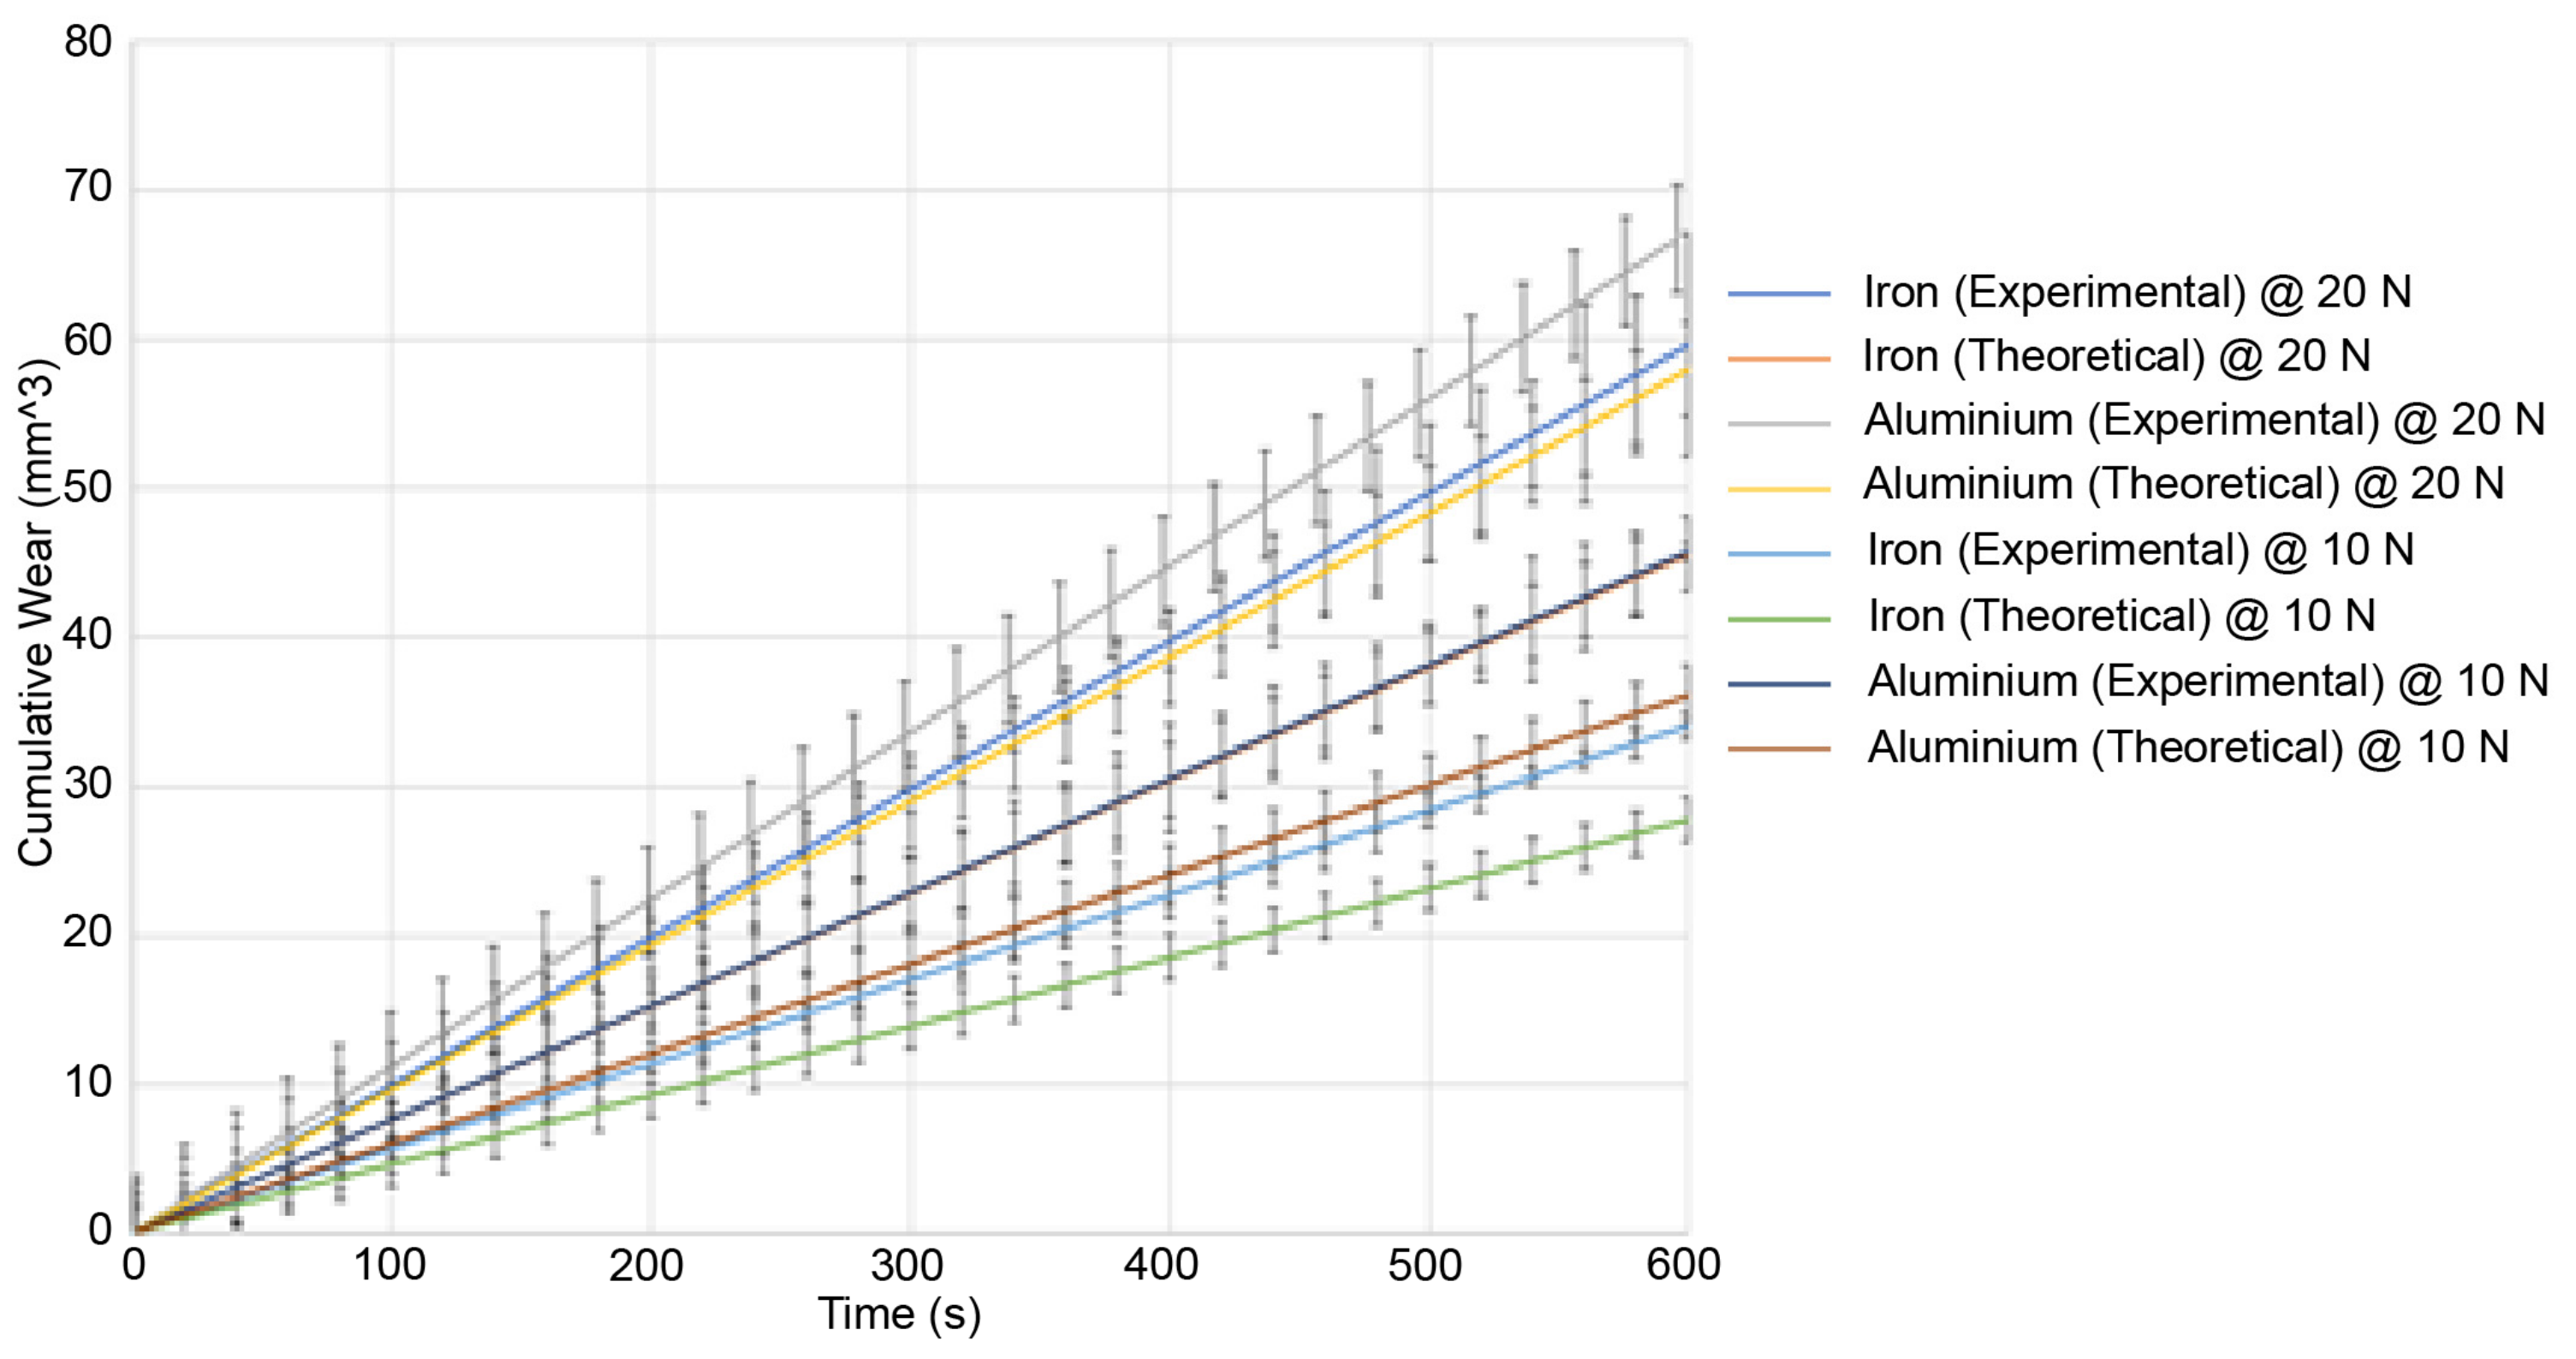
5.1. Predicted and Observed Wear
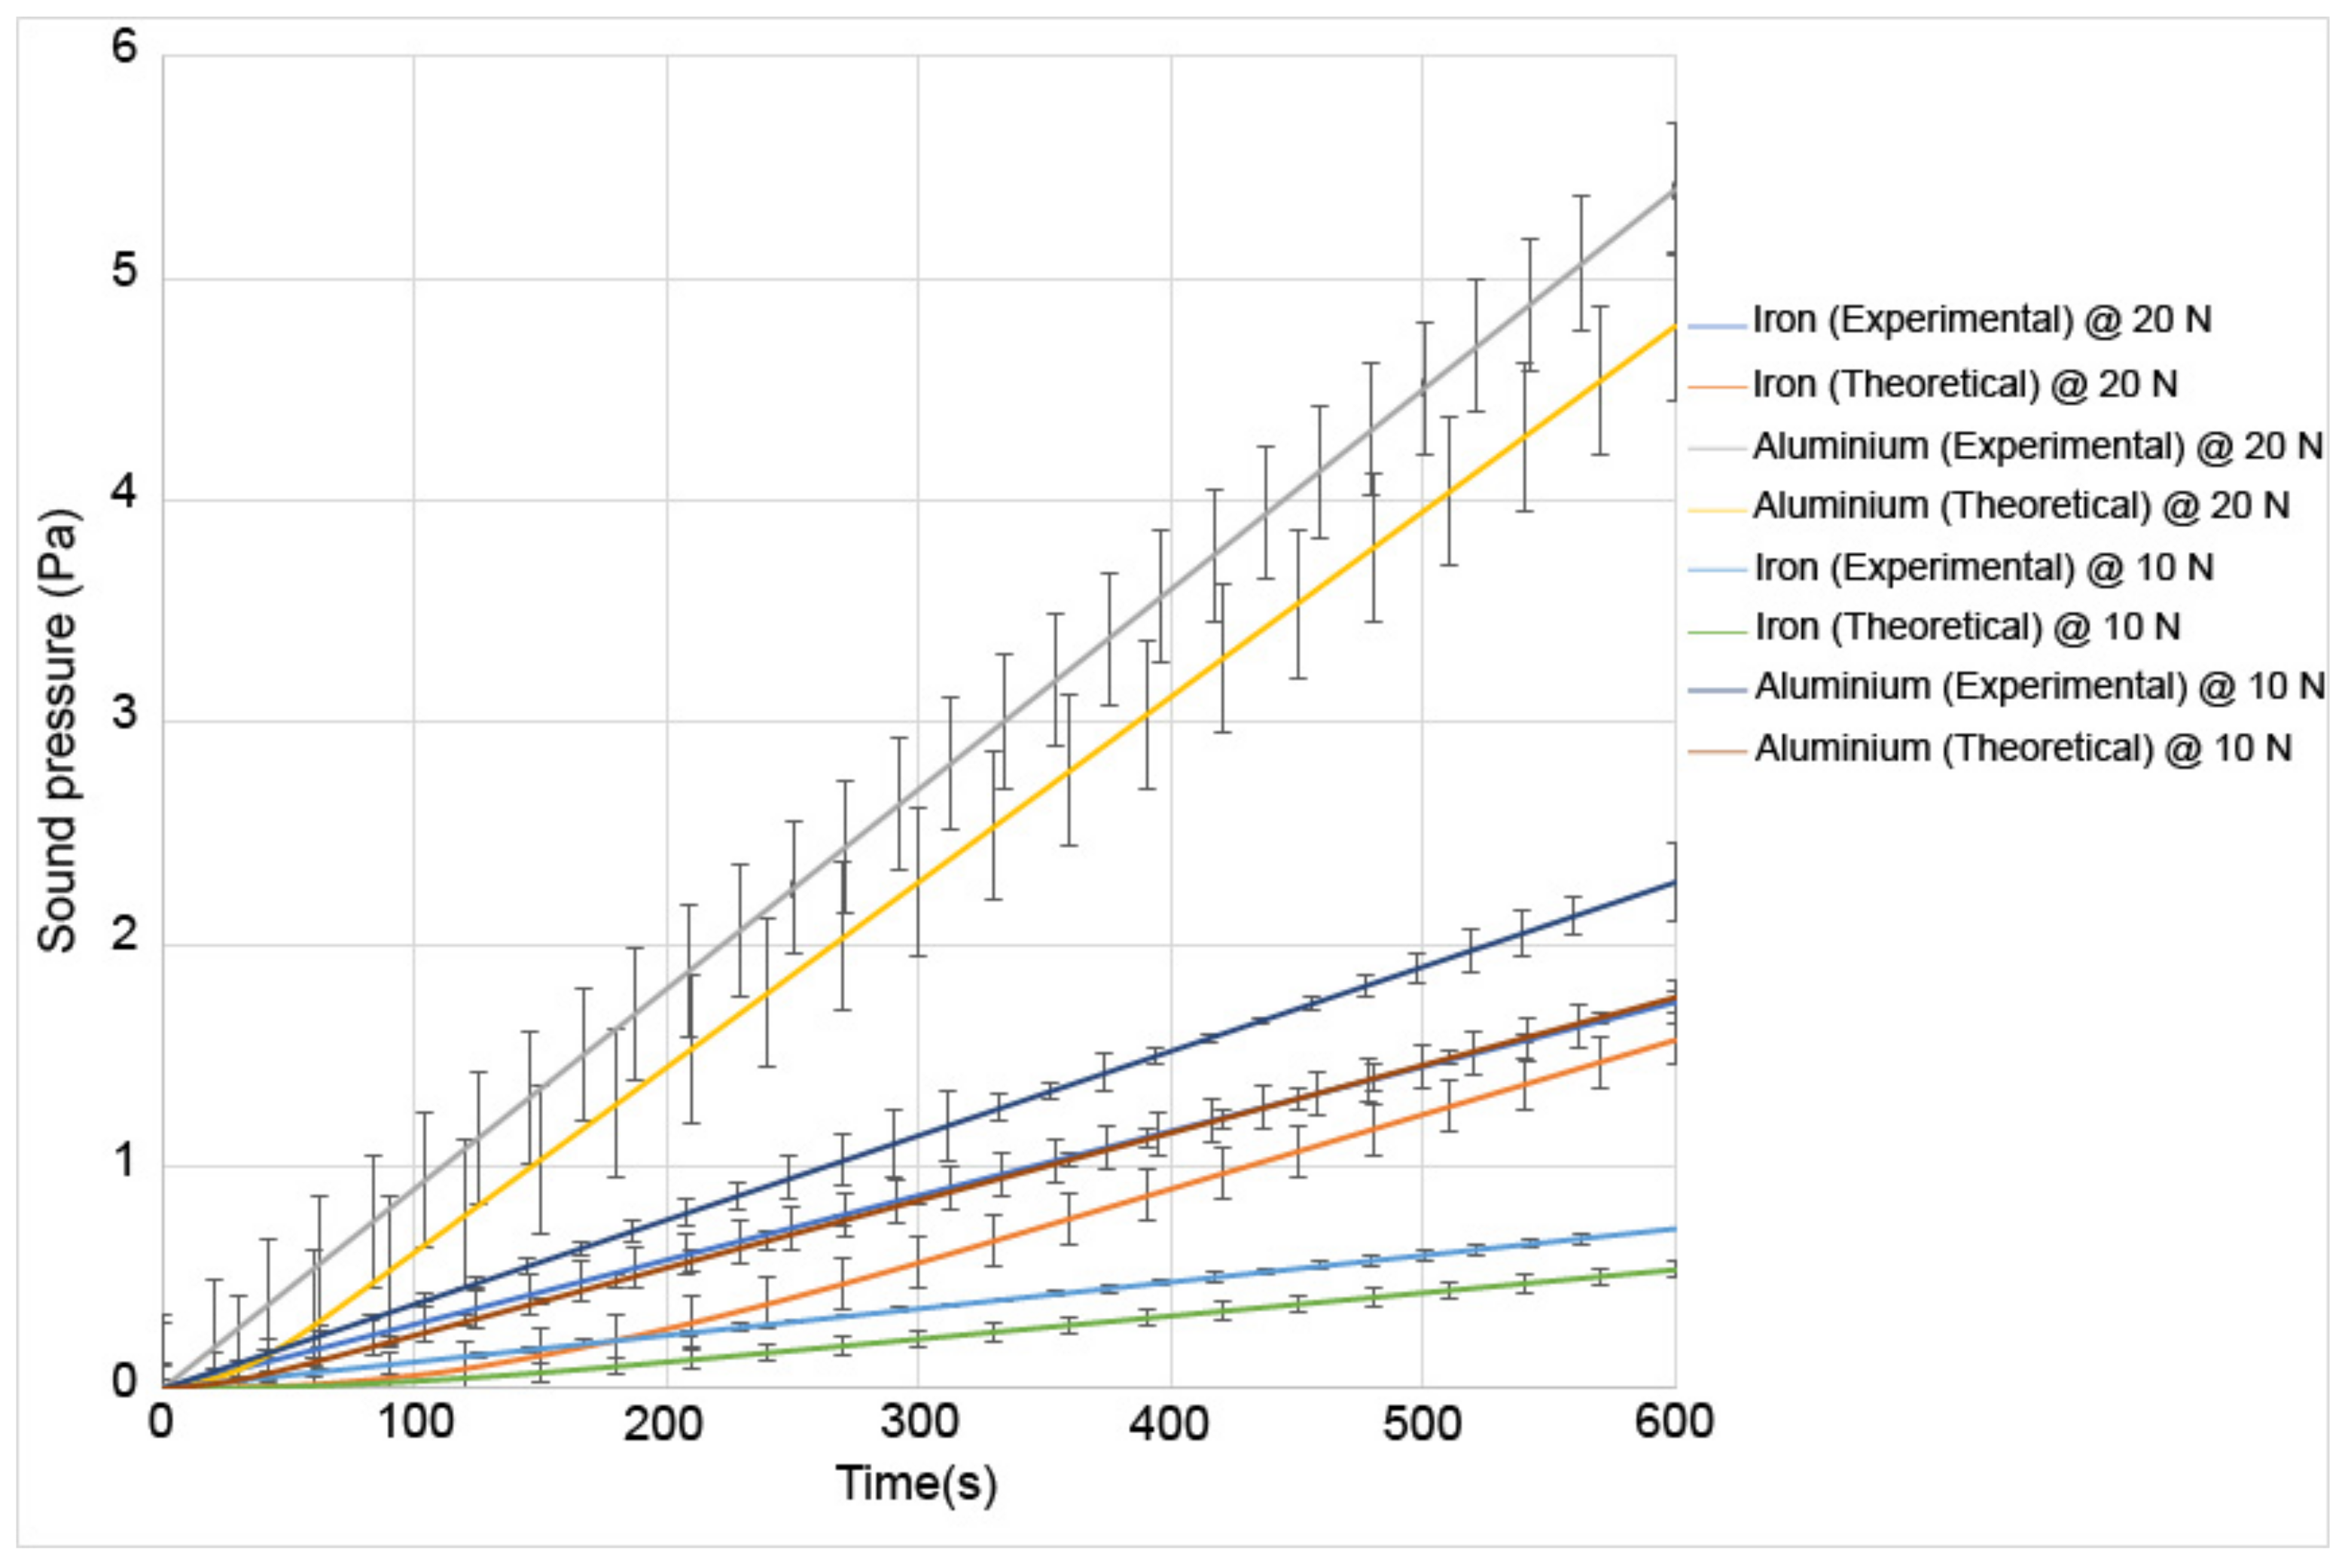
5.2. Predicted and Observed Sound Pressure
6. Conclusions
Author Contributions
Funding
Institutional Review Board Statement
Informed Consent Statement
Data Availability Statement
Conflicts of Interest
References
- Ding, C.; Zhu, H.; Sun, G.; Zhou, Y.; Zuo, X. Chaotic Characteristics and Attractor Evolution of Friction Noise during Friction Process. Friction 2018, 6, 47–61. [Google Scholar] [CrossRef] [Green Version]
- Nam, J.H.; Do, H.C.; Kang, J.Y. Effect of Groove Surface on Friction Noise and Its Mechanism. Int. J. Precis. Eng. Manuf. 2017, 18, 1165–1172. [Google Scholar] [CrossRef]
- Jiménez, A.; Bermúdez, M. Tribology for Engineers; Davim, J.P., Ed.; Woodhead Publishing: Sawston, UK, 2011. [Google Scholar]
- Khan, M.A.; Basit, K.; Khan, S.Z.; Khan, K.A.; Starr, A.G. Experimental Assessment of Multiple Contact Wear Using Airborne Noise under Dry and Lubricated Conditions. Proc. Inst. Mech. Eng. Part J J. Eng. Tribol. 2017, 231, 1503–1516. [Google Scholar] [CrossRef]
- Ben Abdelounis, H.; Zahouani, H.; Le Bot, A.; Perret-Liaudet, J.; Tkaya, M.B. Numerical Simulation of Friction Noise. Wear 2011, 271, 621–624. [Google Scholar] [CrossRef]
- Rahman, A.; Khan, M.; Mushtaq, A. Predictive Modeling of Surface Wear in Mechanical Contacts under Lubricated and Non-Lubricated Conditions. Sensors 2021, 21, 1160. [Google Scholar] [CrossRef]
- Li, X. A Brief Review: Acoustic Emission Method for Tool Wear Monitoring during Turning. Int. J. Mach. Tools Manuf. 2002, 42, 157–165. [Google Scholar] [CrossRef] [Green Version]
- Jlaiel, K.; Yahiaoui, M.; Paris, J.; Denape, J. Tribolumen: A Tribometer for A Correlation Between AE Signals and Observation of Tribological Process in real-time—Application to a dry steel/glass reciprocating sliding contact. Lubricants 2020, 8, 47. [Google Scholar] [CrossRef] [Green Version]
- Benabdallah, H.S.; Aguilar, D.A. Acoustic Emission and Its Relationship With Friction and Wear for Sliding Contact. Tribol. Trans. 2008, 51, 738–747. [Google Scholar] [CrossRef]
- Mechefske, C.K.; Sun, G.; Sheasby, J. Using Acoustic Emission to Monitor Sliding Wear. Non-Destr. Test. Cond. Monit. 2002, 44, 490–497. [Google Scholar]
- Baccar, D.; Soffker, D. Wear Detection by Means of Wavelet- Based Acoustic Emission Analysis. Mech. Syst. Signal Processing 2015, 60, 198–207. [Google Scholar] [CrossRef]
- Alotaibi, M.; Shakibaei Asli, B.H.; Khan, M. Non-Invasive Inspections: A review on Methods and Tools. Sensors 2021, 21, 8474. [Google Scholar] [CrossRef]
- Saqib, W.; Sherazi, H.I.; Khan, M.A.; Khan, S.Z.; Khan, K.A. An intelligent system for machinery wear debris analysis using evolutionary algorithms. Insight–Non-Destr. Test. Cond. Monit. 2016, 58, 656–662. [Google Scholar] [CrossRef]
- Chen, G.X.; Zhou, Z.R.; Kapsa, P.; Vincent, L. Effect of Surface Topography on Formation of Squeal Under Reciprocating Sliding. Wear 2002, 253, 411–423. [Google Scholar]
- Chen, G.X.; Zhou, Z.R.; Kapsa, P.; Vincent, L. Experimental Investigation into Squeal Under Reciprocating Sliding. Tribol. Int. 2003, 36, 961–971. [Google Scholar] [CrossRef]
- Jibiki, T.; Shima, M.; Akita, H.; Tamura, M. A Basic Study of Friction Noise Caused by Fretting. Wear 2001, 251, 1492–1503. [Google Scholar] [CrossRef]
- Kong, D.; Chen, Y.; Li, N.; Tan, S. Tool Wear Monitoring Based on Kernel Principal Component Analysis and V-Support Vector Regression. Int. J. Adv. Manuf. Technol. 2017, 89, 175–190. [Google Scholar] [CrossRef]
- Serrao, P.; Prabhu, R.; Chiranth, B.; Mohammed, Y. Application of Taguchi Method to Predict the Abrasive Wear Behavior of CP Titanium. J. Mech. Eng. Autom. 2016, 6, 13–17. [Google Scholar]
- Feng, P.; Borghesani, P.; Smith, W.A.; Randall, R.B.; Peng, Z. A Review on the Relationships between Acoustic Emission, Friction and Wear in Mechanical Systems. Appl. Mech. Rev. 2020, 72, 020801. [Google Scholar] [CrossRef]
- Sinuhe, H. High Temperature Wear Processes. Licentiate Thesis, Luleå University of Technology, Luleå, Sweden, 2014. [Google Scholar]
- Pearsonn, S.R.; Shipway, P.H.; Abere, J.O.; Hewitt, R.A.A. The Effect of Temperature on Wear and Friction of a High Strength steel in Fretting. Wear 2013, 303, 622–631. [Google Scholar] [CrossRef]
- Pei, Y.; Xia, D.; Wang, S.; Cong, L.; Wang, X.; Wang, D. Effects of Temperature on the Tribological Properties of NM600 under Sliding Wear. Materials 2019, 12, 4009. [Google Scholar] [CrossRef] [Green Version]
- Shanmughasundaram, P. Effect of Temperature, Load and Sliding Velocity on the Wear Behaviour of AA7075-SIC Composites. Mech. Mech. Eng. 2017, 21, 85–93. [Google Scholar]
- Lancaster, J.K. The Influence of Temperature on Metallic Wear. Proc. Phys. Soc. Sect. B 1957, 70, 112. [Google Scholar] [CrossRef]
- Pan, L.; Han, J.; Yang, Z.; Wang, J.; Li, X.; Li, Z.; Li, W. Temperature Effects on the Friction and Wear Behaviors of SiCp/A356 Composite against Semimetallic Materials. Adv. Mater. Sci. Eng. 2017, 2017, 1824080. [Google Scholar] [CrossRef] [Green Version]
- Jin, X.; Shipway, P.H.; Sun, W. The Role of Temperature and Frequency on Fretting Wear of a Like-on-Like Stainless Steel Contact. Tribol. Lett. 2017, 65, 77. [Google Scholar] [CrossRef]
- Attia, M.H.; de Pannemaecker, A.; Williams, G. Effect of Temperature on Tribo-Oxide Formation and the Fretting Wear and Friction Behavior of Zirconium and Nickel-Based Alloys. Wear 2021, 476, 203722. [Google Scholar] [CrossRef]
- Nassar, A.; Nassar, E. The Effect of Testing Temperature on Wear Resistance of Metals Reinforced with Ceramic Particle. Chem. Mater. Eng. 2013, 1, 29–34. [Google Scholar] [CrossRef]
- Kumar, P.; Wani, M.F. Effect of Temperature on the Friction and Wear Properties of Graphene Nano-Platelets as Lubricant Additive on Al-25Si Alloy. Mater. Res. Express 2019, 6, 046513. [Google Scholar] [CrossRef]
- Rodriguez, J.; Martin, A.; Llorca, J. Modeling the Effect of Temperature on the Wear Resistance of Metals Reinforced with Ceramic Particles. Acta Mater. 2000, 48, 993–1003. [Google Scholar] [CrossRef]
- Matozo, L.T.; Soares, M.R.F.; Al-Qureshi, H.A. The Effect of Environmental Humidity and Temperature on Friction Level and Squeal Noise Propensity for Disc Brake Friction Materials; SAE Technical Paper; SAE International: Warrendale, PA, USA, 2008. [Google Scholar]
- Mahale, P.; Bohari, A.; Raajha, M.P. Effect of Thermal Behavior of Friction Materials on Brake Squeal. SAE Technical Paper; SAE International: Warrendale, PA, USA, 2014. [Google Scholar]
- Sirin, O.; Ohiduzzaman, M.; Kassem, E. Influence of Temperature on Tire-Pavement Noise in Hot Climates: Qatar Case. Case Stud. Constr. Mater. 2021, 15, e00651. [Google Scholar] [CrossRef]
- Lontin, K.; Khan, M.A. Wear and Airborne Noise Interdependency at Asperitical Level: Analytical Modelling and Experimental Validation. Materials 2021, 14, 7308. [Google Scholar] [CrossRef]
- Hase, A.; Mishina, H.; Wada, M. Correlation between features of acoustic emission signals and mechanical wear mechanisms. Wear 2012, 292, 144–150. [Google Scholar] [CrossRef]


| Set No. | No. of Samples | Material | Load (N) | Temperature (°C) |
|---|---|---|---|---|
| 1 | 3 | Iron | 10 | 40 |
| 2 | 3 | - | - | 60 |
| 3 | 2 | - | 20 | 40 |
| 4 | 3 | - | - | 60 |
| 5 | 3 | Aluminum | 10 | 40 |
| 6 | 3 | - | 60 | |
| 7 | 3 | - | 20 | 40 |
| 8 | 3 | - | - | 60 |
Publisher’s Note: MDPI stays neutral with regard to jurisdictional claims in published maps and institutional affiliations. |
© 2022 by the authors. Licensee MDPI, Basel, Switzerland. This article is an open access article distributed under the terms and conditions of the Creative Commons Attribution (CC BY) license (https://creativecommons.org/licenses/by/4.0/).
Share and Cite
Lontin, K.; Khan, M.; Alharbi, B. Investigation of the Effect of Temperature on the Wear Rate and Airborne Noise in Sliding Wear. Materials 2022, 15, 812. https://doi.org/10.3390/ma15030812
Lontin K, Khan M, Alharbi B. Investigation of the Effect of Temperature on the Wear Rate and Airborne Noise in Sliding Wear. Materials. 2022; 15(3):812. https://doi.org/10.3390/ma15030812
Chicago/Turabian StyleLontin, Kevin, Muhammad Khan, and Bander Alharbi. 2022. "Investigation of the Effect of Temperature on the Wear Rate and Airborne Noise in Sliding Wear" Materials 15, no. 3: 812. https://doi.org/10.3390/ma15030812