
Effect of ‘Q’ Ratio on Texture Evolution of Ti-3Al-2.5V Alloy Tube during Rolling

Abstract
:1. Introduction
2. Experimental Method
2.1. Experimental Materials
2.2. Specimen Preparation and Measurement Techniques
3. Experimental Results and Discussion
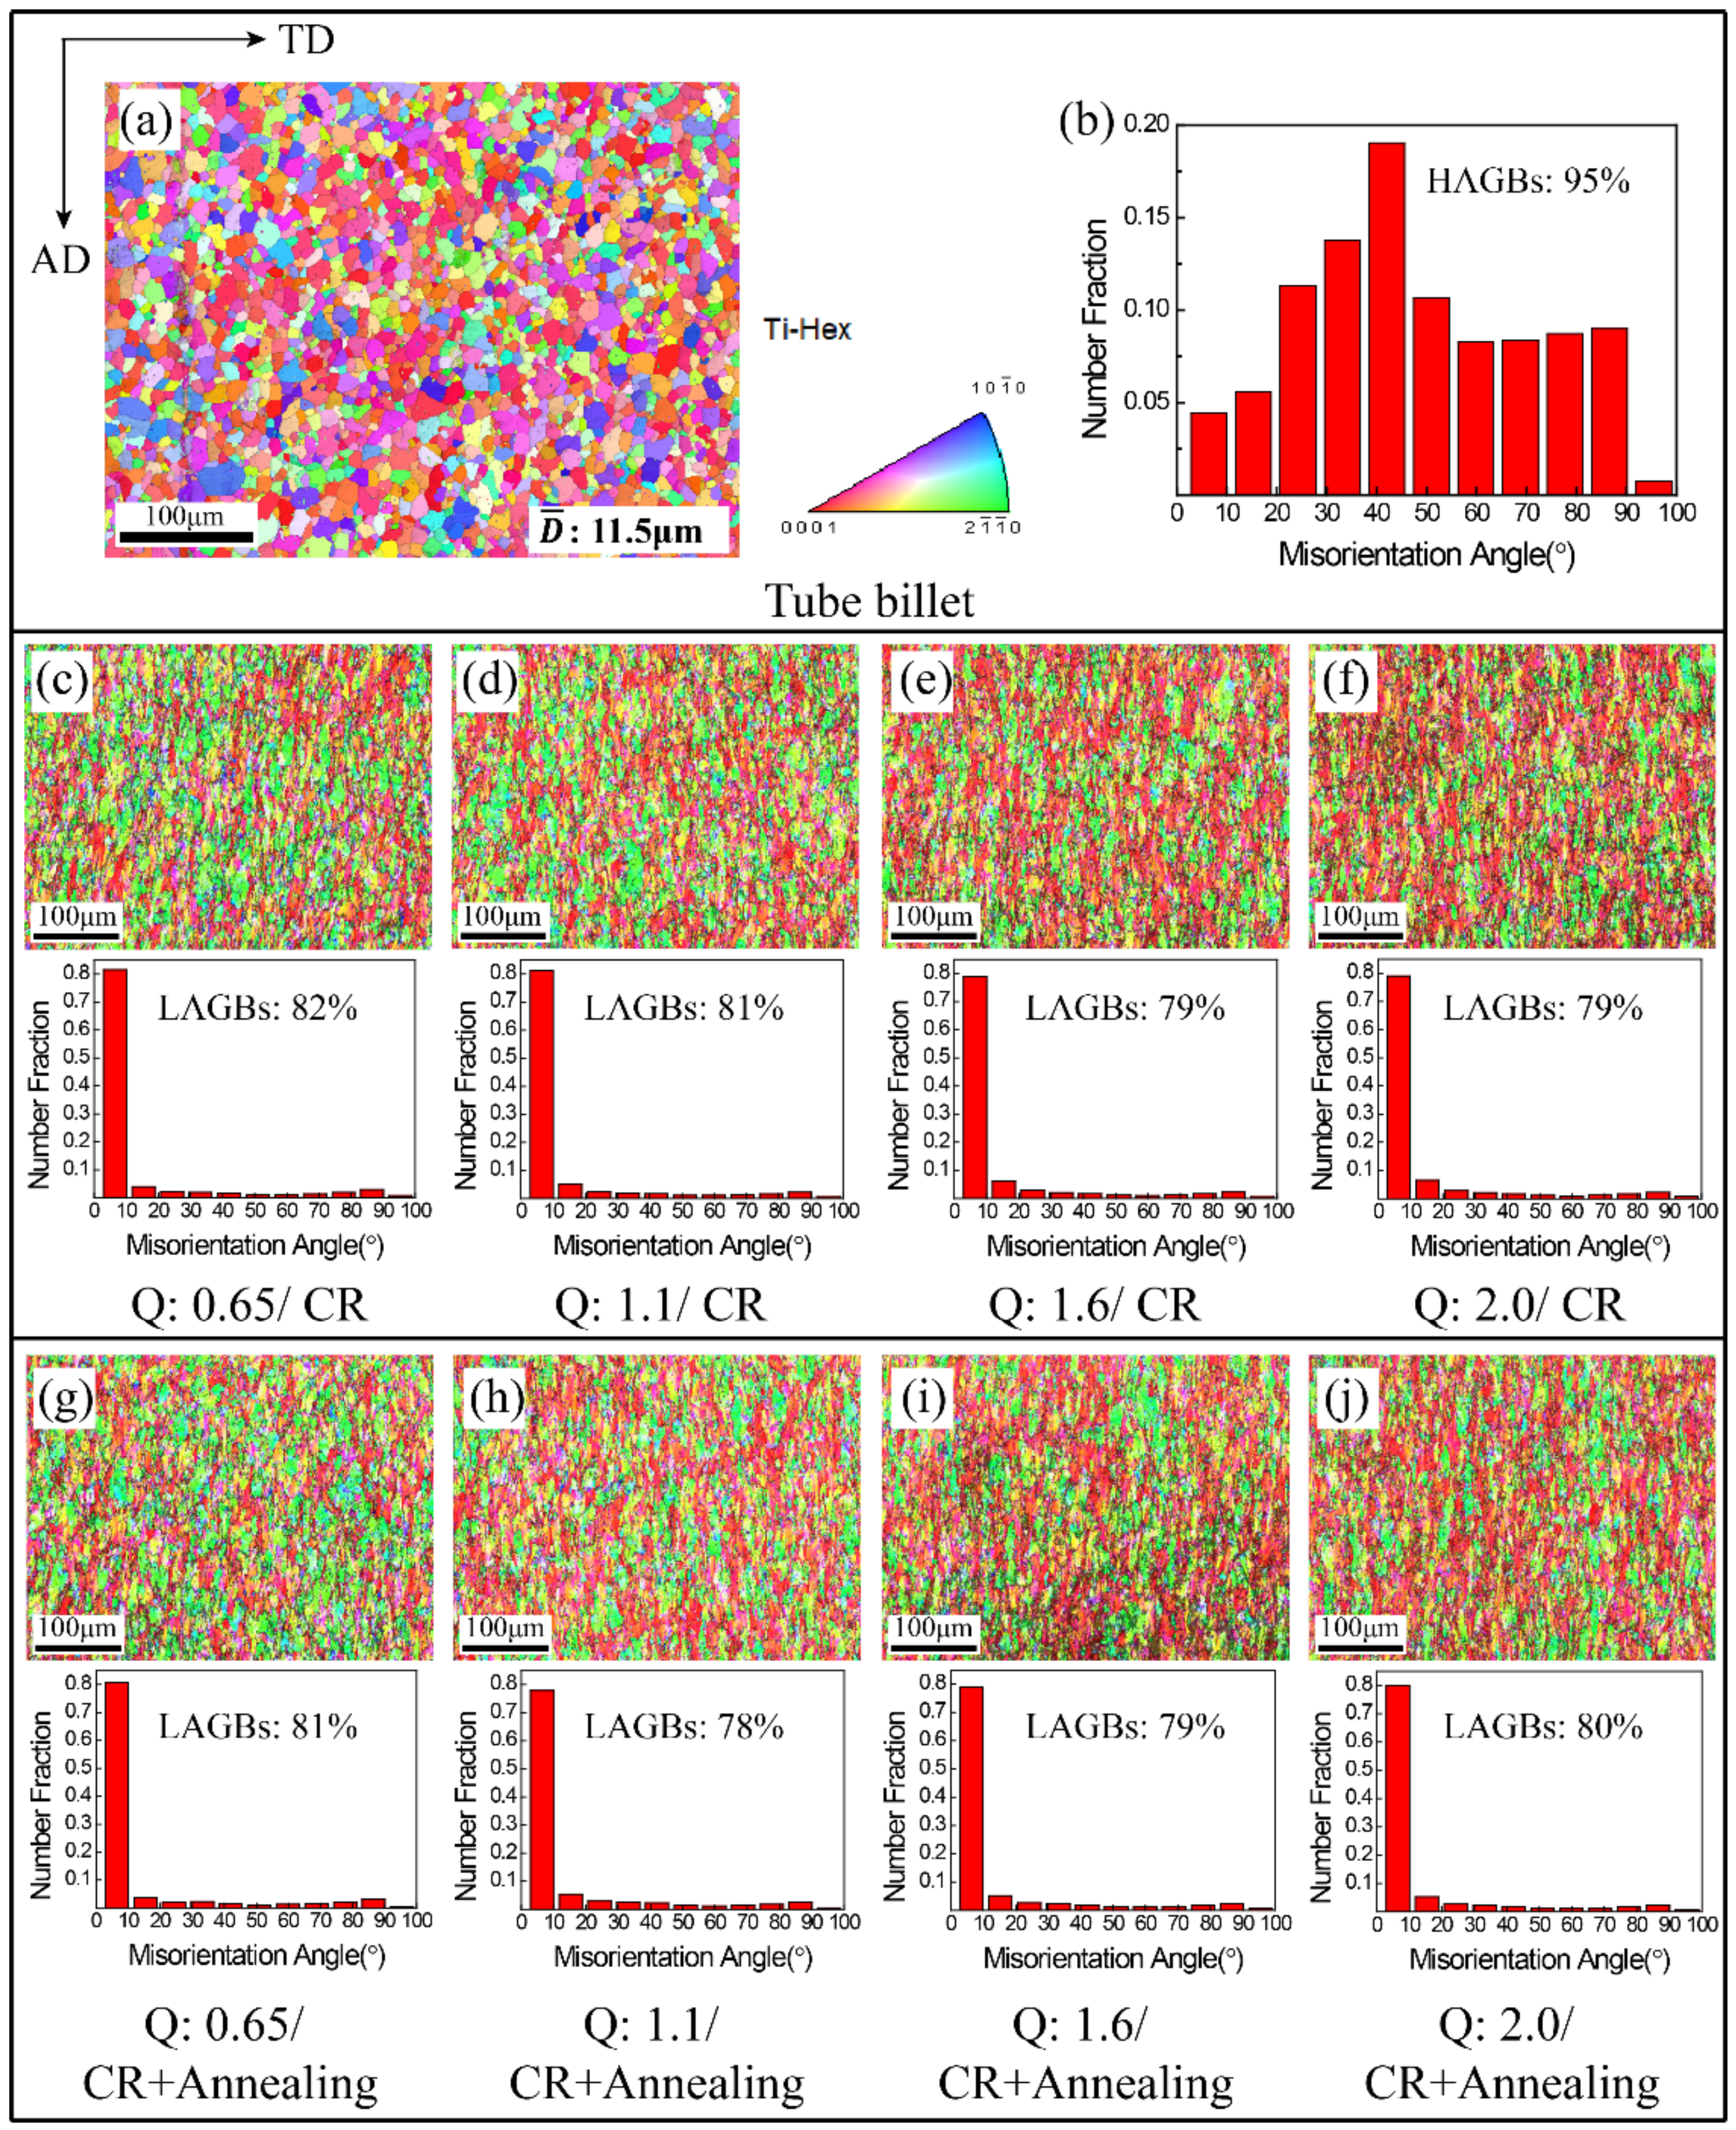
3.1. The Microstructure
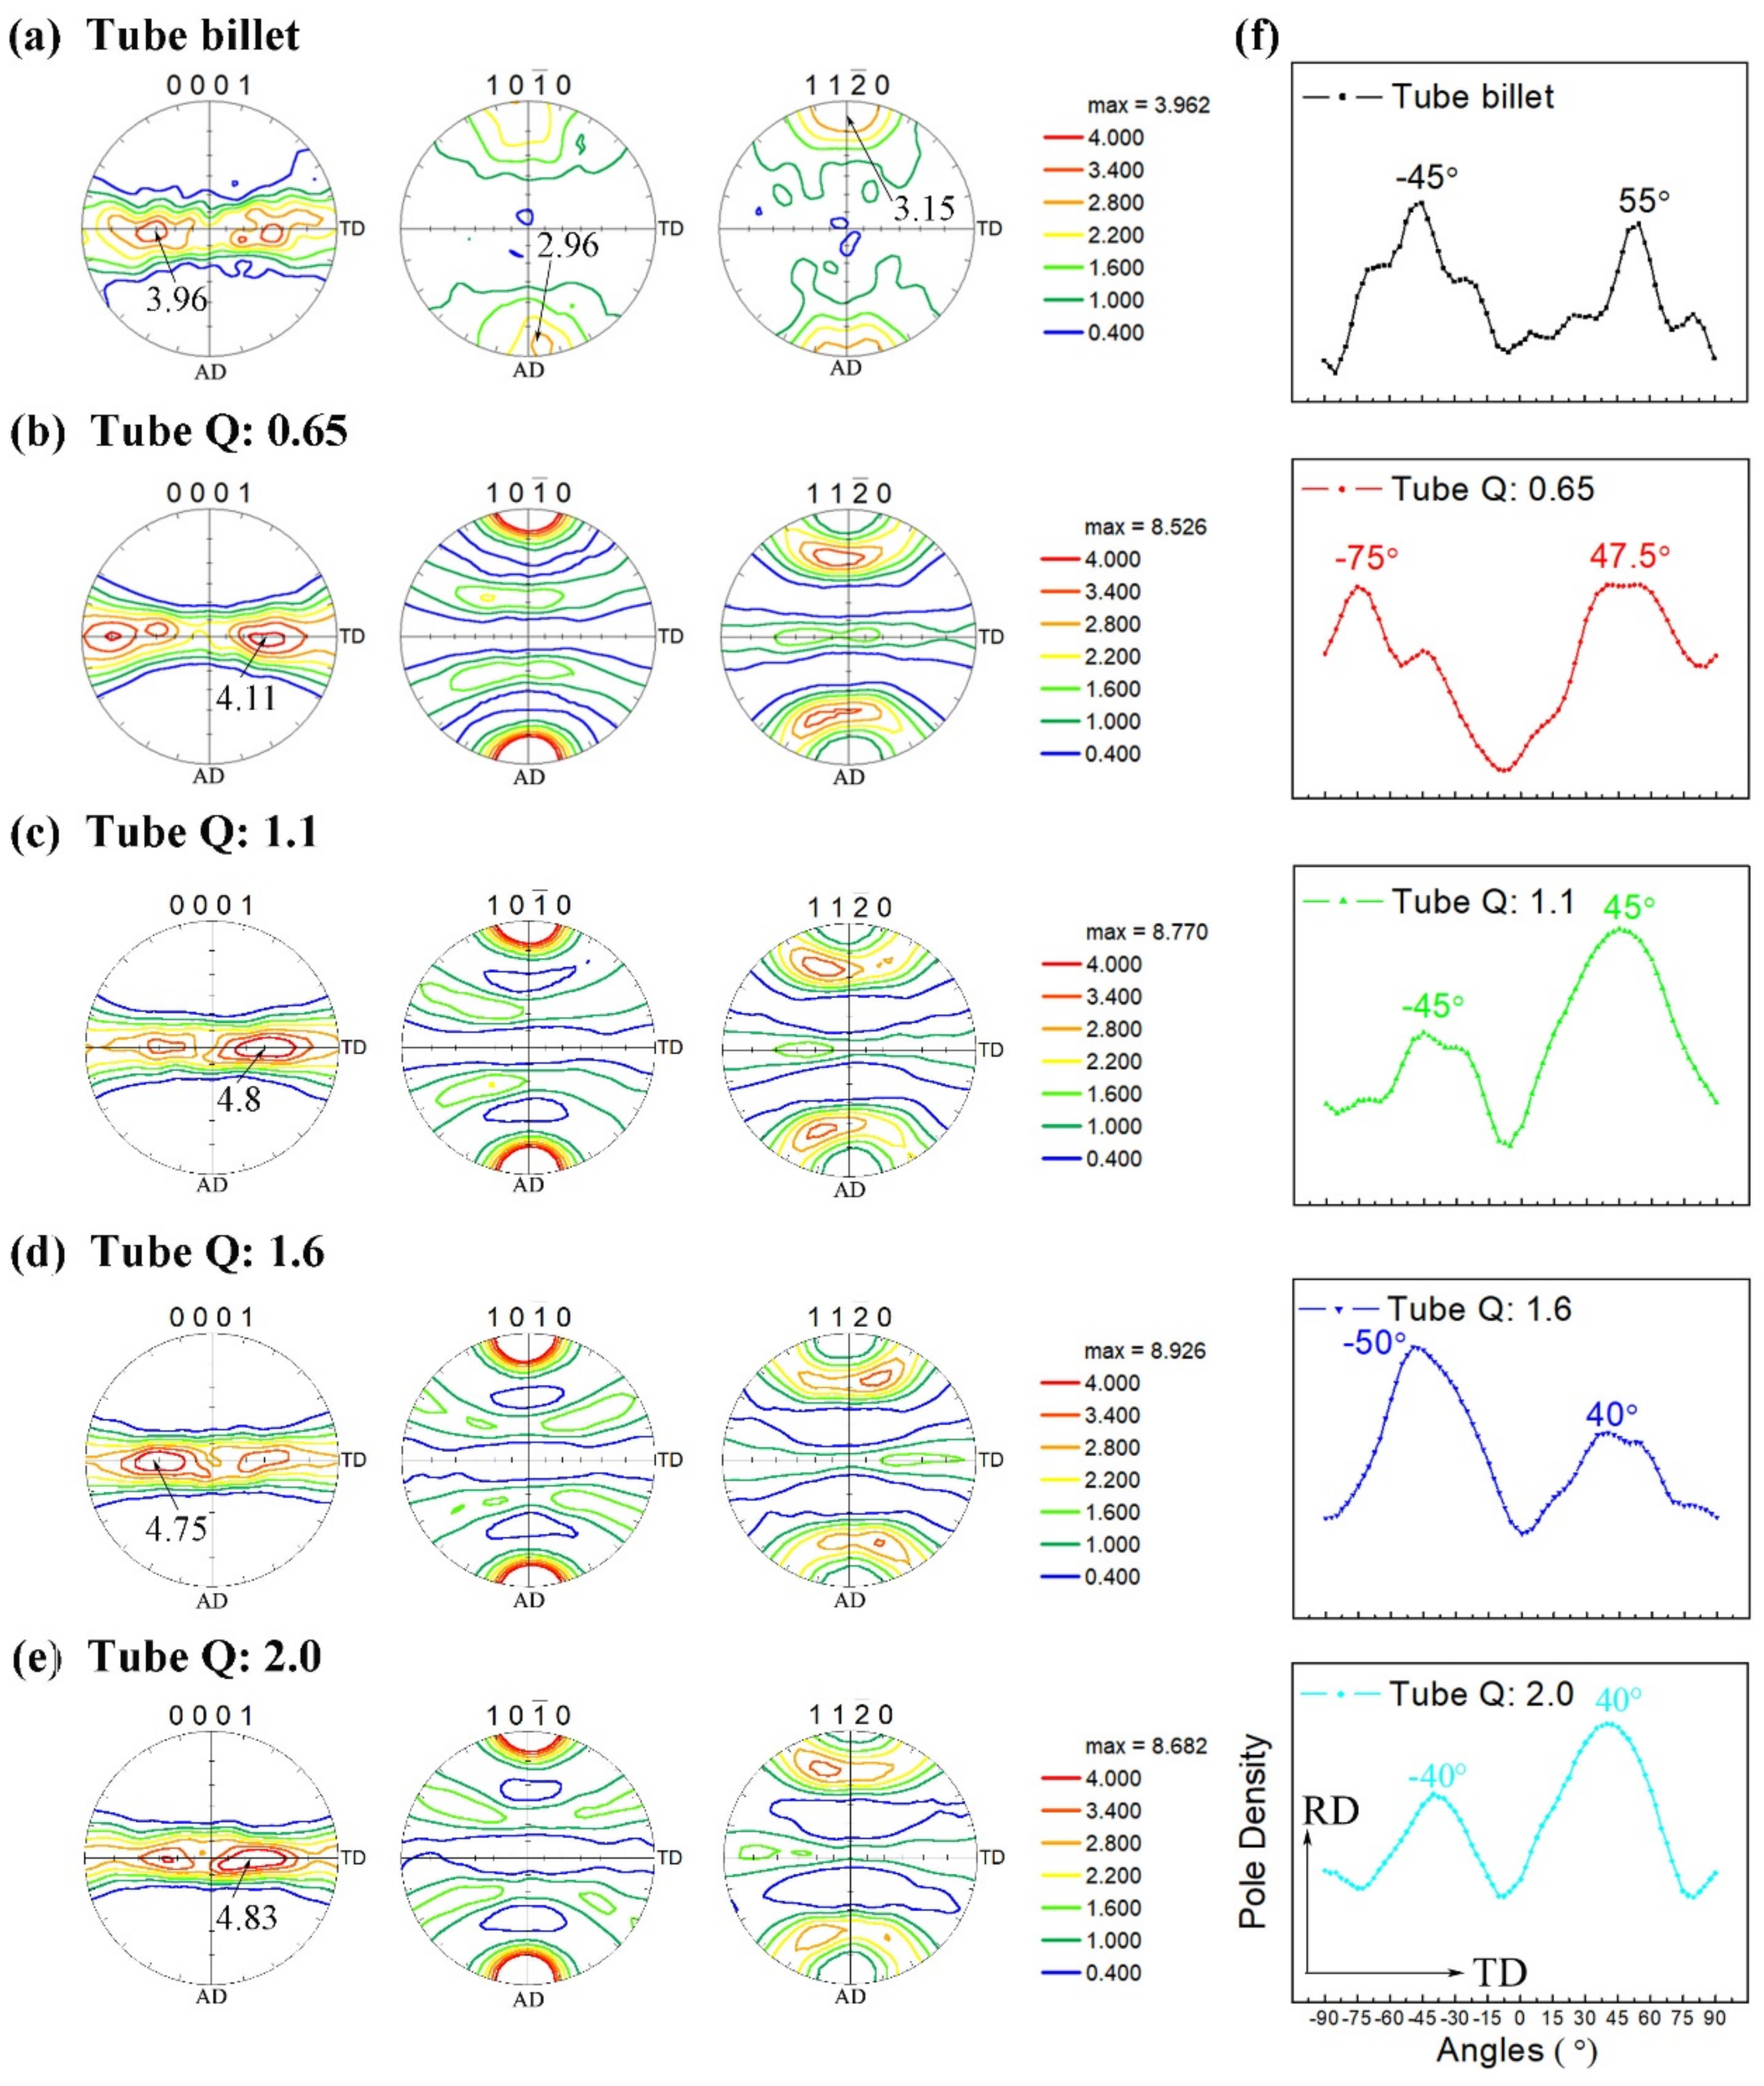
3.2. Texture Evolution
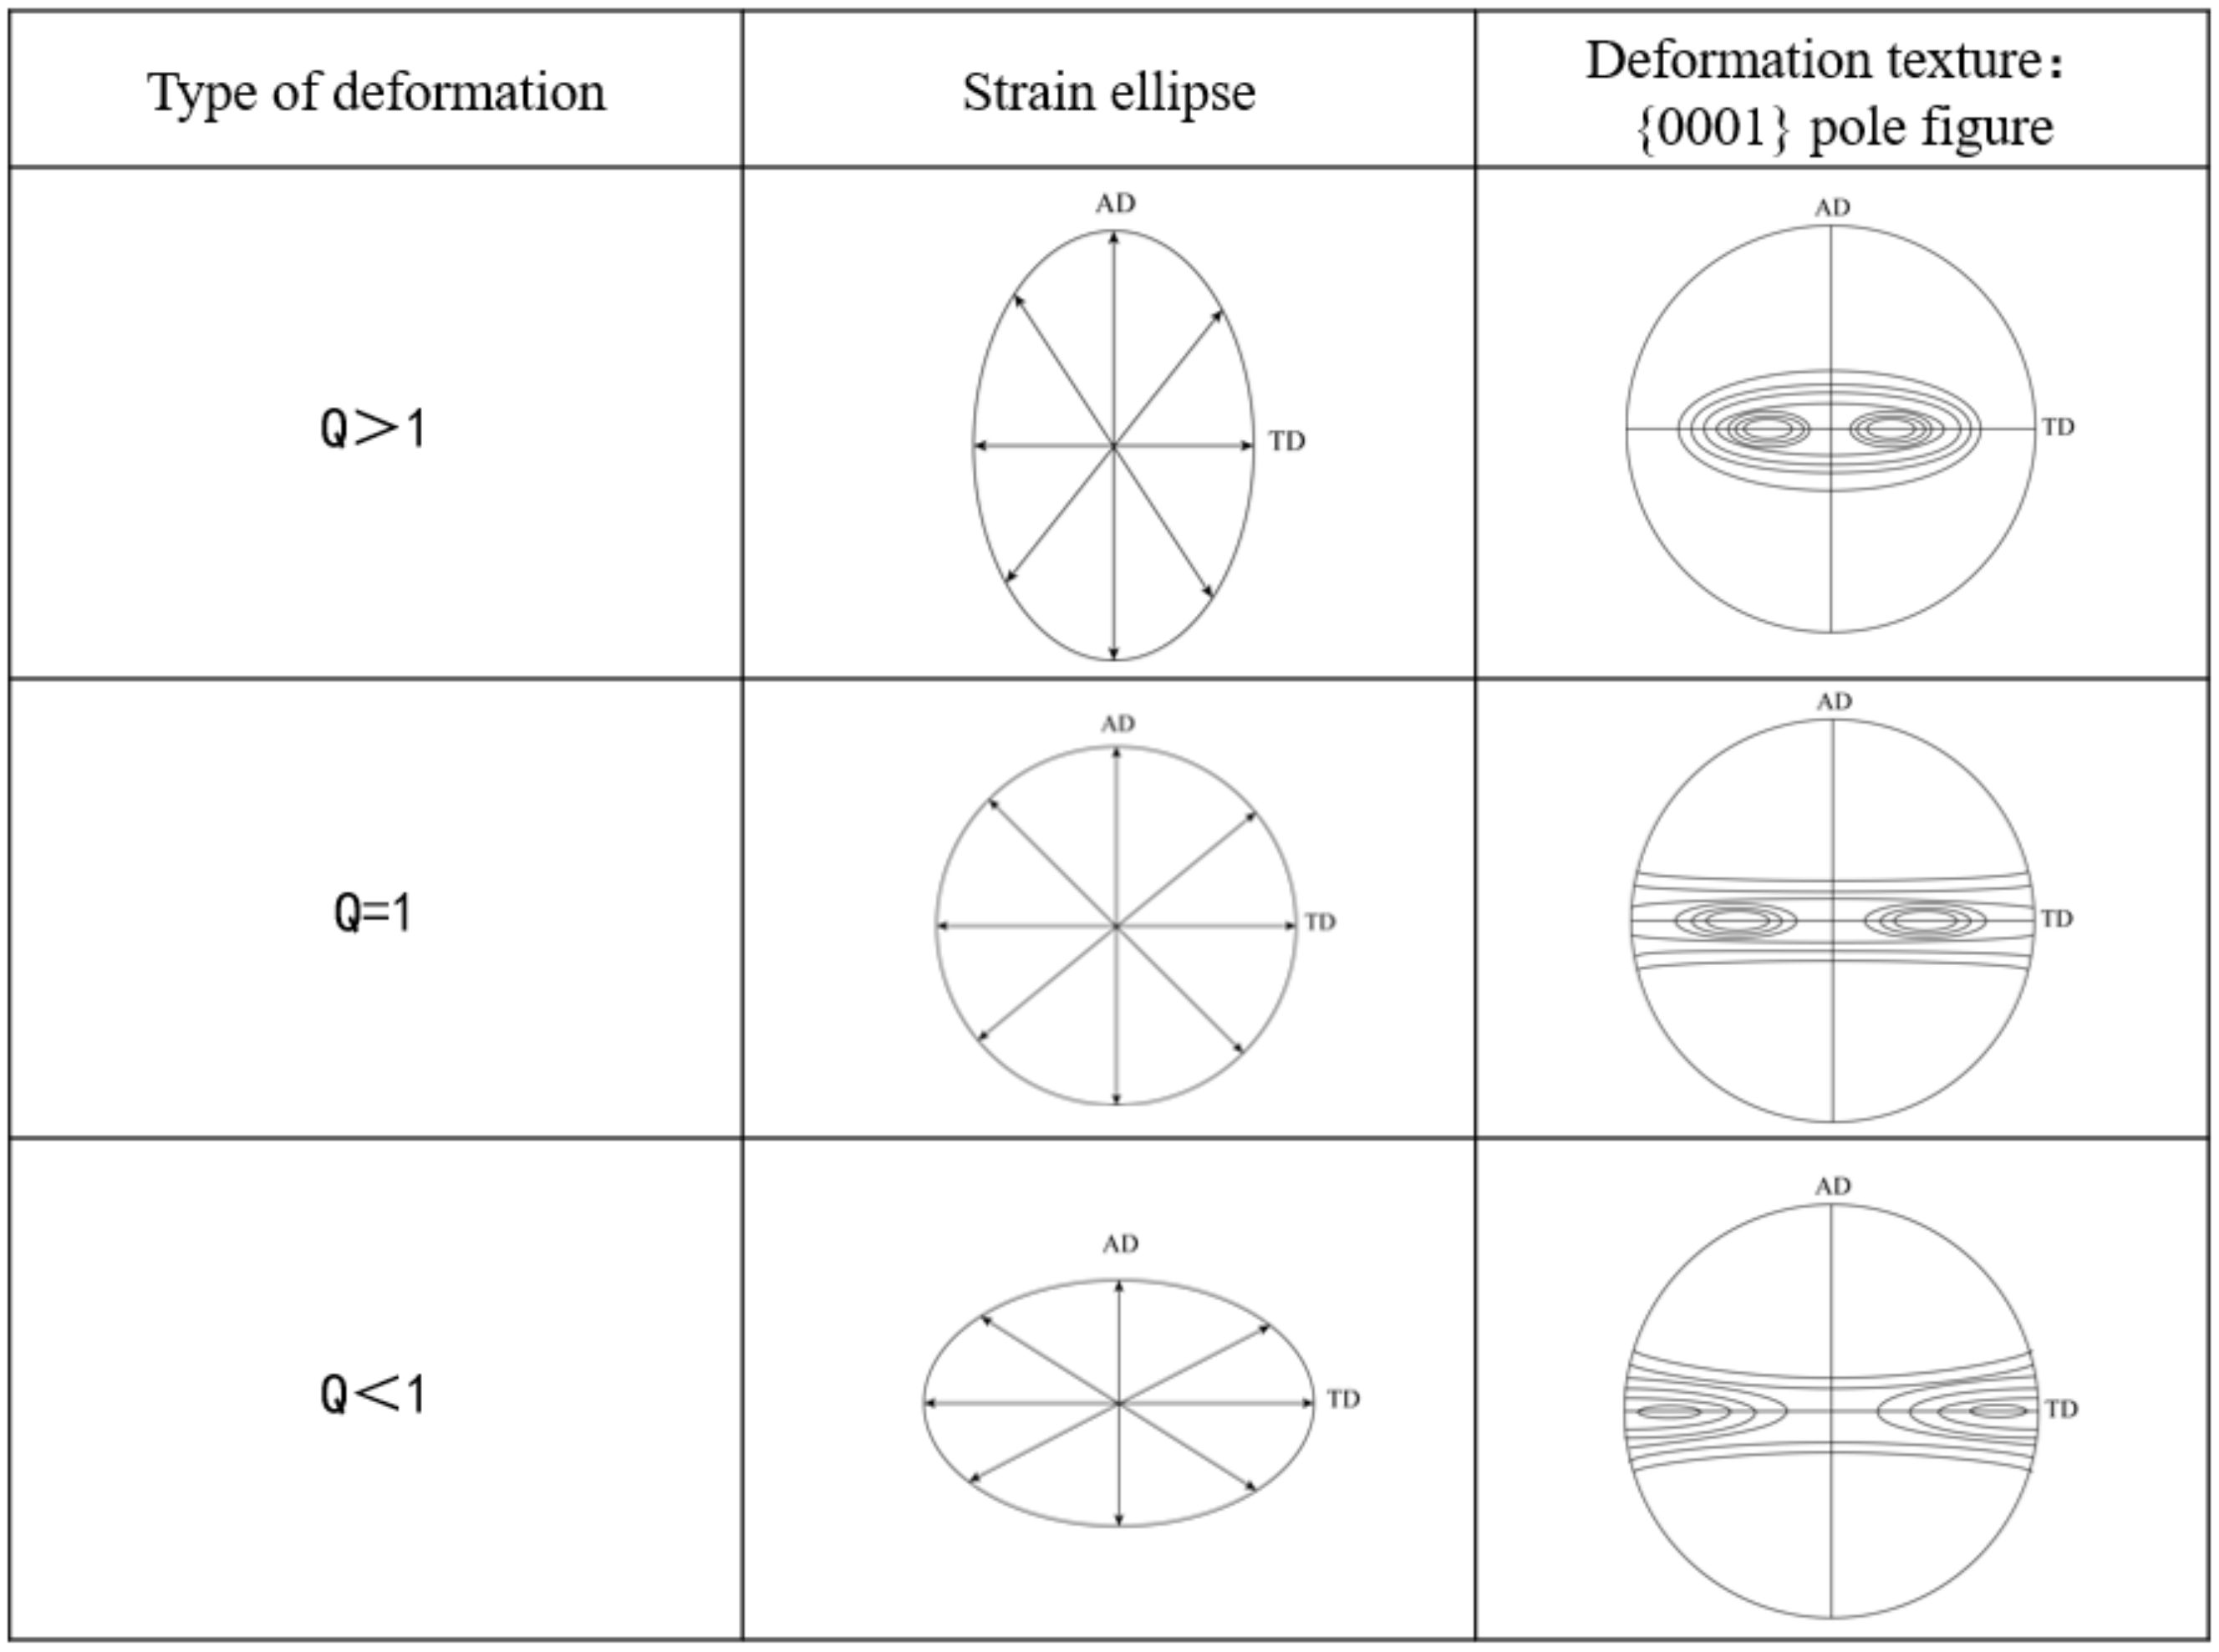
3.3. Discussion
4. Conclusions
Author Contributions
Funding
Institutional Review Board Statement
Data Availability Statement
Conflicts of Interest
References
- Forney, C.E.; Meredith, S.E. Ti-3Al-2.5V Seamless Tubing Engineering Guide; Sandvik Special Metals Corporation: Washington, DC, USA, 1990. [Google Scholar]
- Zhang, F.; Sun, M.; Sun, B.; Zhang, F.; Bai, Y.; Liu, Z. Temperature Dependency on the Microscopic Mechanism in the Normal Direction of Wrought AZ31 Sheet under Dynamic Compressive Behavior. Materials 2021, 14, 7436. [Google Scholar] [CrossRef]
- Zhao, D.; Fan, J.; Zhang, Z.; Liu, X.; Wang, Q.; Chen, Z.; Tang, B.; Kou, H.; Jia, S.; Li, J. Microstructure and Texture Variations in High Temperature Titanium Alloy Ti65 Sheets with Different Rolling Modes and Heat Treatments. Materials 2020, 13, 2466. [Google Scholar] [CrossRef]
- Wu, Y.; Fan, R.L.; Chen, M.H.; Wang, K.H.; Zhao, J.; Xiao, W.C. High-temperature anisotropic behaviors and microstructure evolution mechanisms of a near-α Ti-alloy sheet. Mater. Sci. Eng. A 2021, 820, 141560. [Google Scholar] [CrossRef]
- Singh, J.; Mahesh, S.; Kumar, G.; Pant, P.; Srivastava, D.; Dey, G.K.; Saibaba, N.; Samajdar, I. Texture Development and Plastic Deformation in a Pilgered Zircaloy-4 Tube. Metall. Mater. Trans. A 2015, 46, 1927–1947. [Google Scholar] [CrossRef]
- Osamu, U.; Norimitsu, K. Effects of Cross-Rolling on Deformation Texture Evolution in Unalloyed Titanium. Mater. Sci. Forum 2017, 879, 2014–2019. [Google Scholar]
- Linga Murty, K.; Charit, I. Texture development and anisotropic deformation of zircaloys. Prog. Nucl. Energy 2006, 4, 325–359. [Google Scholar] [CrossRef]
- Tenckhoff, E. The development of the deformation texture in zirconium during rolling in sequential passes. Metall. Mater. Trans. A 1978, 9, 1401–1412. [Google Scholar] [CrossRef]
- Tenckhoff, E. Deformation Mechanisms, Texture, and Anisotropy in Zirconium and Zircaloy; ASTM: Philadelphia, PA, USA, 1988; pp. 13–19. Available online: https://www.osti.gov/biblio/5932937 (accessed on 20 October 2021).
- Krister, K. Texture and anisotropy of zirconium in relation to plastic deformation. Can. Metall. Quart. 1972, 1, 185–198. [Google Scholar] [CrossRef]
- Li, Z.X.; Zhan, M.; Guo, K.; Huang, T. Texture Development of Ti-3Al-2.5V Titanium Alloy Tubes. Rare Met. Mat. Eng. 2017, 11, 3169–3175. [Google Scholar] [CrossRef]
- Bayona Carrillo, N.; Bozzolo, N.; Fundenberger, J.J.; Thomas, B.; Camelin, P.; Lenarduzzi, E.; Wagner, F. Effect of Recrystallization on Tensile Behavior, Texture, and Anisotropy of Ti-3Al-2.5V Cold Pilgered Tubes. Adv. Eng. Mater. 2011, 5, 383–387. [Google Scholar] [CrossRef]
- Linga Murty, K.; Kishore, R.; Yan, J.; Scattergood, R.O.; Helsel, A.W. Effect of Annealing Temperature on Texture and Creep Anisotropy in Ti3Al2.5V Alloy. Mater. Sci. Forum 2005, 495–497, 1645–1652. [Google Scholar] [CrossRef]
- Zhou, D.D.; Zeng, W.D.; Xu, J.W.; Luo, D.C.; Li, H. Evolution of microstructure and texture in cold-rolled Ti tube under annealing. Rare Met. 2019, 5, 470–475. [Google Scholar] [CrossRef]
- Wang, W.R.; Yuan, L.H.; Li, Y.; Zhang, H.; Zhang, W.F.; Wang, Y.H. Effects of the crystallographic texture on the contractile strain ratio of Ti-3Al-2.5V tubing. J. Appl. Crystallogr. 2020, 53, 419–423. [Google Scholar] [CrossRef]
- Zhang, H.; Sheng, Z.M.; Zhang, W.F.; Wang, Y.H.; Yan, M.Q. Measurement and Evaluation of Crystallographic Texture in Ti-3Al-2.5V Tubing. J. Mater. Eng. Perform. 2015, 6, 2312–2318. [Google Scholar] [CrossRef]
- Yang, L.; Hui, S.X.; Ye, W.J.; Huang, L. Texture and EBSD of TA18 titanium alloys tubes. Rare Met. 2011, 6, 928–933. [Google Scholar] [CrossRef]
- Huang, L.; Xu, Z.; Dai, C.; Hui, S.X.; Ye, W.J.; Wang, G.; Xie, S.S.; Li, H.W. Three-Dimensional FE Simulation of Multi-Strokes Cold Pilgering of TA18 Titanium Alloy Tube:Ⅰ Theoretical Analysis, Modeling and Validation. Rare Met. Mat. Eng. 2013, 3, 524–529. [Google Scholar] [CrossRef]
- Huang, L.; Xu, Z.; Dai, C.; Hui, S.X.; Ye, W.J.; Wang, G.; Xie, S.S.; Li, H.W. Three-Dimensional FE Simulation of Multi-strokes Cold Pilgering of TA18 Titanium Alloy Tube:Ⅱ Analysis of Plastic Deformation Behavior. Rare Met. Mat. Eng. 2013, 4, 741–745. [Google Scholar] [CrossRef]
- Li, H.; Shi, K.P.; Yang, H. 3D-FE study on deformation behaviors in cold pilgering of high strength Ti-3Al-2.5V titanium alloy tube. AIP Conf. Proc. Am. Inst. Phys. 2013, 1532, 311–316. [Google Scholar] [CrossRef]
- Li, H.; Wei, D.; Zhang, H.Q.; Yang, H.; Zhang, D.; Li, G.J. Tooling design-related spatial deformation behaviors and crystallographic texture evolution of high-strength Ti-3Al-2.5V tube in cold pilgering. Int. J. Adv. Manuf. Tech. 2019, 104, 2851–2862. [Google Scholar] [CrossRef]
- Wu, S.H.; Zhang, S.H.; Cheng, M.; Zhang, W.F. 3D Finite Element Simulation of Three-Roller Cold Rolling Process. Aeronaut. Manuf. Technol. 2008, 23, 78–82. [Google Scholar] [CrossRef]
- Nie, Y.Z. Study on Texture of Ti-3Al-2.5V Alloy Tube; Central South University: Changsha, China, 1999. [Google Scholar]
- Rees, T.W. The Development and Control of Crystallographic Texture in 3AI-2.5V Titanium Alloy Tubing. Int. Marit. Health 1973, 60, 39–45. [Google Scholar] [CrossRef]
- Chen, Y.; Li, J.S.; Sun, F.; Tang, B.; Zhang, W.F.; Li, Y. Investigation of the microstructure and texture of TA18 tubes during cold-rolling process. J. Plast. Eng. 2012, 19, 35–39. [Google Scholar] [CrossRef]
- Hong, Q.; Qi, Y.L.; Zhao, B.; Du, Y. Influence of Cold Rolling with Different Q Values on Textures and Mechanical Properties of High Strength TA18 Titanium Alloy Tubes. Titan. Ind. Prog. 2016, 33, 16–19. Available online: https://d.wanfangdata.com.cn/periodical/tgyjz201602004 (accessed on 20 October 2021).
- Zhang, H.Q.; Wang, X.F.; Wei, B.L.; Li, H. Effect of tooling design on the cold pilgering behavior of zircaloy tube. Int. J. Adv. Manuf. Technol. 2017, 92, 2169–2183. [Google Scholar] [CrossRef]
- Tenckhoff, E. A Review of Texture and Texture Formation in Zircaloy Tubing. ASTM Int. 1982, 5–25. Available online: https://www.astm.org/stp37043s.html (accessed on 20 October 2021).


| Element | Ti | Al | V | Fe | O | N | C |
|---|---|---|---|---|---|---|---|
| wt% | Bal. | 3.1 | 2.5 | 0.16 | 0.08 | 0.01 | 0.01 |
| Process Number | Billet Sizes (mm) | Tube Sizes (mm) | Deformation Amount (%) | ‘Q’ Ratio |
|---|---|---|---|---|
| 1 | Φ25 × 2.8 | Φ16 × 2.1 | 53.8 | 0.65 |
| 2 | Φ25 × 2.8 | Φ16 × 1.8 | 60.5 | 1.1 |
| 3 | Φ25 × 2.8 | Φ16 × 1.5 | 66.5 | 1.6 |
| 4 | Φ25 × 2.8 | Φ16 × 1.2 | 70.4 | 2.0 |
| ‘Q’ Ratio | εt | εr | εl |
|---|---|---|---|
| 0.65 | −0.306 | −0.466 | 0.772 |
| 1.1 | −0.492 | −0.438 | 0.930 |
| 1.6 | −0.676 | −0.417 | 1.093 |
| 2.0 | −0.812 | −0.406 | 1.218 |
Publisher’s Note: MDPI stays neutral with regard to jurisdictional claims in published maps and institutional affiliations. |
© 2022 by the authors. Licensee MDPI, Basel, Switzerland. This article is an open access article distributed under the terms and conditions of the Creative Commons Attribution (CC BY) license (https://creativecommons.org/licenses/by/4.0/).
Share and Cite
Yang, Q.; Hui, S.; Ye, W.; Xu, Z.; Dai, C.; Lin, Y. Effect of ‘Q’ Ratio on Texture Evolution of Ti-3Al-2.5V Alloy Tube during Rolling. Materials 2022, 15, 817. https://doi.org/10.3390/ma15030817
Yang Q, Hui S, Ye W, Xu Z, Dai C, Lin Y. Effect of ‘Q’ Ratio on Texture Evolution of Ti-3Al-2.5V Alloy Tube during Rolling. Materials. 2022; 15(3):817. https://doi.org/10.3390/ma15030817
Chicago/Turabian StyleYang, Qi, Songxiao Hui, Wenjun Ye, Zhe Xu, Chun Dai, and Yuan Lin. 2022. "Effect of ‘Q’ Ratio on Texture Evolution of Ti-3Al-2.5V Alloy Tube during Rolling" Materials 15, no. 3: 817. https://doi.org/10.3390/ma15030817
APA StyleYang, Q., Hui, S., Ye, W., Xu, Z., Dai, C., & Lin, Y. (2022). Effect of ‘Q’ Ratio on Texture Evolution of Ti-3Al-2.5V Alloy Tube during Rolling. Materials, 15(3), 817. https://doi.org/10.3390/ma15030817