Materials and Technology Selection for Construction Projects Supported with the Use of Artificial Intelligence
Abstract
1. Introduction
2. Materials and Methods
2.1. Value Engineering
2.2. Optimization Model
- are profits for the period ending on h, h = 1, 2, …, H;
- are indirect costs for the period ending on h, h = 1, 2, …, H;
- TI is a known time interval, and in the analyzed model it corresponds to one working month and is expressed in days;
- is a variable for modelling payment delays, where payment delay is [working days], ;
- is cash flow of activity performed in mode ;
- is an interest rate;
- is the assessment of the VM functions of activity performed in mode ;
- is a weight of individual parts of the optimization objective function subject to equation ;
- is a deadline for completion of construction.
- ( is an objective part of the function,
- ( are restrictions (penalties), are the weights of individual parts of the objective function subject to optimization,
- are the weights of individual parts of the objective function responsible for constraints (penalties).
- is the NPV value for the currently examined case,
- is the maximum NPV value found for the unconstrained version of the project,
- is the minimal NPV value found for the unconstrained version of the project.
- is the value rating for the currently studied case,
- is the maximum value rating found for the unconstrained version of the tested example,
- is the minimum value grade found for the unconstrained version of the tested example.
- is the CF value for the currently examined case,
- is the maximum CF value found for the unconstrained version of the project,
- is the minimal CF value found for the unconstrained version of the project.
2.3. Optimization Procedure Supported by AI
3. Results
3.1. Case Study
3.1.1. Basic Information
- variant 1 (V1)—reinforced concrete structure made of steel and concrete materials on the construction site (Figure 3),
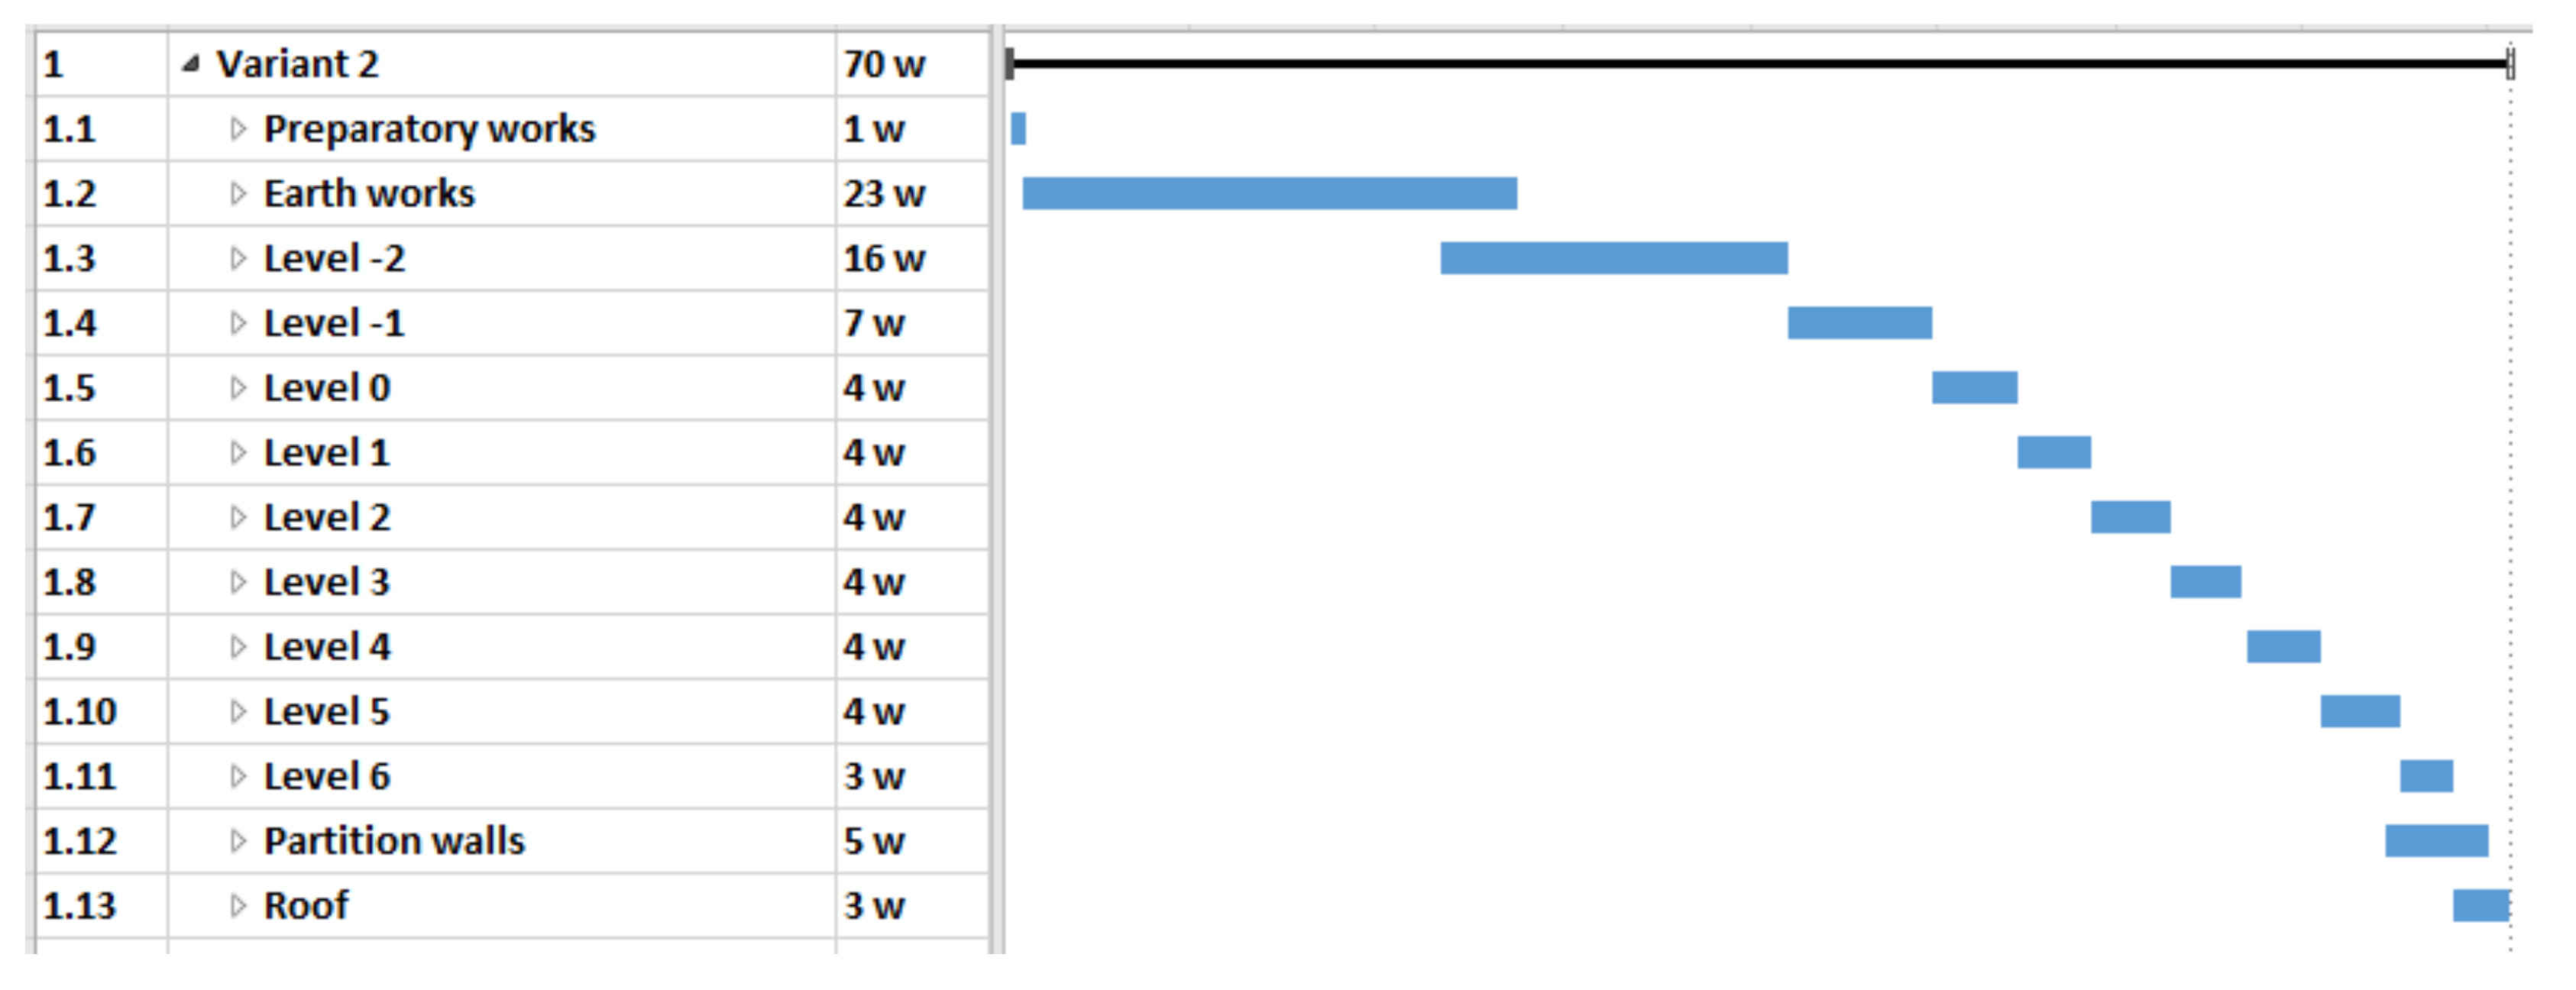
- variant 2 (V2)—main structural elements in the prefabricated elements technology (Figure 4),
- variant 3 (V3)—mixed technology with the ceiling which consists of beams with a spatial truss and blocks made of light aggregate concrete (after laying the beams and blocks, the ceiling is flooded with concrete) (Figure 5).
3.1.2. Value Analysis
3.1.3. Project Update
3.1.4. UPS Optimization
3.1.5. MRCPS Optimization and Materials/Technology Selection
3.1.6. Variant Selection
4. Discussion
- It is possible to improve the functionality/usability of the facility by using appropriate materials and technological solutions.
- It is possible to obtain a reliable assessment result and to select the variant of the undertaking most adequate to the formulated expectations of the decisionmaker.
- It is possible to optimize the construction schedule by considering the economic and utility value of a construction project with the use of artificial intelligence tools.
- Artificial neural networks can be effectively used to support the metaheuristic algorithm to improve project outcomes.
5. Conclusions
Funding
Institutional Review Board Statement
Informed Consent Statement
Conflicts of Interest
Appendix A
Appendix B

Appendix C

References
- Böde, K.; Różycka, A.; Nowak, P. Development of a Pragmatic IT Concept for a Construction Company. Sustainability 2020, 12, 7142. [Google Scholar] [CrossRef]
- Hostetler, M. Beyond design: The importance of construction and post-construction phases in green developments. Sustainability 2010, 2, 1128–1137. [Google Scholar] [CrossRef]
- Ibadov, N.; Kulejewski, J.; Krzemiński, M. Fuzzy ordering of the factors affecting the implementation of construction projects in Poland. In AIP Conference Proceedings; American Institute of Physics: Maryland, LA, USA, 2013; Volume 1558, pp. 1298–1301. [Google Scholar]
- Rosłon, J.; Książek-Nowak, M.; Nowak, P.; Zawistowski, J. Cash-flow schedules optimization within life cycle costing (LCC). Sustainability 2020, 12, 8201. [Google Scholar] [CrossRef]
- Sobieraj, J.; Metelski, D.I.; Nowak, P. The view of construction companies’ managers on the impact of economic, environmental and legal policies on investment process management. Arch. Civ. Eng. 2021, 67, 111–129. [Google Scholar]
- Yepes, V.; García-Segura, T. (Eds.) Sustainable Construction; MDPI: Basel, Switzerland, 2021; ISBN 978-3-0365-0483-4. [Google Scholar]
- Ibadov, N.; Kulejewski, J. Construction projects planning using network model with the fuzzy decision node. Int. J. Environ. Sci. Technol. 2019, 16, 4347–4354. [Google Scholar] [CrossRef]
- Leśniak, A.; Zima, K. Cost calculation of construction projects including sustainability factors using the Case Based Reasoning (CBR) method. Sustainability 2018, 10, 1608. [Google Scholar] [CrossRef]
- Nicał, A.; Anysz, H. The quality management in precast concrete production and delivery processes supported by association analysis. Int. J. Environ. Sci. Technol. 2020, 17, 577–590. [Google Scholar] [CrossRef]
- Rajaprabha, R.; Velumani, P.; Jayanthi, B. Factors affecting the cost of building material in construction projects. Int. J. Sci. Eng. Res. 2016, 4, 1–6. [Google Scholar]
- Górecki, J. Analiza struktury kosztów w budowlanych przedsięwzięciach inwestycyjnych. Czas. Techniczne. Bud. 2010, 107, 111–118. [Google Scholar]
- Sha, K.; Jiang, Z. Improving rural labourers’ status in China’s construction industry. Build. Res. Inf. 2003, 31, 464–473. [Google Scholar] [CrossRef]
- Struktura Ceny Za Roboty Budowlane (Structure of the Price for Construction Works). Available online: https://bzg.pl/poradnik/artykul/struktura-ceny-za-roboty-budowlane/id/19049 (accessed on 5 December 2021).
- Rosłon, J.; Książek-Nowak, M.; Nowak, P. Schedules Optimization with the Use of Value Engineering and NPV Maximization. Sustainability 2020, 12, 7454. [Google Scholar] [CrossRef]
- Akram, S.; Kostrzewa, B.; Minasowicz, A.; Mukherjee, A.; Nowak, P. Value management in construction. In Leonardo da Vinci Program Result; Engineering Faculty of Warsaw University of Technology: Warsaw, Poland, 2011. [Google Scholar]
- Kulejewski, J. Construction project scheduling with imprecisely defined constraints. In Proceedings of the Management and Innovation for a Sustainable Built Environment MISBE 2011, Amsterdam, The Netherlands, 20–23 June 2011; CIB, Working Commissions W55, W65, W89, W112; ENHR and AESP. CIB: Amsterdam, The Netherlands, 2011. [Google Scholar]
- Meredith, J.R.; Shafer, S.M.; Mantel, S.J., Jr. Project Management: A Strategic Managerial Approach; John Wiley & Sons: Hoboken, NJ, USA, 2017. [Google Scholar]
- Rosłon, J.; Zawistowski, J. Construction projects’ indicators improvement using selected metaheuristic algorithms. Procedia Eng. 2016, 153, 595–598. [Google Scholar] [CrossRef][Green Version]
- Gunduz, M.; Almuajebh, M. Critical success factors for sustainable construction project management. Sustainability 2020, 12, 1990. [Google Scholar] [CrossRef]
- El-Sayegh, S.; Ahmad, I.; Aljanabi, M.; Herzallah, R.; Metry, S.; El-Ashwal, O. Construction disputes in the UAE: Causes and resolution methods. Buildings 2020, 10, 171. [Google Scholar] [CrossRef]
- Grzyl, B.; Apollo, M.; Kristowski, A. Application of game theory to conflict management in a construction contract. Sustainability 2019, 11, 1983. [Google Scholar] [CrossRef]
- Rosłon, J.H.; Kulejewski, J.E. A hybrid approach for solving multi-mode resource-constrained project scheduling problem in construction. Open Eng. 2019, 9, 7–13. [Google Scholar] [CrossRef]
- Alizadehsalehi, S.; Hadavi, A.; Huang, J.C. From BIM to extended reality in AEC industry. Autom. Constr. 2020, 116, 103254. [Google Scholar] [CrossRef]
- Sami Ur Rehman, M.; Thaheem, M.J.; Nasir, A.R.; Khan, K.I.A. Project schedule risk management through building information modelling. Int. J. Constr. Manag. 2020, 1–11. [Google Scholar] [CrossRef]
- Pan, Y.; Zhang, L. A BIM-data mining integrated digital twin framework for advanced project management. Autom. Constr. 2021, 124, 103564. [Google Scholar] [CrossRef]
- Yitmen, I.; Alizadehsalehi, S. Towards a Digital Twin-based Smart Built Environment. In BIM-Enabled Cognitive Computing for Smart Built Environment; CRC Press: Boca Raton, FL, USA, 2021; pp. 21–44. [Google Scholar]
- Alizadehsalehi, S.; Hadavi, A.; Huang, J.C. BIM/MR-Lean construction project delivery management system. In 2019 IEEE Technology & Engineering Management Conference (TEMSCON); IEEE: Piscataway, NJ, USA, 2019; pp. 1–6. [Google Scholar]
- Liao, T.W.; Egbelu, P.J.; Sarker, B.R.; Leu, S.S. Metaheuristics for project and construction management–A state-of-the-art review. Autom. Constr. 2011, 20, 491–505. [Google Scholar] [CrossRef]
- Zhou, J.; Love, P.E.; Wang, X.; Teo, K.L.; Irani, Z. A review of methods and algorithms for optimizing construction scheduling. J. Oper. Res. Soc. 2013, 64, 1091–1105. [Google Scholar] [CrossRef]
- Fartookzadeh, H.R.; Fartookzadeh, M. Value Engineering and Function Analysis: Frameworks for Innovation in Antenna Systems. Challenges 2018, 9, 20. [Google Scholar] [CrossRef]
- Kineber, A.F.; Othman, I.; Oke, A.E.; Chileshe, N.; Buniya, M.K. Identifying and assessing sustainable value management implementation activities in developing countries: The case of Egypt. Sustainability 2020, 12, 9143. [Google Scholar] [CrossRef]
- Kelly, J.; Male, S.; Graham, D.; Male, S.; Graham, D. Value management of construction projects. In Oxford: Blackwell Science; Blackwell Science Publishing Company Ltd.: Hoboken, NJ, USA, 2004; pp. 9–19. [Google Scholar]
- Leung, M.Y.; Ng, S.T.; Cheung, S.O. Improving satisfaction through conflict stimulation and resolution in value management in construction projects. J. Manag. Eng. 2002, 18, 68–75. [Google Scholar] [CrossRef]
- Pritsker, A.A.B.; Waiters, L.J.; Wolfe, P.M. Multiproject scheduling with limited resources: A zero-one programming approach. Manag. Sci. 1969, 16, 93–108. [Google Scholar] [CrossRef]
- Ratajczak-Ropel, E. Multi-mode Resource-Constrained Project Scheduling. In Population-Based Approaches to the Resource-Constrained and Discrete-Continuous Scheduling; Springer: Cham, Switzerland, 2018; pp. 69–97. [Google Scholar]
- Talbot, F.B. Resource-constrained project scheduling with time-resource tradeoffs: The nonpreemptive case. Manag. Sci. 1982, 28, 1197–1210. [Google Scholar] [CrossRef]
- Książek, M.V.; Nowak, P.O.; Kivrak, S.; Rosłon, J.H.; Ustinovichius, L. Computer-aided decision-making in construction project development. J. Civ. Eng. Manag. 2015, 21, 248–259. [Google Scholar] [CrossRef]
- Książek, M.; Nowak, P.; Rosłon, J.; Wieczorek, T. Multicriteria assessment of selected solutions for the building structural walls. Procedia Eng. 2014, 91, 406–411. [Google Scholar] [CrossRef][Green Version]
- Nowak, P.; Książek, M.; Draps, M.; Zawistowski, J. Decision making with use of building information modeling. Procedia Eng. 2016, 153, 519–526. [Google Scholar] [CrossRef][Green Version]
- Wróblewski, R. Analiza Czasowo-Kosztowa Wykonania Budynku Biurowego Domaniewska 37C w Warszawie. Master’s Thesis, Instytut Inżynierii Budowlanej, Politechnika Warszawska, Warsaw, Poland, 2018. [Google Scholar]
- Siksnelyte, I.; Zavadskas, E.K.; Streimikiene, D.; Sharma, D. An overview of multi-criteria decision-making methods in dealing with sustainable energy development issues. Energies 2018, 11, 2754. [Google Scholar] [CrossRef]




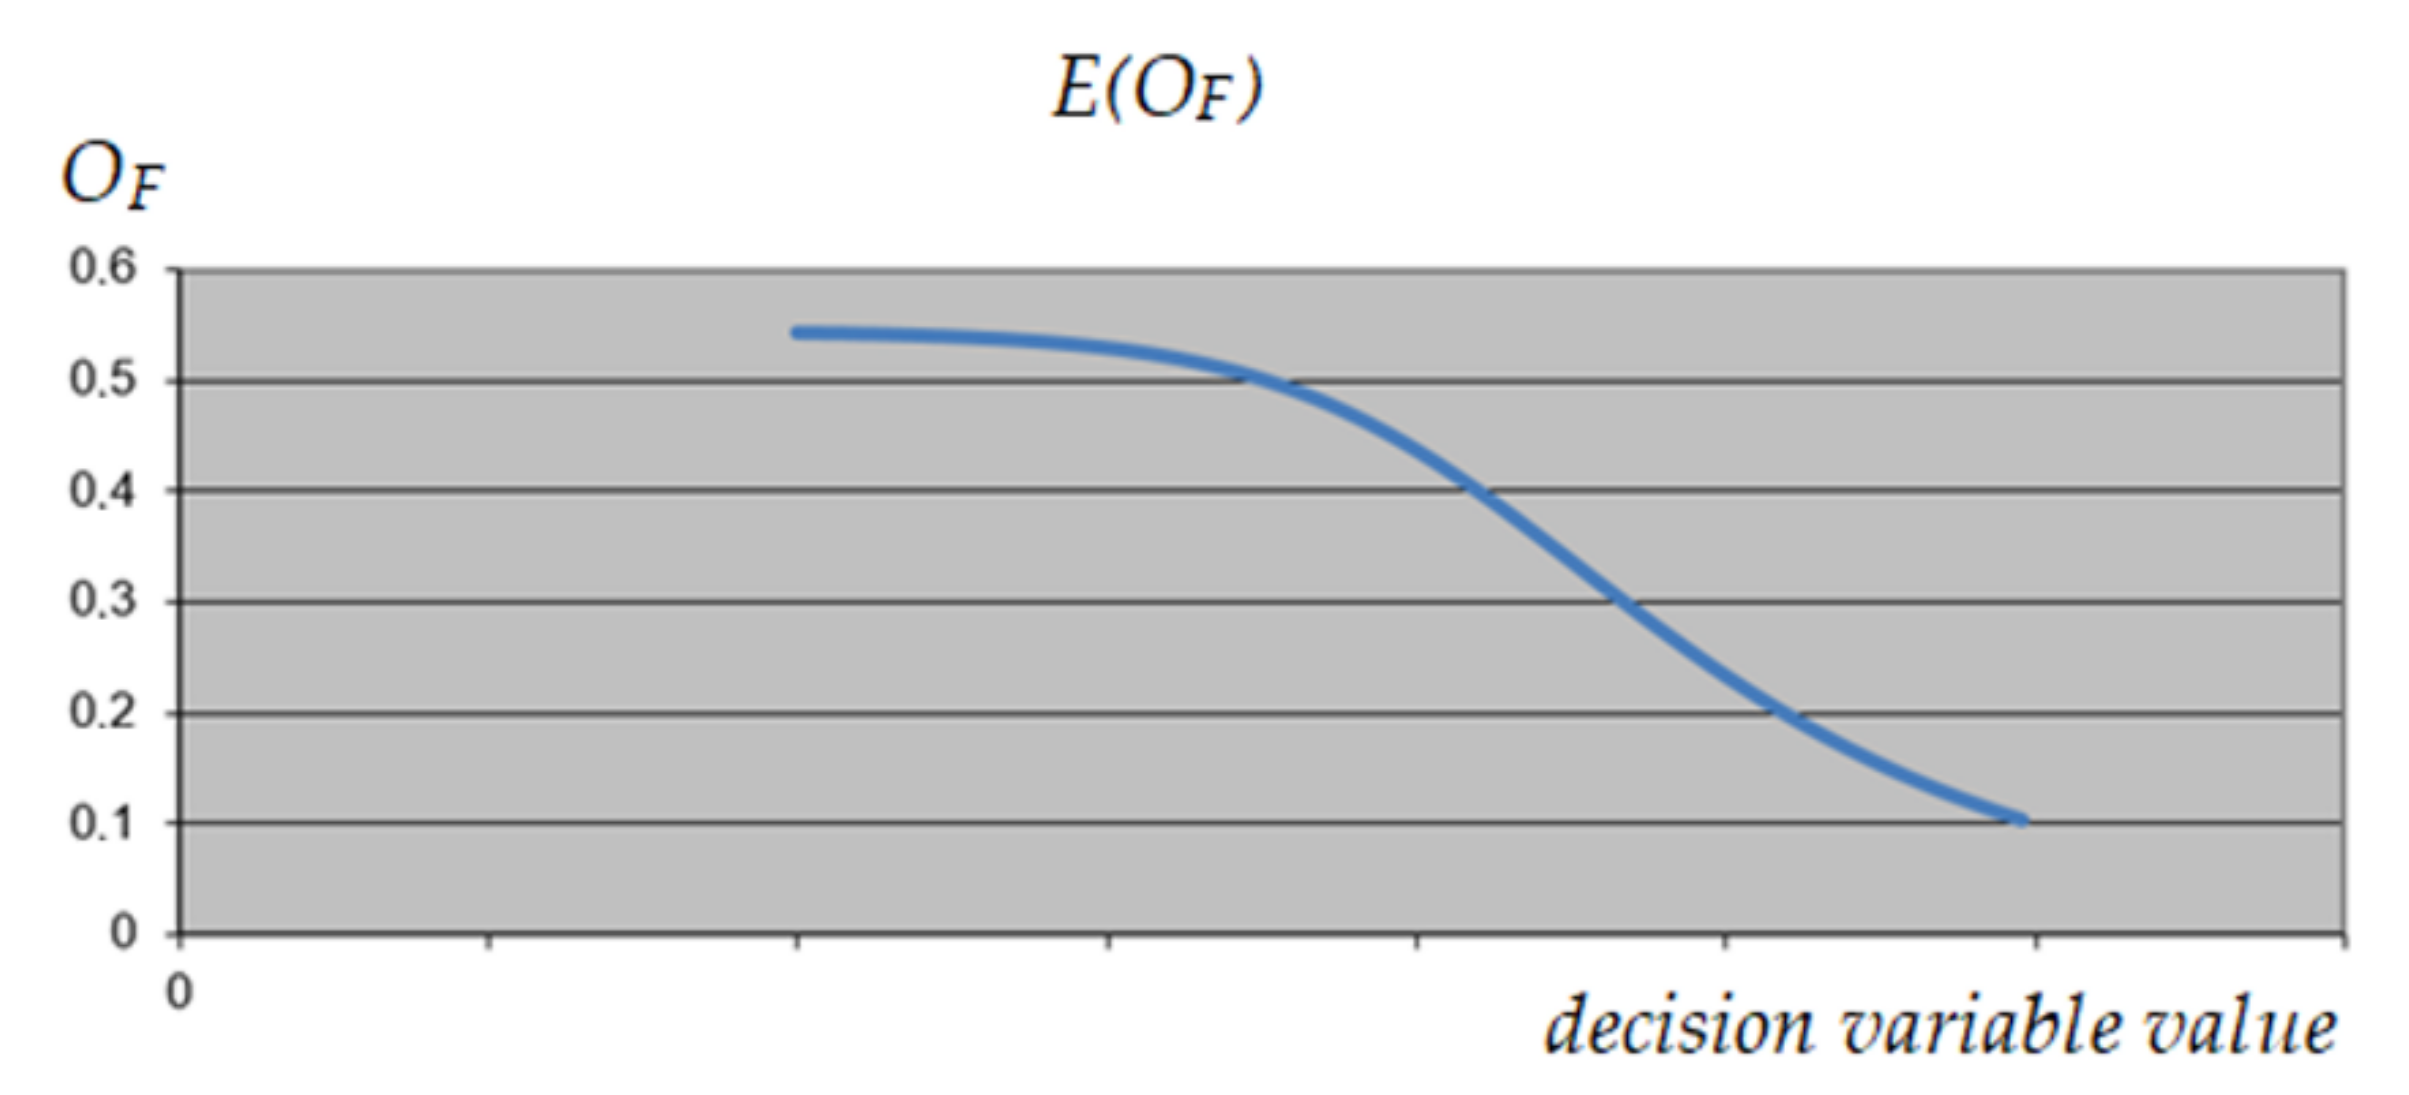
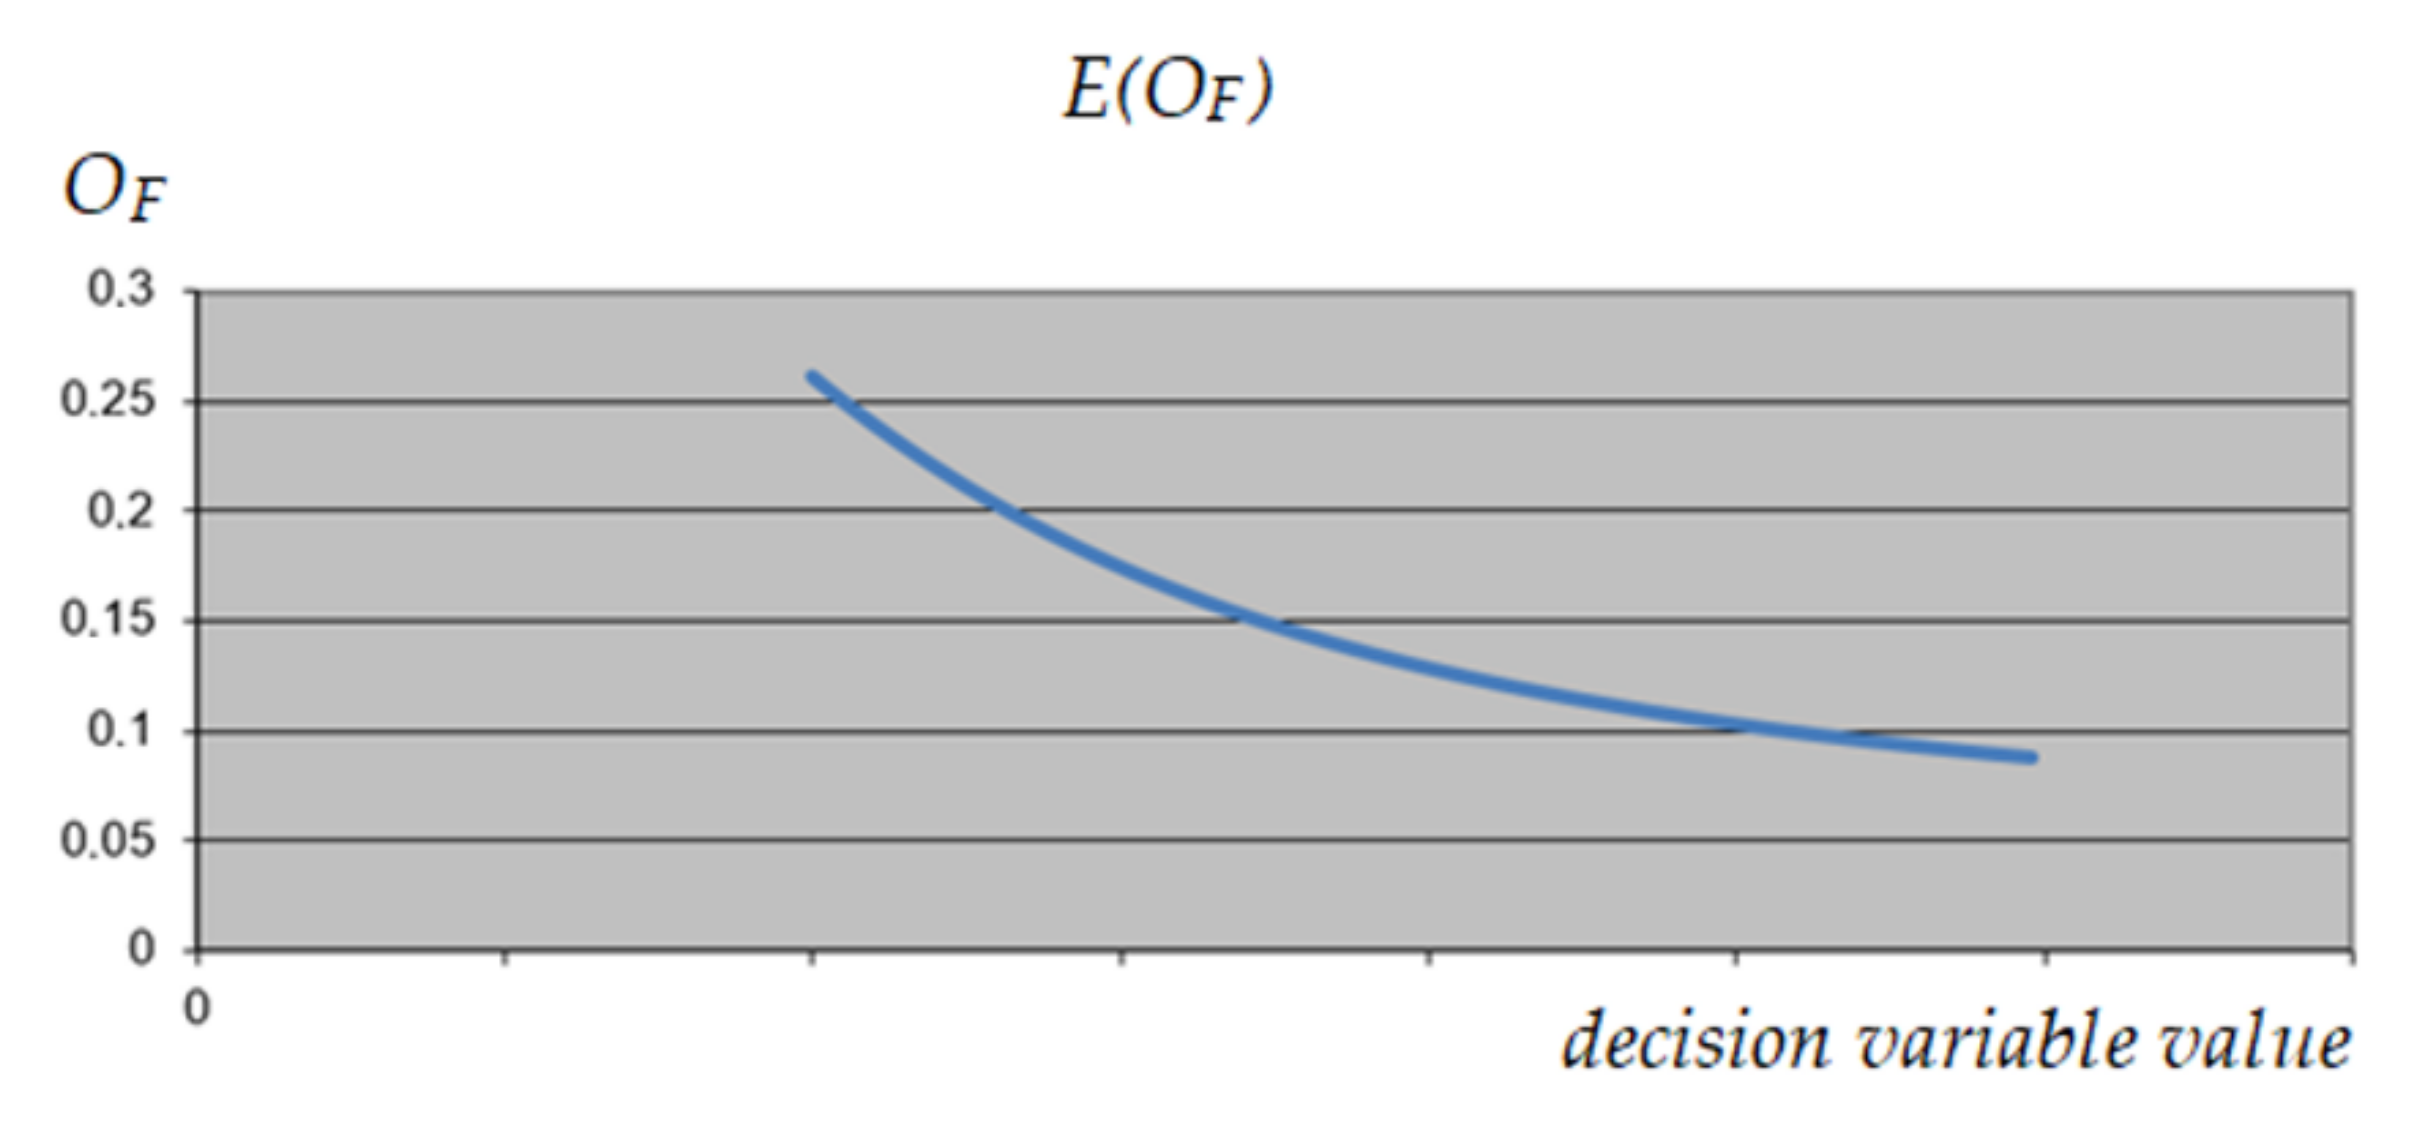
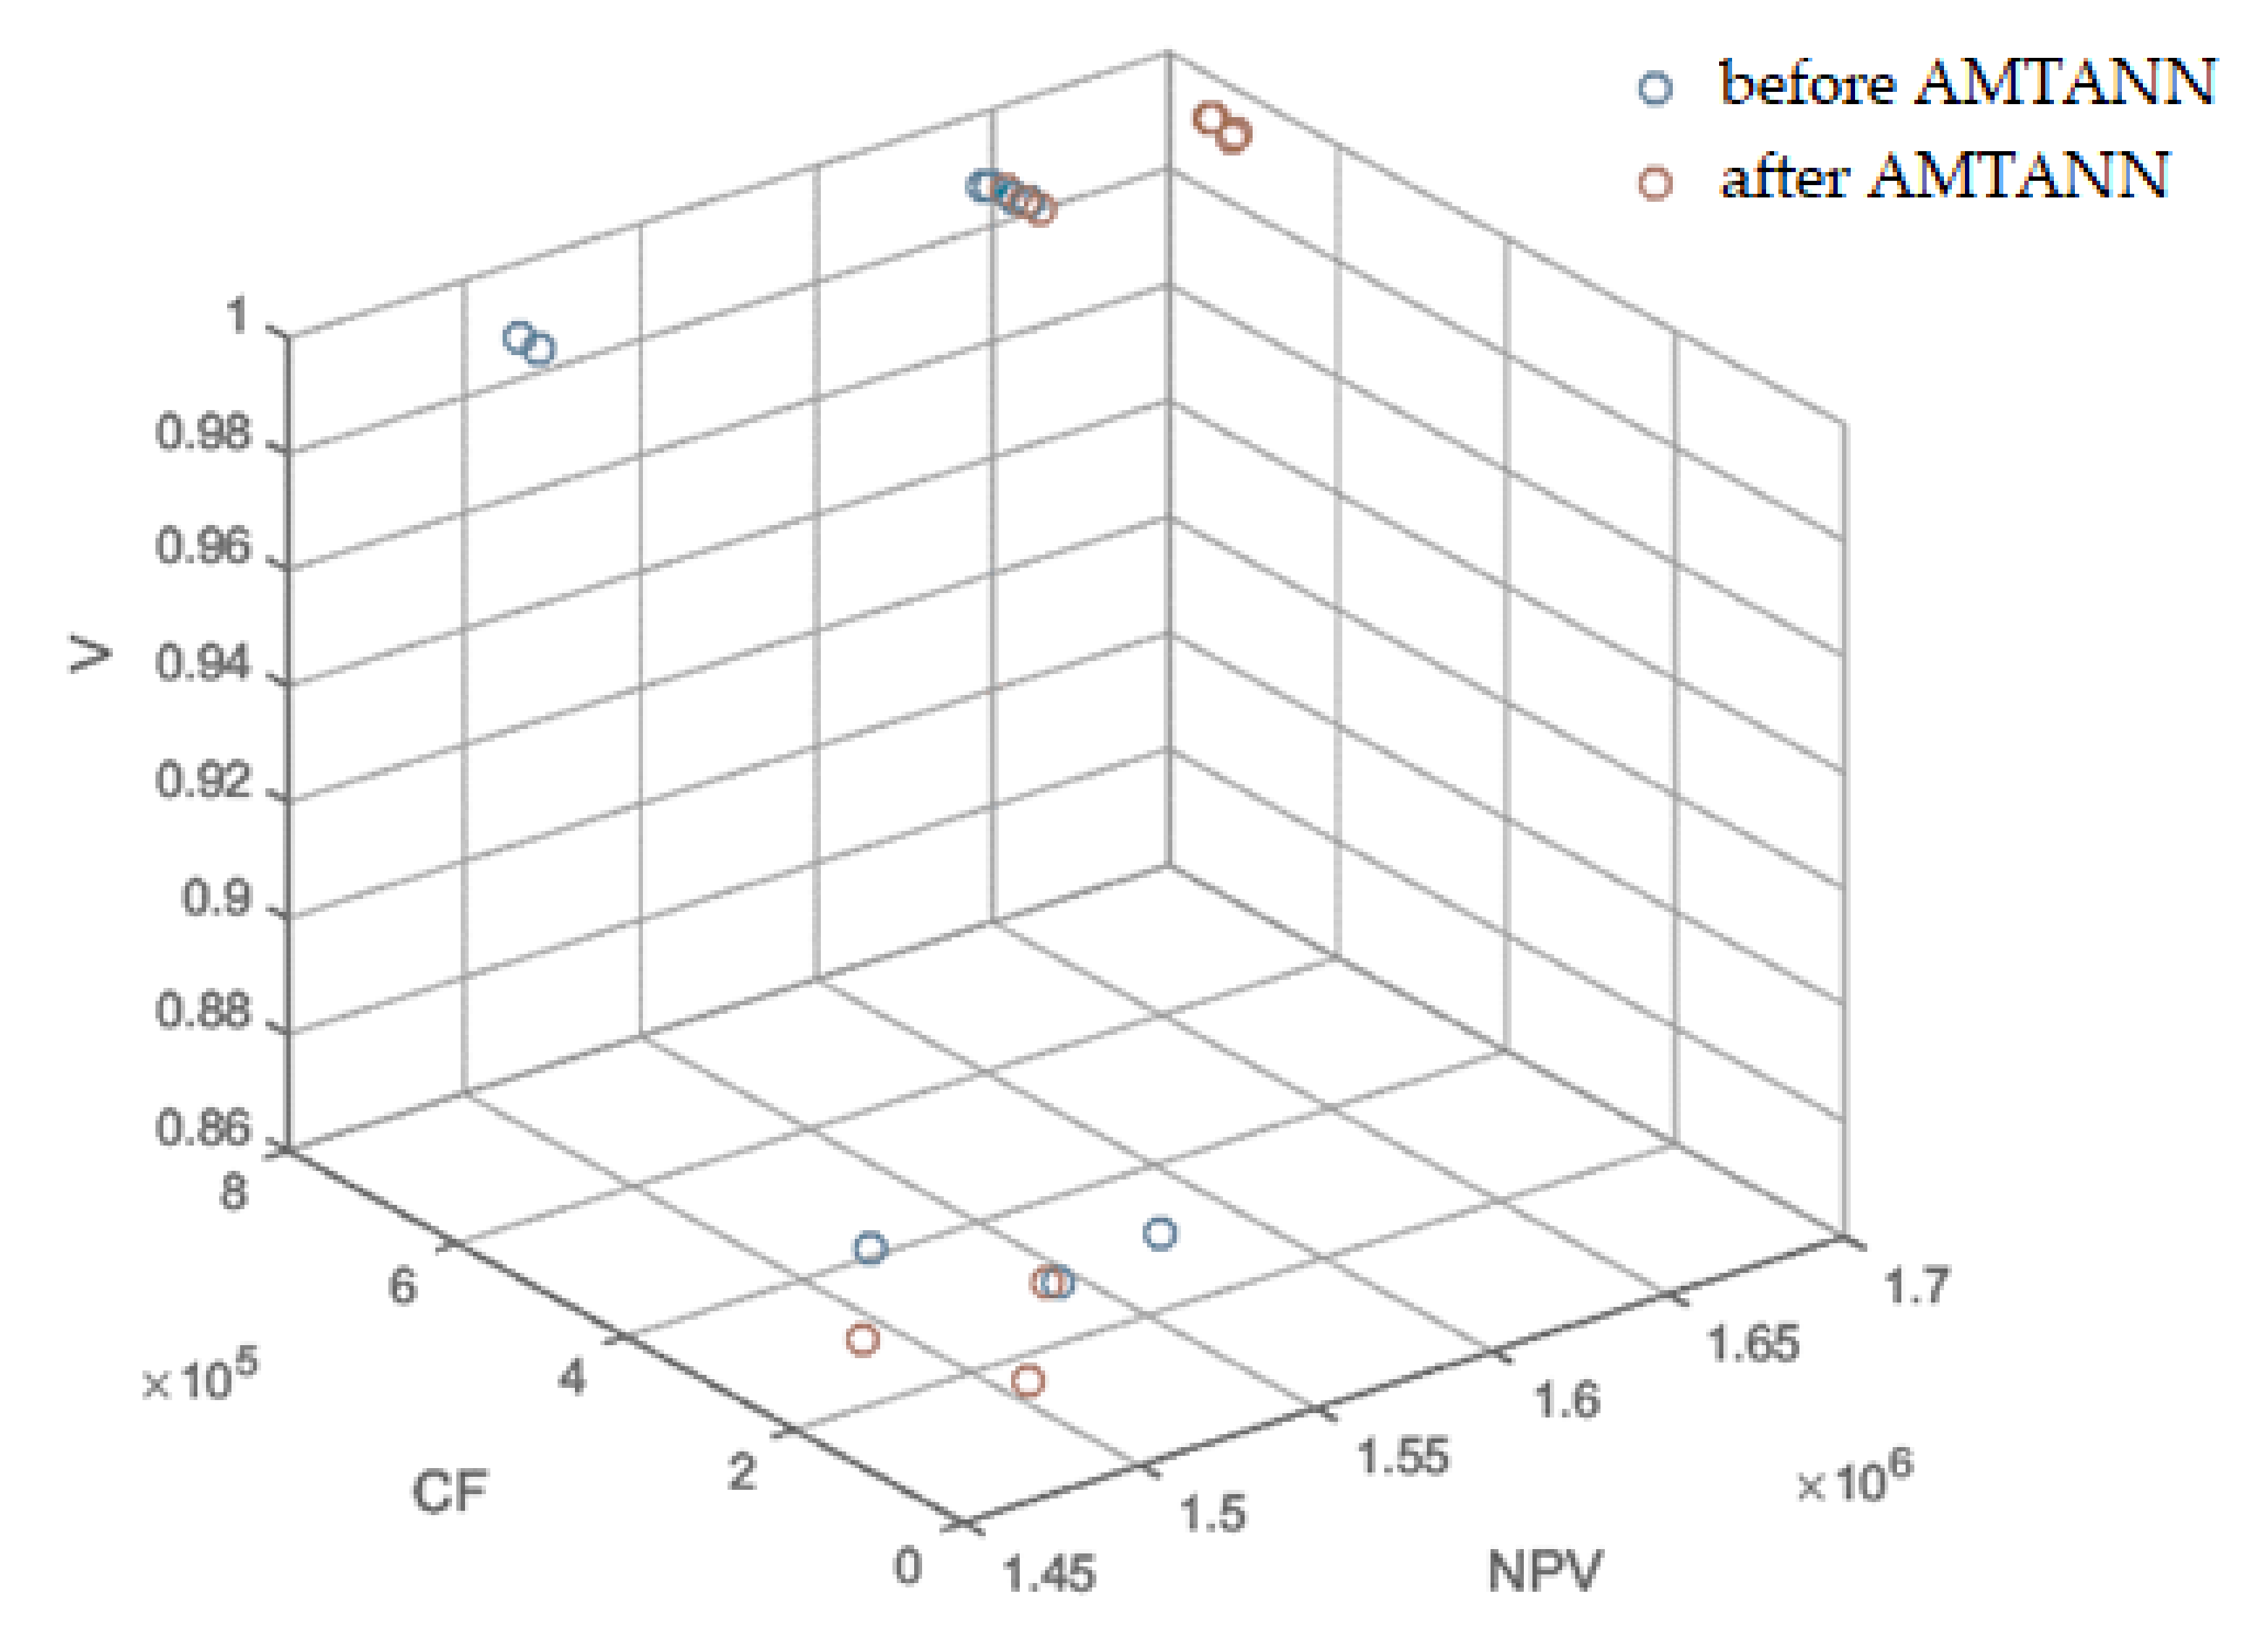
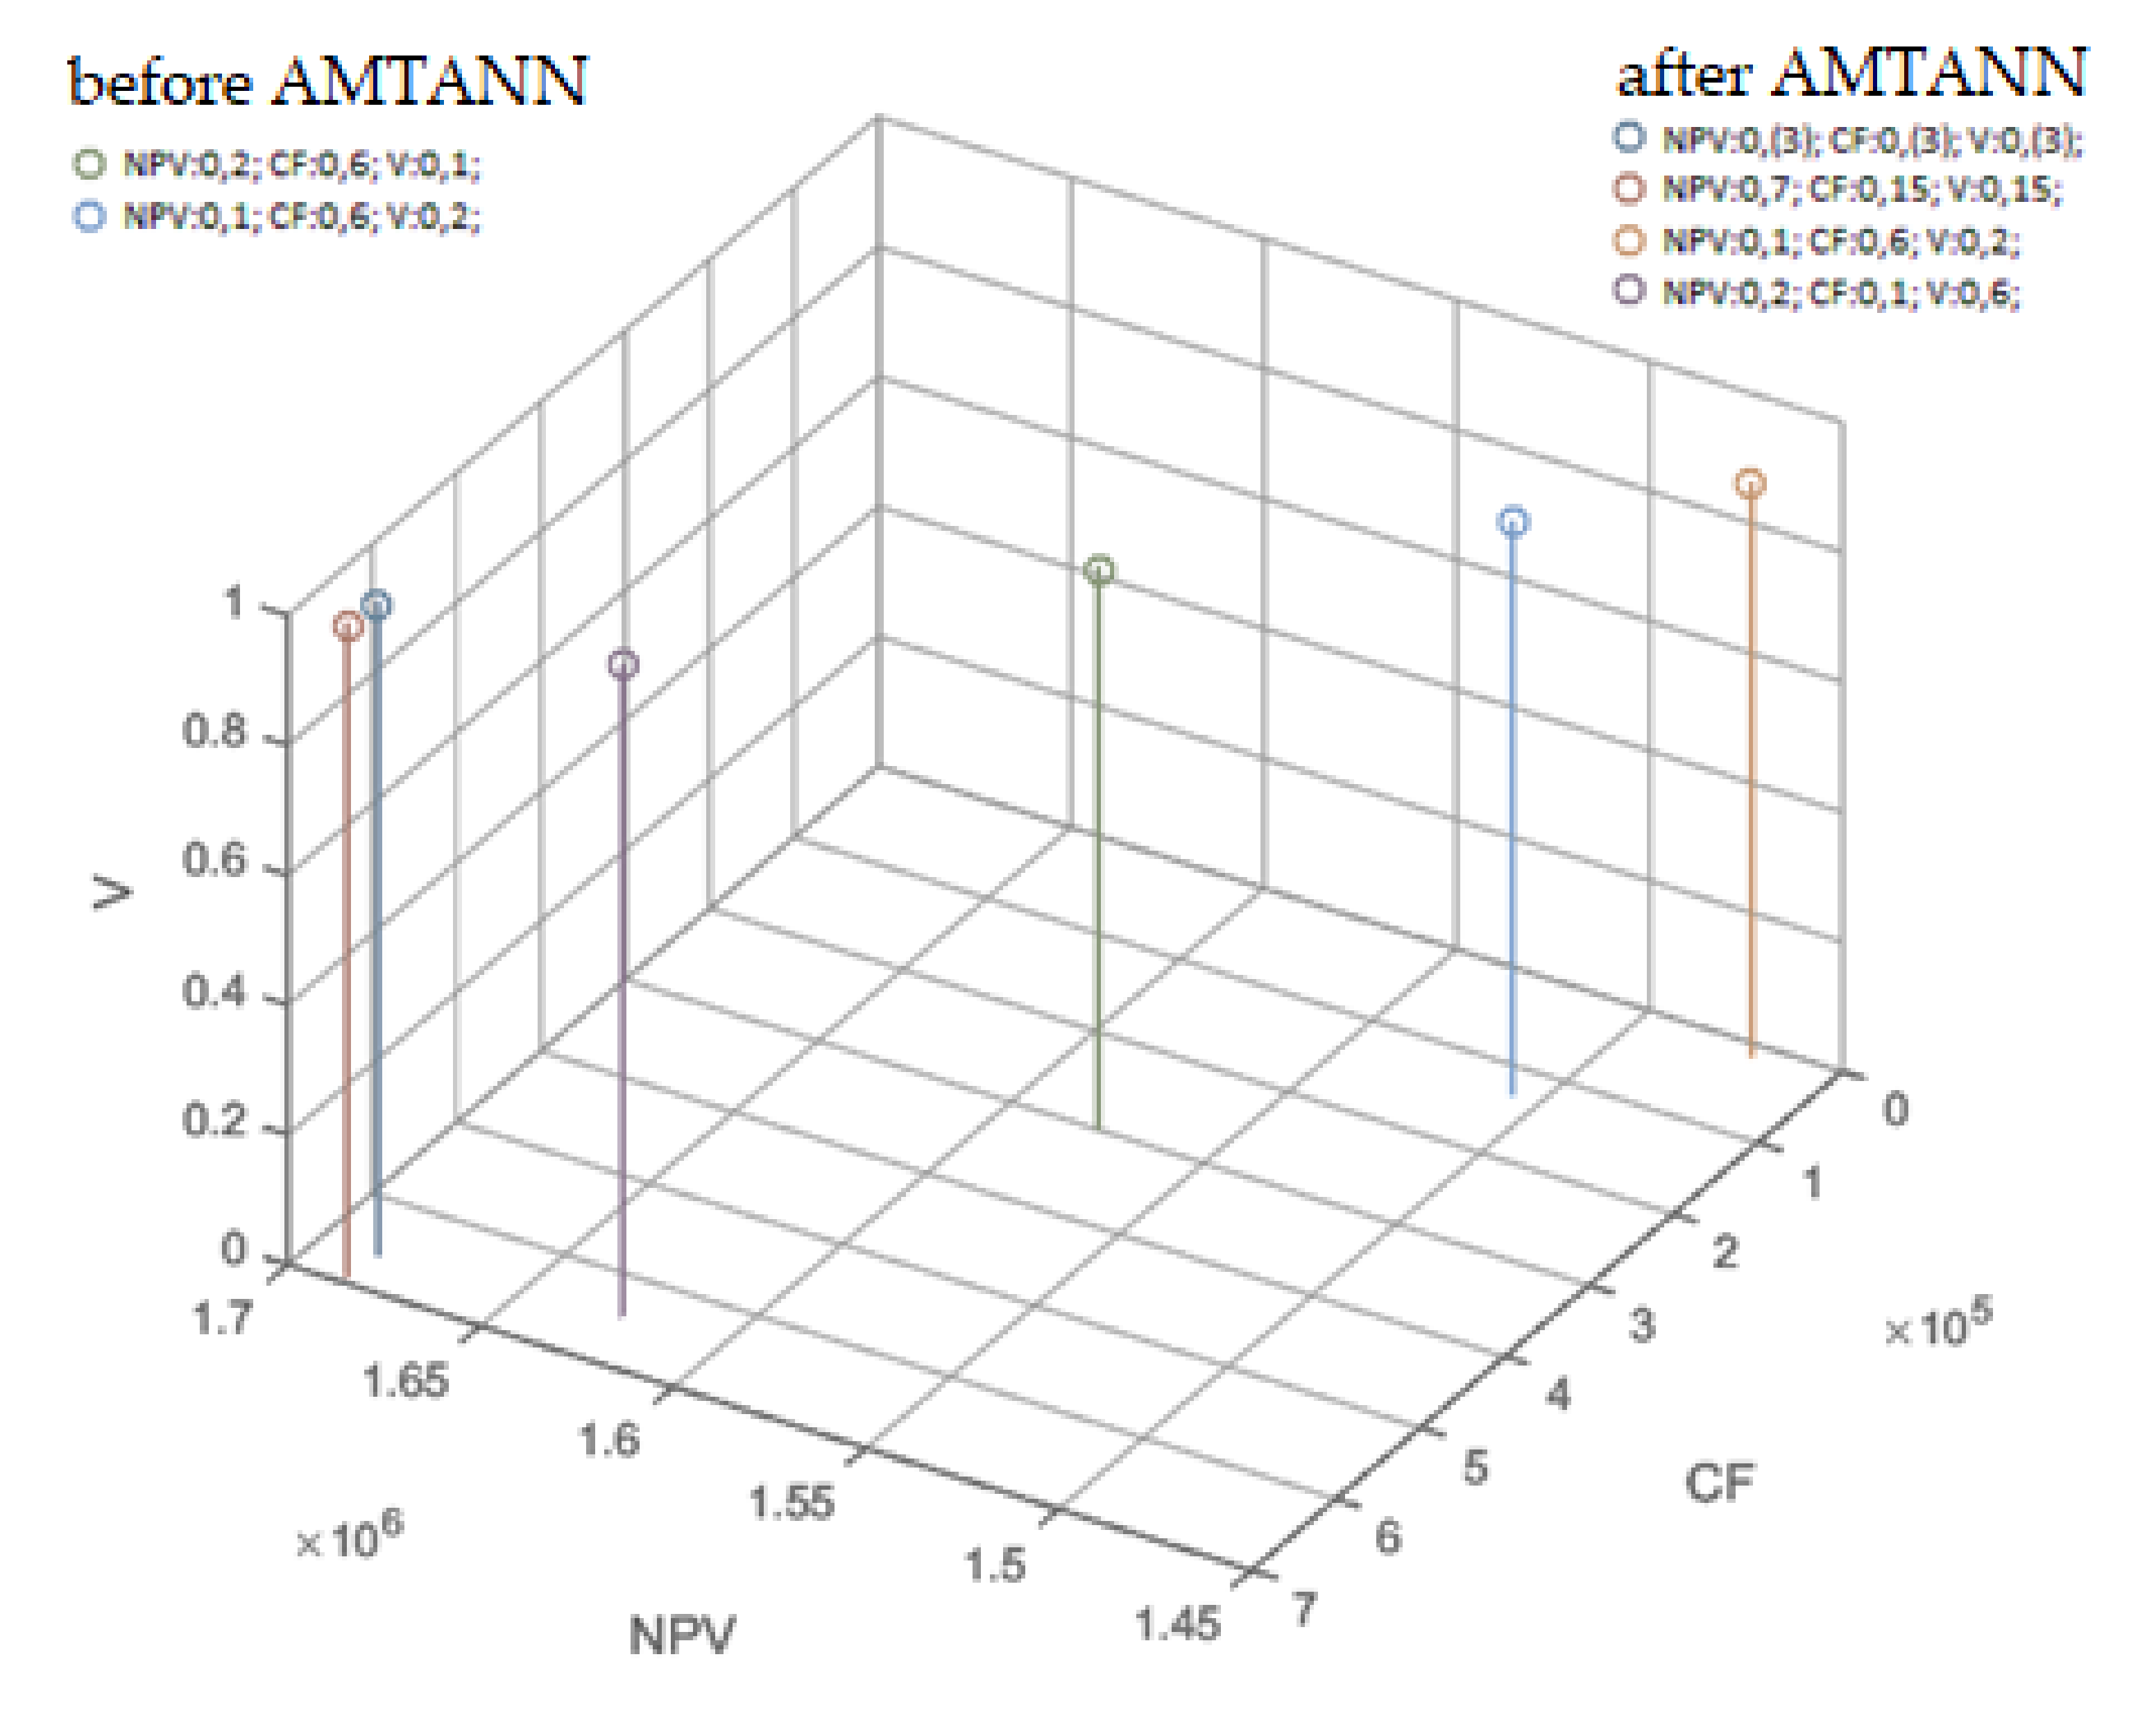

| ID | Data | Units | Value |
|---|---|---|---|
| 1 | Number of underground stories | - | 2 |
| 2 | Number of above-ground stories | - | 7 |
| 3 | Ground floor level | m above water level | 24.5 |
| 4 | Total area | m2 | 44,875.67 |
| 4.a | Underground area | m2 | 14,426.03 |
| 4.b | Above-ground area | m2 | 30,449.64 |
| 5 | Usable area | m2 | 36,784.17 |
| 5.a | Office area | m2 | 22,445.40 |
| 5.b | Service premises area (ground floor) | m2 | 1,042.59 |
| 5.c | Auxiliary area | m2 | 1,483.98 |
| 5.d | Garage area | m2 | 12,051.53 |
| 6 | Traffic area | m2 | 2454.82 |
| 7 | Cubature | m3 | 169,124.90 |
| 7.a | Underground volume | m3 | 55,251.68 |
| 7.b | Above-ground volume | m3 | 113,873.30 |
| 8 | Approximate number of employees | - | 2556 |
| 9 | Parking spaces | unit | 431 |
| 9.a | In the garage | unit | 394 |
| 9.b | Outside of the building | unit | 41 |
| 9.c | Number of parking spaces per 1000 m2 of service area | - | 25 |
| 9.d | Number of parking spaces per 1000 m2 of office area | - | 18 |
| Task | Variant 1 | Variant 2 | Variant 3 | |
|---|---|---|---|---|
| ID | Name | Description | Description | Description |
| - | - | Monolithic construction | Prefabricated technology | Mixed technology with the use of light aggregate concrete blocks |
| 1 | Start | - | - | - |
| 2 | Preparatory works | Site fencing, tree clearing, temporary road laying, container assembly (the same for all variants) | ||
| 3 | Earth works | Removal of plant soil, diaphragm walls, excavations, ceiling trim of level -2, temporary columns, excavation of level -2 (the same for all variants) | ||
| 4 | Level -2 | Lean concrete under the bottom slab, bottom slab, reinforced concrete columns, reinforced concrete walls, entry ramp, reinforced concrete stairs (the same for all variants) | ||
| 5 | Level -1: Columns | Reinforced concrete columns formed in the system formwork. | Prefabricated columns | Prefabricated columns |
| 6 | Level -1: Walls 1 | Reinforced concrete walls 25 cm thick (the same for all variants) | ||
| 7 | Level -1: Walls 2 | Reinforced concrete walls 20 cm thick (the same for all variants) | ||
| 8 | Level -1: Access ramp | Reinforced concrete ramp 25 cm thick (the same for all variants) | ||
| 9 | Level -1: Stairs, beams, joists | Reinforced concrete landings and flights of staircases with a slab thickness of 15 cm; reinforced concrete beams 50 cm × 30 cm; reinforcement degree: 110 kg/m3 | Prefabricated stairs and beams | Prefabricated stairs and beams |
| 10 | Level -1: Ceilings | Monolithic reinforced concrete ceilings, 28 cm thick, with a degree of reinforcement of 95 kg/m3 | Ceilings made of prefabricated hollow-core slabs | Thick-ribbed ceiling |
| 11 | Level 0: Columns | Reinforced concrete columns formed in the system formwork | Prefabricated columns | Prefabricated columns |
| 12 | Level 0: Walls 1 | Reinforced concrete walls 25 cm thick (the same for all variants) | ||
| 13 | Level 0: Walls 2 | Reinforced concrete walls 20 cm thick (the same for all variants) | ||
| 14 | Level 0: Stairs | Reinforced concrete landings and flights of staircases with a slab thickness of 15 cm | Prefabricated stairs | Reinforced concrete landings and flights of staircases with a slab thickness of 15 cm |
| 15 | Level 0: Beams, joists | Reinforced concrete beams 50 cm × 30 cm; reinforcement degree: 110 kg/m3 | Prefabricated beams 600 cm × 30 cm × 30 cm | Prefabricated beams 600 cm × 30 cm × 30 cm |
| 16 | Level 0: Ceilings | Monolithic reinforced concrete ceilings, 28 cm thick, with a degree of reinforcement of 95 kg/m3 | Ceilings made of prefabricated hollow-core slabs | Thick-ribbed ceiling |
| 17 | Level 1: Columns | Reinforced concrete columns formed in the system formwork | Prefabricated columns | Prefabricated columns |
| 18 | Level 1: Walls 1 | Reinforced concrete walls 25 cm thick (the same for all variants) | ||
| 19 | Level 1: Walls 2 | Reinforced concrete walls 20 cm thick (the same for all variants) | ||
| 20 | Level 1: Stairs | Reinforced concrete landings and flights of staircases with a slab thickness of 15 cm | Prefabricated stairs | Reinforced concrete landings and flights of staircases with a slab thickness of 15 cm |
| 21 | Level 1: Beams, joists | Reinforced concrete beams 50 cm × 30 cm. Reinforcement degree: 110 kg/m3 | Prefabricated beams 600 cm × 30 cm × 30 cm | Prefabricated beams 600 cm × 30 cm × 30 cm |
| 22 | Level 1: Ceilings | Monolithic reinforced concrete ceilings, 28 cm thick, with a degree of reinforcement of 95 kg/m3 | Ceilings made of prefabricated hollow-core slabs | Thick-ribbed ceiling |
| 23 | Level 2: Columns | Reinforced concrete columns formed in the system formwork | Prefabricated columns | Prefabricated columns |
| 24 | Level 2: Walls 1 | Reinforced concrete walls 25 cm thick (the same for all variants) | ||
| 25 | Level 2: Walls 2 | Reinforced concrete walls 20 cm thick (the same for all variants) | ||
| 26 | Level 2: Stairs | Reinforced concrete landings and flights of staircases with a slab thickness of 15 cm | Prefabricated stairs | Reinforced concrete landings and flights of staircases with a slab thickness of 15 cm |
| 27 | Level 2: Beams, joists | Reinforced concrete beams 50 cm × 30 cm; reinforcement degree: 110 kg/m3 | Prefabricated beams 600 cm × 30 cm × 30 cm | Prefabricated beams 600 cm × 30 cm × 30 cm |
| 28 | Level 2: Ceilings | Monolithic reinforced concrete ceilings, 28 cm thick, with a degree of reinforcement of 95 kg/m3 | Ceilings made of prefabricated hollow-core slabs | Thick-ribbed ceiling |
| 29 | Level 3: Columns | Reinforced concrete columns formed in the system formwork | Prefabricated columns | Prefabricated columns |
| 30 | Level 3: Walls 1 | Reinforced concrete walls 25 cm thick (the same for all variants) | ||
| 31 | Level 3: Walls 2 | Reinforced concrete walls 20 cm thick (the same for all variants) | ||
| 32 | Level 3: Stairs | Reinforced concrete landings and flights of staircases with a slab thickness of 15 cm | Prefabricated stairs | Reinforced concrete landings and flights of staircases with a slab thickness of 15 cm |
| 33 | Level 3: Beams, joists | Reinforced concrete beams 50 cm × 30 cm; reinforcement degree: 110 kg/m3 | Prefabricated beams 600 cm × 30 cm × 30 cm | Prefabricated beams 600 cm × 30 cm × 30 cm |
| 34 | Level 3: Ceilings | Monolithic reinforced concrete ceilings, 28 cm thick, with a degree of reinforcement of 95 kg/m3 | Ceilings made of prefabricated hollow-core slabs | Thick-ribbed ceiling |
| 35 | Level 4: Columns | Reinforced concrete columns formed in the system formwork | Prefabricated columns | Prefabricated columns |
| 36 | Level 4: Walls 1 | Reinforced concrete walls 25 cm thick (the same for all variants) | ||
| 37 | Level 4: Walls 2 | Reinforced concrete walls 20 cm thick (the same for all variants) | ||
| 38 | Level 4: Stairs | Reinforced concrete landings and flights of staircases with a slab thickness of 15 cm | Prefabricated stairs | Reinforced concrete landings and flights of staircases with a slab thickness of 15 cm |
| 39 | Level 4: Beams, joists | Reinforced concrete beams 50 cm × 30 cm; reinforcement degree: 110 kg/m3 | Prefabricated beams 600 cm × 30 cm × 30 cm | Prefabricated beams 600 cm × 30 cm × 30 cm |
| 40 | Level 4: Ceilings | Monolithic reinforced concrete ceilings, 28 cm thick, with a degree of reinforcement of 95 kg/m3 | Ceilings made of prefabricated hollow-core slabs | Thick-ribbed ceiling |
| 41 | Level 5: Columns | Reinforced concrete columns formed in the system formwork | Prefabricated columns | Prefabricated columns |
| 42 | Level 5: Walls 1 | Reinforced concrete walls 25 cm thick (the same for all variants) | ||
| 43 | Level 5: Walls 2 | Reinforced concrete walls 20 cm thick (the same for all variants) | ||
| 44 | Level 5: Stairs | Reinforced concrete landings and flights of staircases with a slab thickness of 15 cm | Prefabricated stairs | Reinforced concrete landings and flights of staircases with a slab thickness of 15 cm |
| 45 | Level 5: Beams, joists | Reinforced concrete beams 50 cm × 30 cm; reinforcement degree: 110 kg/m3. | Prefabricated beams 600 cm × 30 cm × 30 cm | Prefabricated beams 600 cm × 30 cm × 30 cm |
| 46 | Level 5: Ceilings | Monolithic reinforced concrete ceilings, 28 cm thick; reinforcement degree: 95 kg/m3 | Ceilings made of prefabricated hollow-core slabs | Thick-ribbed ceiling |
| 47 | Level 6: Columns | Reinforced concrete columns formed in the system formwork | Prefabricated columns | Prefabricated columns |
| 48 | Level 6: Walls 1 | Reinforced concrete walls 25 cm thick (the same for all variants) | ||
| 49 | Level 6: Walls 2 | Reinforced concrete walls 20 cm thick (the same for all variants) | ||
| 50 | Level 6: Stairs | Reinforced concrete landings and flights of staircases with a slab thickness of 15 cm | Prefabricated stairs | Reinforced concrete landings and flights of staircases with a slab thickness of 15 cm |
| 51 | Level 6: Beams, joists | Reinforced concrete beams 50 cm × 30 cm; reinforcement degree: 110 kg/m3 | Prefabricated beams 600 cm × 30 cm × 30 cm | Prefabricated beams 600 cm × 30 cm × 30 cm |
| 52 | Partition walls | NIDA plasterboards | SILKA sand-lime blocks | YTONG cellular concrete |
| 53 | Roof | Reinforced concrete roof, 28 cm thick; reinforcement degree: 95 kg/m3 | Ceilings made of prefabricated hollow-core slabs | Thick-ribbed ceiling |
| 54 | Finish | - | - | - |
| Variant 1 | Variant 2 | Variant 3 | ||||||||||||||||
|---|---|---|---|---|---|---|---|---|---|---|---|---|---|---|---|---|---|---|
| ID | Cost [1000 EUR] | Duration [Weeks] | Value V | Z1 | Z2 | Z3 | Cost [1000 EUR] | Duration [Weeks] | Value V | Z1 | Z2 | Z3 | Cost [1000 EUR] | Duration [Weeks] | Value V | Z1 | Z2 | Z3 |
| 1 | 0.0 | 0 | 1.00 | 0 | 0 | 0 | 0.0 | 0 | 1.00 | 0 | 0 | 0 | 0.0 | 0 | 1.00 | 0 | 0 | 0 |
| 2 | 203.5 | 1 | 1.00 | 10 | 0 | 1 | 203.5 | 1 | 1.00 | 10 | 0 | 1 | 203.5 | 1 | 1.00 | 10 | 0 | 1 |
| 3 | 6714.0 | 23 | 1.00 | 24 | 0 | 0 | 6714.0 | 23 | 1.00 | 24 | 0 | 0 | 6714.0 | 23 | 1.00 | 24 | 0 | 0 |
| 4 | 5875.0 | 16 | 1.00 | 28 | 2 | 0 | 5875.0 | 16 | 1.00 | 28 | 2 | 0 | 5875.0 | 16 | 1.00 | 28 | 2 | 0 |
| 5 | 245.7 | 3 | 1.00 | 22 | 2 | 0 | 285.5 | 1 | 0.87 | 12 | 0 | 1 | 285.5 | 1 | 0.85 | 12 | 0 | 1 |
| 6 | 65.3 | 3 | 1.00 | 28 | 2 | 0 | 65.3 | 3 | 0.87 | 28 | 2 | 0 | 65.3 | 3 | 0.85 | 28 | 2 | 0 |
| 7 | 303.3 | 4 | 1.00 | 28 | 2 | 0 | 303.3 | 4 | 0.87 | 28 | 2 | 0 | 303.3 | 4 | 0.85 | 28 | 2 | 0 |
| 8 | 85.0 | 1 | 1.00 | 16 | 1 | 0 | 85.0 | 1 | 1.00 | 16 | 1 | 0 | 85.0 | 1 | 1.00 | 16 | 1 | 0 |
| 9 | 16.4 | 1 | 1.00 | 12 | 1 | 0 | 172.9 | 1 | 0.87 | 24 | 0 | 2 | 178.1 | 3 | 0.85 | 12 | 1 | 0 |
| 10 | 2068.3 | 7 | 1.00 | 40 | 2 | 0 | 902.6 | 2 | 0.87 | 12 | 0 | 2 | 1238.0 | 4 | 0.85 | 20 | 0 | 0 |
| 11 | 215.3 | 3 | 1.00 | 16 | 1 | 0 | 357.3 | 2 | 0.87 | 8 | 0 | 1 | 357.3 | 2 | 0.85 | 8 | 0 | 1 |
| 12 | 192.7 | 3 | 1.00 | 32 | 2 | 0 | 192.7 | 3 | 0.87 | 32 | 2 | 0 | 192.7 | 3 | 0.85 | 32 | 2 | 0 |
| 13 | 16.3 | 1 | 1.00 | 32 | 2 | 0 | 16.3 | 1 | 0.87 | 32 | 2 | 0 | 16.3 | 1 | 0.85 | 32 | 2 | 0 |
| 14 | 16.3 | 1 | 1.00 | 8 | 2 | 0 | 0 * | 0 | 0.87 | 0 | 0 | 0 | 16.3 | 1 | 0.85 | 8 | 1 | 0 |
| 15 | 30.0 | 2 | 1.00 | 7 | 1 | 0 | 218.8 | 1 | 0.87 | 8 | 0 | 1 | 196.2 | 1 | 0.85 | 7 | 0 | 1 |
| 16 | 920.2 | 2 | 1.00 | 40 | 2 | 0 | 480.3 | 1 | 0.87 | 12 | 0 | 2 | 659.0 | 2 | 0.85 | 20 | 0 | 0 |
| 17 | 180.9 | 2 | 1.00 | 16 | 1 | 0 | 299.1 | 1 | 0.87 | 12 | 0 | 1 | 299.3 | 1 | 0.85 | 12 | 0 | 1 |
| 18 | 140.4 | 3 | 1.00 | 32 | 2 | 0 | 140.4 | 3 | 0.87 | 32 | 2 | 0 | 140.4 | 3 | 0.85 | 32 | 2 | 0 |
| 19 | 17.2 | 1 | 1.00 | 32 | 2 | 0 | 17.2 | 1 | 0.87 | 32 | 2 | 0 | 17.2 | 1 | 0.85 | 32 | 2 | 0 |
| 20 | 16.3 | 1 | 1.00 | 16 | 2 | 0 | 0 * | 0 | 0.87 | 0 | 0 | 0 | 16.3 | 1 | 0.85 | 8 | 1 | 0 |
| 21 | 16.9 | 2 | 1.00 | 8 | 1 | 0 | 218.8 | 1 | 0.87 | 8 | 0 | 1 | 196.2 | 1 | 0.85 | 7 | 0 | 1 |
| 22 | 1109.6 | 3 | 1.00 | 40 | 2 | 0 | 573.8 | 1 | 0.87 | 12 | 0 | 2 | 787.4 | 2 | 0.85 | 20 | 0 | 0 |
| 23 | 199.8 | 3 | 1.00 | 16 | 1 | 0 | 339.8 | 1 | 0.87 | 12 | 0 | 1 | 340.1 | 1 | 0.85 | 12 | 0 | 1 |
| 24 | 144.0 | 3 | 1.00 | 32 | 2 | 0 | 144.0 | 3 | 0.87 | 32 | 2 | 0 | 144.0 | 3 | 0.85 | 32 | 2 | 0 |
| 25 | 17.2 | 1 | 1.00 | 32 | 2 | 0 | 17.2 | 1 | 0.87 | 32 | 2 | 0 | 17.2 | 1 | 0.85 | 32 | 2 | 0 |
| 26 | 16.3 | 4 | 1.00 | 16 | 2 | 0 | 0 * | 0 | 0.87 | 0 | 0 | 0 | 16.3 | 1 | 0.85 | 8 | 1 | 0 |
| 27 | 16.9 | 3 | 1.00 | 8 | 1 | 0 | 218.8 | 1 | 0.87 | 8 | 0 | 1 | 196.2 | 1 | 0.85 | 7 | 0 | 1 |
| 28 | 1108.6 | 3 | 1.00 | 40 | 2 | 0 | 572.8 | 1 | 0.87 | 12 | 0 | 2 | 786.3 | 2 | 0.85 | 20 | 0 | 0 |
| 29 | 199.8 | 3 | 1.00 | 16 | 1 | 0 | 339.8 | 1 | 0.87 | 12 | 0 | 1 | 340.1 | 1 | 0.85 | 12 | 0 | 1 |
| 30 | 144.0 | 3 | 1.00 | 32 | 2 | 0 | 144.0 | 3 | 0.87 | 32 | 2 | 0 | 144.0 | 3 | 0.85 | 32 | 2 | 0 |
| 31 | 17.2 | 1 | 1.00 | 32 | 2 | 0 | 17.2 | 1 | 0.87 | 32 | 2 | 0 | 17.2 | 1 | 0.85 | 32 | 2 | 0 |
| 32 | 16.3 | 4 | 1.00 | 16 | 2 | 0 | 0 * | 0 | 0.87 | 0 | 0 | 0 | 16.3 | 1 | 0.85 | 8 | 1 | 0 |
| 33 | 16.9 | 3 | 1.00 | 8 | 1 | 0 | 218.8 | 1 | 0.87 | 8 | 0 | 1 | 196.2 | 1 | 0.85 | 7 | 0 | 1 |
| 34 | 1104.8 | 3 | 1.00 | 40 | 2 | 0 | 572.8 | 1 | 0.87 | 12 | 0 | 2 | 786.3 | 2 | 0.85 | 20 | 0 | 0 |
| 35 | 199.8 | 3 | 1.00 | 16 | 1 | 0 | 339.8 | 1 | 0.87 | 12 | 0 | 1 | 340.1 | 1 | 0.85 | 12 | 0 | 1 |
| 36 | 144.0 | 3 | 1.00 | 32 | 2 | 0 | 144.0 | 3 | 0.87 | 32 | 2 | 0 | 144.0 | 3 | 0.85 | 32 | 2 | 0 |
| 37 | 17.2 | 1 | 1.00 | 32 | 2 | 0 | 17.2 | 1 | 0.87 | 32 | 2 | 0 | 17.2 | 1 | 0.85 | 32 | 2 | 0 |
| 38 | 16.3 | 4 | 1.00 | 16 | 2 | 0 | 0 * | 0 | 0.87 | 0 | 0 | 0 | 16.3 | 1 | 0.85 | 8 | 1 | 0 |
| 39 | 16.9 | 3 | 1.00 | 8 | 1 | 0 | 218.8 | 1 | 0.87 | 8 | 0 | 1 | 196.2 | 1 | 0.85 | 7 | 0 | 1 |
| 40 | 1104.8 | 3 | 1.00 | 40 | 2 | 0 | 572.8 | 1 | 0.87 | 12 | 0 | 2 | 786.3 | 2 | 0.85 | 20 | 0 | 0 |
| 41 | 199.8 | 3 | 1.00 | 16 | 1 | 0 | 339.8 | 1 | 0.87 | 12 | 0 | 1 | 340.1 | 1 | 0.85 | 12 | 0 | 1 |
| 42 | 144.0 | 3 | 1.00 | 32 | 2 | 0 | 144.0 | 3 | 0.87 | 32 | 2 | 0 | 144.0 | 3 | 0.85 | 32 | 2 | 0 |
| 43 | 17.2 | 1 | 1.00 | 32 | 2 | 0 | 17.2 | 1 | 0.87 | 32 | 2 | 0 | 17.2 | 1 | 0.85 | 32 | 2 | 0 |
| 44 | 16.3 | 4 | 1.00 | 16 | 2 | 0 | 0 * | 0 | 0.87 | 0 | 0 | 0 | 16.3 | 1 | 0.85 | 8 | 1 | 0 |
| 45 | 16.9 | 3 | 1.00 | 8 | 1 | 0 | 218.8 | 1 | 0.87 | 8 | 0 | 1 | 196.2 | 1 | 0.85 | 7 | 0 | 1 |
| 46 | 1104.8 | 3 | 1.00 | 40 | 2 | 0 | 572.8 | 1 | 0.87 | 12 | 0 | 2 | 786.3 | 2 | 0.85 | 20 | 0 | 0 |
| 47 | 200.1 | 3 | 1.00 | 16 | 1 | 0 | 339.8 | 1 | 0.87 | 12 | 0 | 1 | 340.1 | 1 | 0.85 | 12 | 0 | 1 |
| 48 | 144.8 | 3 | 1.00 | 32 | 2 | 0 | 144.8 | 3 | 0.87 | 32 | 2 | 0 | 144.8 | 3 | 0.85 | 32 | 2 | 0 |
| 49 | 17.3 | 1 | 1.00 | 32 | 2 | 0 | 17.3 | 1 | 0.87 | 32 | 2 | 0 | 17.3 | 1 | 0.85 | 32 | 2 | 0 |
| 50 | 16.3 | 4 | 1.00 | 16 | 2 | 0 | 0 * | 0 | 0.87 | 0 | 0 | 0 | 16.3 | 1 | 0.85 | 8 | 1 | 0 |
| 51 | 65.4 | 3 | 1.00 | 8 | 1 | 0 | 218.8 | 1 | 0.87 | 8 | 0 | 0 | 196.2 | 1 | 0.85 | 7 | 0 | 1 |
| 52 | 890.4 | 5 | 0.62 | 32 | 0 | 0 | 495.8 | 5 | 1.00 | 32 | 0 | 0 | 416.9 | 4 | 0.99 | 32 | 0 | 0 |
| 53 | 1349.1 | 5 | 1.00 | 32 | 2 | 0 | 716.5 | 3 | 0.87 | 32 | 2 | 0 | 930.2 | 4 | 0.85 | 32 | 2 | 0 |
| 54 | 0.0 | 0 | 1.00 | 0 | 0 | 0 | 0.0 | 0 | 1.00 | 0 | 0 | 0 | 0.0 | 0 | 1.00 | 0 | 0 | 0 |
| Criteria Score | V1 | V2 | V3 | ||
|---|---|---|---|---|---|
| 1 Safety | 1.1 Structural safety | 0 | - | - | - |
| 1.2 Fire safety | 10 | 1 | 5 | 5 | |
| 1.3 Usage safety | 0 | - | - | - | |
| 2 Comfort | 2.1 Acoustic comfort | 6 | 5 | 4 | 2 |
| 2.2 Visual comfort (lighting) | 0 | - | - | - | |
| 2.3 Hygrothermal comfort | 2 | 2 | 4 | 4 | |
| 2.4 Serviceability | 2 | 5 | 3 | 4 | |
| 3 Health | 3.1 Air quality | 0 | - | - | - |
| 3.2 Water supply and other utilities | 0 | - | - | - | |
| 3.3 Waste disposal | 0 | - | - | - | |
| 4 Durability | 4.1 Durability | 10 | 2 | 4 | 5 |
| 5 Sustainable development | 5.1 Energy saving | 0 | - | - | - |
| 5.2 Greenhouse gas emissions | 0 | - | - | - | |
| 5.3 Economics (running costs) | 10 | 3 | 5 | 5 | |
| 5.4 Dismantling and utilization | 2 | 5 | 4 | 3 |
| Criterion | Weight |
|---|---|
| 1.1 Structural safety | 0 |
| 1.2 Fire safety | 0.238095 |
| 1.3 Usage safety | 0 |
| 2.1 Acoustic comfort | 0.142857 |
| 2.2 Visual comfort (lighting) | 0 |
| 2.3 Hygrothermal comfort | 0.047619 |
| 2.4 Serviceability | 0.047619 |
| 3.1 Air quality | 0 |
| 3.2 Water supply and other utilities | 0 |
| 3.3 Waste disposal | 0 |
| 4.1 Durability | 0.238095 |
| 5.1 Energy saving | 0 |
| 5.2 Greenhouse gas emissions | 0 |
| 5.3 Economics (running costs) | 0.238095 |
| 5.4 Dismantling and utilization | 0.047619 |
| 1.1 | 1.2 | 1.3 | 2.1 | 2.2 | 2.3 | 2.4 | 3.1 | 3.2 | 3.3 | 4.1 | 5.1 | 5.2 | 5.3 | 5.4 | |
|---|---|---|---|---|---|---|---|---|---|---|---|---|---|---|---|
| V1 | 0.577 | 0.140 | 0.577 | 0.745 | 0.577 | 0.333 | 0.707 | 0.577 | 0.577 | 0.577 | 0.298 | 0.577 | 0.577 | 0.391 | 0.707 |
| V2 | 0.577 | 0.701 | 0.577 | 0.596 | 0.577 | 0.667 | 0.424 | 0.577 | 0.577 | 0.577 | 0.596 | 0.577 | 0.577 | 0.651 | 0.566 |
| V3 | 0.577 | 0.701 | 0.577 | 0.298 | 0.577 | 0.667 | 0.566 | 0.577 | 0.577 | 0.577 | 0.745 | 0.577 | 0.577 | 0.651 | 0.424 |
| 1.1 | 1.2 | 1.3 | 2.1 | 2.2 | 2.3 | 2.4 | 3.1 | 3.2 | 3.3 | 4.1 | 5.1 | 5.2 | 5.3 | 5.4 | |
|---|---|---|---|---|---|---|---|---|---|---|---|---|---|---|---|
| V1 | 0 | 1.400 | 0 | 4.472 | 0 | 0.667 | 1.414 | 0 | 0 | 0 | 2.981 | 0 | 0 | 3.906 | 1.414 |
| V2 | 0 | 7.001 | 0 | 3.578 | 0 | 1.333 | 0.849 | 0 | 0 | 0 | 5.963 | 0 | 0 | 6.509 | 1.131 |
| V3 | 0 | 7.001 | 0 | 1.789 | 0 | 1.333 | 1.131 | 0 | 0 | 0 | 7.454 | 0 | 0 | 6.509 | 0.849 |
| Variant | Score V |
|---|---|
| V1-NIDA | 0.617 |
| V2-SILKA | 1.000 |
| V3-YTONG | 0.989 |
| Indicator | Value |
|---|---|
| 1,705,955 EUR | |
| 130,827 EUR | |
| 1,961,197 EUR | |
| 0 EUR | |
| 1.000 | |
| 0.853 |
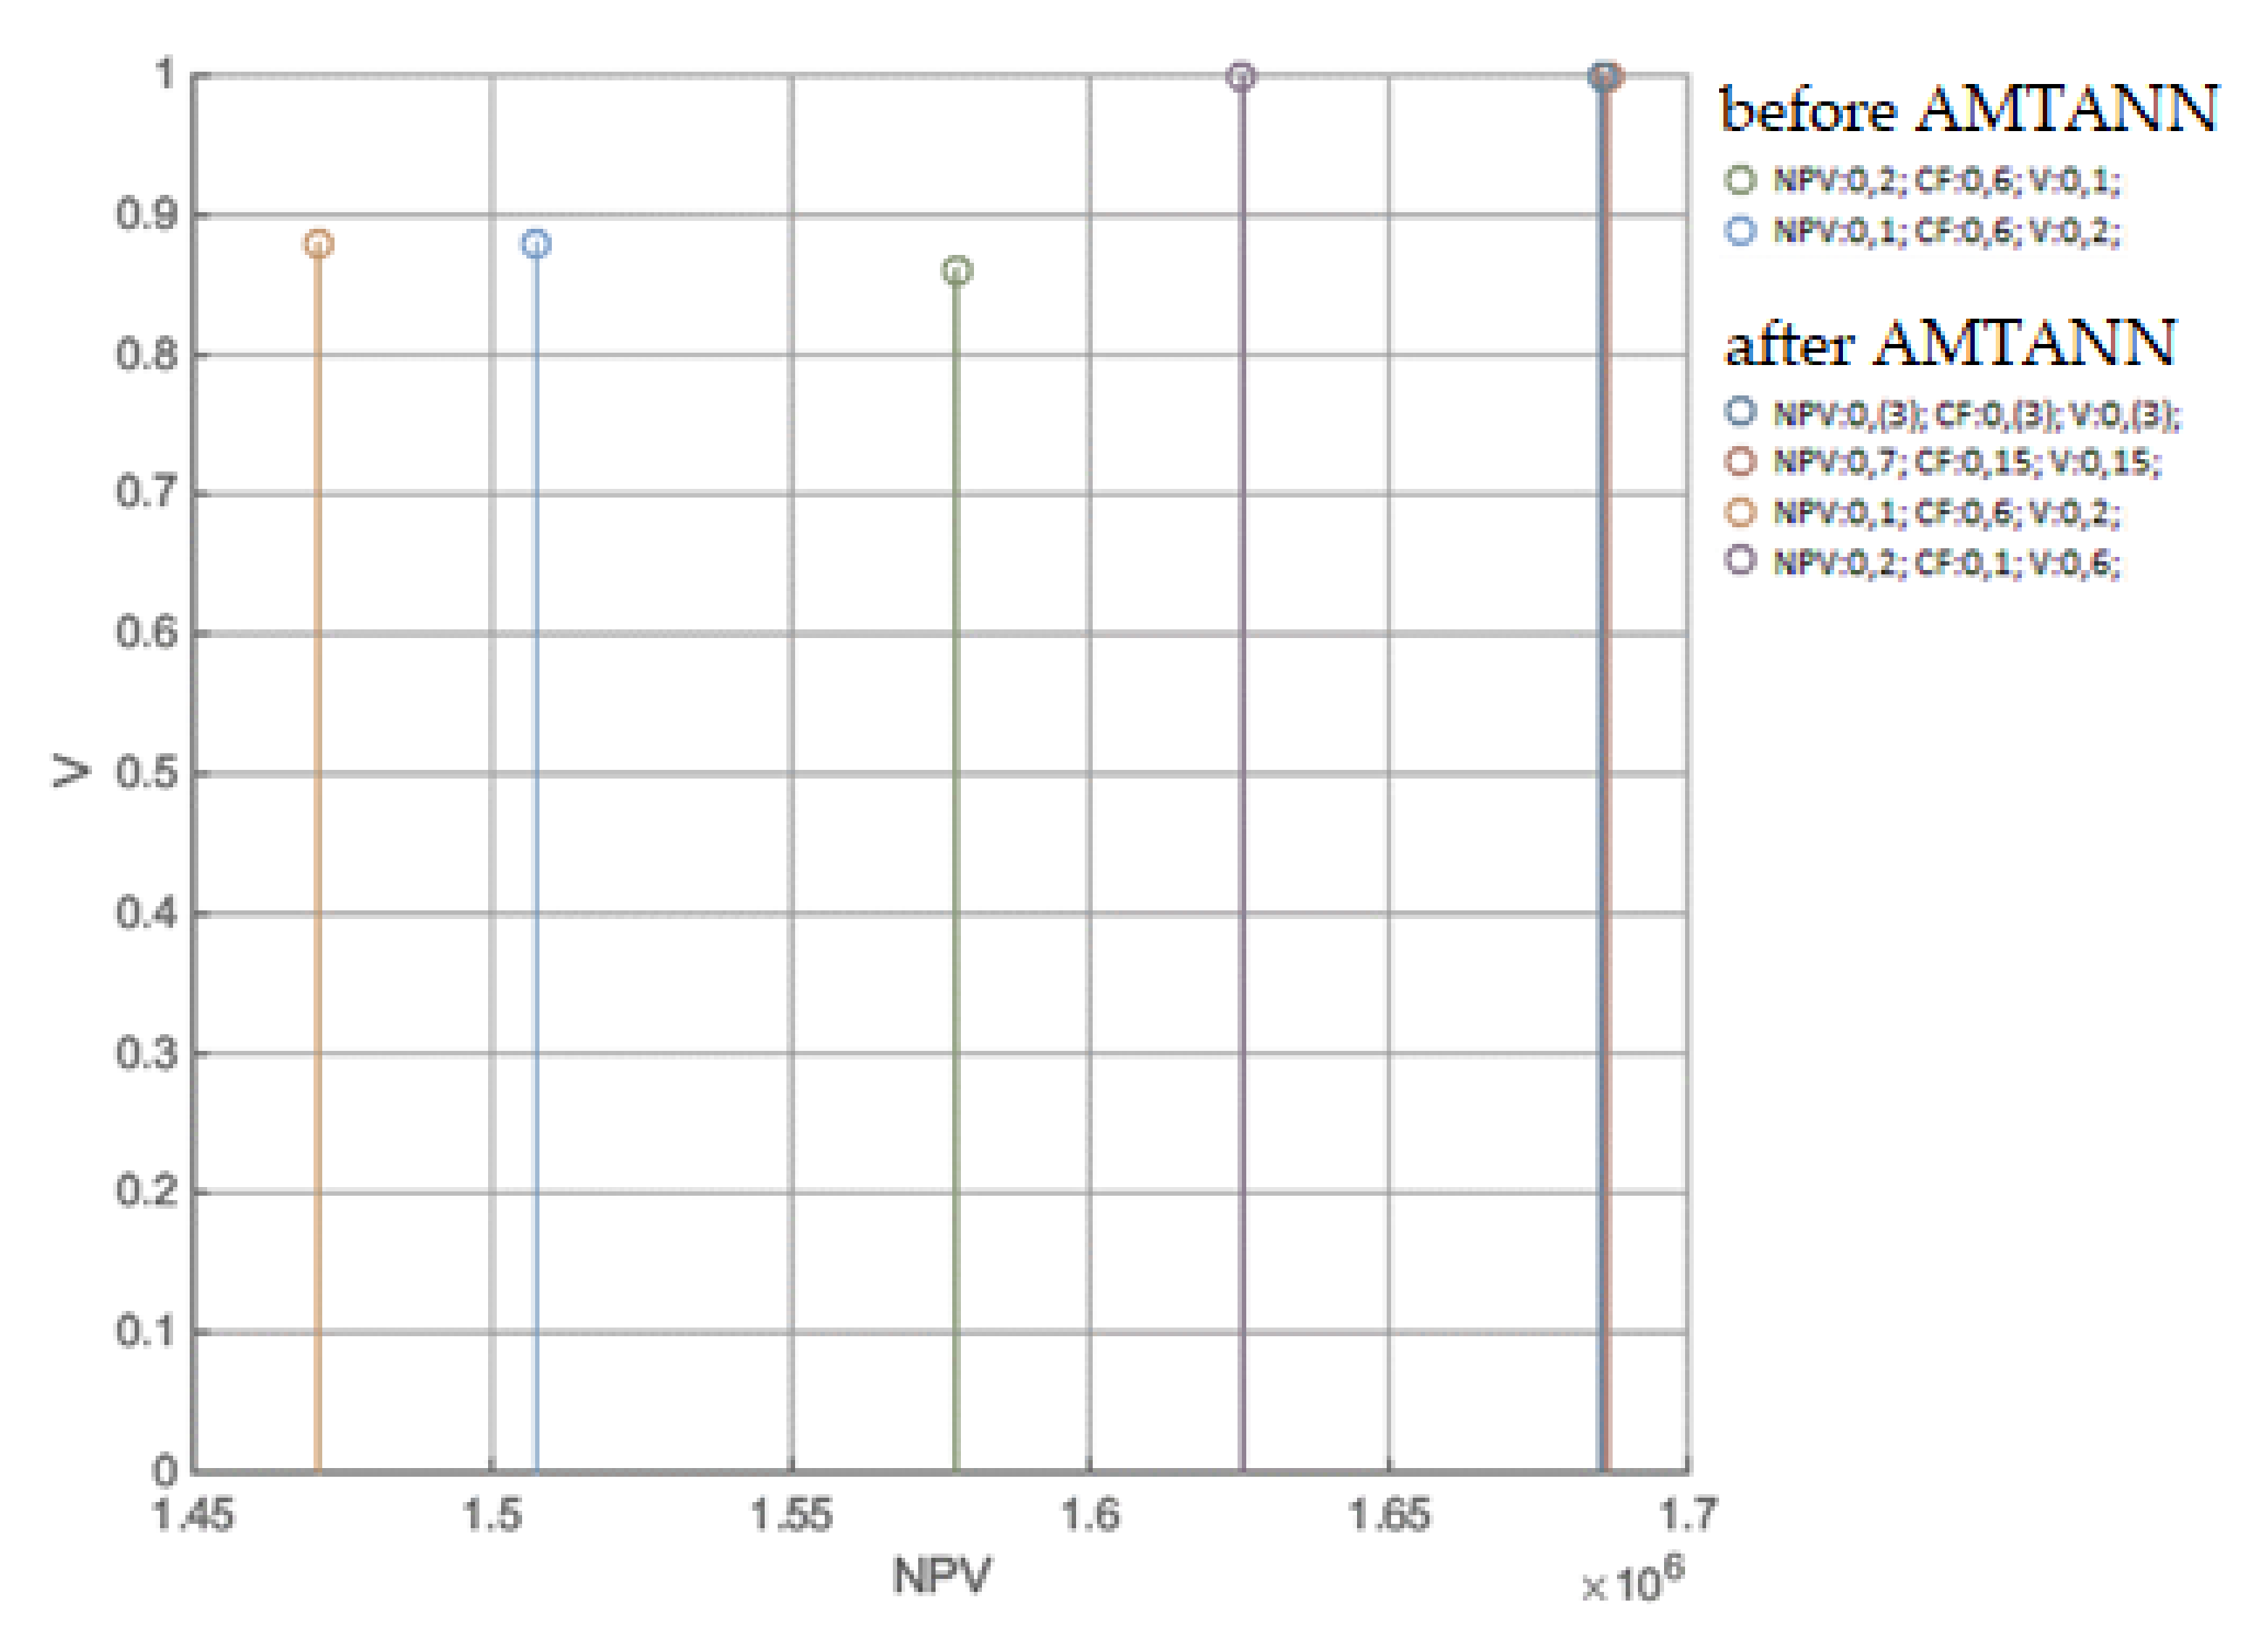
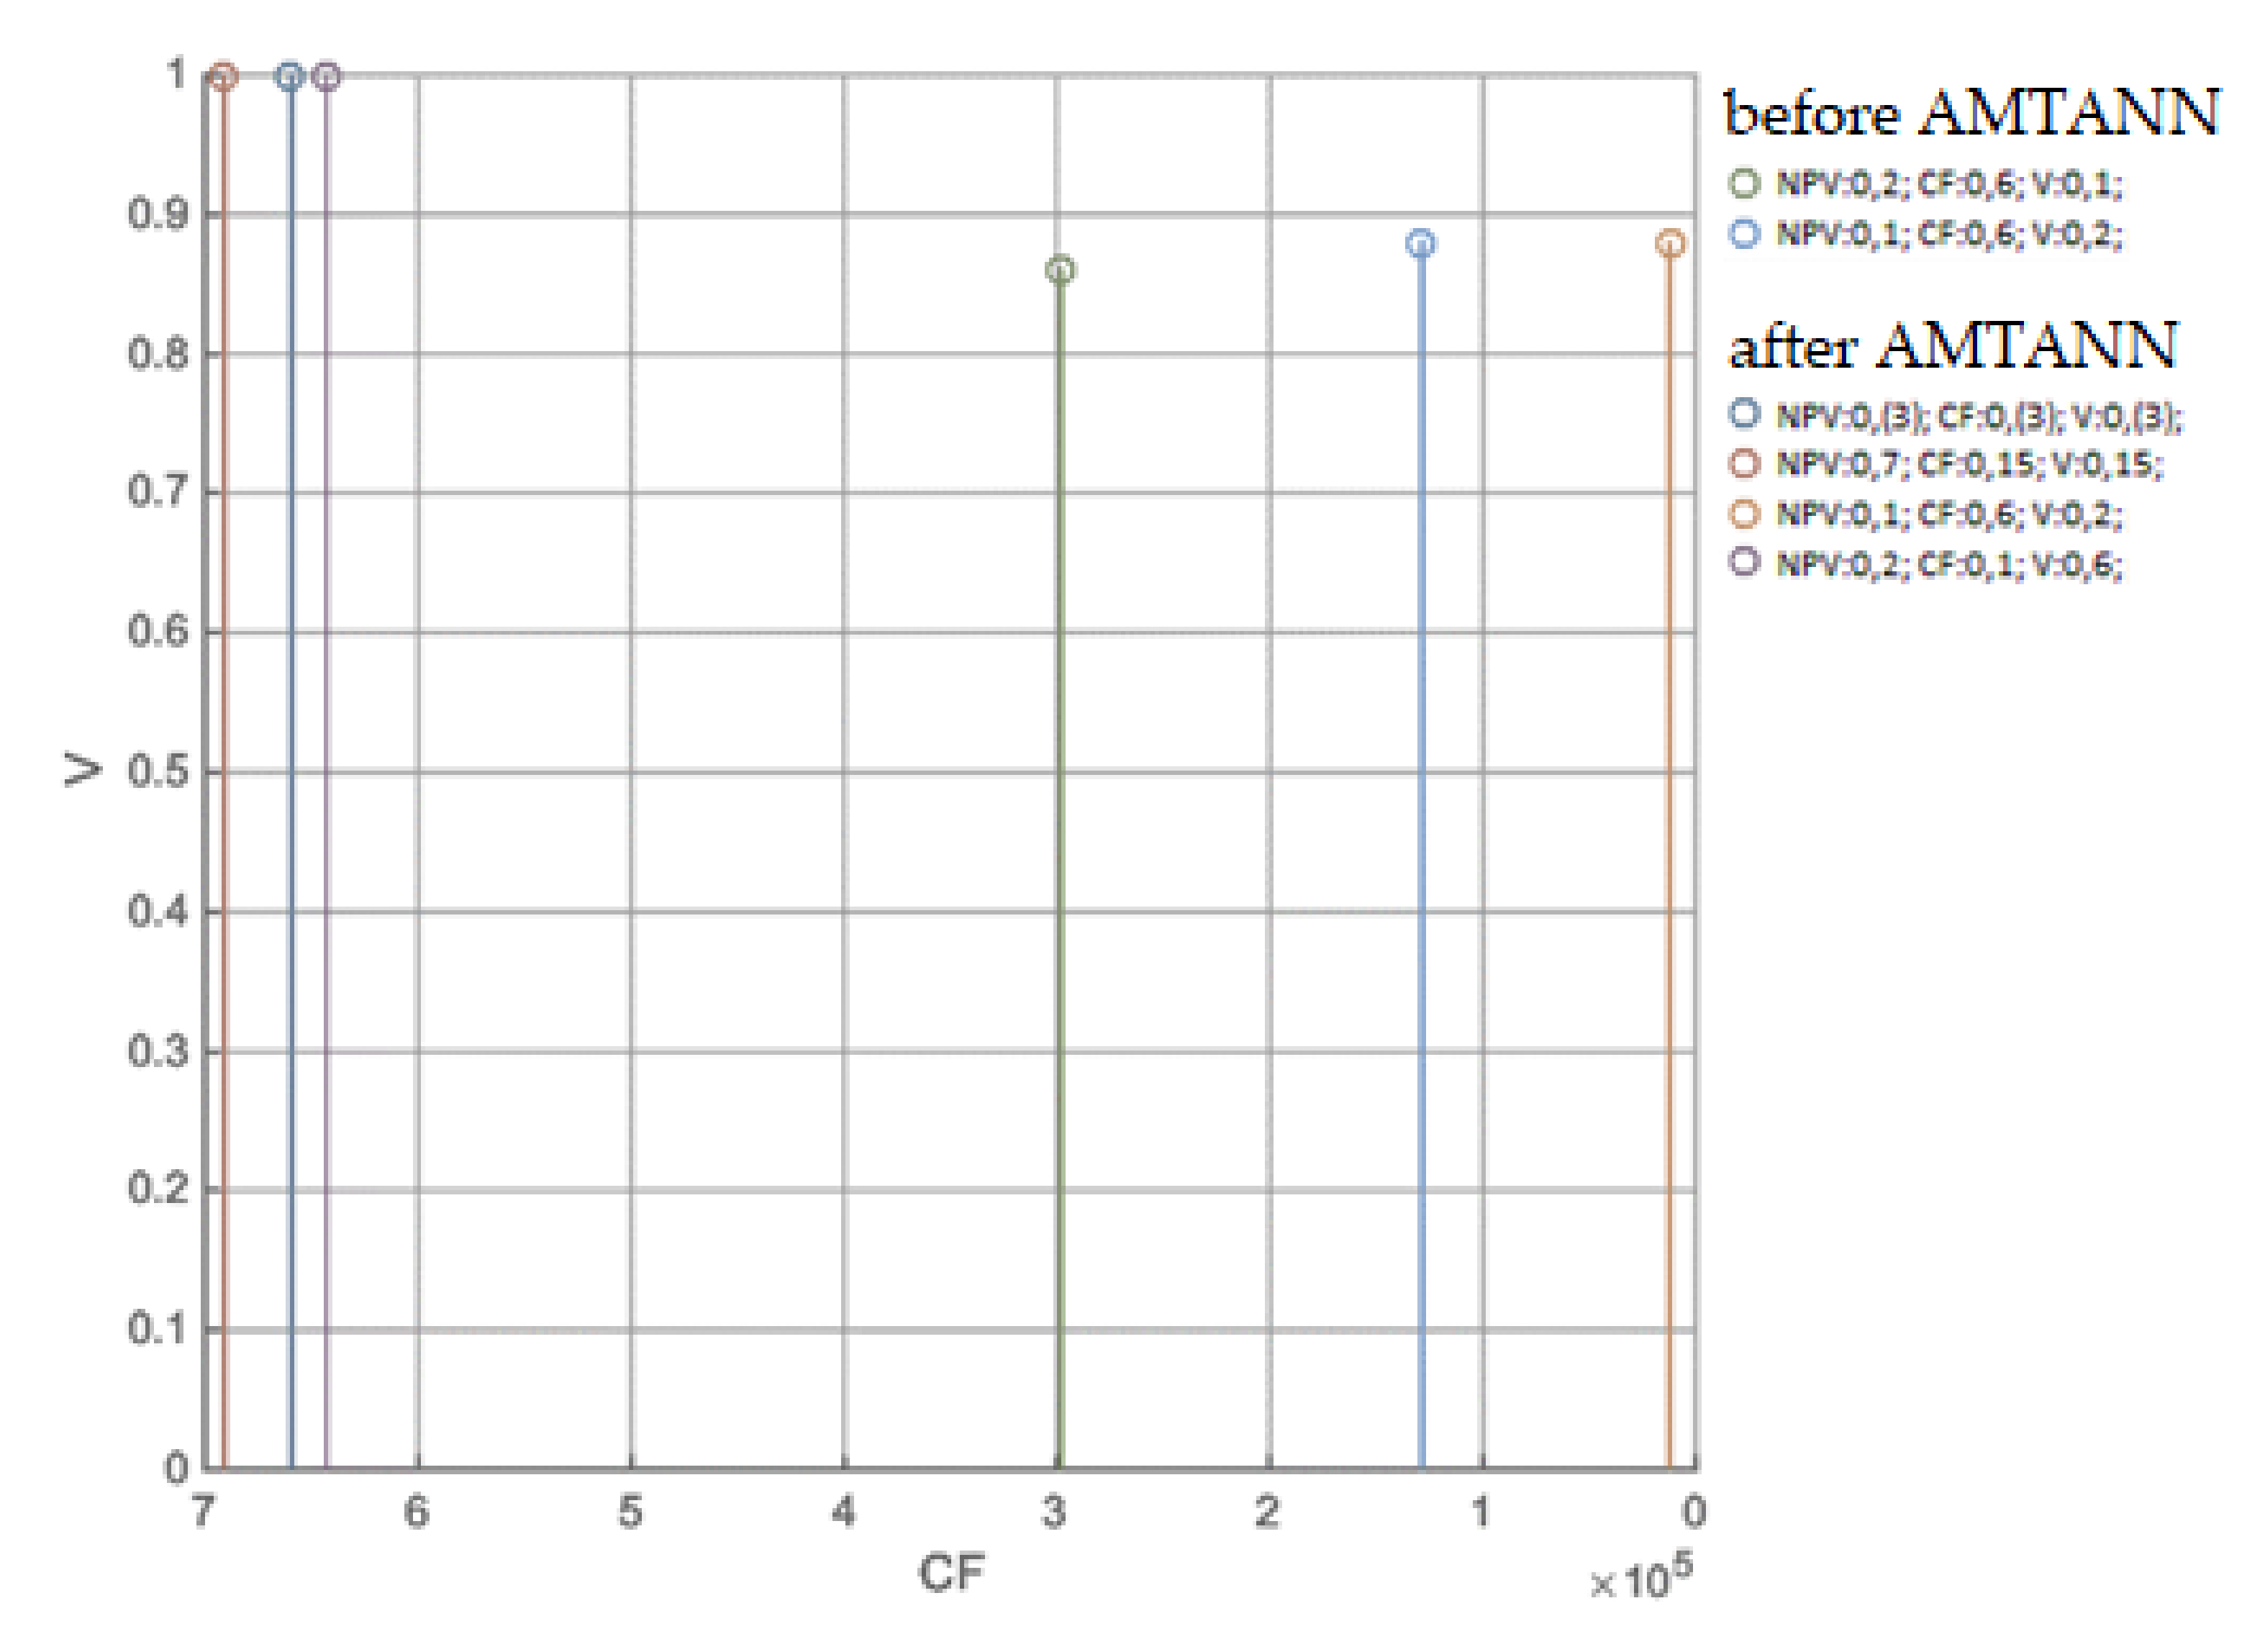
| (NPV) | 0.3(3) | 0.7 | 0.15 | 0.15 | 0.6 | 0.6 | 0.2 | 0.1 | 0.2 | 0.1 |
| (CF) | 0.3(3) | 0.15 | 0.7 | 0.15 | 0.2 | 0.1 | 0.6 | 0.6 | 0.1 | 0.2 |
| (V) | 0.3(3) | 0.15 | 0.15 | 0.7 | 0.1 | 0.2 | 0.1 | 0.2 | 0.6 | 0.6 |
| (NPV) | 0.33 | 0.7 | 0.15 | 0.15 | 0.6 | 0.6 | 0.2 | 0.1 | 0.2 | 0.1 |
| V) | 0.33 | 0.15 | 0.15 | 0.7 | 0.1 | 0.2 | 0.1 | 0.2 | 0.6 | 0.6 |
| CF) | 0.33 | 0.15 | 0.7 | 0.15 | 0.2 | 0.1 | 0.6 | 0.6 | 0.1 | 0.2 |
| After use of AMTANN | ||||||||||
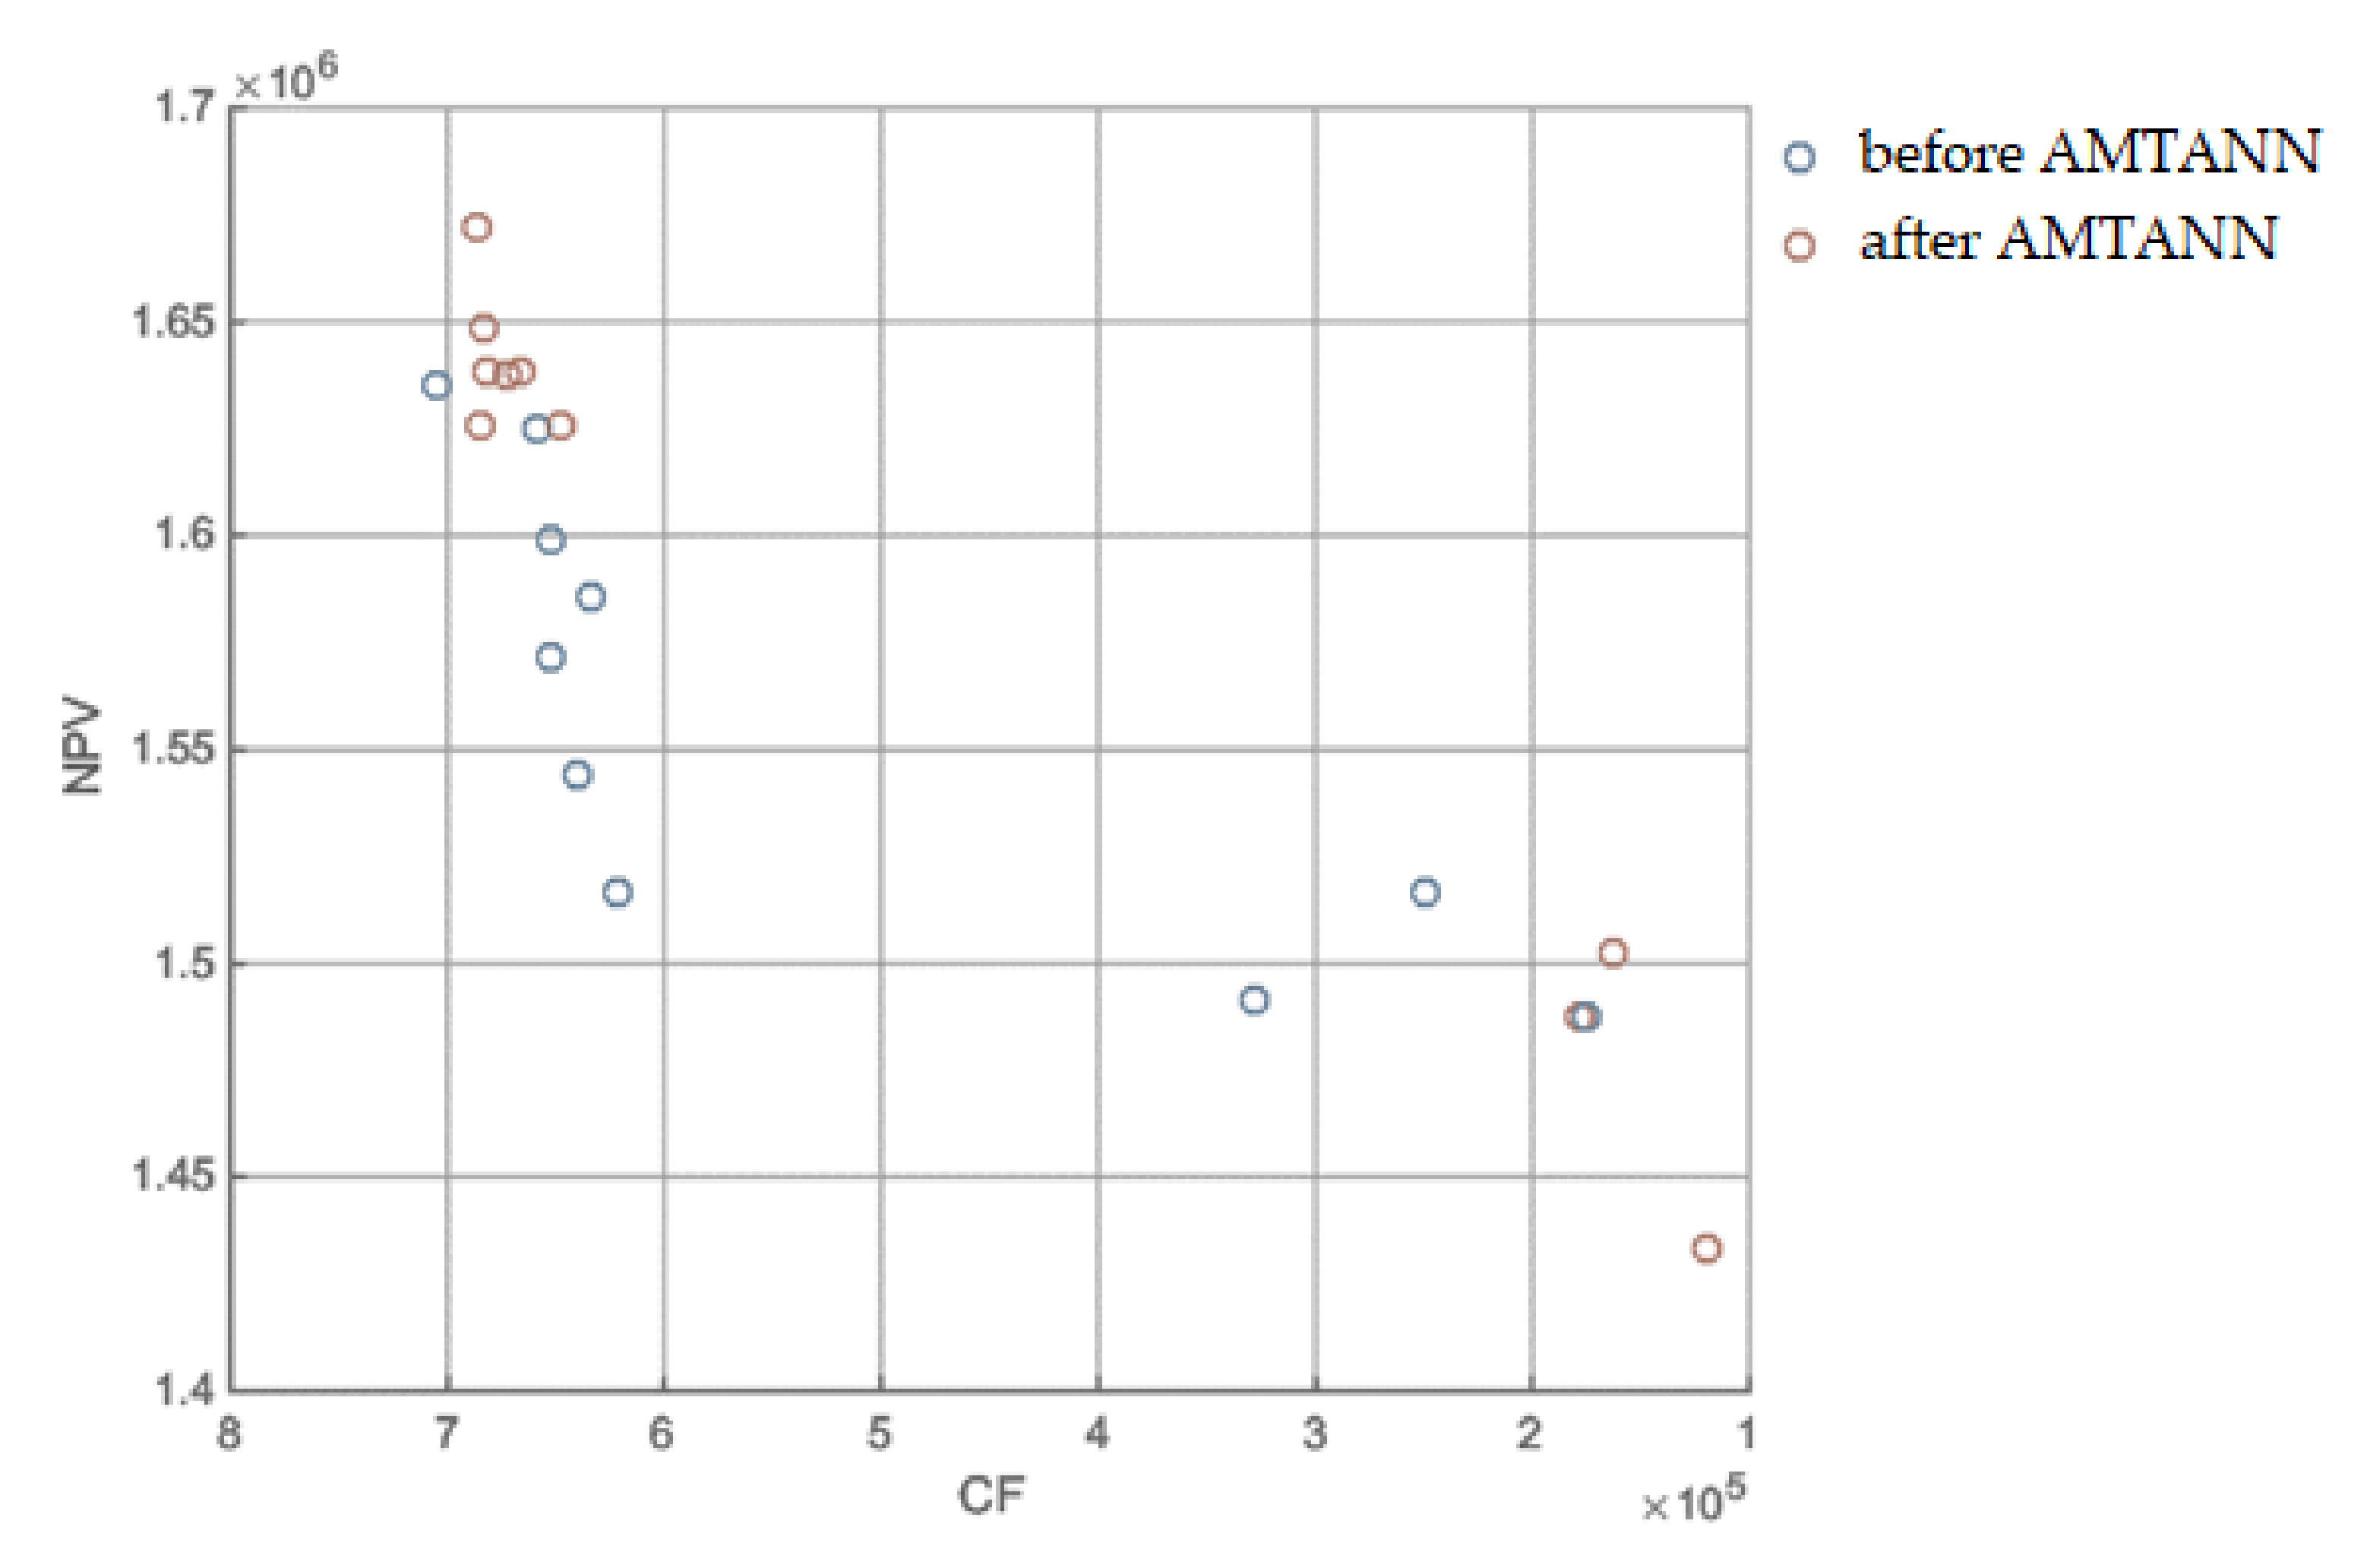
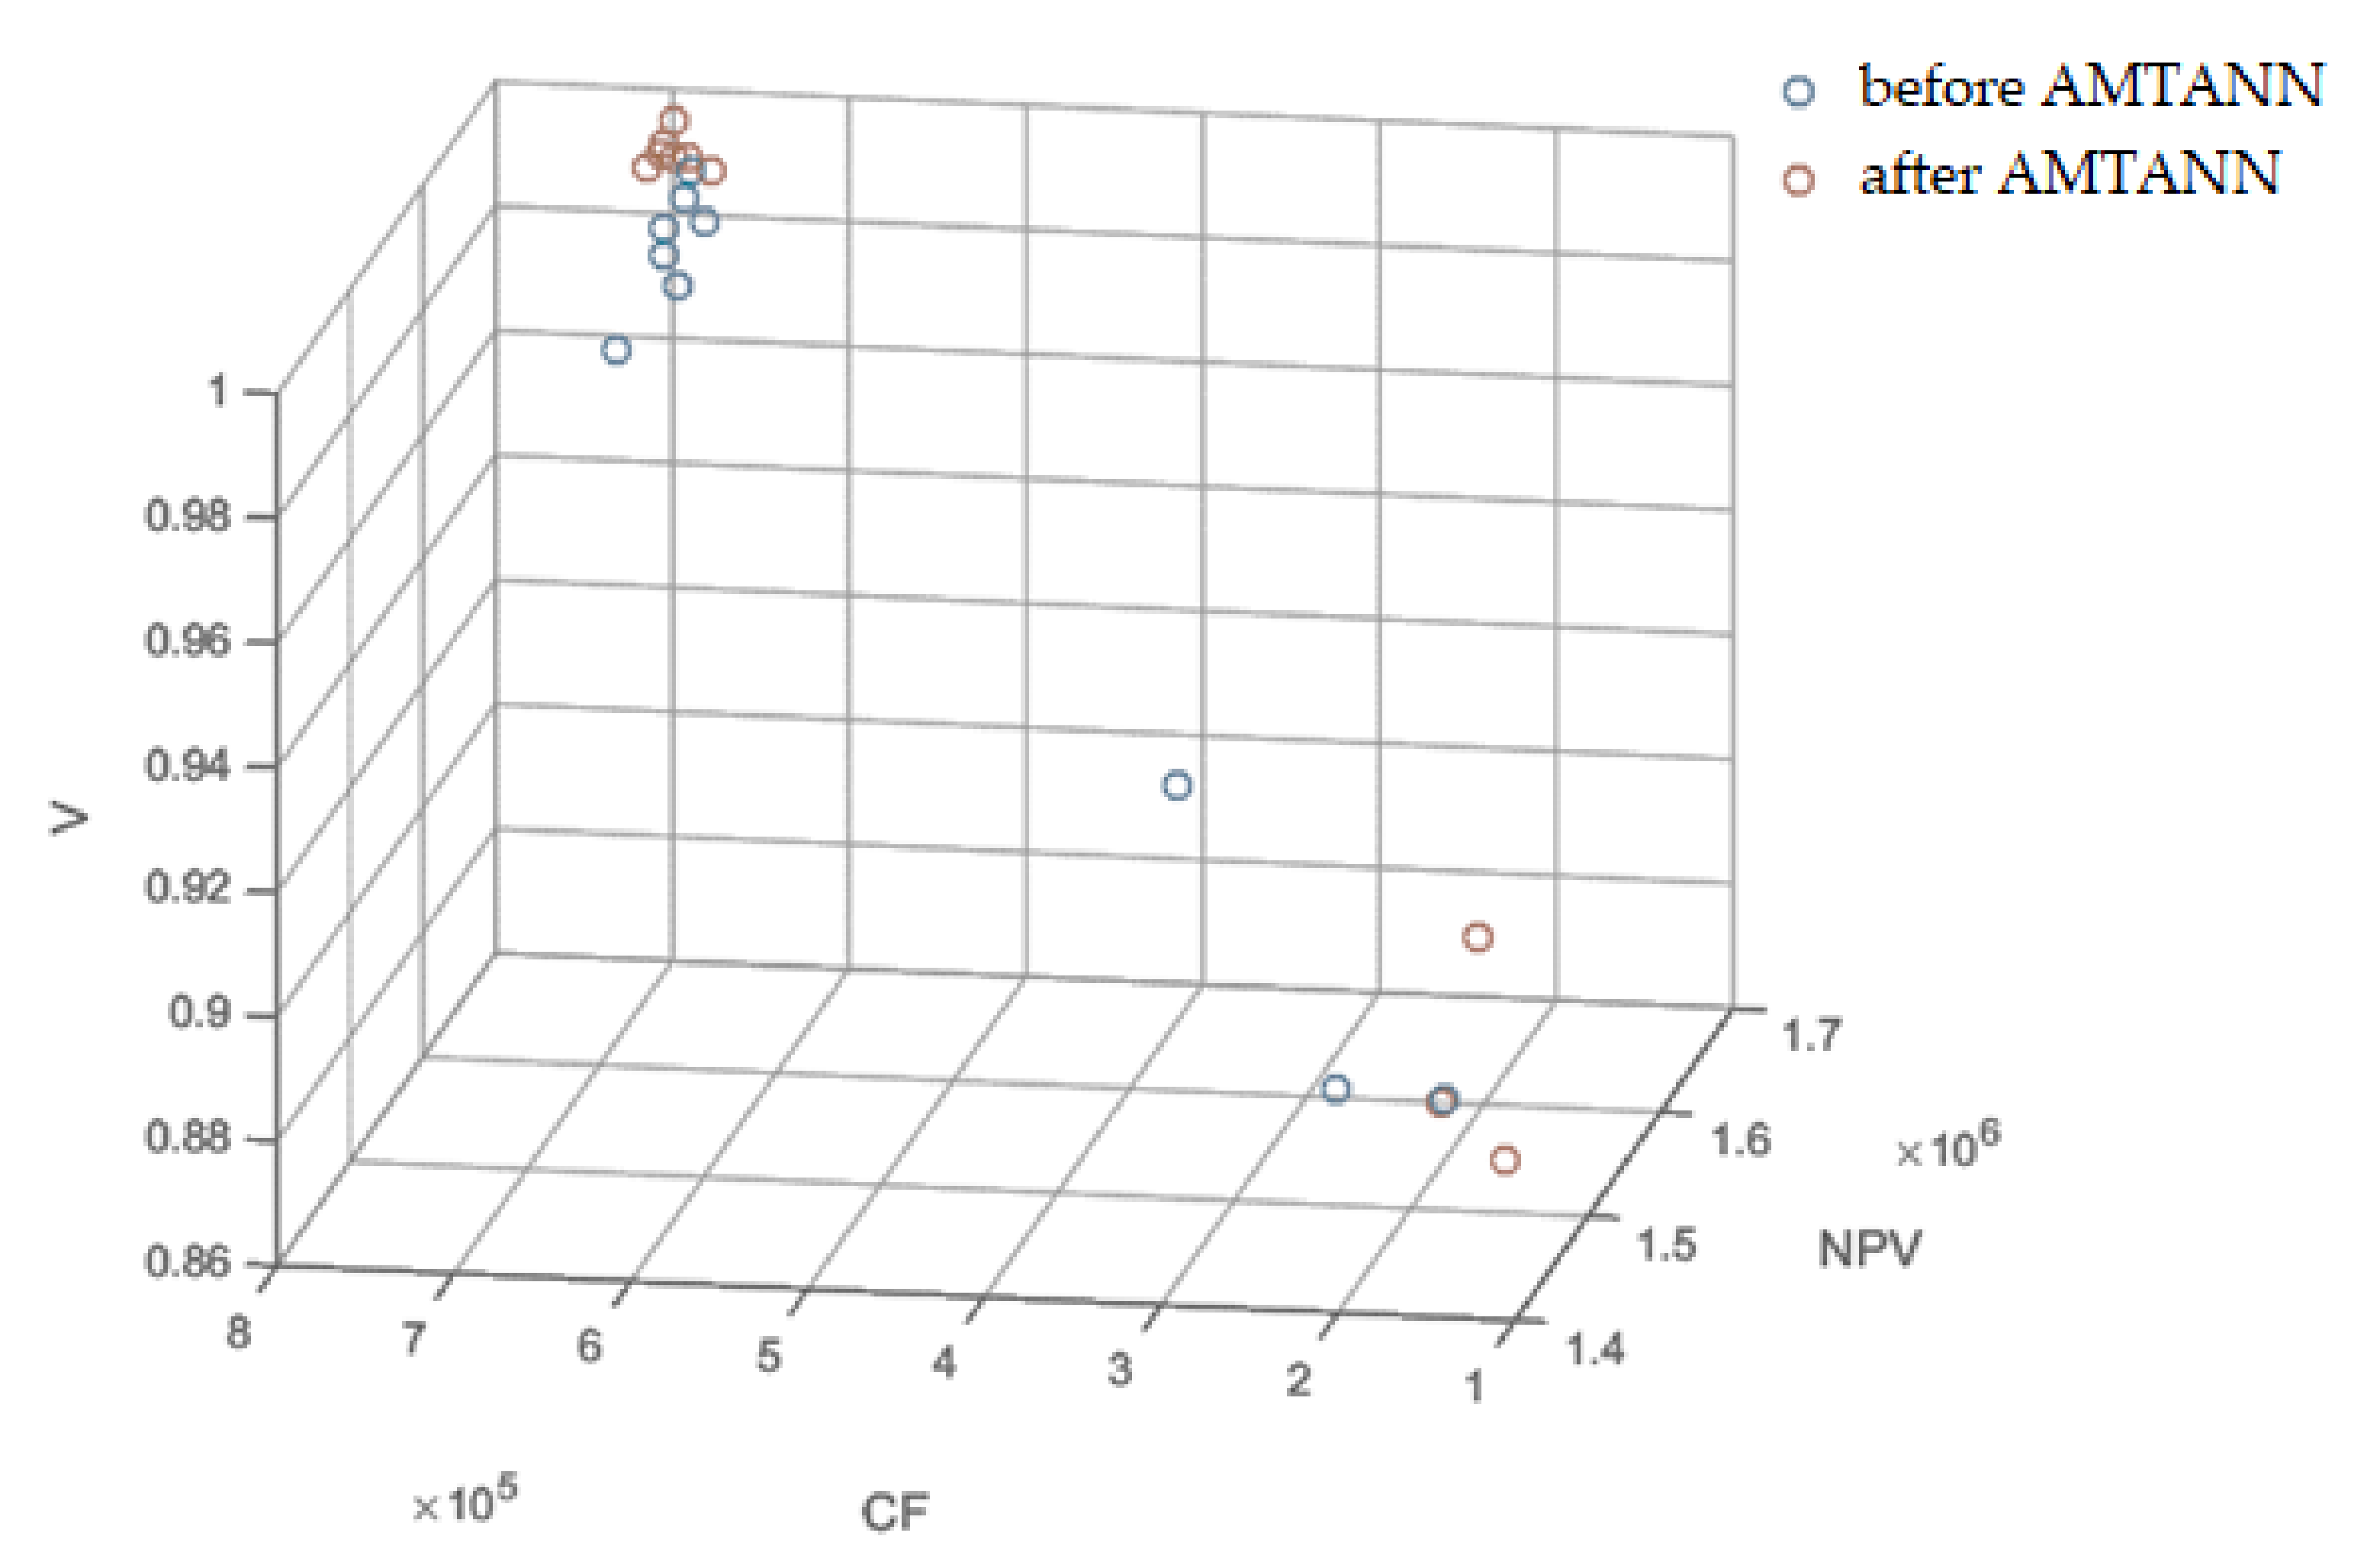
| NPVr | 0.98702 | 0.98770 | 0.84019 | 0.94922 | 0.98604 | 0.98721 | 0.87249 | 0.85077 | 0.94899 | 0.94912 |
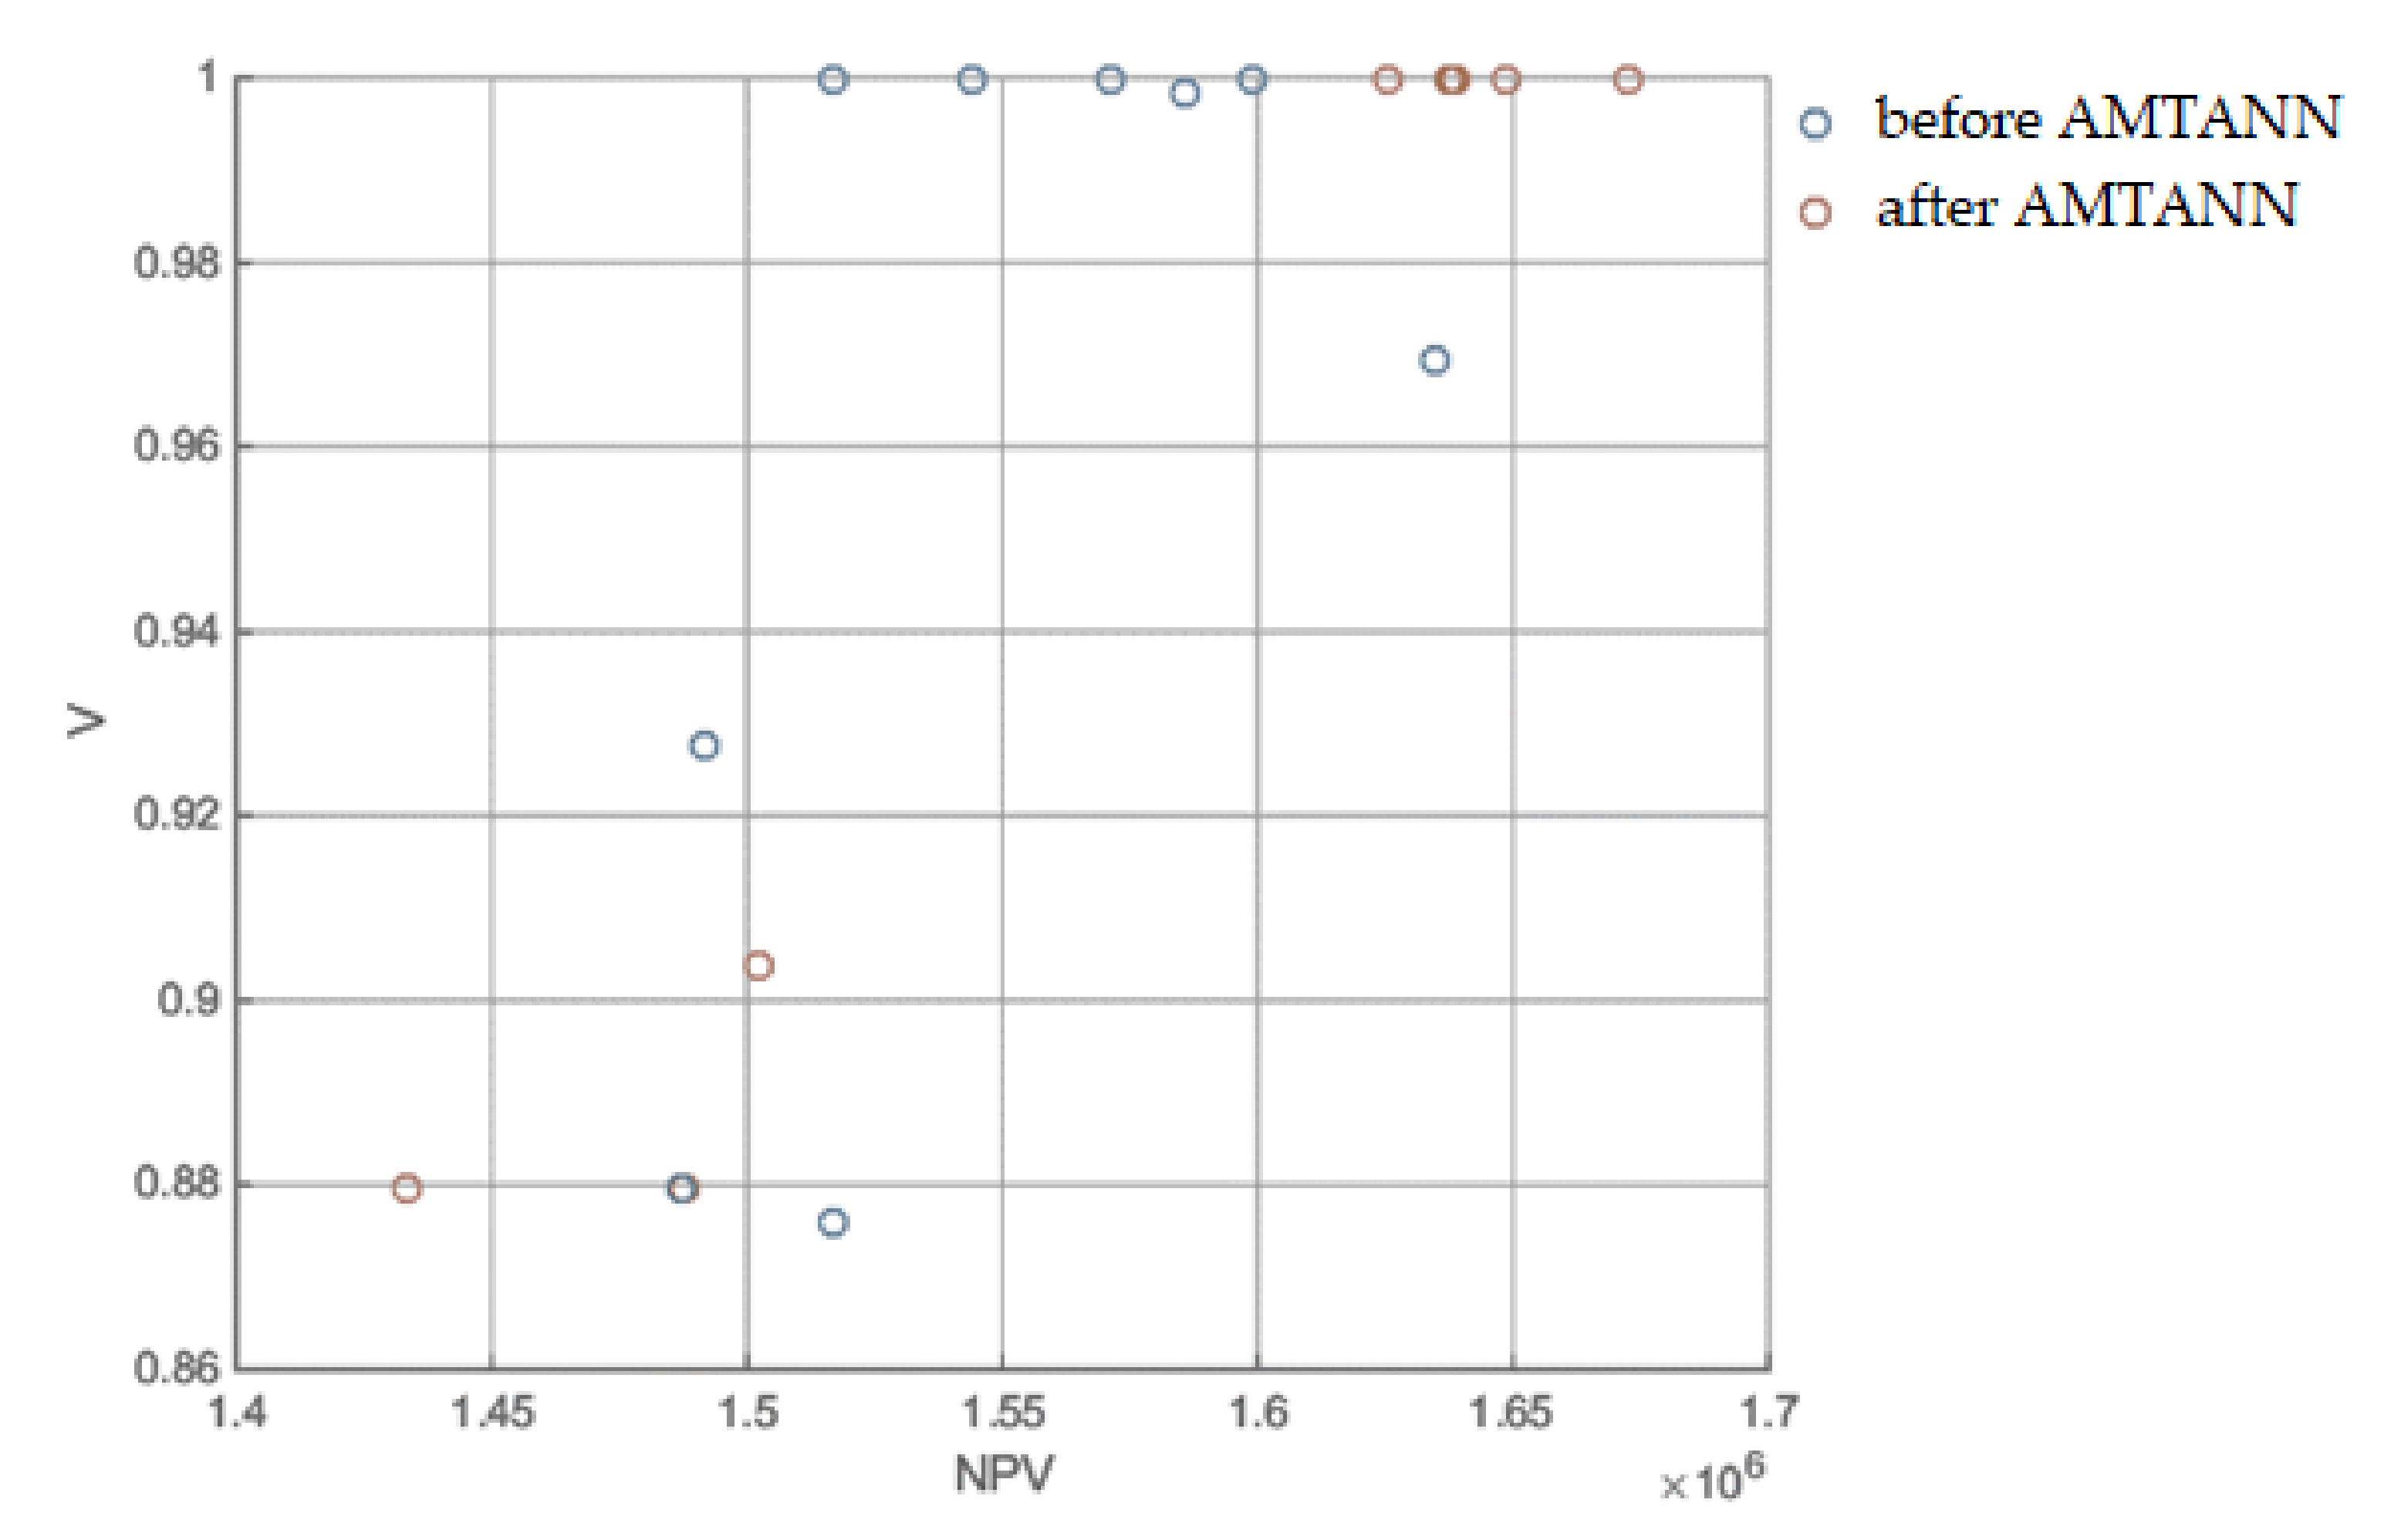
| Vr | 1.00000 | 1.00000 | 0.17832 | 1.00000 | 1.00000 | 1.00000 | 0.17977 | 0.17832 | 1.00000 | 1.00000 |
| CFr | 0.33629 | 0.35232 | 0.07045 | 0.34795 | 0.33629 | 0.35232 | 0.06773 | 0.00628 | 0.32780 | 0.33629 |
| OF | 0.549693 | 0.788542 | 0.103465 | 0.790189 | 0.624369 | 0.757091 | 0.151836 | 0.116973 | 0.757018 | 0.627654 |
| Duration [d] | 128 | 128 | 100 | 132 | 128 | 128 | 112 | 104 | 132 | 132 |
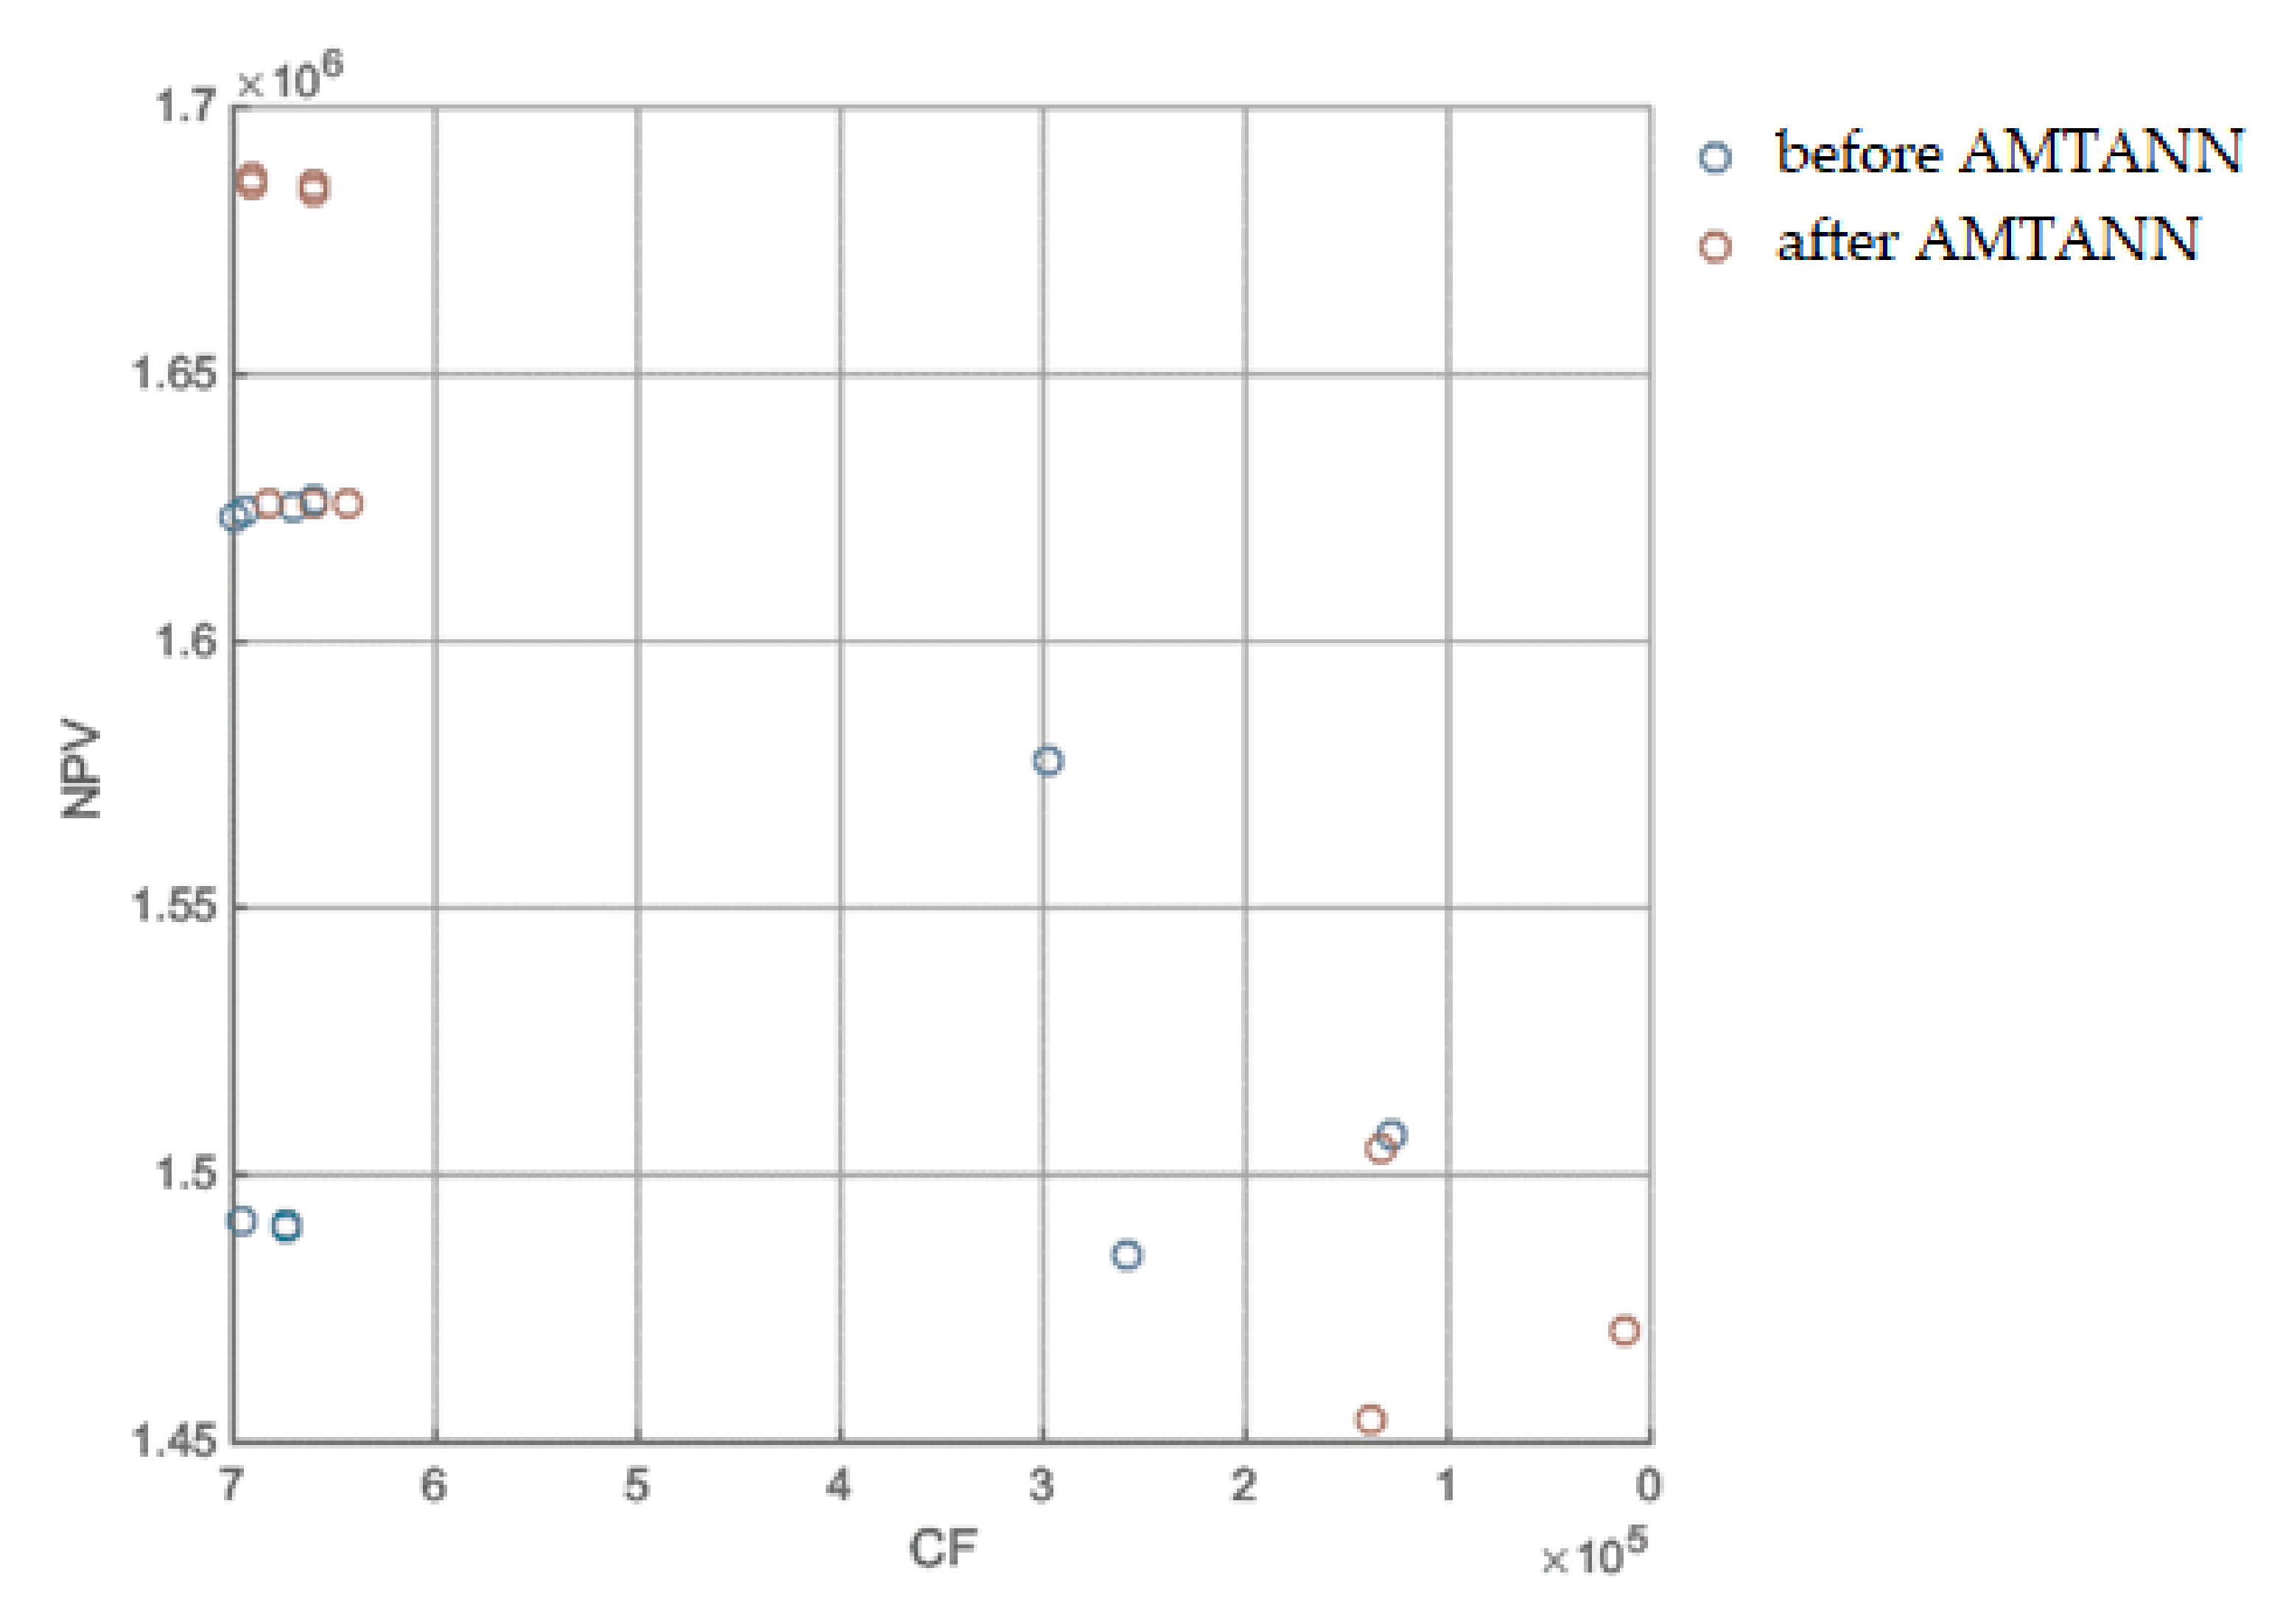
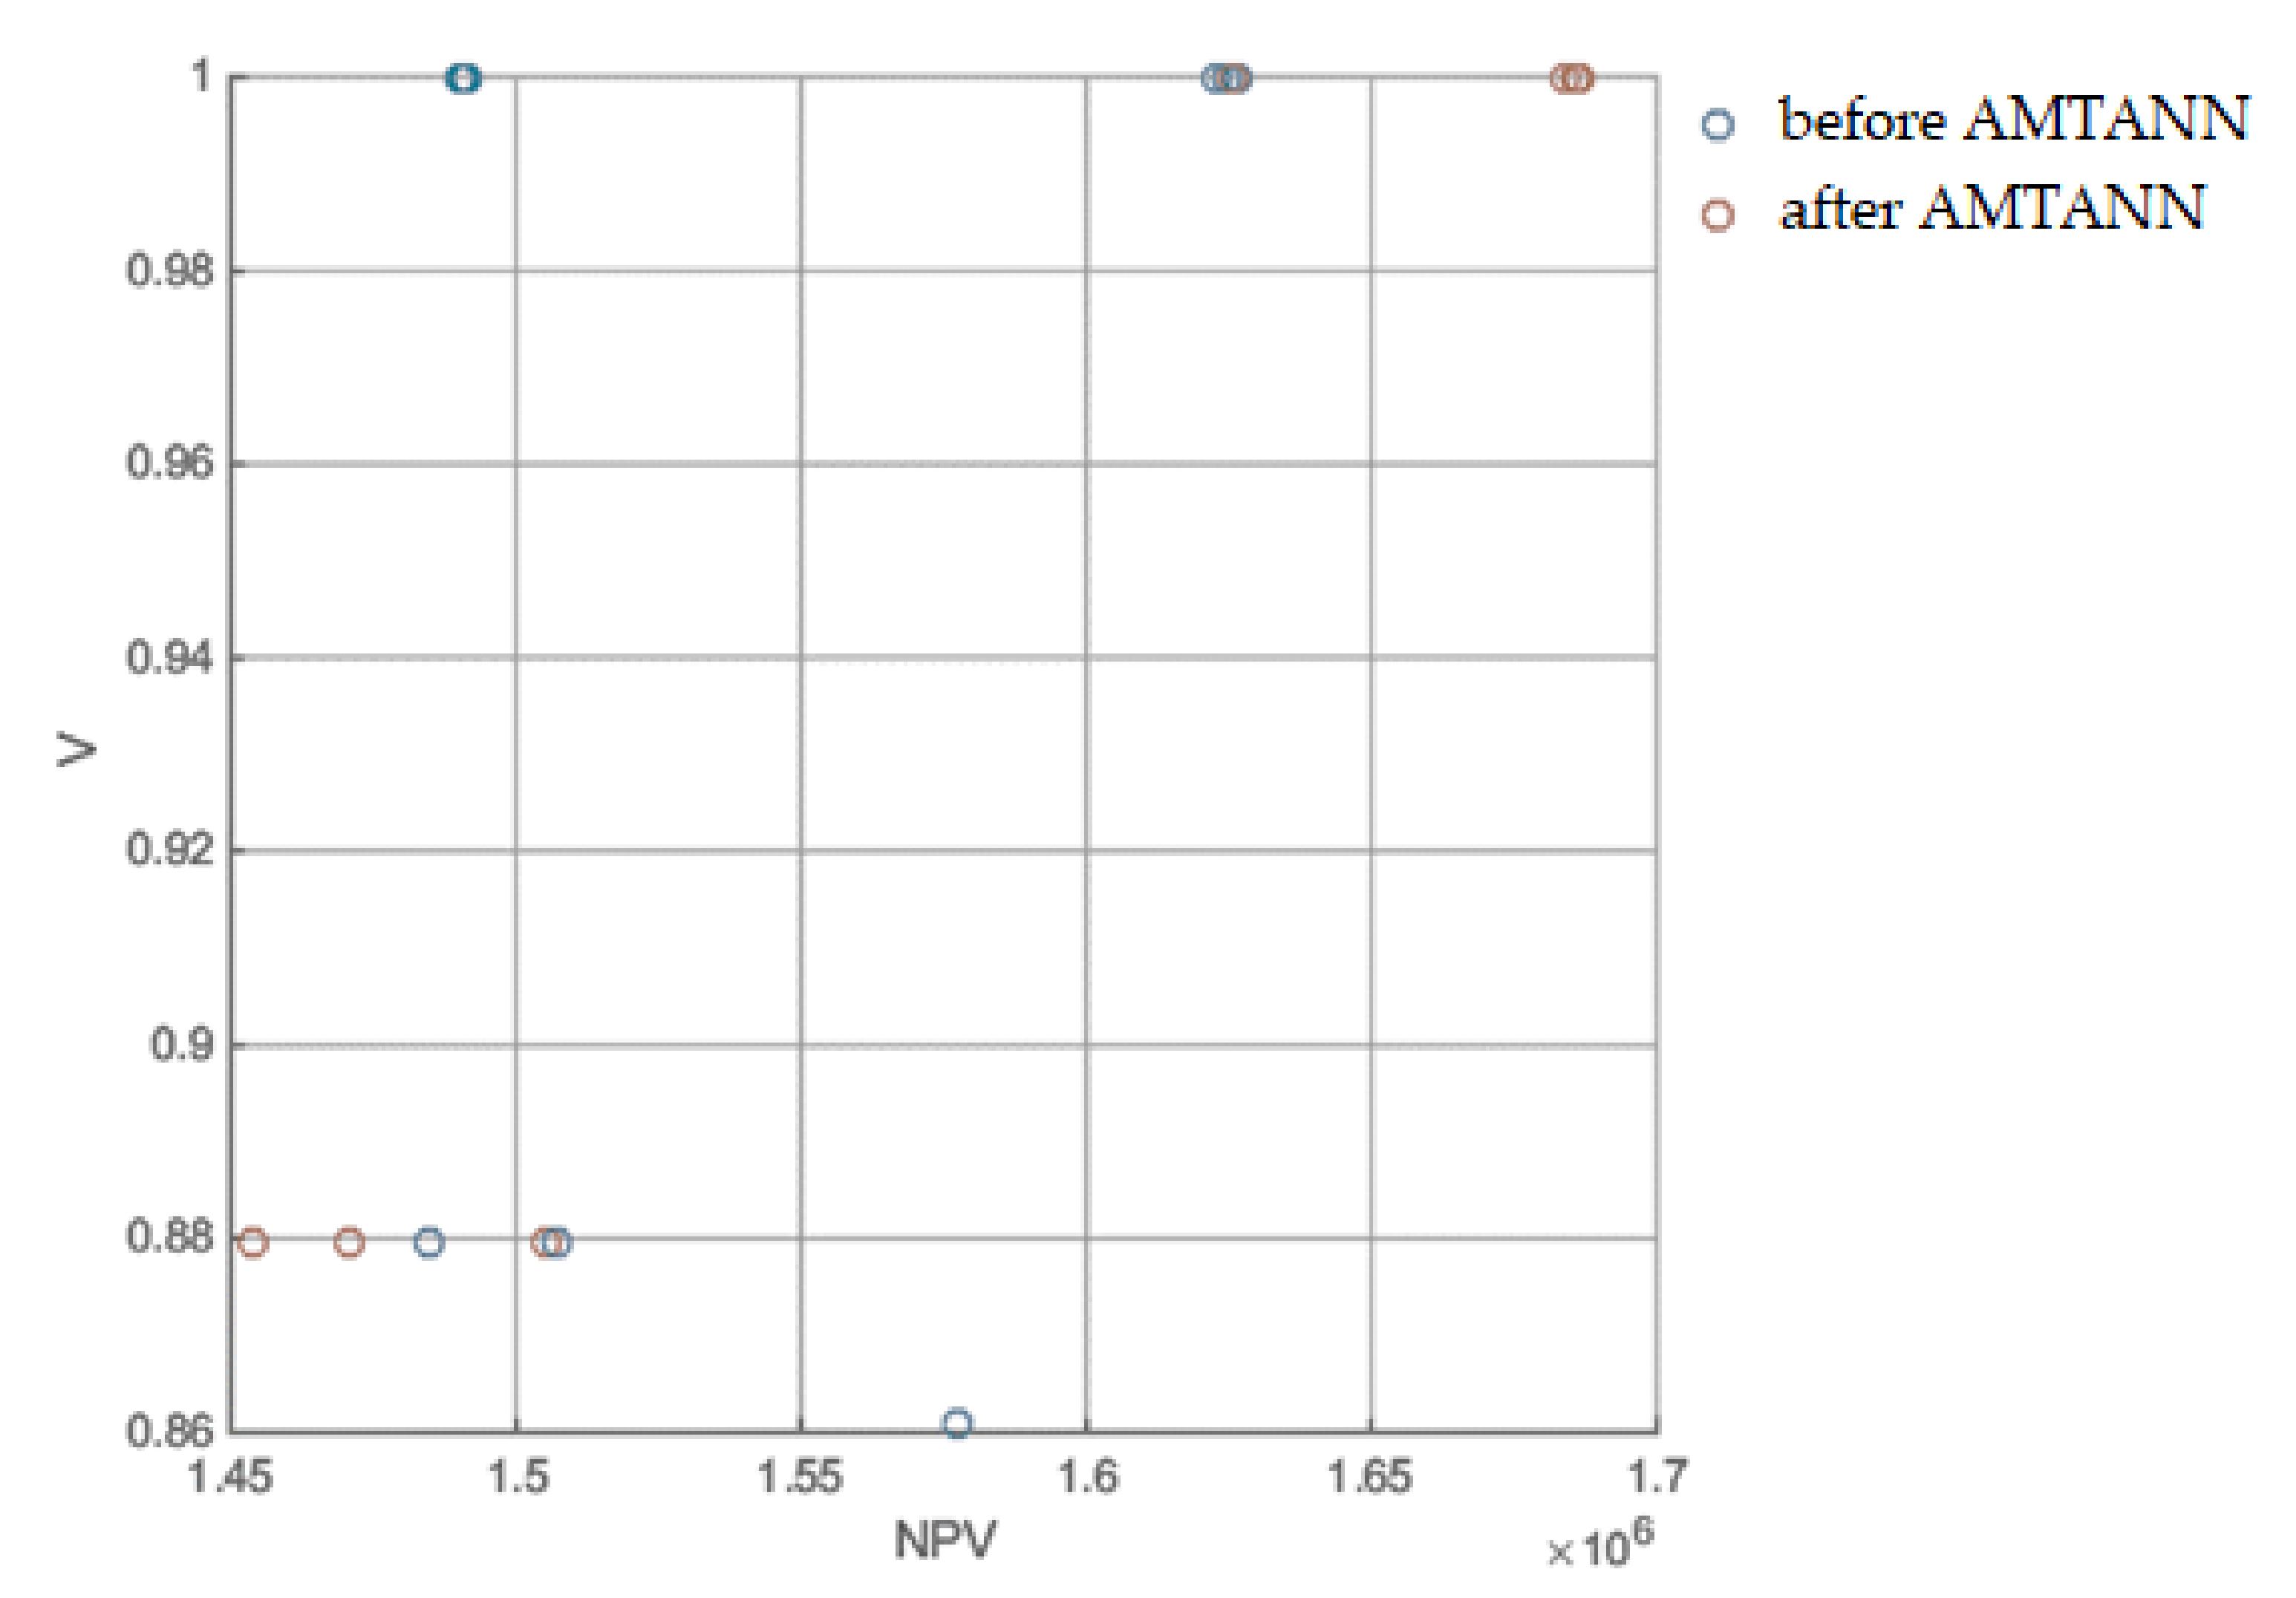
| NPV [EUR] | 1,685,507 | 1,686,580 | 1,454,234 | 1,625,965 | 1,683,972 | 1,685,801 | 1,505,111 | 1,470,891 | 1,625,603 | 1,625,812 |
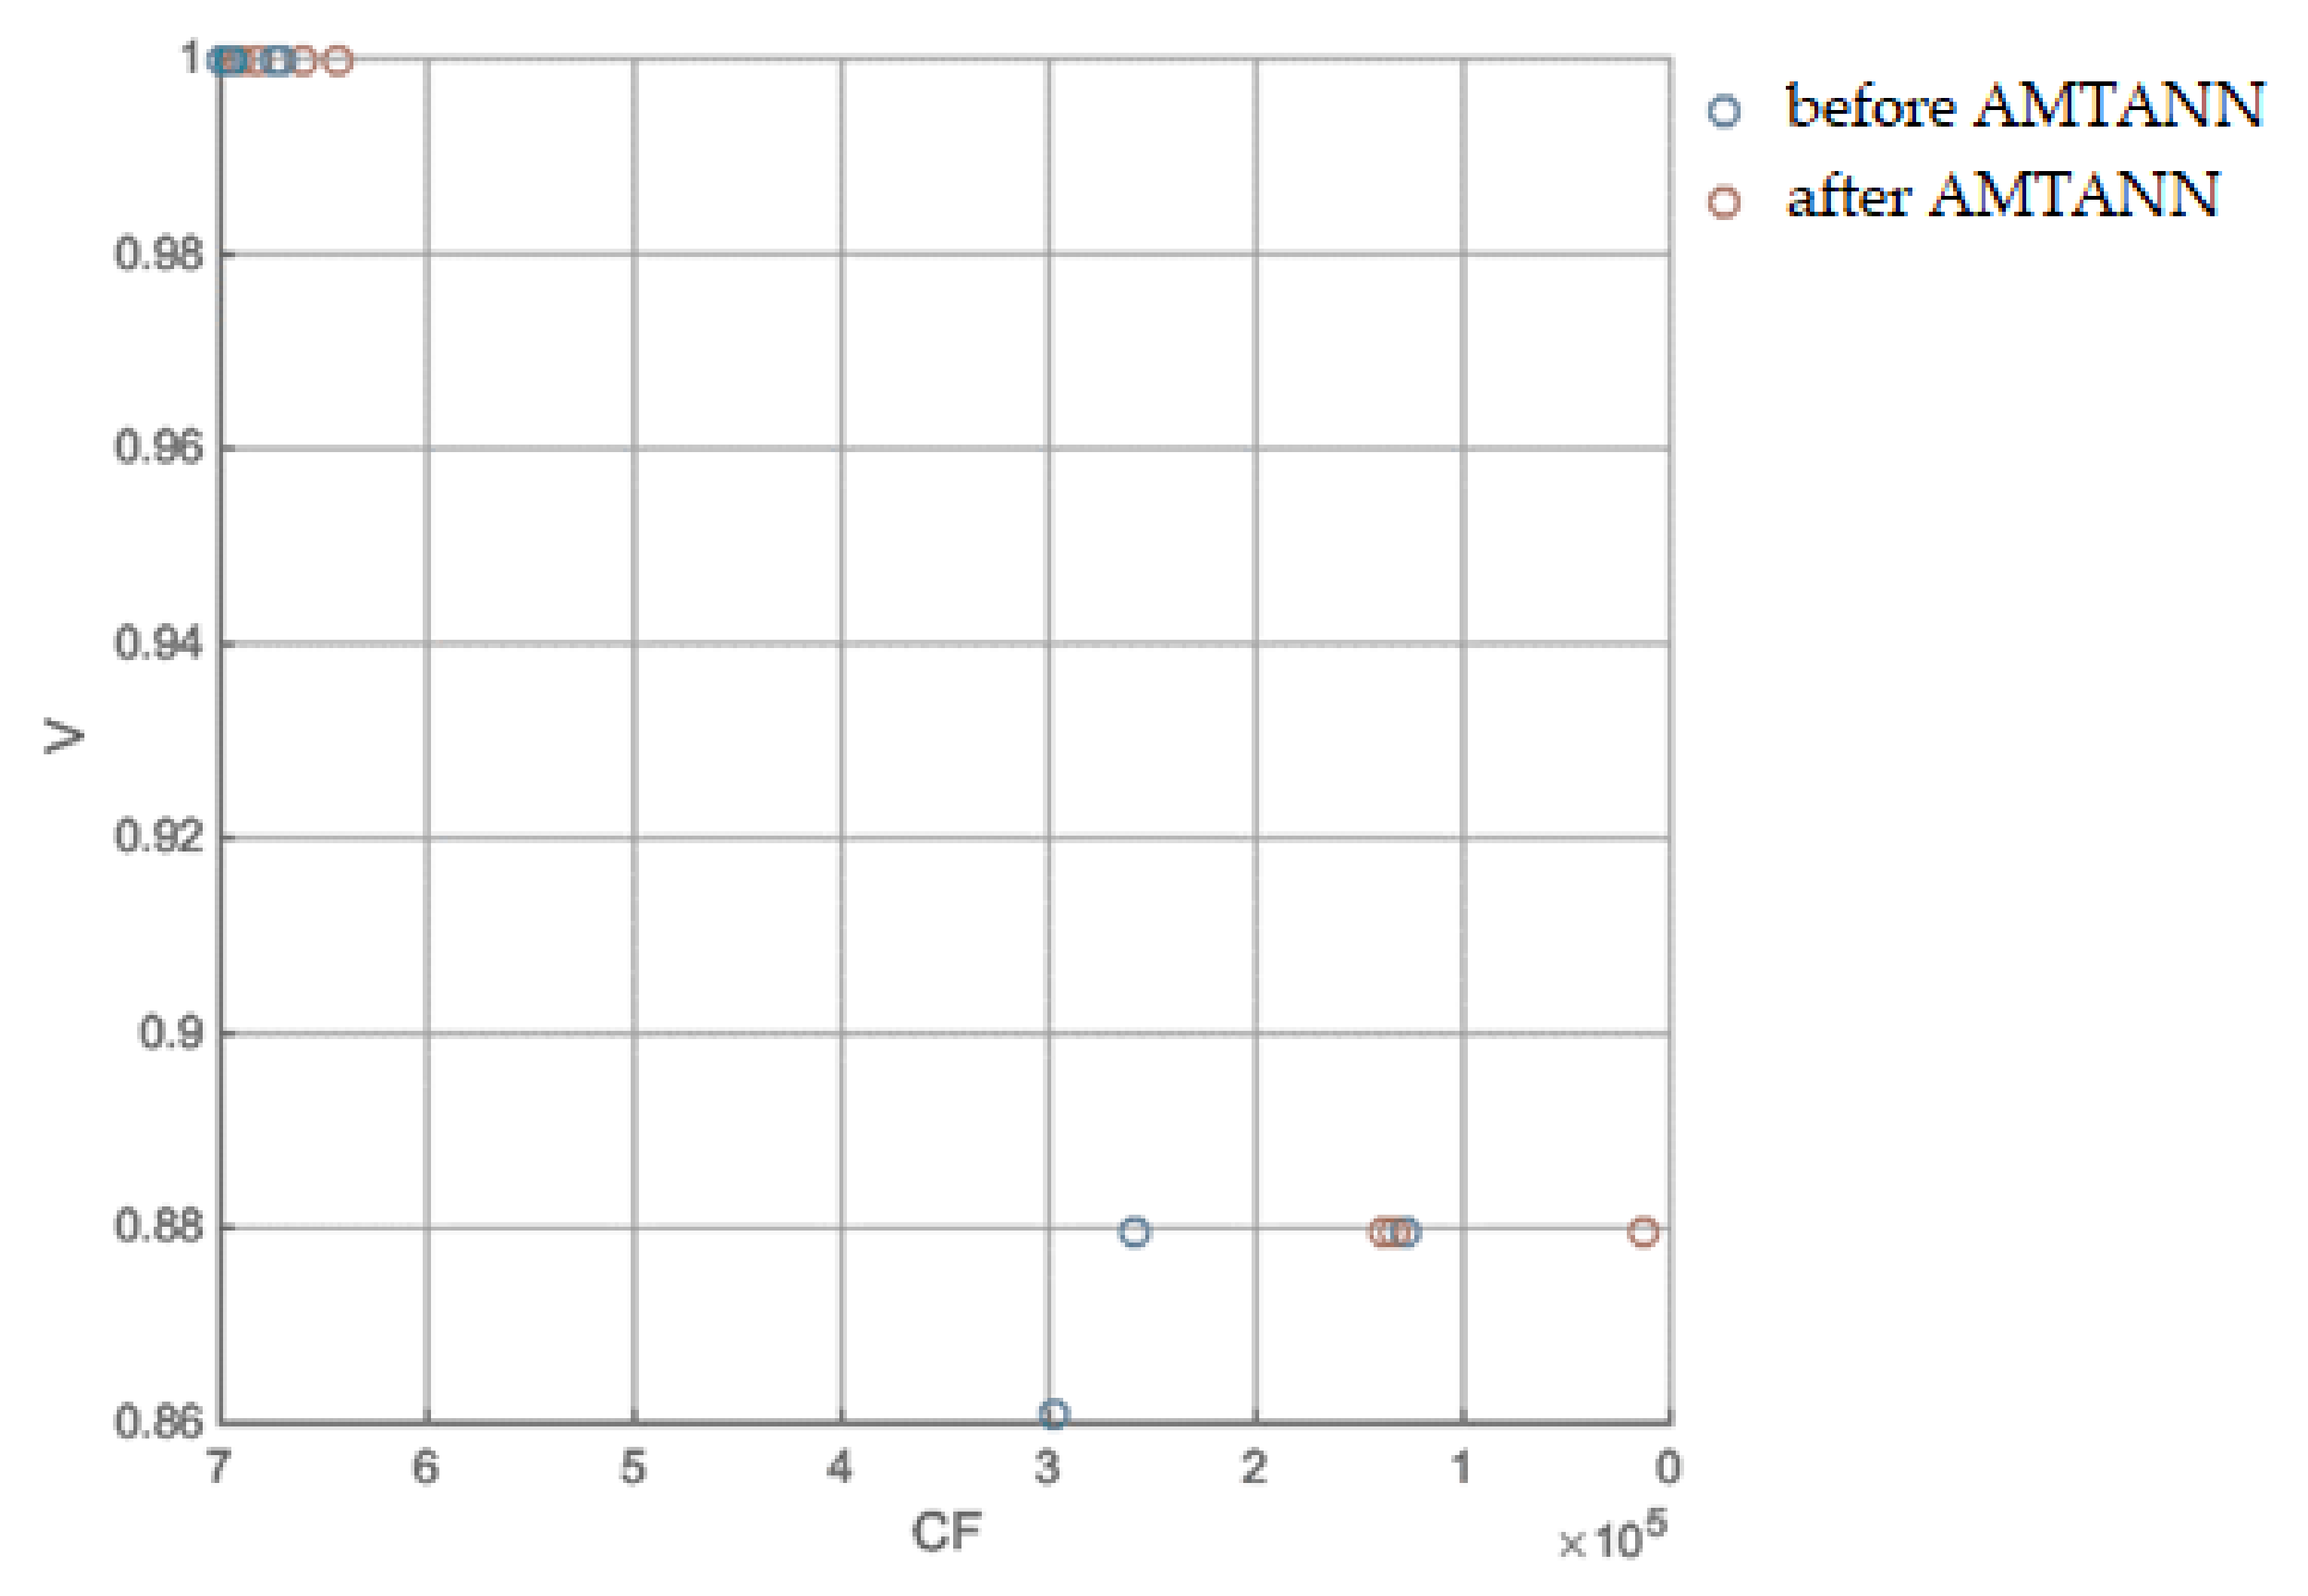
| V | 1 | 1 | 0.879577 | 1 | 1 | 1 | 0.879788 | 0.879577 | 1 | 1 |
| CF [EUR] | 659,527 | 690,964 | 138,159 | 682,408 | 659,527 | 690,964 | 132,835 | 12,318 | 642,875 | 659,527 |
| Before use of AMTANN | ||||||||||
| NPVr | 0.94736 | 0.86367 | 0.85967 | 0.94819 | 0.94854 | 0.94959 | 0.91856 | 0.87390 | 0.86345 | 0.86316 |
| Vr | 1.00000 | 1.00000 | 0.17832 | 1.00000 | 1.00000 | 1.00000 | 0.05026 | 0.17977 | 1.00000 | 1.00000 |
| CFr | 0.35684 | 0.35486 | 0.13182 | 0.35391 | 0.34203 | 0.33629 | 0.15205 | 0.06562 | 0.34349 | 0.34349 |
| OF | 0.529644 | 0.70134 | 0.063422 | 0.789142 | 0.600717 | 0.736126 | 0.097509 | 0.083971 | 0.738341 | 0.617618 |
| Duration [d] | 132 | 136 | 108 | 132 | 132 | 132 | 112 | 112 | 136 | 136 |
| NPV [EUR] | 1,623,042 | 1,491,217 | 1,484,922 | 1,624,346 | 1,624,897 | 1,626,556 | 1,577,672 | 1,507,331 | 1,490,873 | 1,490,416 |
| V | 1 | 1 | 0.879577 | 1 | 1 | 1 | 0.860808 | 0.879788 | 1 | 1 |
| CF [EUR] | 699,835 | 695,946 | 258,534 | 694,083 | 670,794 | 659,527 | 298,192 | 128,695 | 673,655 | 673,655 |
| Variable No. | Variable Name | Selected Variant |
|---|---|---|
| Variables concerning materials and technological variants (execution modes) | ||
| 1 | Construction material variant | 1 |
| 2 | Partition walls variant | 2 |
| Delay variables (values in weeks) | ||
| 3 | 5. Level -1: Columns | 3 |
| 4 | 6. Level -1: Walls 1 | 0 |
| 5 | 7. Level -1: Walls 2 | 0 |
| 6 | 8. Level -1: Access ramp | 2 |
| 7 | 11. Level 0: Columns | 2 |
| 8 | 12. Level 0: Walls 1 | 0 |
| 9 | 13. Level 0: Walls 2 | 0 |
| 10 | 14. Level 0: Stairs | 0 |
| 11 | 17. Level 1: Columns | 0 |
| 12 | 18. Level 1: Walls 1 | 0 |
| 13 | 19. Level 1: Walls 2 | 3 |
| 14 | 20. Level 1: Stairs | 0 |
| 15 | 23. Level 2: Columns | 0 |
| 16 | 24. Level 2: Walls 1 | 0 |
| 17 | 25. Level 2: Walls 2 | 3 |
| 18 | 26. Level 2: Stairs | 0 |
| 19 | 29. Level 3: Columns | 2 |
| 20 | 30. Level 3: Walls 1 | 3 |
| 21 | 31. Level 3: Walls 2 | 2 |
| 22 | 32. Level 3: Stairs | 0 |
| 23 | 35. Level 4: Columns | 3 |
| 24 | 36. Level 4: Walls 1 | 2 |
| 25 | 37. Level 4: Walls 2 | 2 |
| 26 | 38. Level 4: Stairs | 0 |
| 27 | 41. Level 5: Columns | 3 |
| 28 | 42. Level 5: Walls 1 | 3 |
| 29 | 43. Level 5: Walls 2 | 2 |
| 30 | 46. Level 5: Stairs | 0 |
| 31 | 47. Level 6: Columns | 2 |
| 32 | 47. Level 6: Walls 1 | 0 |
| 33 | 49. Level 6: Walls 2 | 1 |
| 34 | 51. Level 6: Beams, joists (in variant 2, together with the stairs) | 0 |
| 35 | 52. Partition walls | 0 |
| Metaheuristic Optimization Results | Initial Solutions | ||||
|---|---|---|---|---|---|
| After AMTANN | Before AMTANN | Variant 1 | Variant 2 | Variant 3 | |
| OF | 0.789 | 0.701 | 0.386 | 0.464 | 0.117 |
| NPV [EUR] | 1,686,580 | 1,491,217 | 759,324 | 1,210,342 | 488,605 |
| V | 1.000 | 1.000 | 0.993 | 0.880 | 0.861 |
| CF [EUR] | 690,964 | 695,946 | 468,775 | 552,907 | 645,295 |
Publisher’s Note: MDPI stays neutral with regard to jurisdictional claims in published maps and institutional affiliations. |
© 2022 by the author. Licensee MDPI, Basel, Switzerland. This article is an open access article distributed under the terms and conditions of the Creative Commons Attribution (CC BY) license (https://creativecommons.org/licenses/by/4.0/).
Share and Cite
Rosłon, J. Materials and Technology Selection for Construction Projects Supported with the Use of Artificial Intelligence. Materials 2022, 15, 1282. https://doi.org/10.3390/ma15041282
Rosłon J. Materials and Technology Selection for Construction Projects Supported with the Use of Artificial Intelligence. Materials. 2022; 15(4):1282. https://doi.org/10.3390/ma15041282
Chicago/Turabian StyleRosłon, Jerzy. 2022. "Materials and Technology Selection for Construction Projects Supported with the Use of Artificial Intelligence" Materials 15, no. 4: 1282. https://doi.org/10.3390/ma15041282
APA StyleRosłon, J. (2022). Materials and Technology Selection for Construction Projects Supported with the Use of Artificial Intelligence. Materials, 15(4), 1282. https://doi.org/10.3390/ma15041282


