Study of the Evolution of the Plastic Zone and Residual Stress in a Notched T-6061 Aluminum Sample

 ,
,  and
and 
Abstract
:1. Introduction
2. Material Description, Experimental Procedure, and Numerical Computation
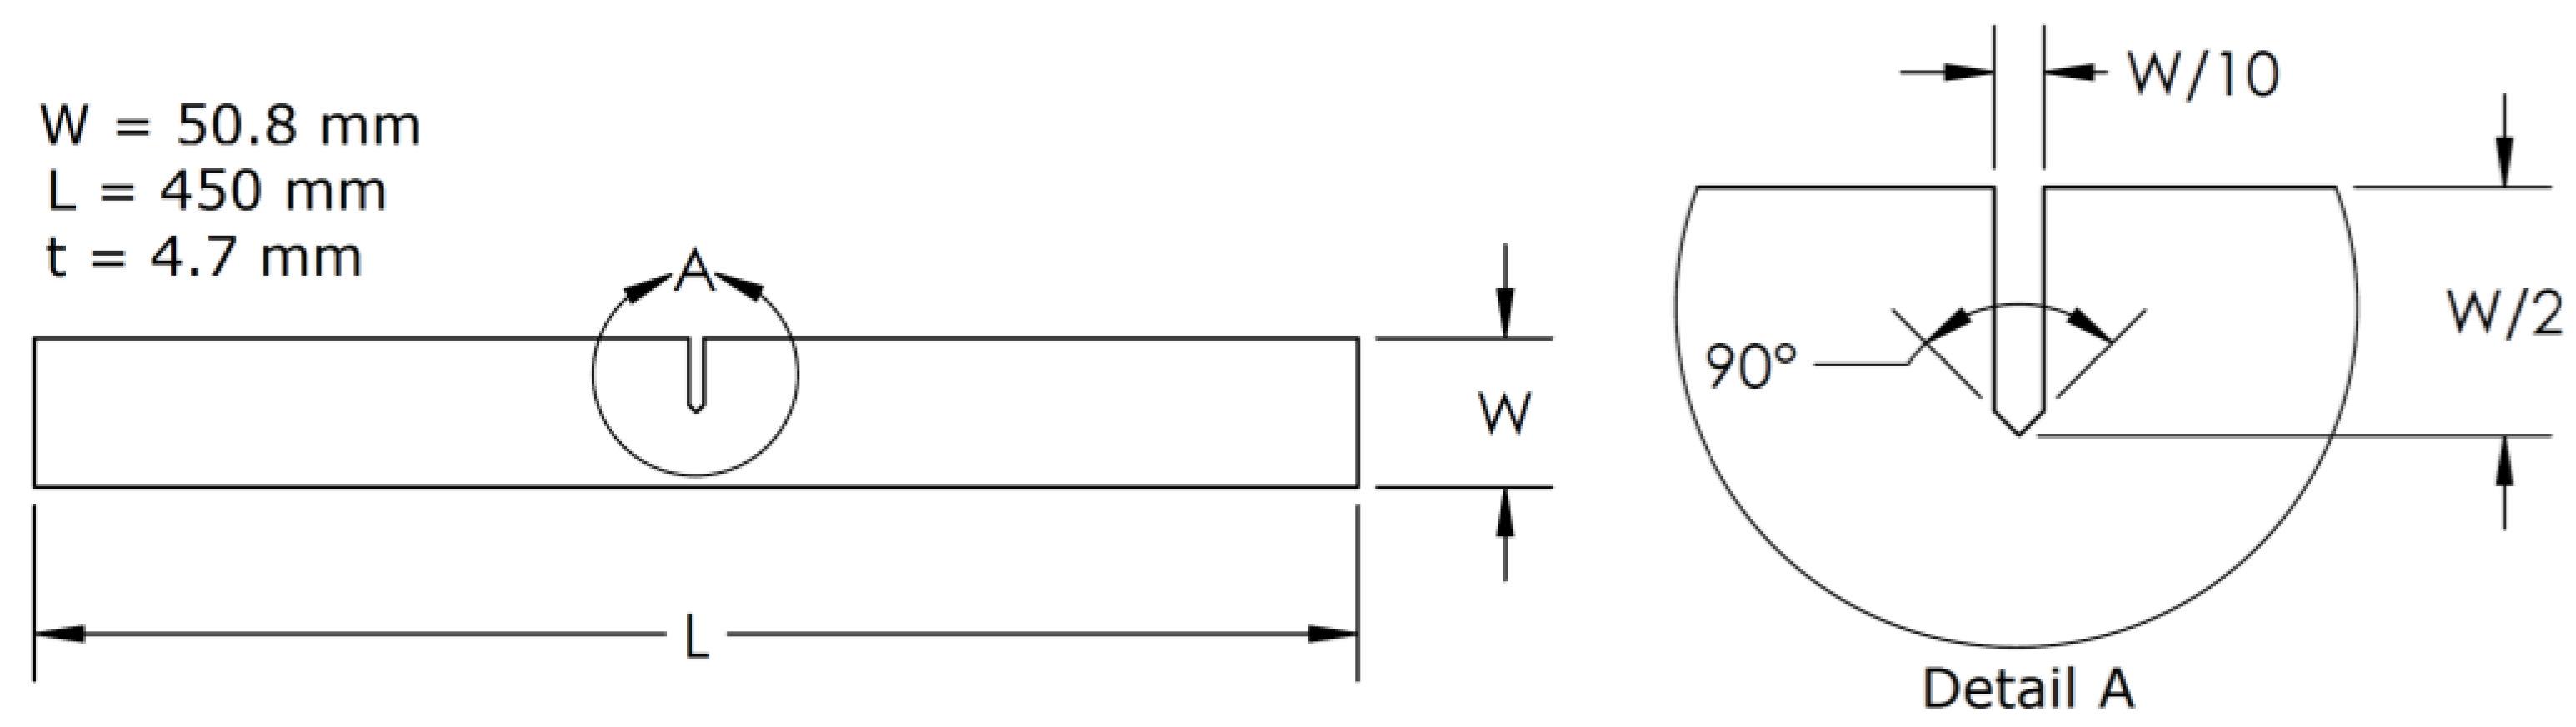
2.1. Material
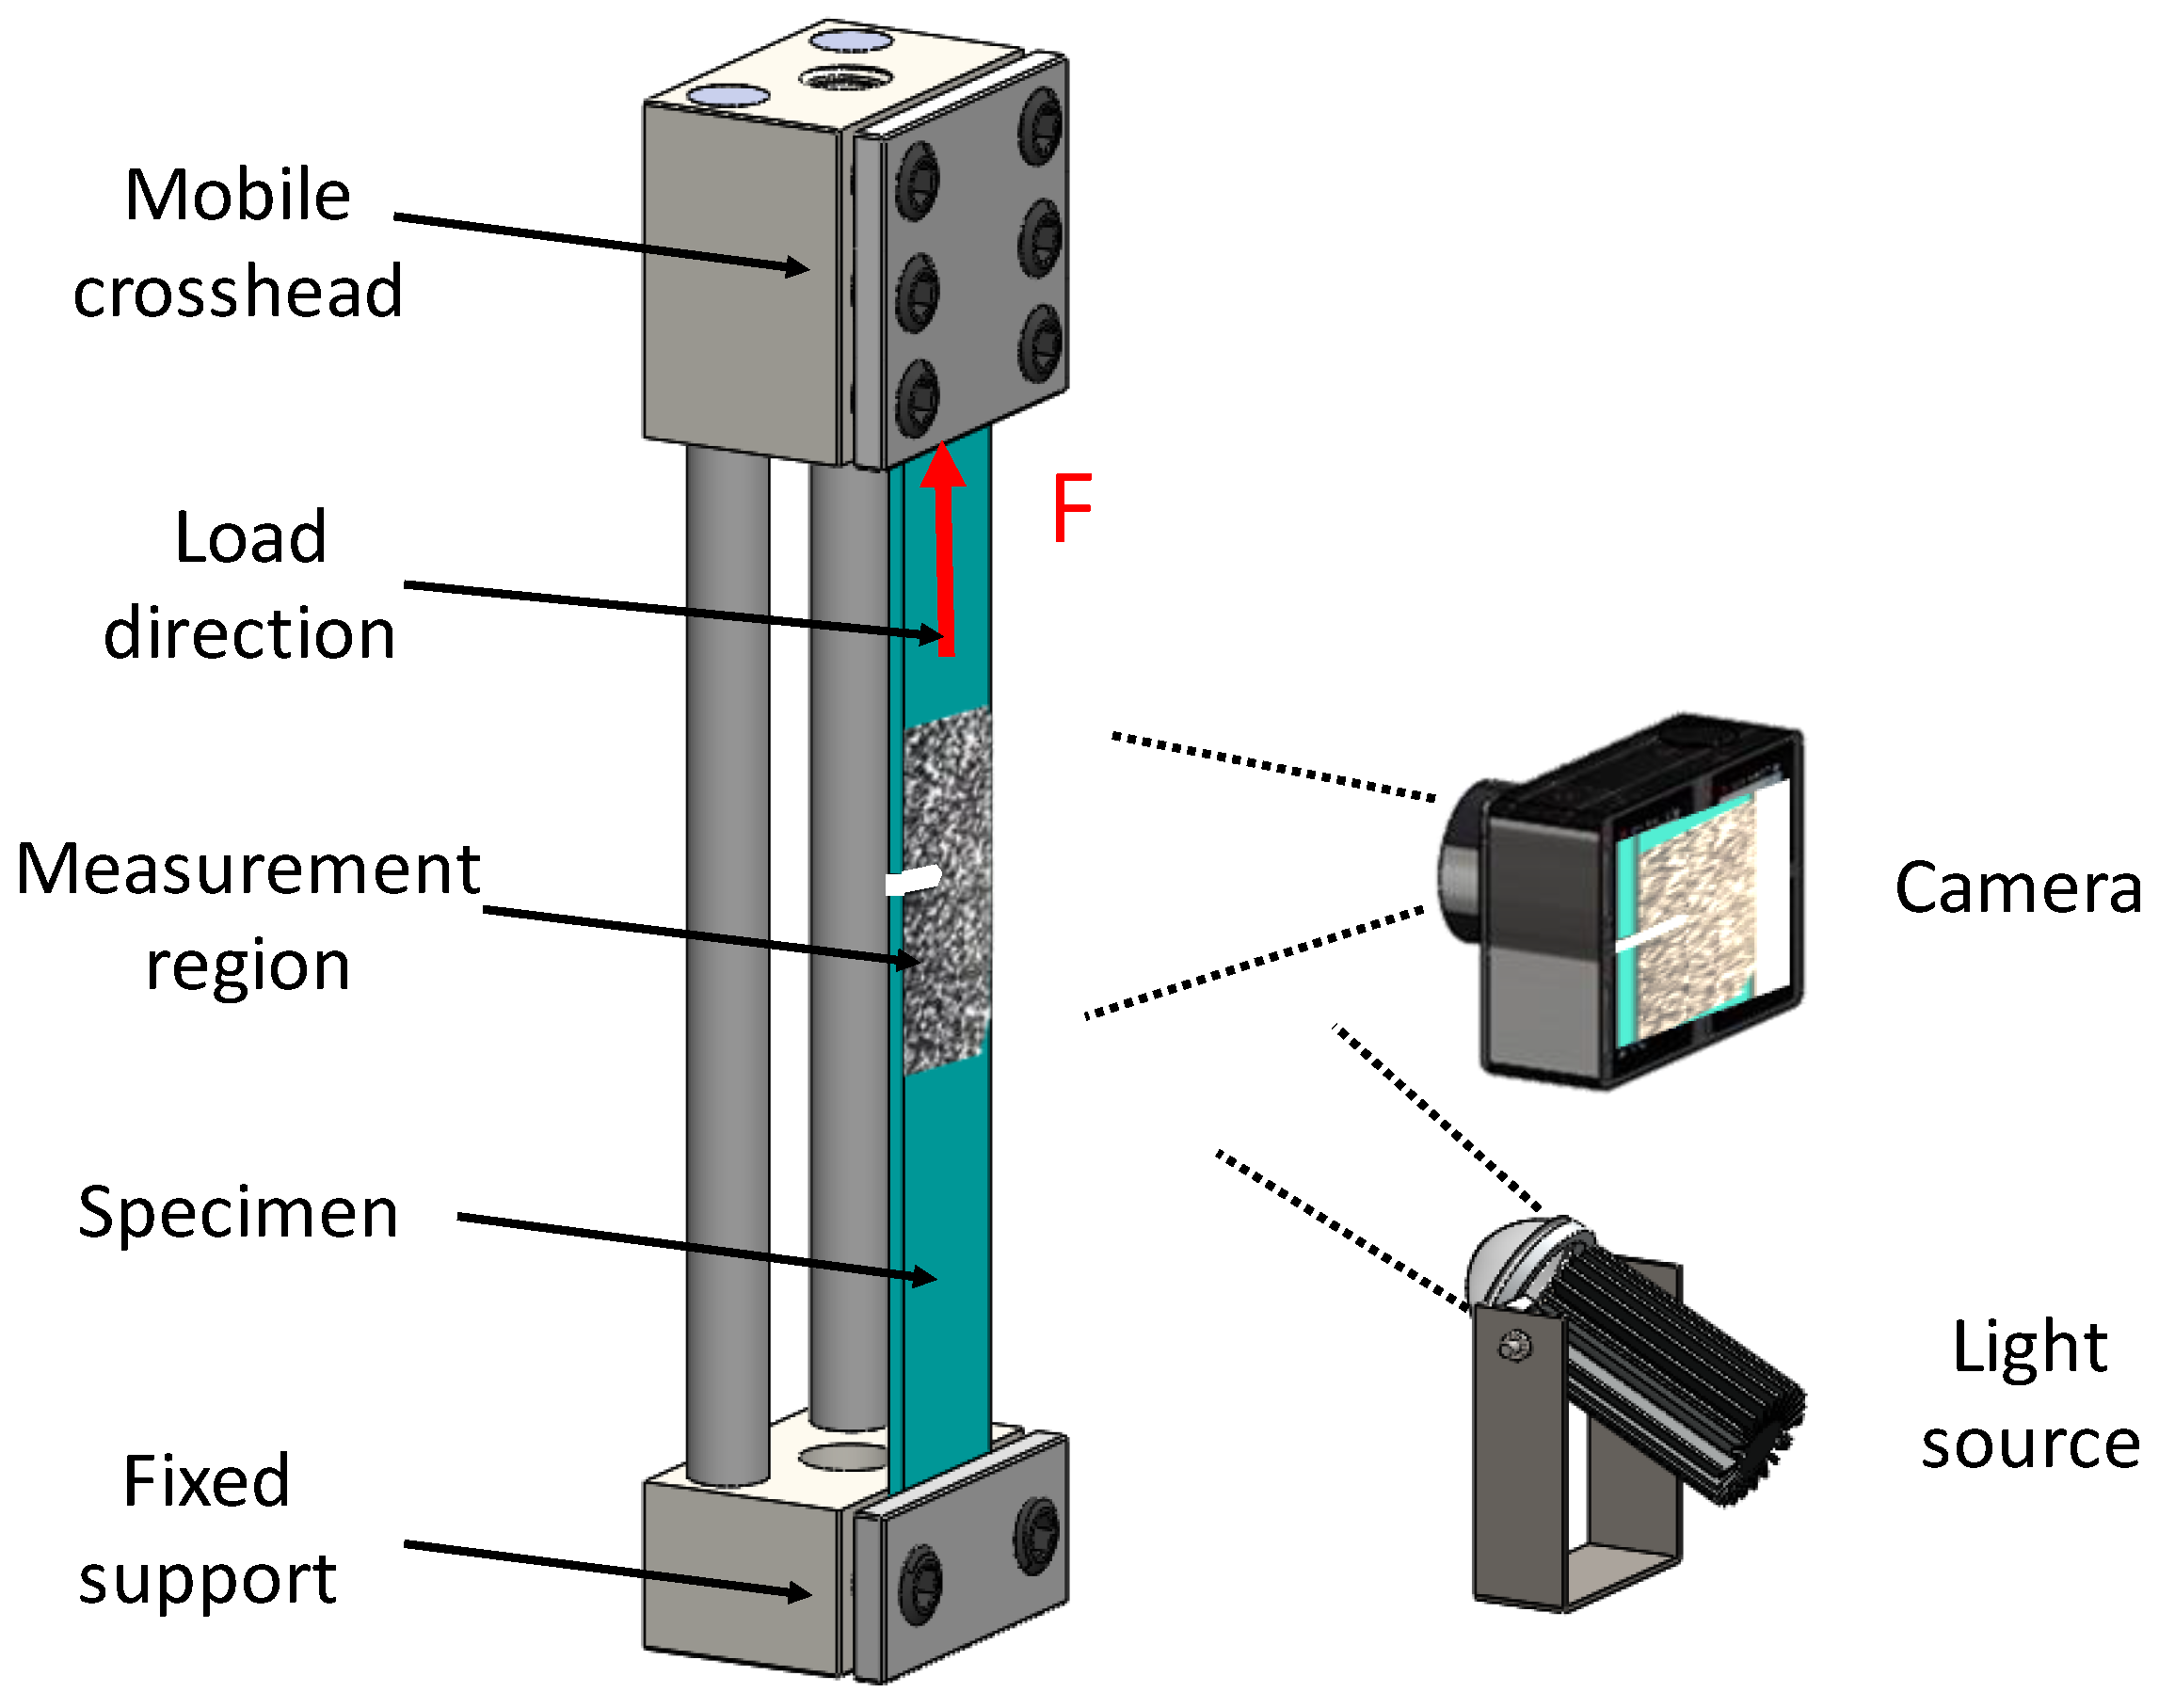
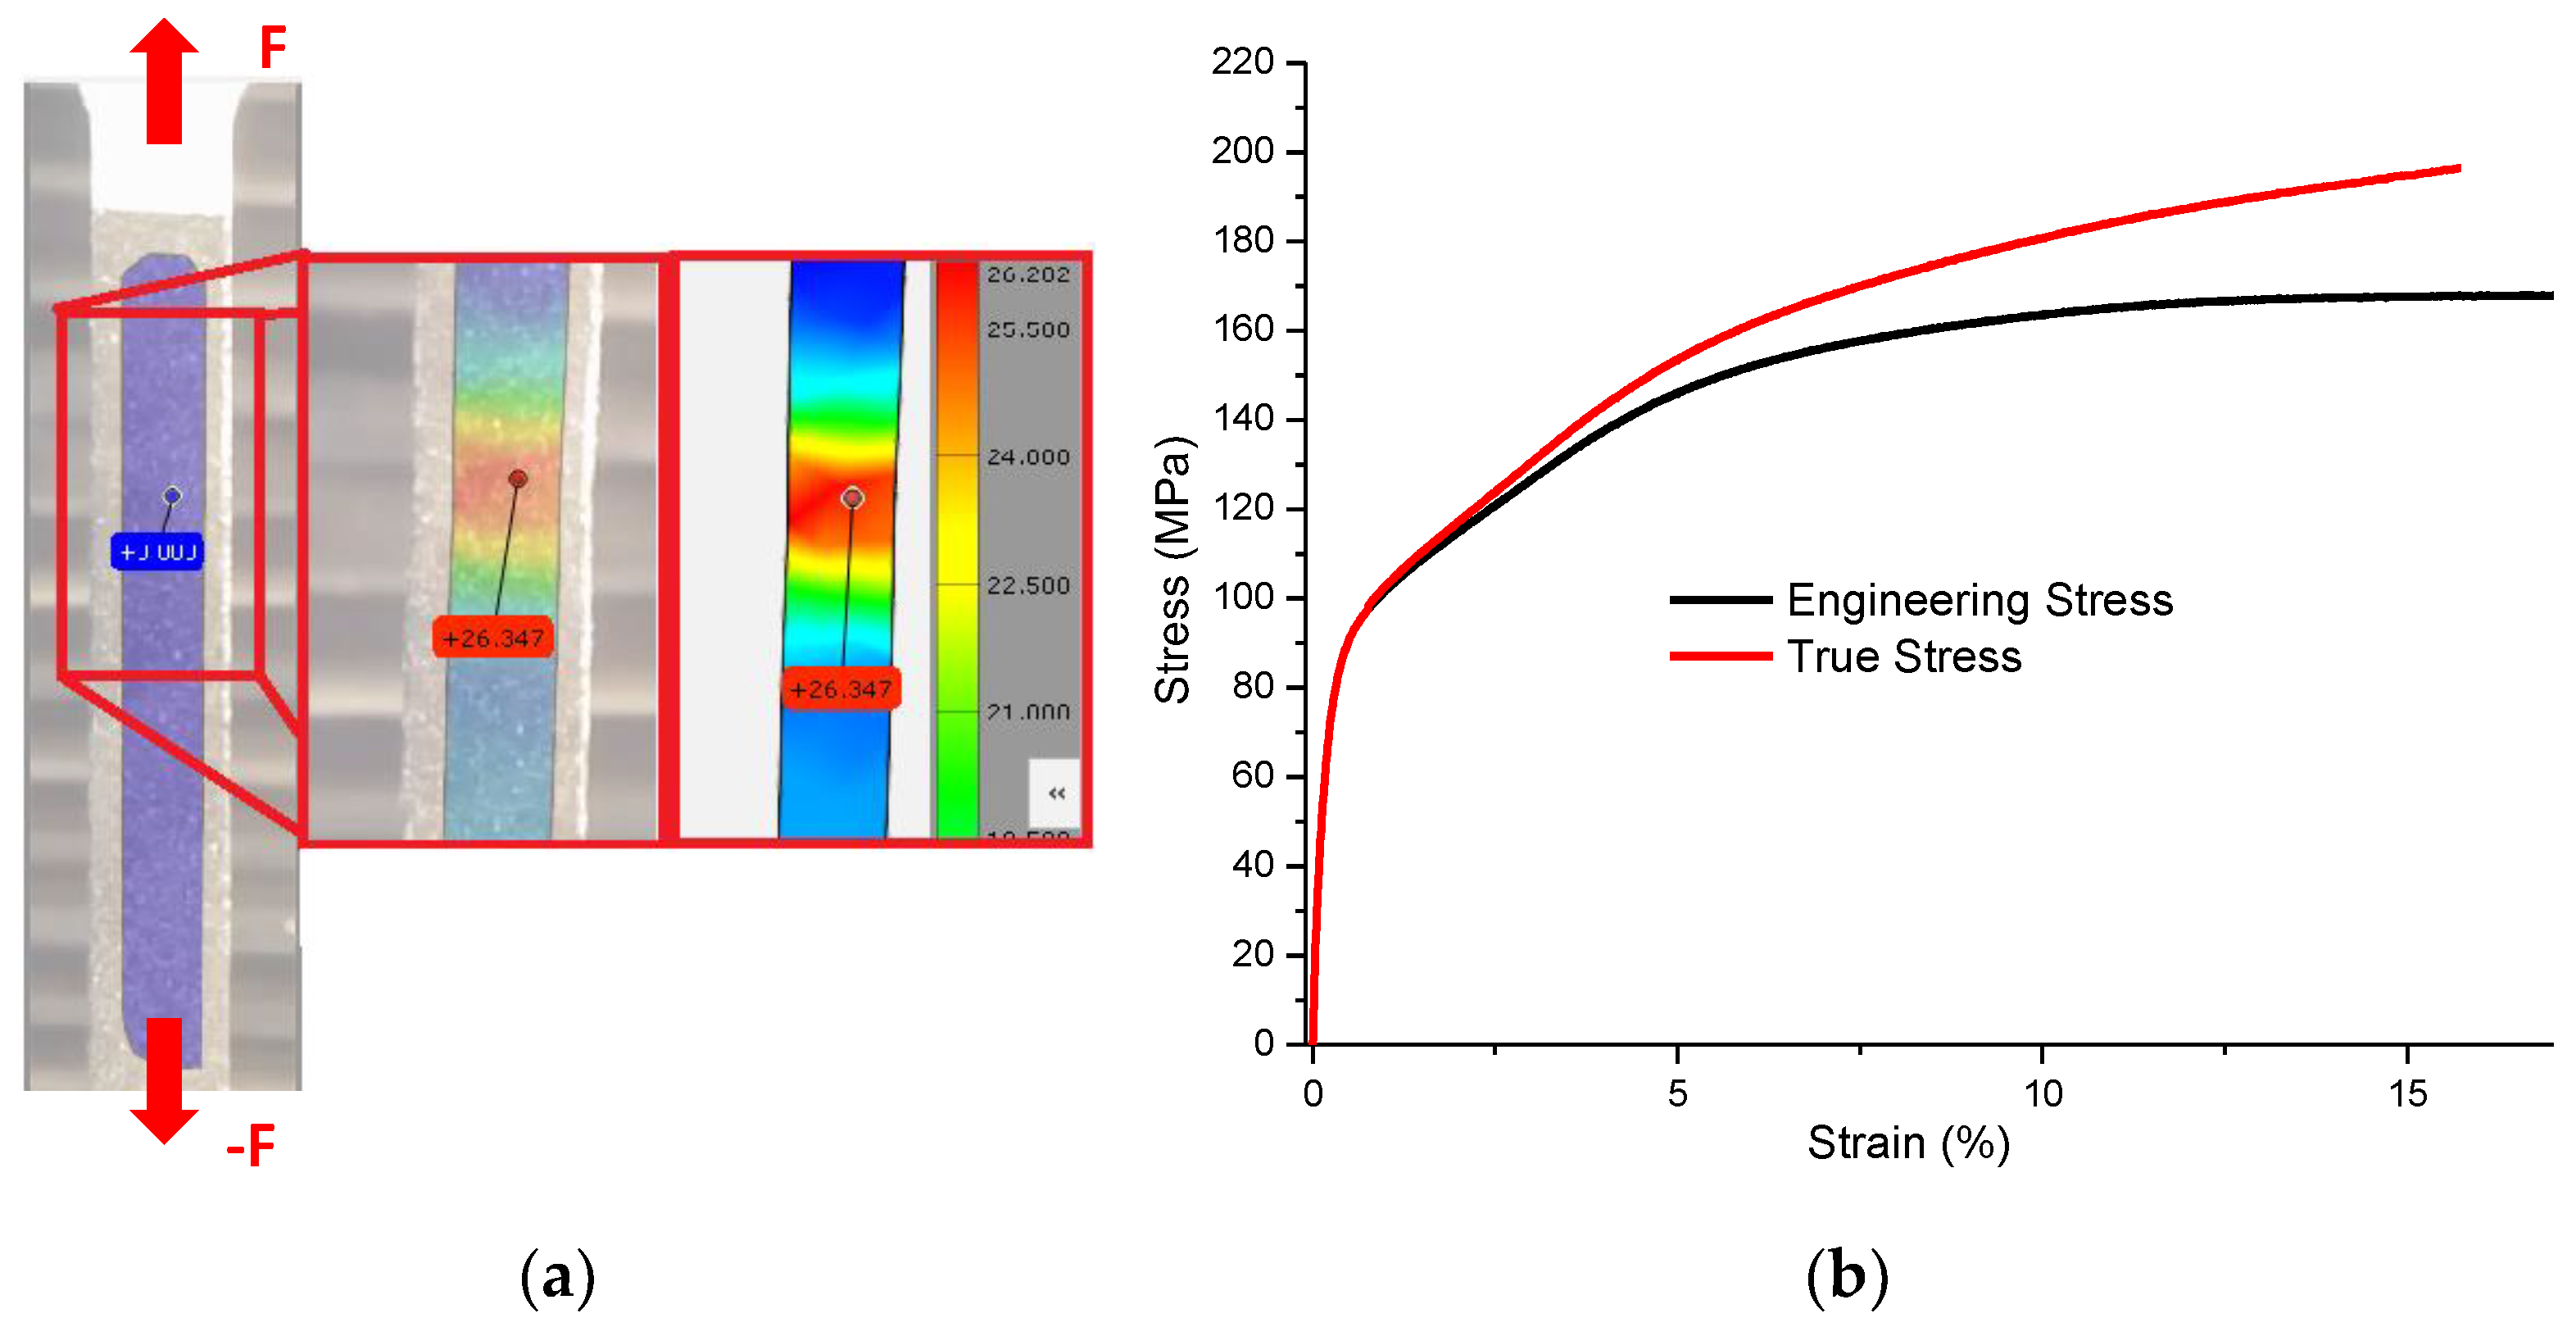
2.2. Tensile Test
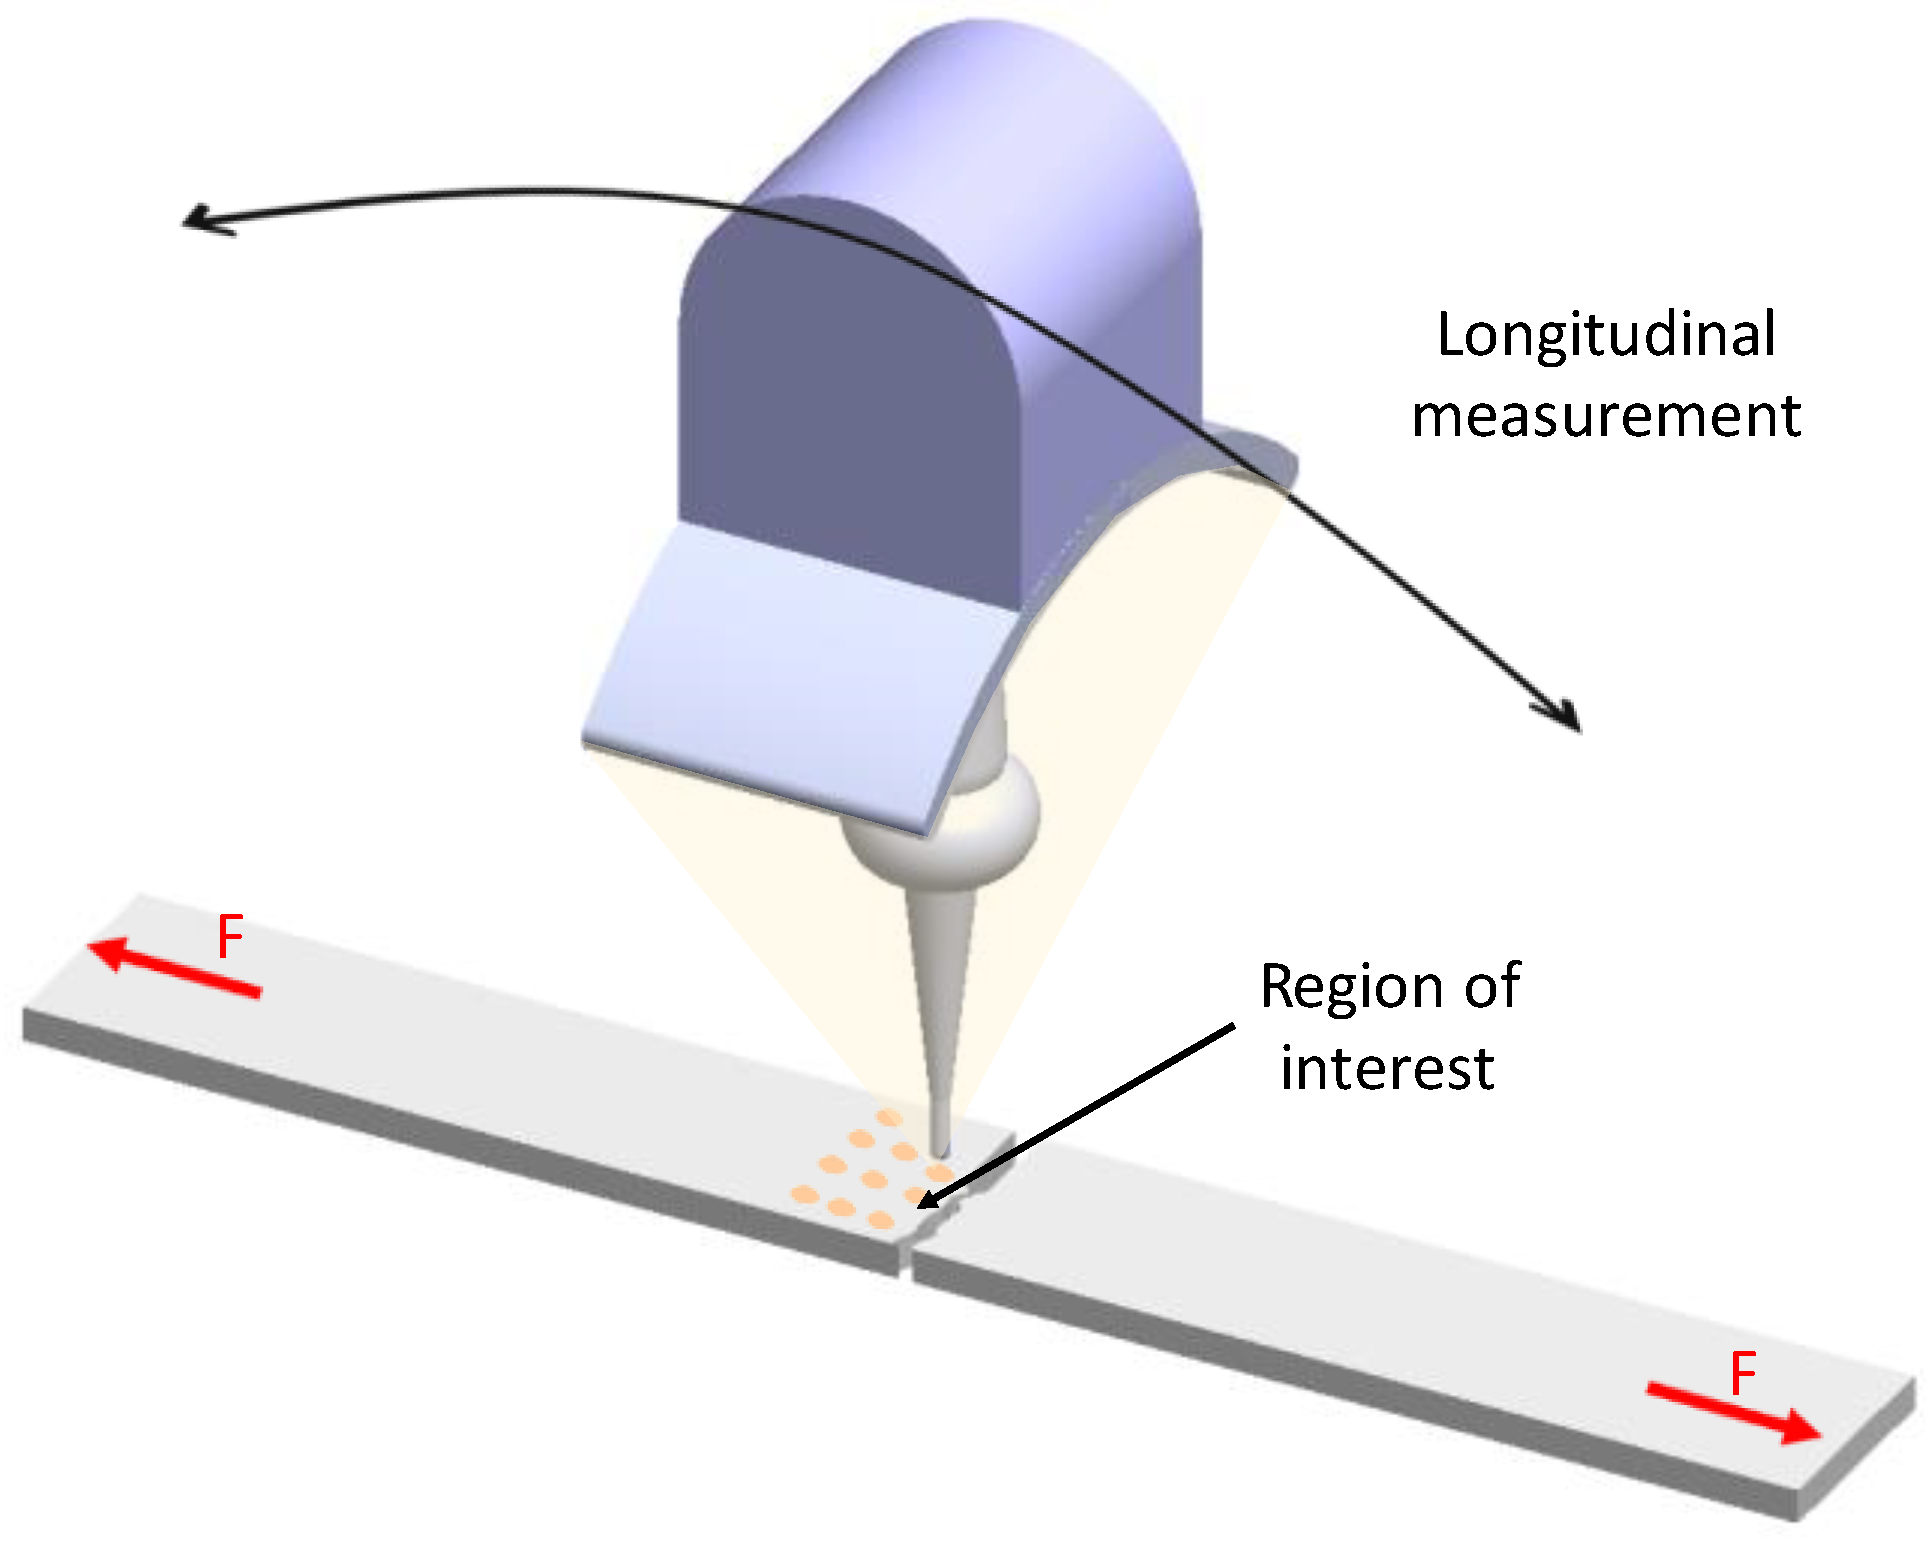
2.3. Digital Image Correlation
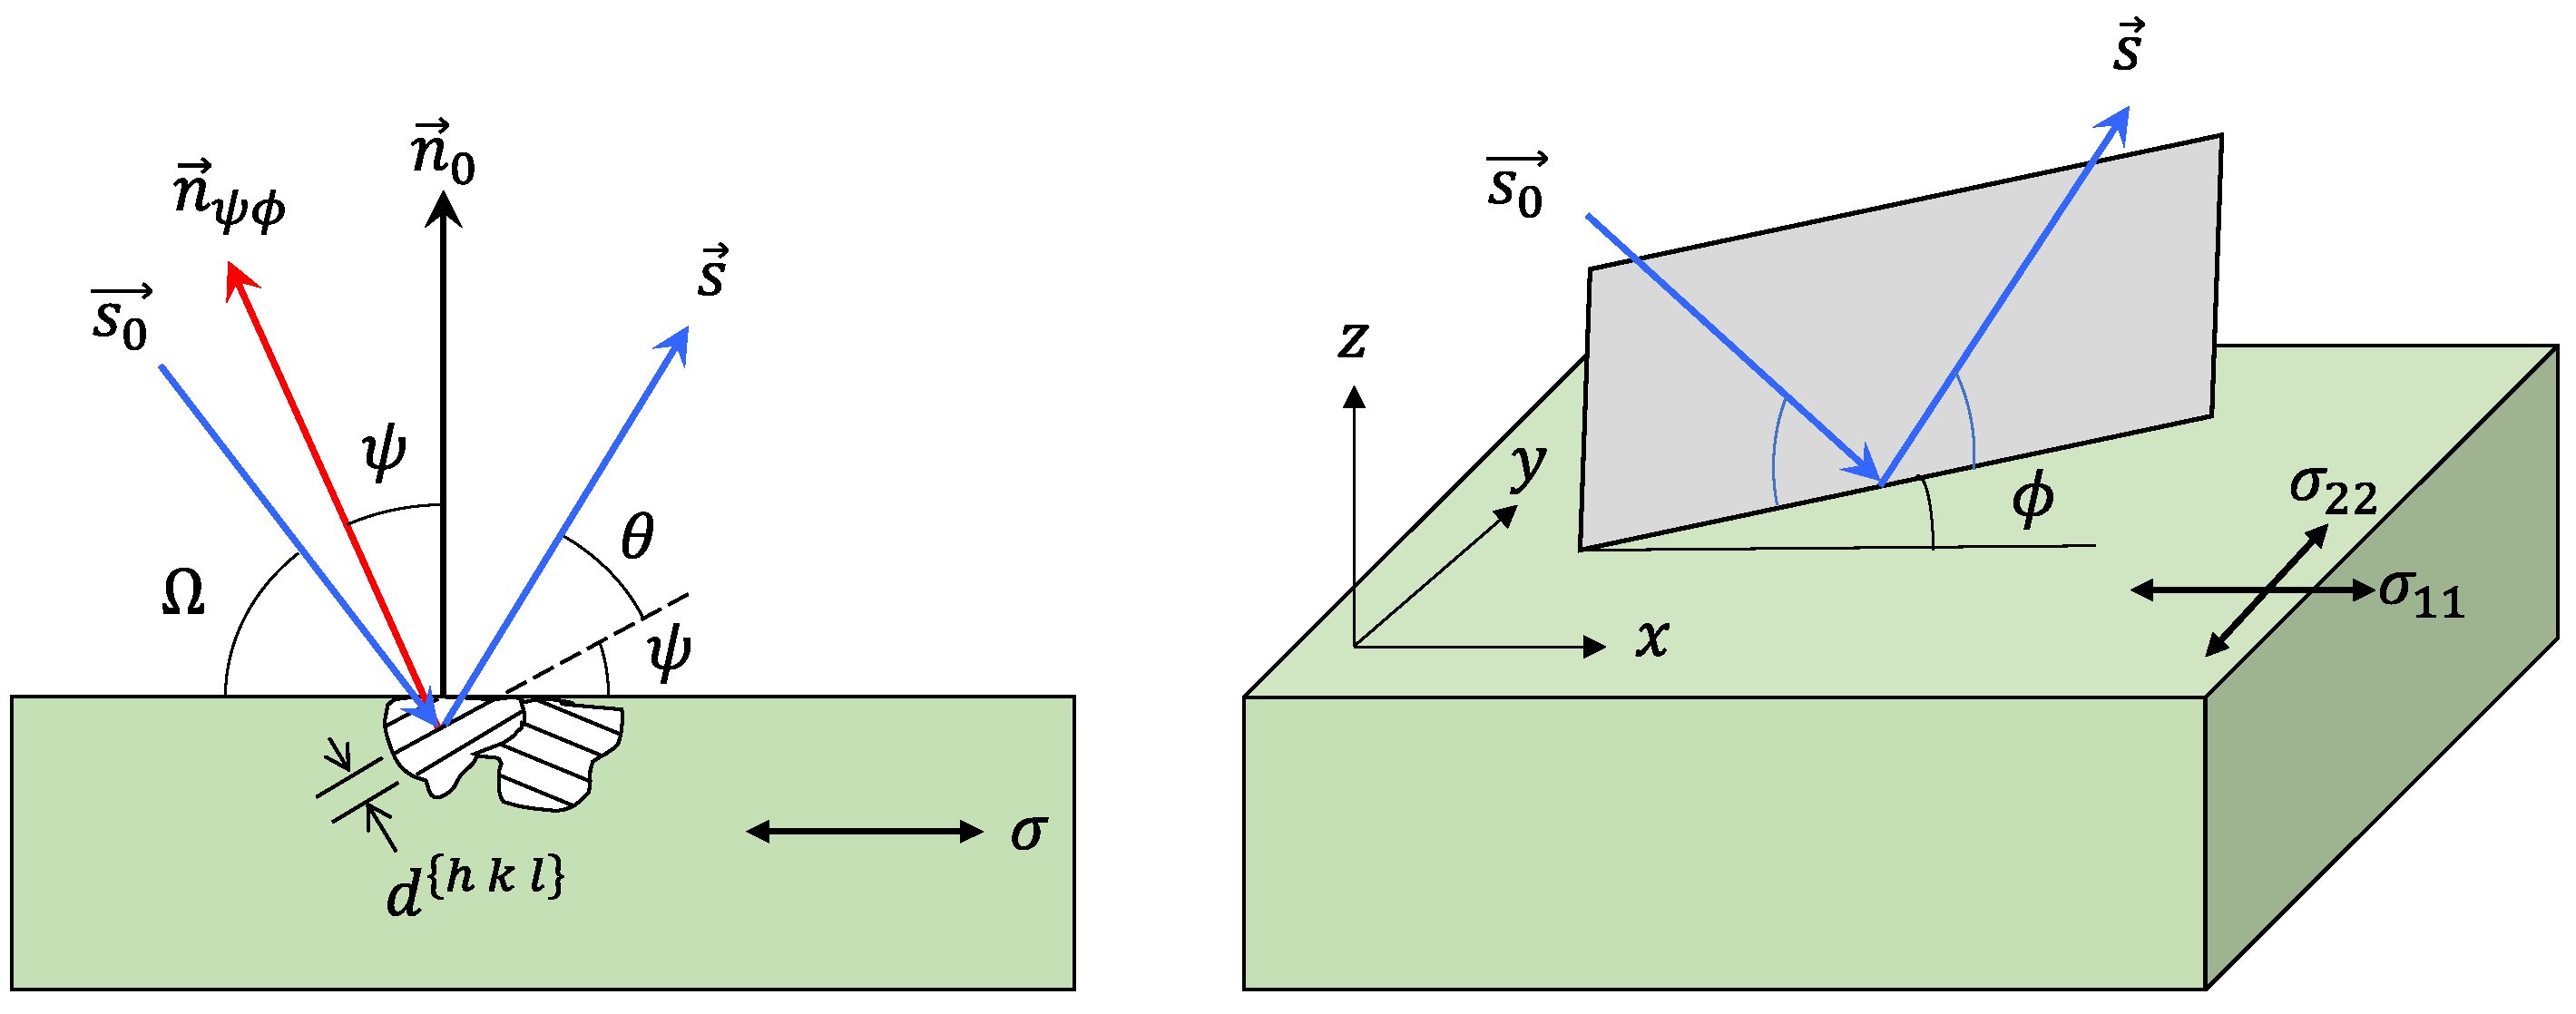
2.4. Residual Stress Measurement
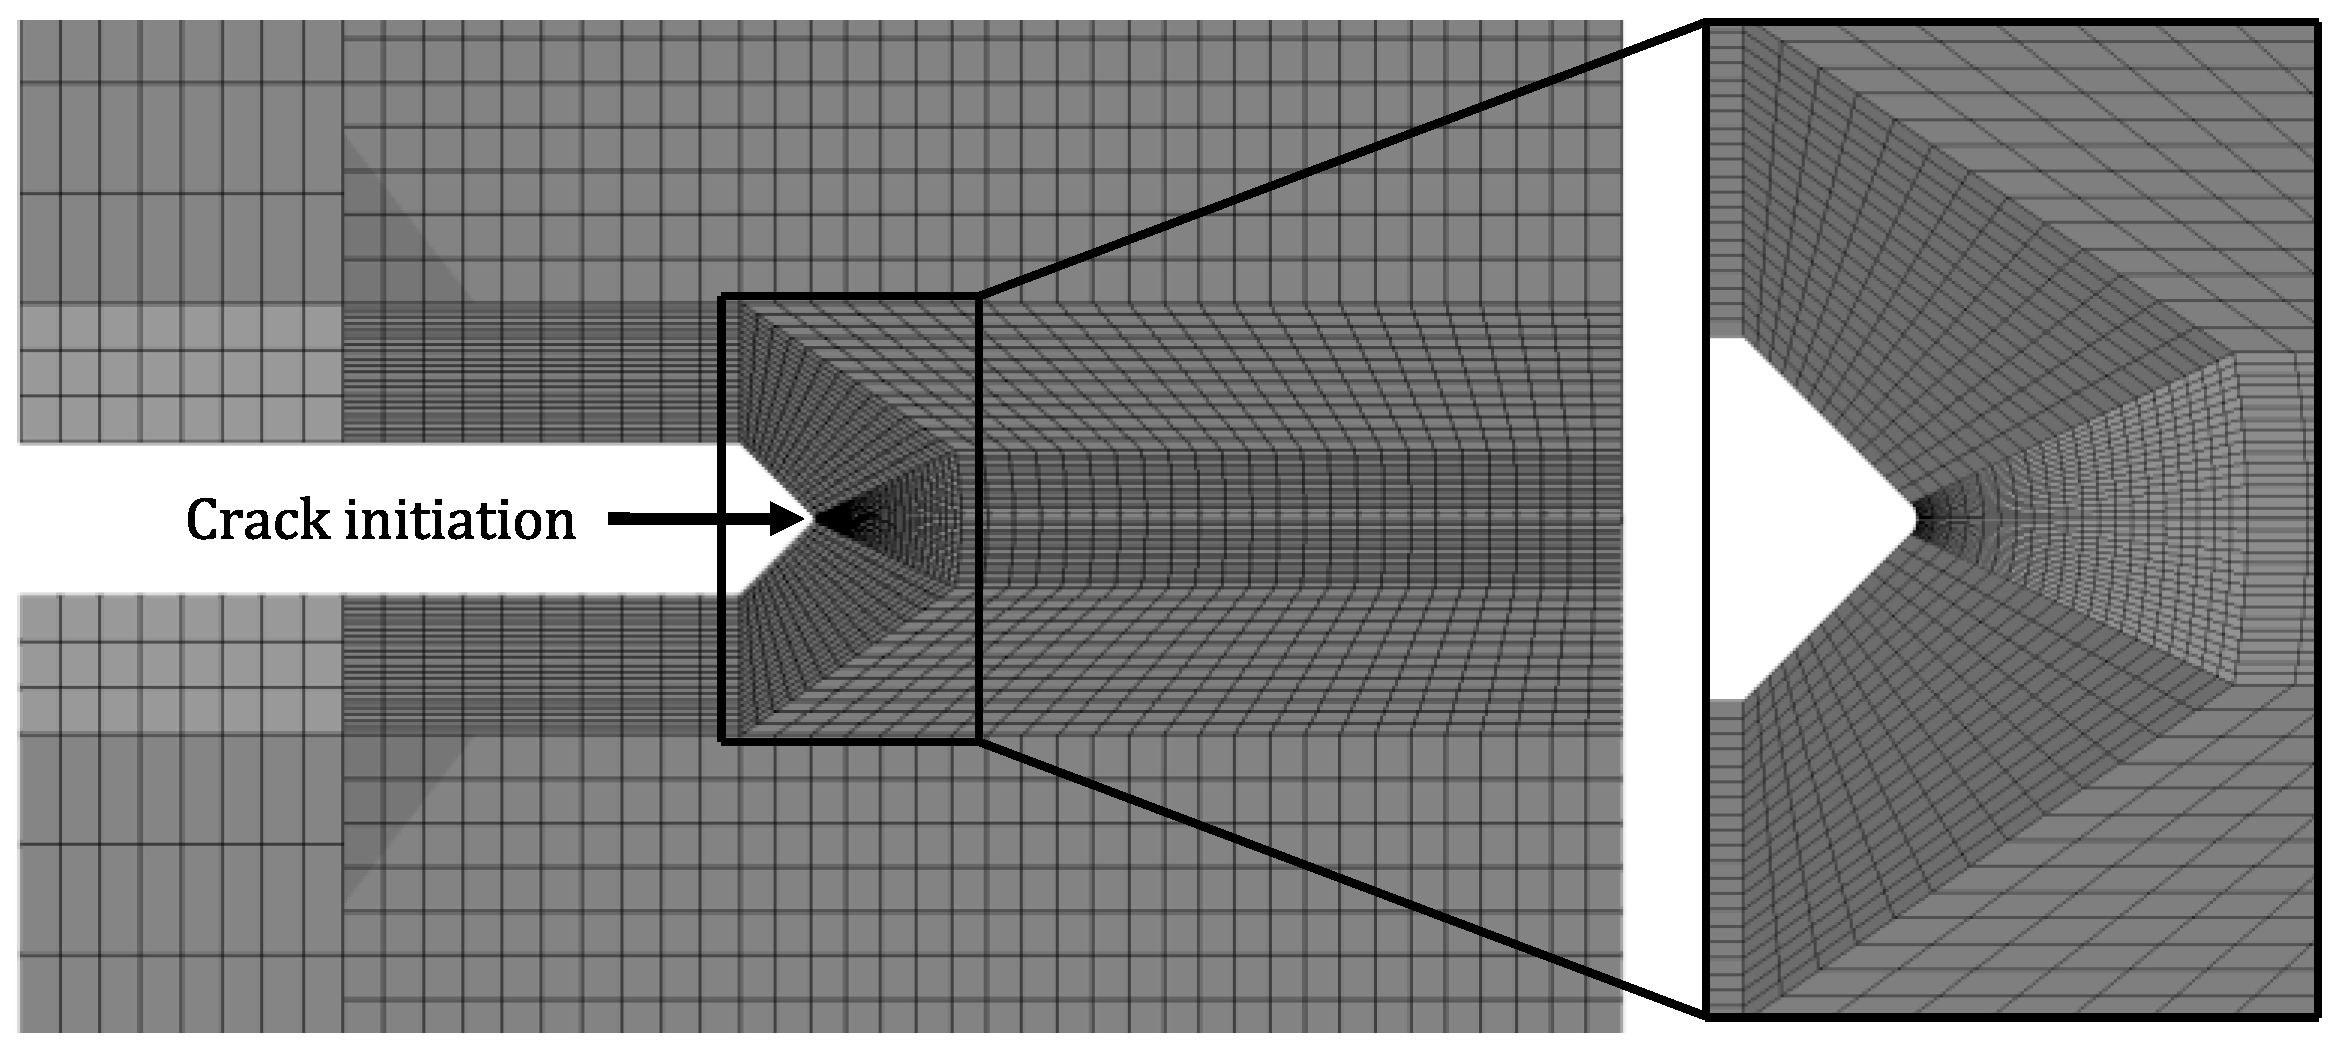
2.5. Finite Element Model
3. Results
3.1. Experimental Tensile Tests
3.2. Notched Specimen Tensile Test
3.3. Notched Specimen Plastic Region Evolution
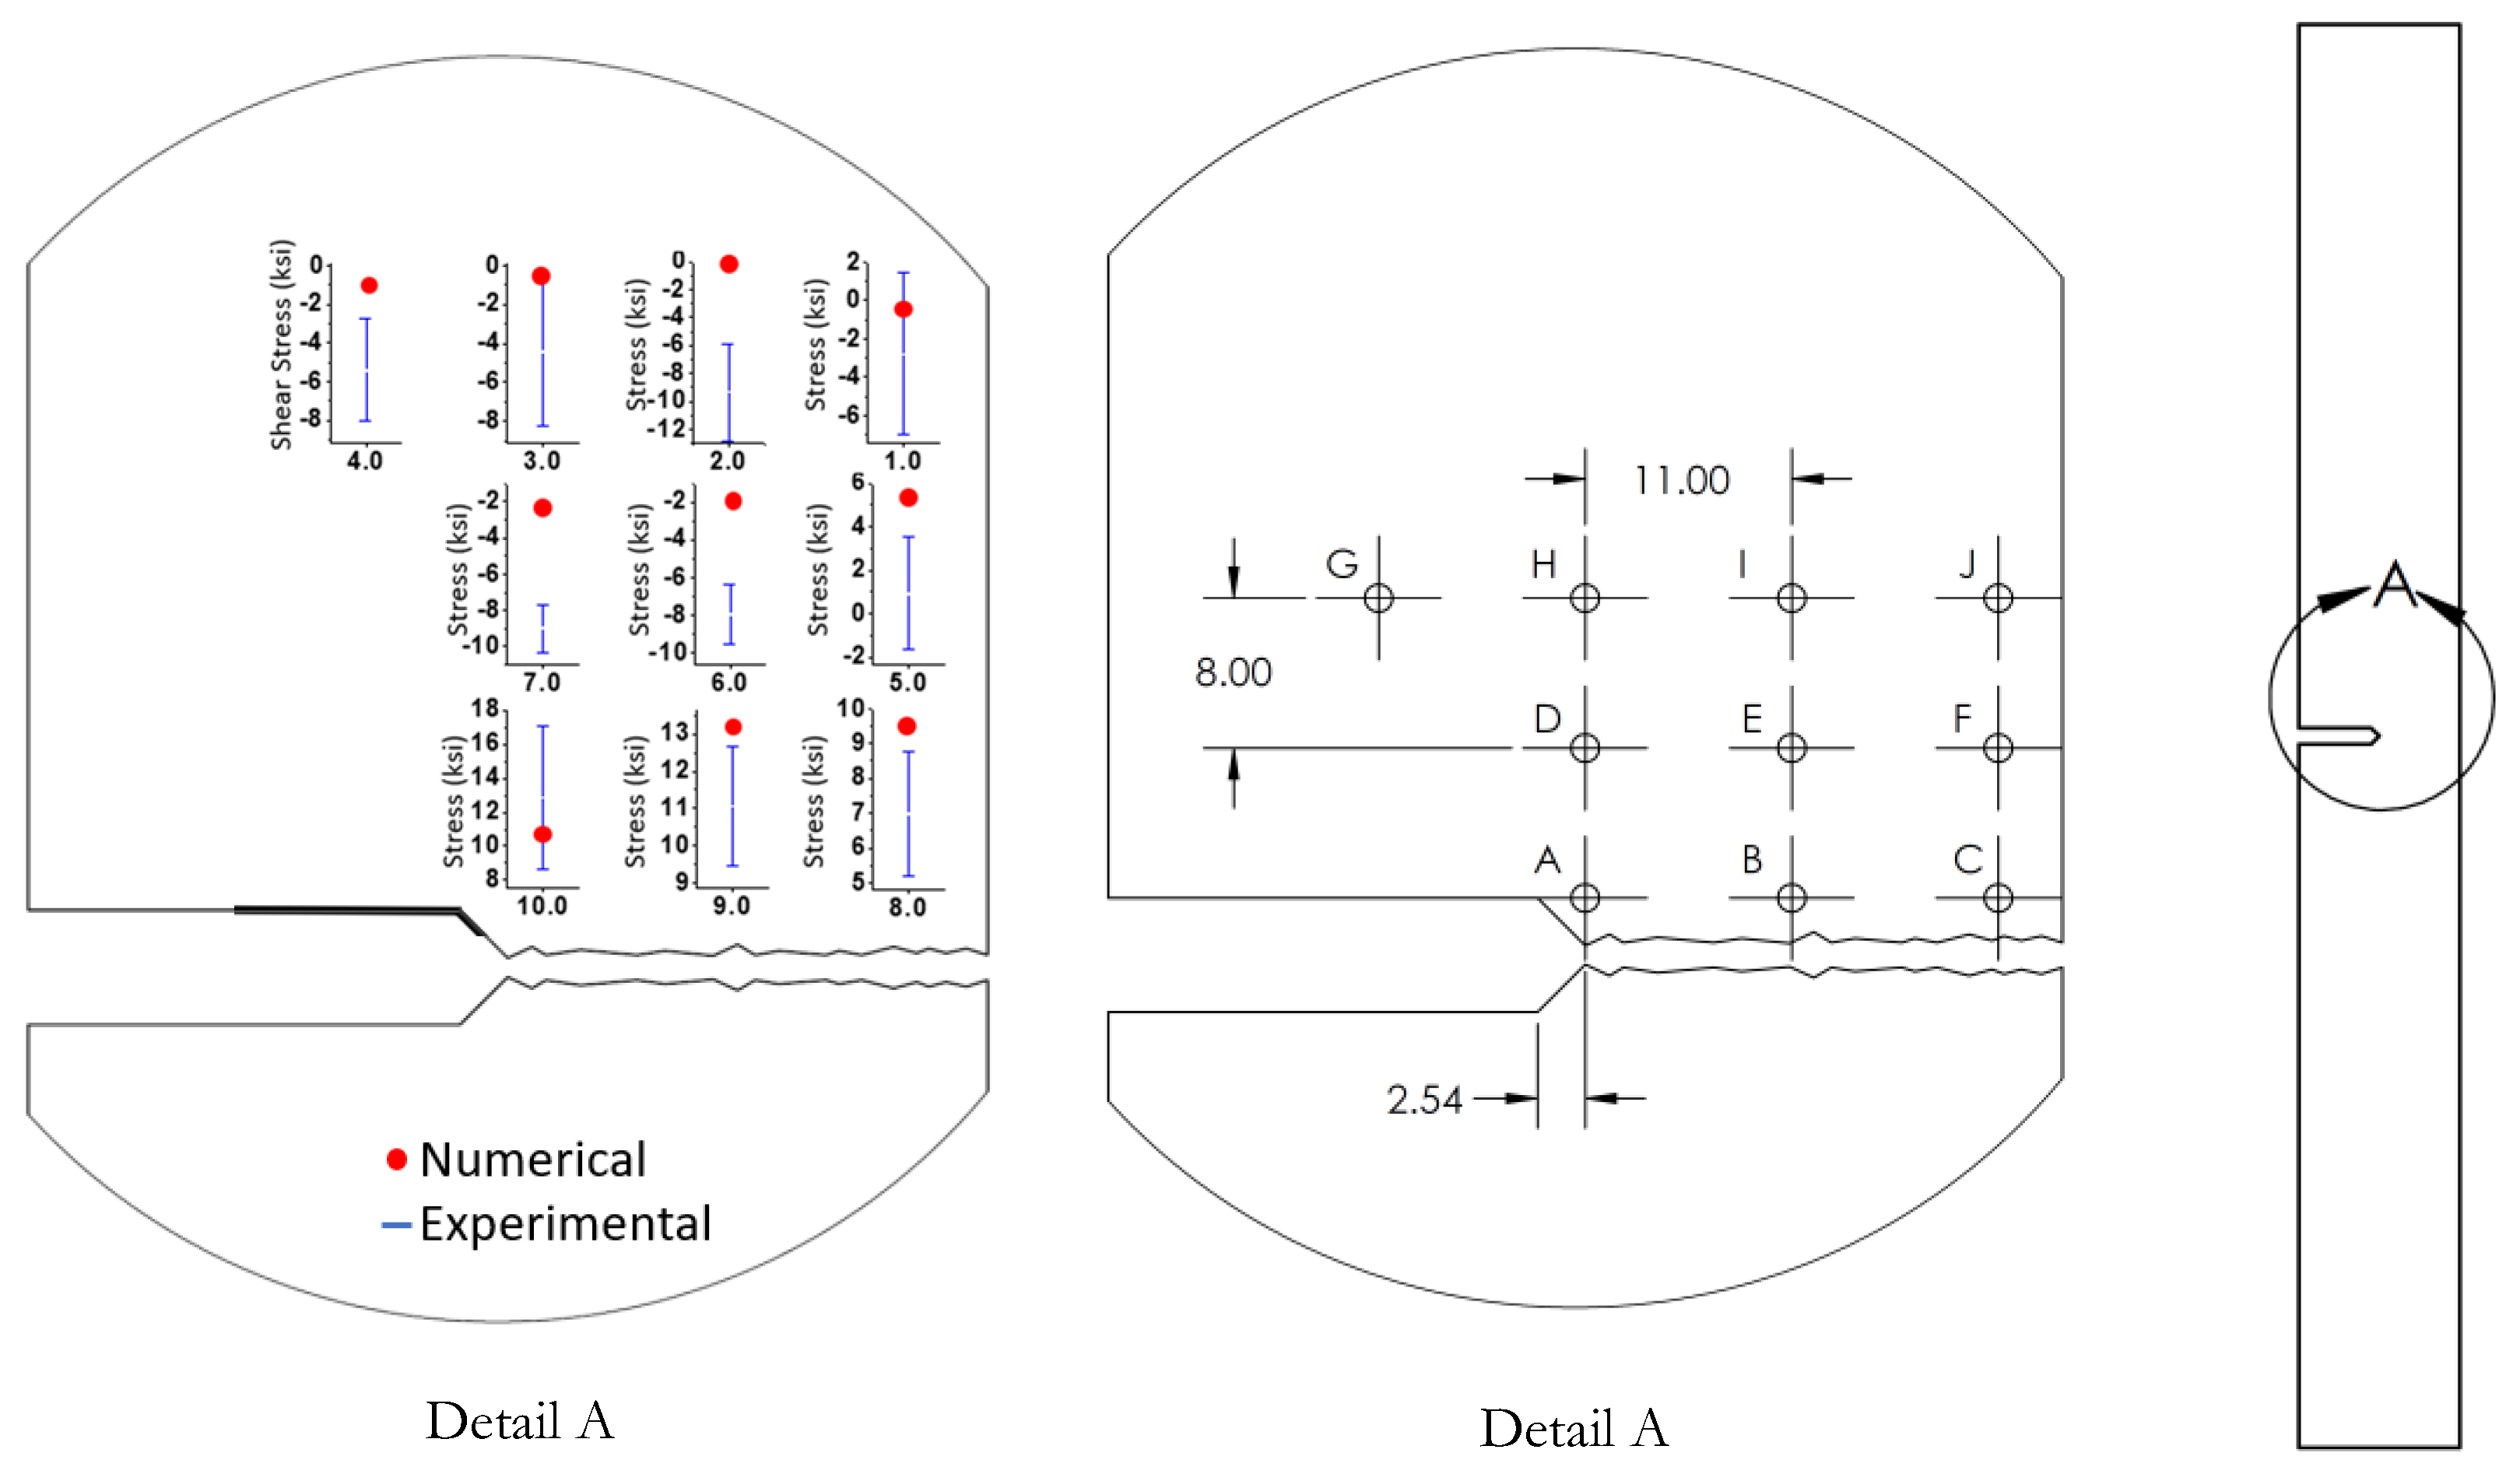
3.4. Determination of Residual Stresses
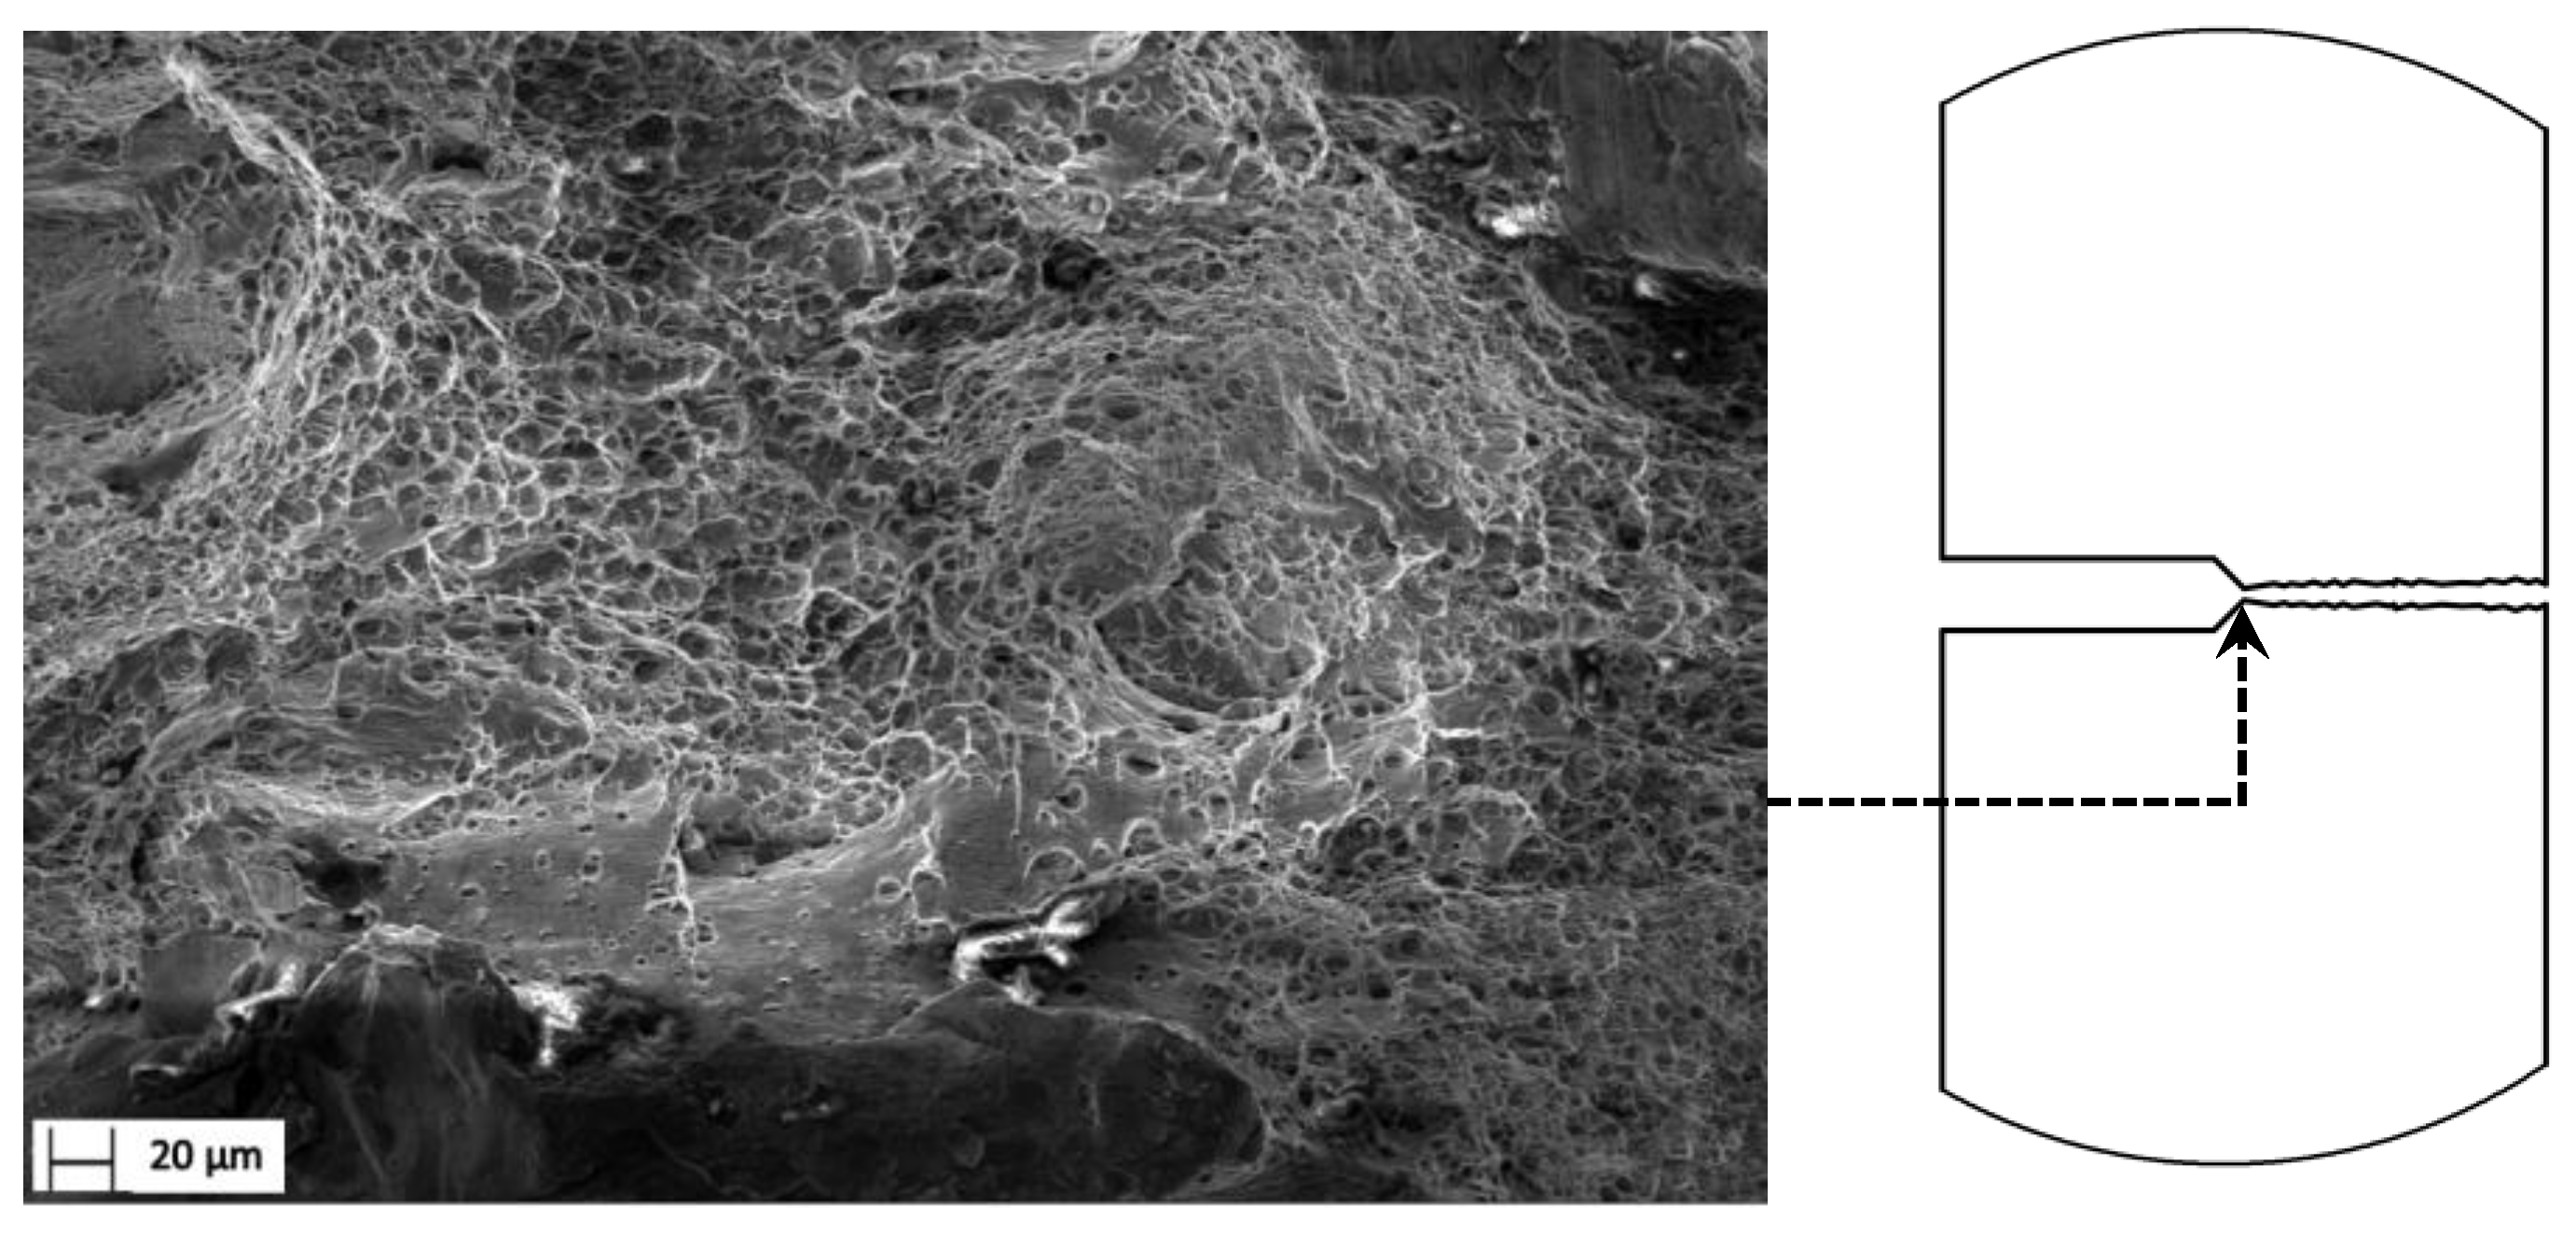
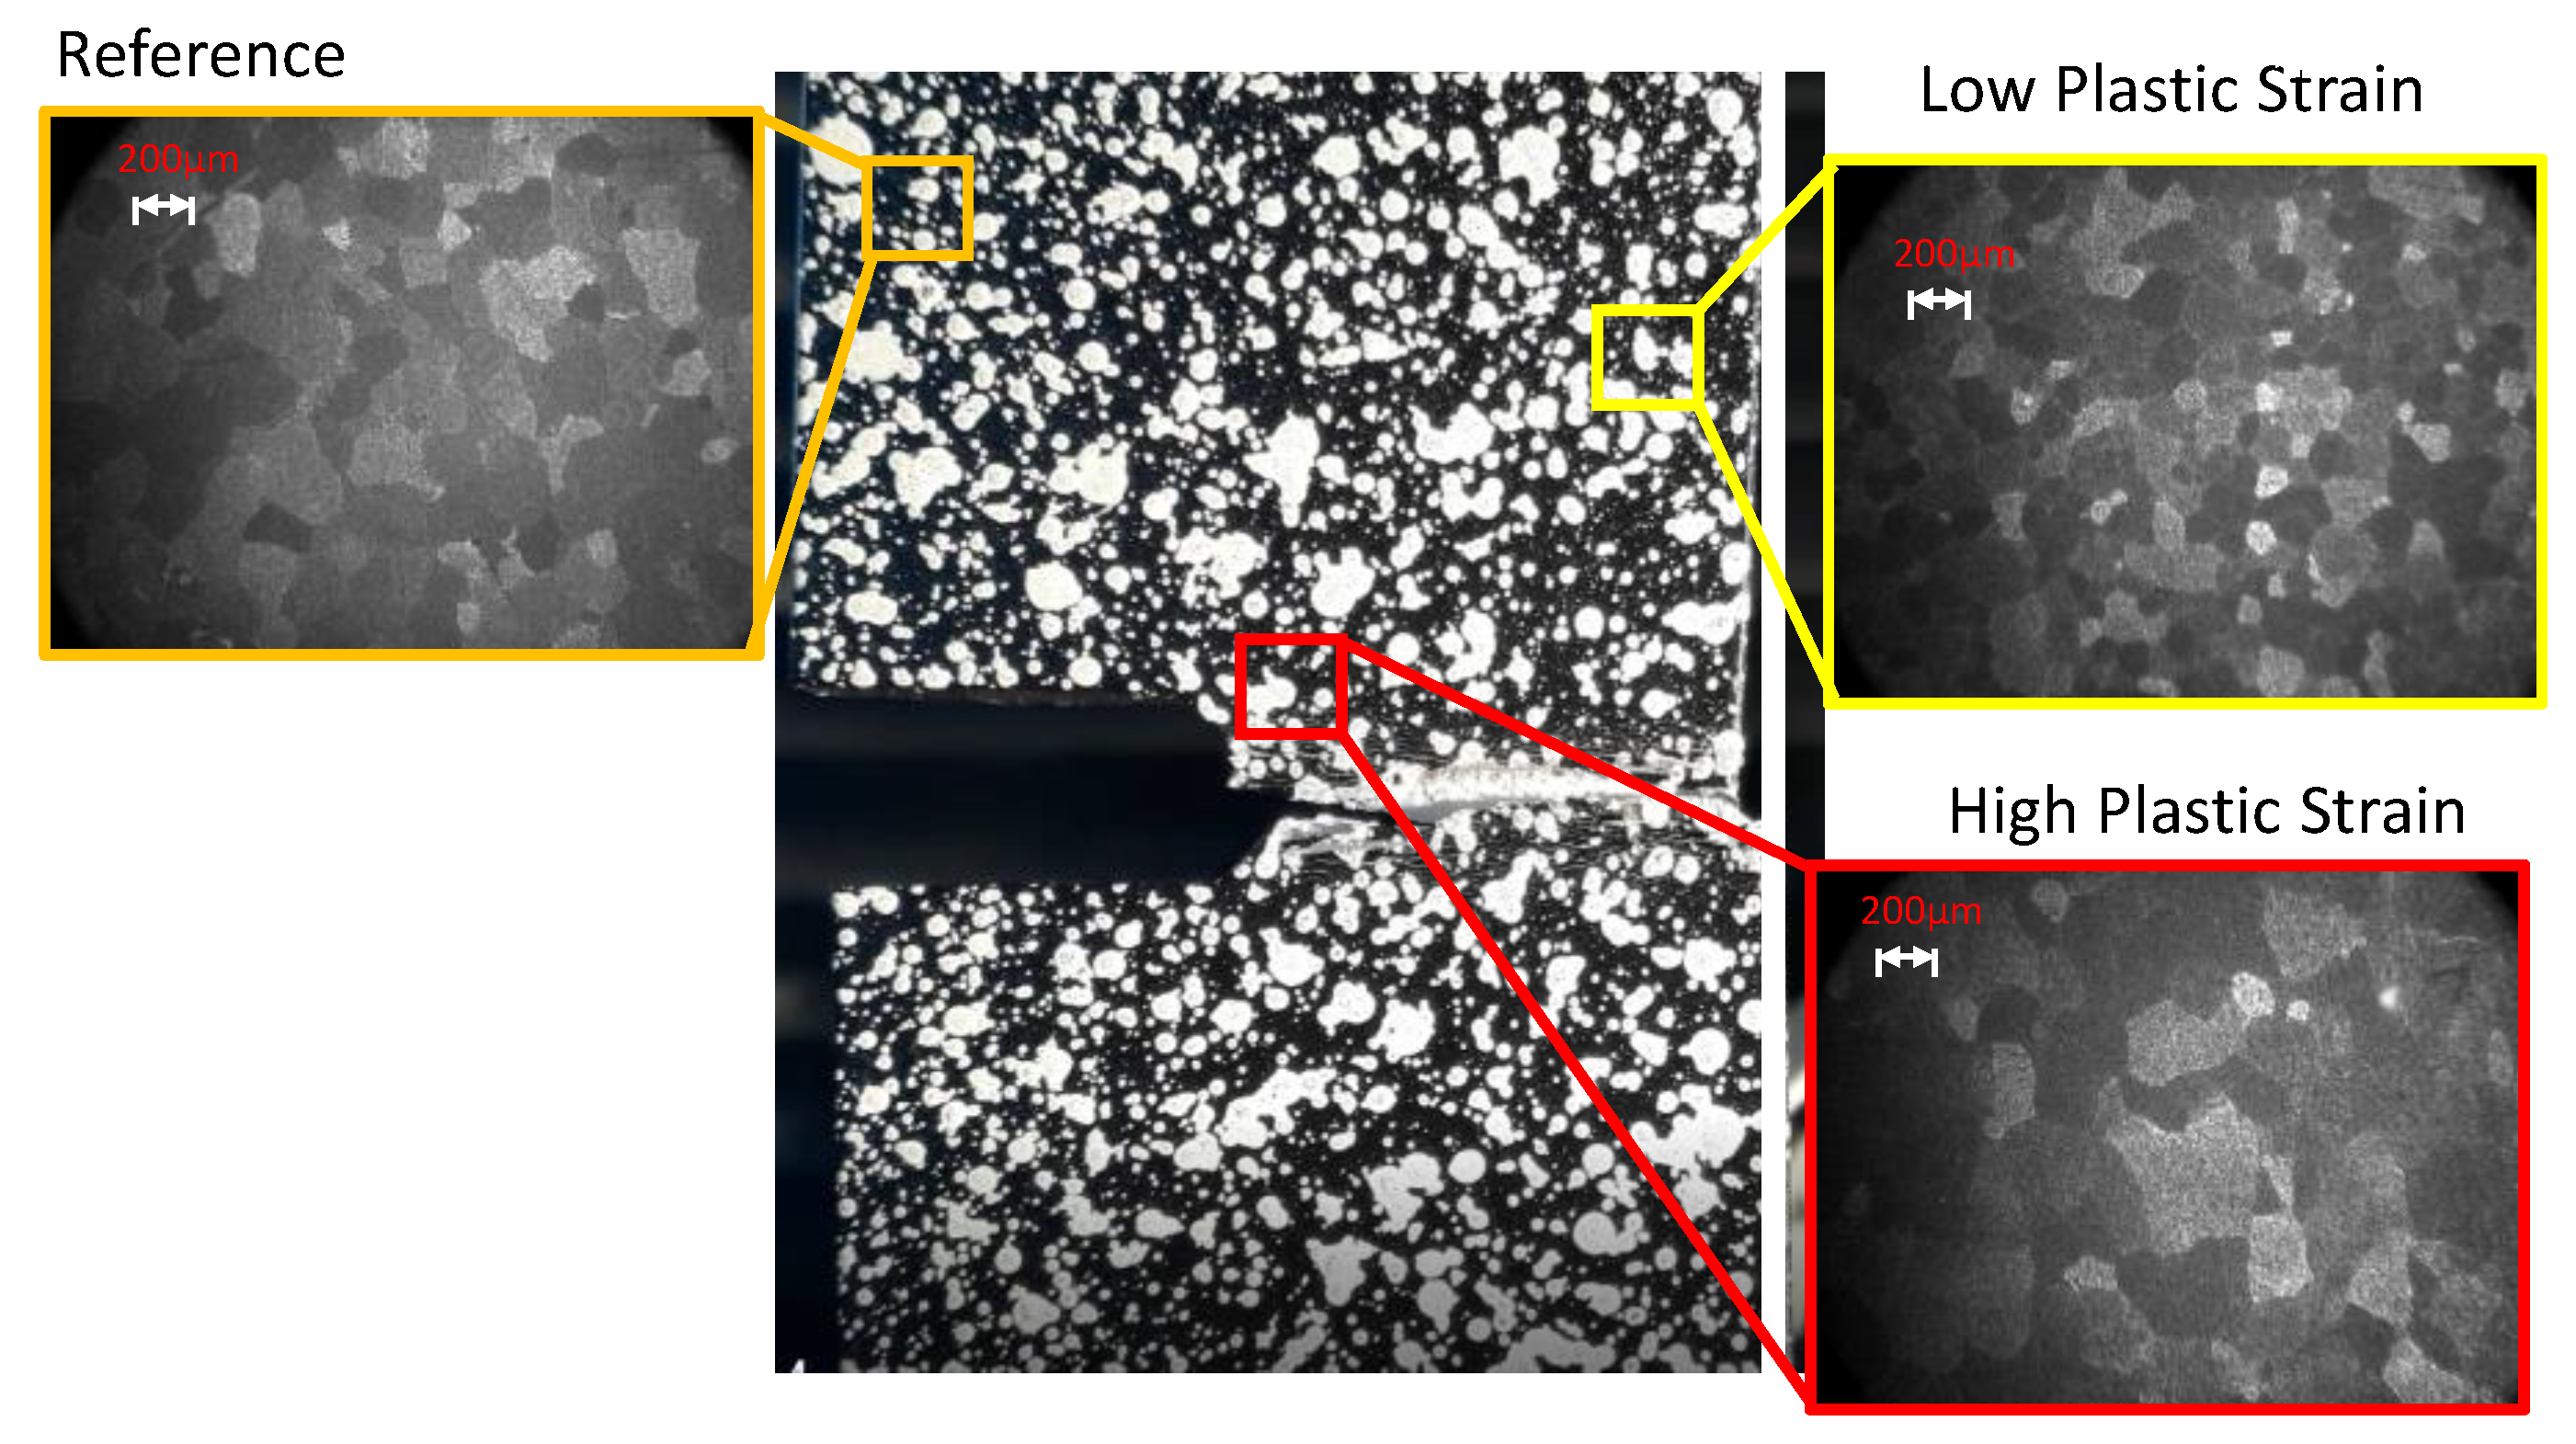
3.5. Fracture Surface

4. Conclusions
Author Contributions
Funding
Institutional Review Board Statement
Informed Consent Statement
Data Availability Statement
Conflicts of Interest
References
- Mehdikhani, M.; Aravand, M.; Sabuncuoglu, B.; Callens, M.G.; Lomov, S.V.; Gorbatikh, L. Full-field strain measurements at the micro-scale in fiber-reinforced composites using digital image correlation. Compos. Struct. 2016, 140, 192–201. [Google Scholar] [CrossRef]
- Gordon, J.E. The New Science of Strong Materials, 2nd ed.; Penguin Books: New York, NY, USA, 1991. [Google Scholar]
- Hertzberg, R.W.; Vinci, R.P.; Hertzberg, J.L. Deformation and Fracture Mechanics of Engineering Materials, 5th ed.; John Wiley and Sons: Hoboken, NJ, USA, 2013. [Google Scholar]
- Parnas, L.; Bilir, Ö.G.; Tezcan, E. Strain gage methods for measurement of opening mode stress intensity factor. Eng. Fract. Mech. 1996, 55, 485–492. [Google Scholar] [CrossRef]
- Williams, M.L. On the Stress Distribution at the Base of a Stationary Crack. J. Appl. Mech. 1961, 28, 78. [Google Scholar] [CrossRef]
- Sánchez-Arévalo, F.M.; Pulos, G. Use of digital image correlation to determine the mechanical behavior of materials. Mater. Charact. 2008, 59, 1572–1579. [Google Scholar] [CrossRef]
- Hos, Y.; Freire, J.L.; Vormwald, M. Measurements of strain fields around crack tips under proportional and non-proportional mixed-mode fatigue loading. Int. J. Fatigue 2015, 89, 87–98. [Google Scholar] [CrossRef]
- Zhang, R.; He, L. Measurement of mixed-mode stress intensity factors using digital image correlation method. Opt. Lasers Eng. 2012, 50, 1001–1007. [Google Scholar] [CrossRef]
- Sutton, M.A.; Yan, J.H.; Tiwari, V.; Schreier, H.W.; Orteu, J.J. The effect of out-of-plane motion on 2D and 3D digital image correlation measurements. Opt. Lasers Eng. 2008, 46, 746–757. [Google Scholar] [CrossRef] [Green Version]
- Tavares, P.J.; Ramos, T.; Braga, D.; Vaz, M.; Guimarães, M. SIF determination with digital image correlation. Int. J. Struct. Integr. 2013, 4, 668–676. [Google Scholar]
- Farahani, B.V.; Tavares, P.J.; Belinha, J.; Moreira, P. A Fracture Mechanics Study of a Compact Tension Specimen: Digital Image Correlation, Finite Element and Meshless Methods. Procedia Struct. Integr. 2017, 5, 920–927. [Google Scholar] [CrossRef]
- Boussattine, Z.; Ranc, N.; Palin-Luc, T. About the heat sources generated during fatigue crack growth: What consequences on the stress intensity factor? Theor. Appl. Fract. Mec. 2020, 109, 102704. [Google Scholar] [CrossRef]
- Tonge, S.M.; Simpson, C.A.; Reinhard, C.; Connolley, T.; Sherry, A.H.; Marrow, T.J.; Mostafavi, M. Unifying the effects of in and out-of-plane constraint on the fracture of ductile materials. J. Mech. Phys. Solids 2020, 141, 103956. [Google Scholar] [CrossRef]
- Zhang, W.; Liu, Y. Plastic zone size estimation under cyclic loadings using in situ optical microscopy fatigue testing. Fatigue Fract. Eng. Mater. Struct. 2011, 34, 717–727. [Google Scholar] [CrossRef]
- Vasco-Olmo, J.M.; James, M.N.; Christopher, C.J.; Patterson, E.A.; Díaz, F.A. Assessment of crack tip plastic zone size and shape and its influence on crack tip shielding. Fatigue Fract. Eng. Mater. Struct. 2016, 39, 969–981. [Google Scholar] [CrossRef] [Green Version]
- Besel, M.; Breitbarth, E. Advanced analysis of crack tip plastic zone under cyclic loading. Int. J. Fatigue 2016, 93, 92–108. [Google Scholar] [CrossRef]
- Breitbarth, E.; Besel, M. Energy based analysis of crack tip plastic zone of AA2024-T3 under cyclic loading. Int. J. Fatigue 2017, 100, 263–273. [Google Scholar] [CrossRef]
- Zhao, Y.; Hu, D.; Zhang, M.; Dai, W.; Zhang, W. In Situ Measurements for Plastic Zone Ahead of Crack Tip and Continuous Strain Variation under Cyclic Loading Using Digital Image Correlation Method. Metals 2020, 10, 273. [Google Scholar] [CrossRef] [Green Version]
- Toribio, J.; Kharin, V.; Ayaso, F.; González, B.; Matos, J.; Vergara, D.; Lorenzo, M.A. Numerical and experimental analyses of the plasticity-induced fatigue crack growth in high-strength steels. Constr. Build. Mater. 2011, 25, 3935–3940. [Google Scholar] [CrossRef]
- Jia, L.-J.; Ikai, T.; Shinohara, K.; Ge, H. Ductile crack initiation and propagation of structural steels under cyclic combined shear and normal stress loading. Constr. Build. Mater. 2016, 112, 69–83. [Google Scholar] [CrossRef]
- Yue, F.; Wu, Z. Fracture Mechanical Analysis of Thin-Walled Cylindrical Shells with Cracks. Metals 2021, 11, 592. [Google Scholar] [CrossRef]
- ASTM. Standard Test Method for Plane-Strain Fracture Toughness of Metallic Materials; ASTM: West Conshohocken, PA, USA, 2014; Volume 16. [Google Scholar]
- Crammond, G.; Boyd, S.W.; Dulieu-Barton, J.M. Speckle pattern quality assessment for digital image correlation. Opt. Lasers Eng. 2013, 51, 1368–1378. [Google Scholar] [CrossRef]
- Grellner, F.; Höscheler, S.; Greil, P.; Sindel, J.; Petschelt, A. Residual stress measurements of computer aided design/computer aided manufacturing (CAD/CAM) machined dental ceramics. J. Mater. Sci. 1997, 32, 6235–6242. [Google Scholar] [CrossRef]
- Hutchings, M.T.; Withers, P.J.; Holden, T.M.; Lorentzen, T. Introduction to the Characterization of Residual Stress by Neutron diffraction; Taylor & Francis Group, LLC: Abingdon, UK, 2005. [Google Scholar]
- Jiménez, I.; López, C.; Martinez-Romero, O.; Mares, P.; Siller, H.R.; Diabb, J.; Sandoval-Robles, J.A.; Elías-Zúñiga, A. Investigation of residual stress distribution in single point incremental forming of aluminum parts by X-ray diffraction technique. Int. J. Adv. Manuf. Technol. 2017, 91, 2571–2580. [Google Scholar] [CrossRef]
- López, C.; Elías-Zúñiga, A.; Jiménez, I.; Martínez-Romero, O.; Siller, H.R.; Diabb, J.M. Experimental Determination of Residual Stresses Generated by Single Point Incremental Forming of AlSi10Mg Sheets Produced Using SLM Additive Manufacturing Process. Materials 2018, 11, 2542. [Google Scholar] [CrossRef] [PubMed] [Green Version]
- ASTM. Standard Test Methods of Testing of Metallic Materials ASTM International; ASTM: West Conshohocken, PA, USA, 2008; Volume I, pp. 1–25. [Google Scholar]
- ASM Handbook Committee. Printing, Metals handbook, properties and selection: Nonferrous alloys and special-purpose materials. In ASM Handbook; ASM International: Cleveland, OH, USA, 1992; p. 2. [Google Scholar]
- Pedersen, K.O.; Westermann, I.; Furu, T.; Børvik, T.; Hopperstad, O.S. Influence of microstructure on work-hardening and ductile fracture of aluminium alloys. Mater. Des. 2015, 70, 31–44. [Google Scholar] [CrossRef]


| Specimen |
Young’s Modulus (GPa) |
Yield Stress (MPa) |
Yield Strain (%) | Ultimate Tensile Stress (MPa) |
Ultimate Tensile Strain (%) |
|---|---|---|---|---|---|
| 1 | 69.07 | 97.76 | 0.703 | 168.60 | 15.01 |
| 2 | 69.02 | 99.66 | 0.607 | 168.93 | 14.62 |
| 3 | 69.36 | 100.12 | 0.690 | 168.66 | 15.03 |
| Average | 69.15 | 99.18 | 0.667 | 168.73 | 14.89 |
Publisher’s Note: MDPI stays neutral with regard to jurisdictional claims in published maps and institutional affiliations. |
© 2022 by the authors. Licensee MDPI, Basel, Switzerland. This article is an open access article distributed under the terms and conditions of the Creative Commons Attribution (CC BY) license (https://creativecommons.org/licenses/by/4.0/).
Share and Cite
Palacios-Pineda, L.M.; Hernandez-Reséndiz, J.E.; Martínez-Romero, O.; Hernandez Donado, R.J.; Tenorio-Quevedo, J.; Jiménez-Cedeño, I.H.; López-Vega, C.; Olvera-Trejo, D.; Elías-Zúñiga, A. Study of the Evolution of the Plastic Zone and Residual Stress in a Notched T-6061 Aluminum Sample. Materials 2022, 15, 1546. https://doi.org/10.3390/ma15041546
Palacios-Pineda LM, Hernandez-Reséndiz JE, Martínez-Romero O, Hernandez Donado RJ, Tenorio-Quevedo J, Jiménez-Cedeño IH, López-Vega C, Olvera-Trejo D, Elías-Zúñiga A. Study of the Evolution of the Plastic Zone and Residual Stress in a Notched T-6061 Aluminum Sample. Materials. 2022; 15(4):1546. https://doi.org/10.3390/ma15041546
Chicago/Turabian StylePalacios-Pineda, Luis Manuel, José Emiliano Hernandez-Reséndiz, Oscar Martínez-Romero, Roque J. Hernandez Donado, Jesús Tenorio-Quevedo, Isaac H. Jiménez-Cedeño, Cecilio López-Vega, Daniel Olvera-Trejo, and Alex Elías-Zúñiga. 2022. "Study of the Evolution of the Plastic Zone and Residual Stress in a Notched T-6061 Aluminum Sample" Materials 15, no. 4: 1546. https://doi.org/10.3390/ma15041546