
Mechanical and Microstructural Characterization of Rammed Earth Stabilized with Five Biopolymers

 , ,
, ,  and
and
Abstract
:1. Introduction
2. Materials and Methods
2.1. Rammed Earth
2.2. Additives
2.3. Mix Composition with Natural Additives
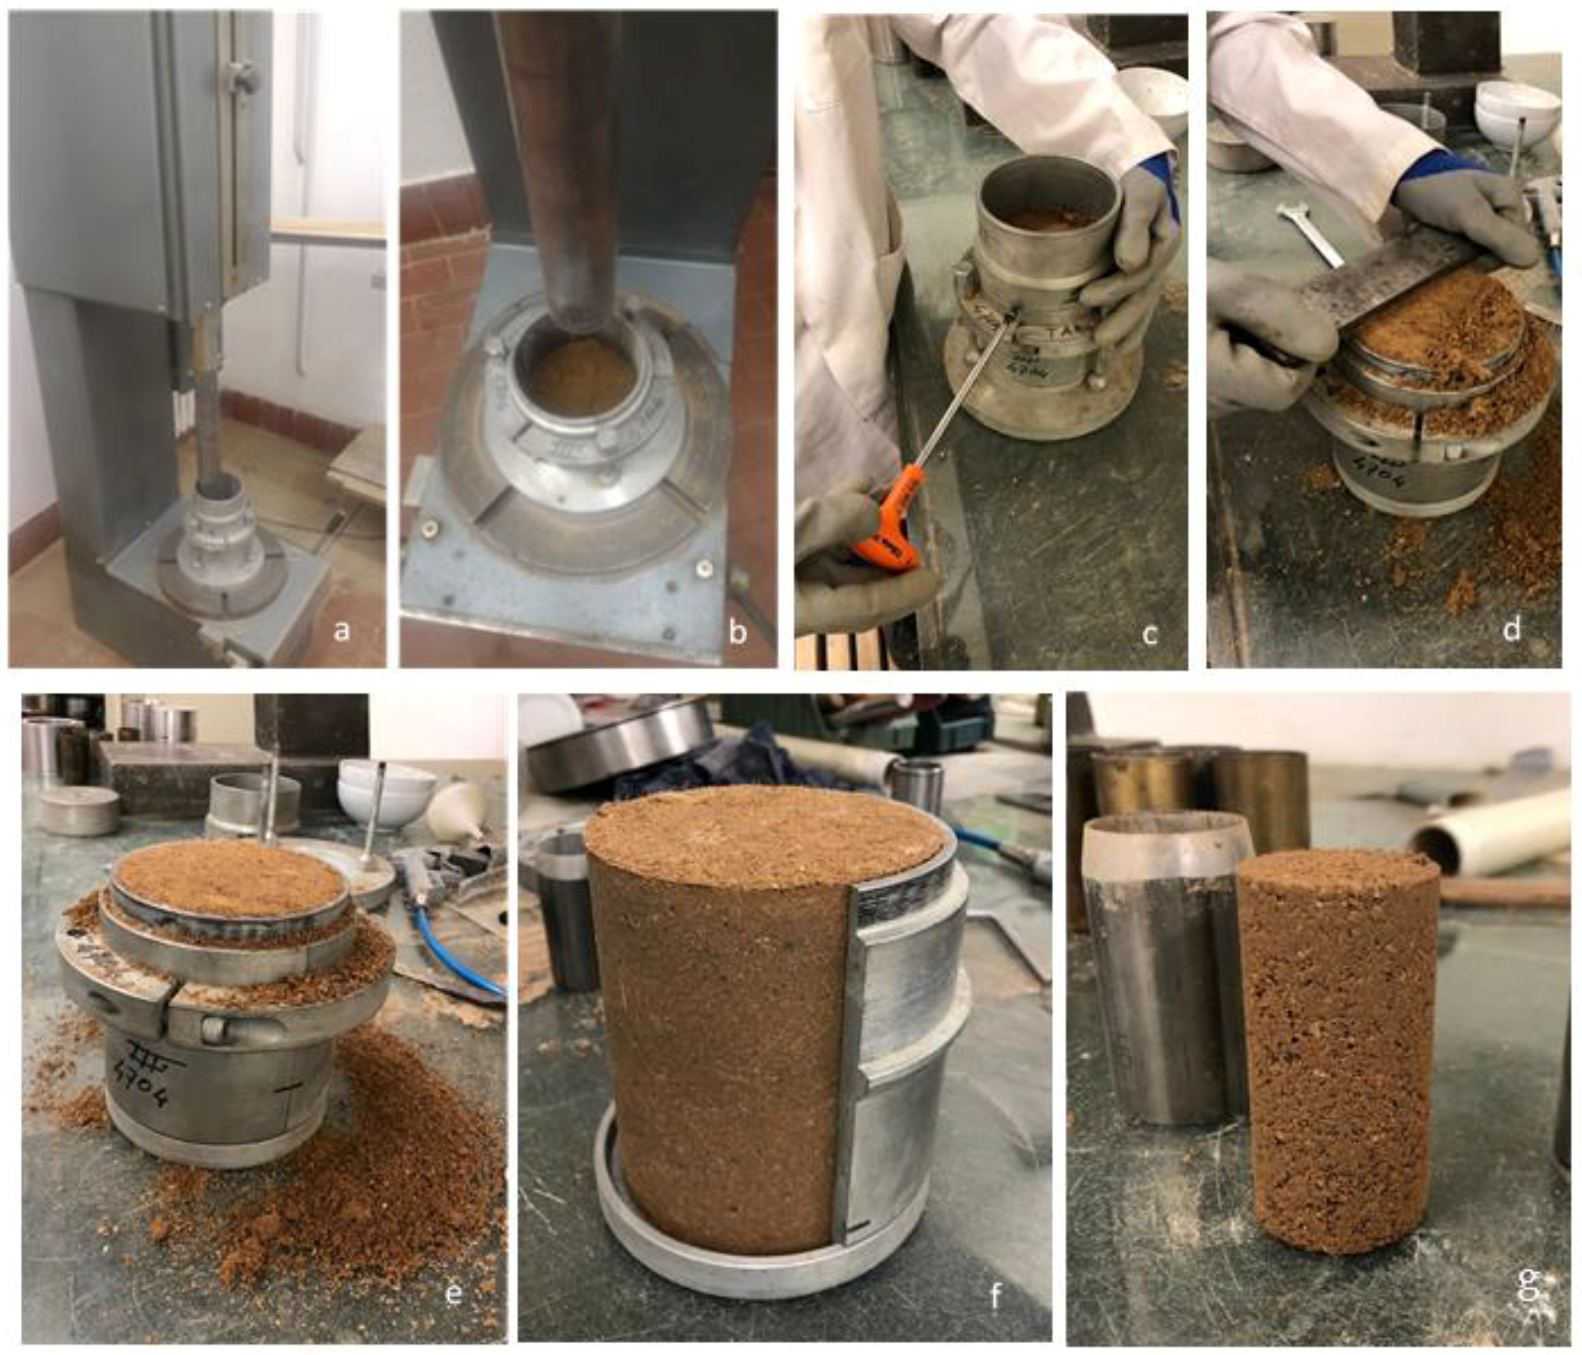
2.4. Proctor Test and Samples Manufacturing Process
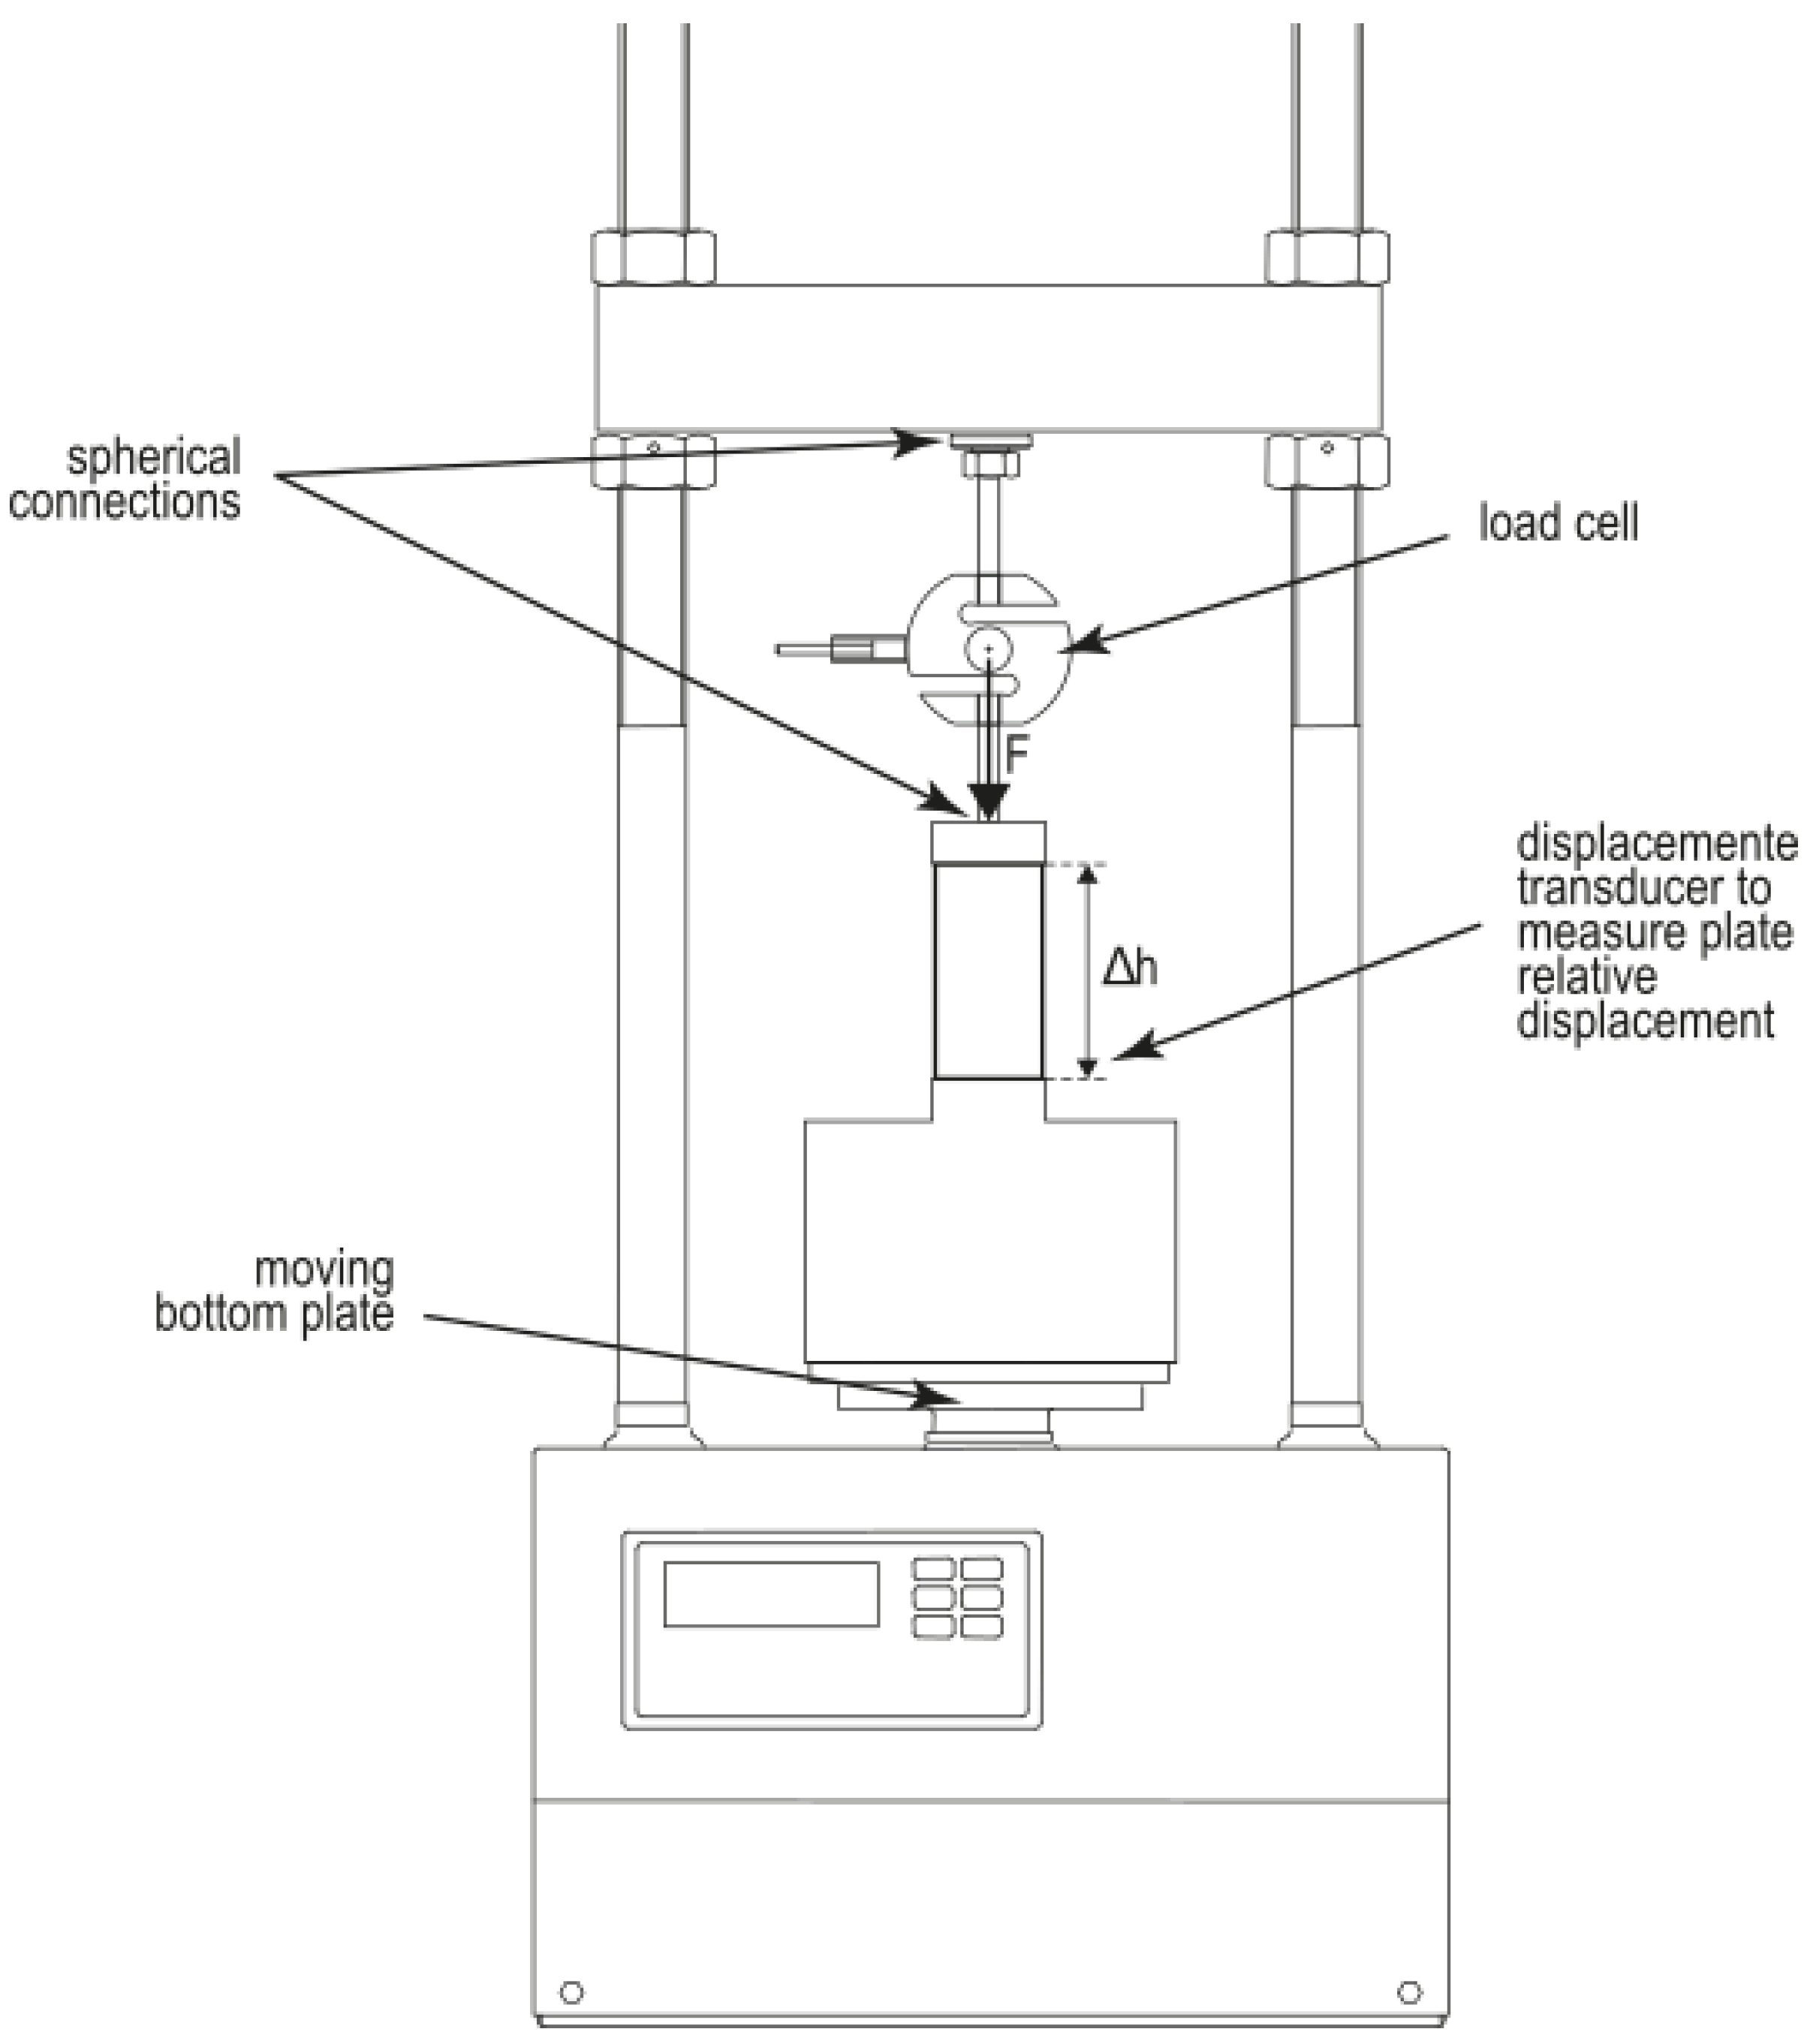
2.5. Unconfined Compressive Strength Test
2.6. Microstructural Characterization
2.6.1. Mercury Intrusion Porosimetry
2.6.2. Nitrogen Adsorption–Desorption Isotherms
2.6.3. Scanning Electron Microscopy
2.6.4. X-ray Powder Diffraction
3. Results
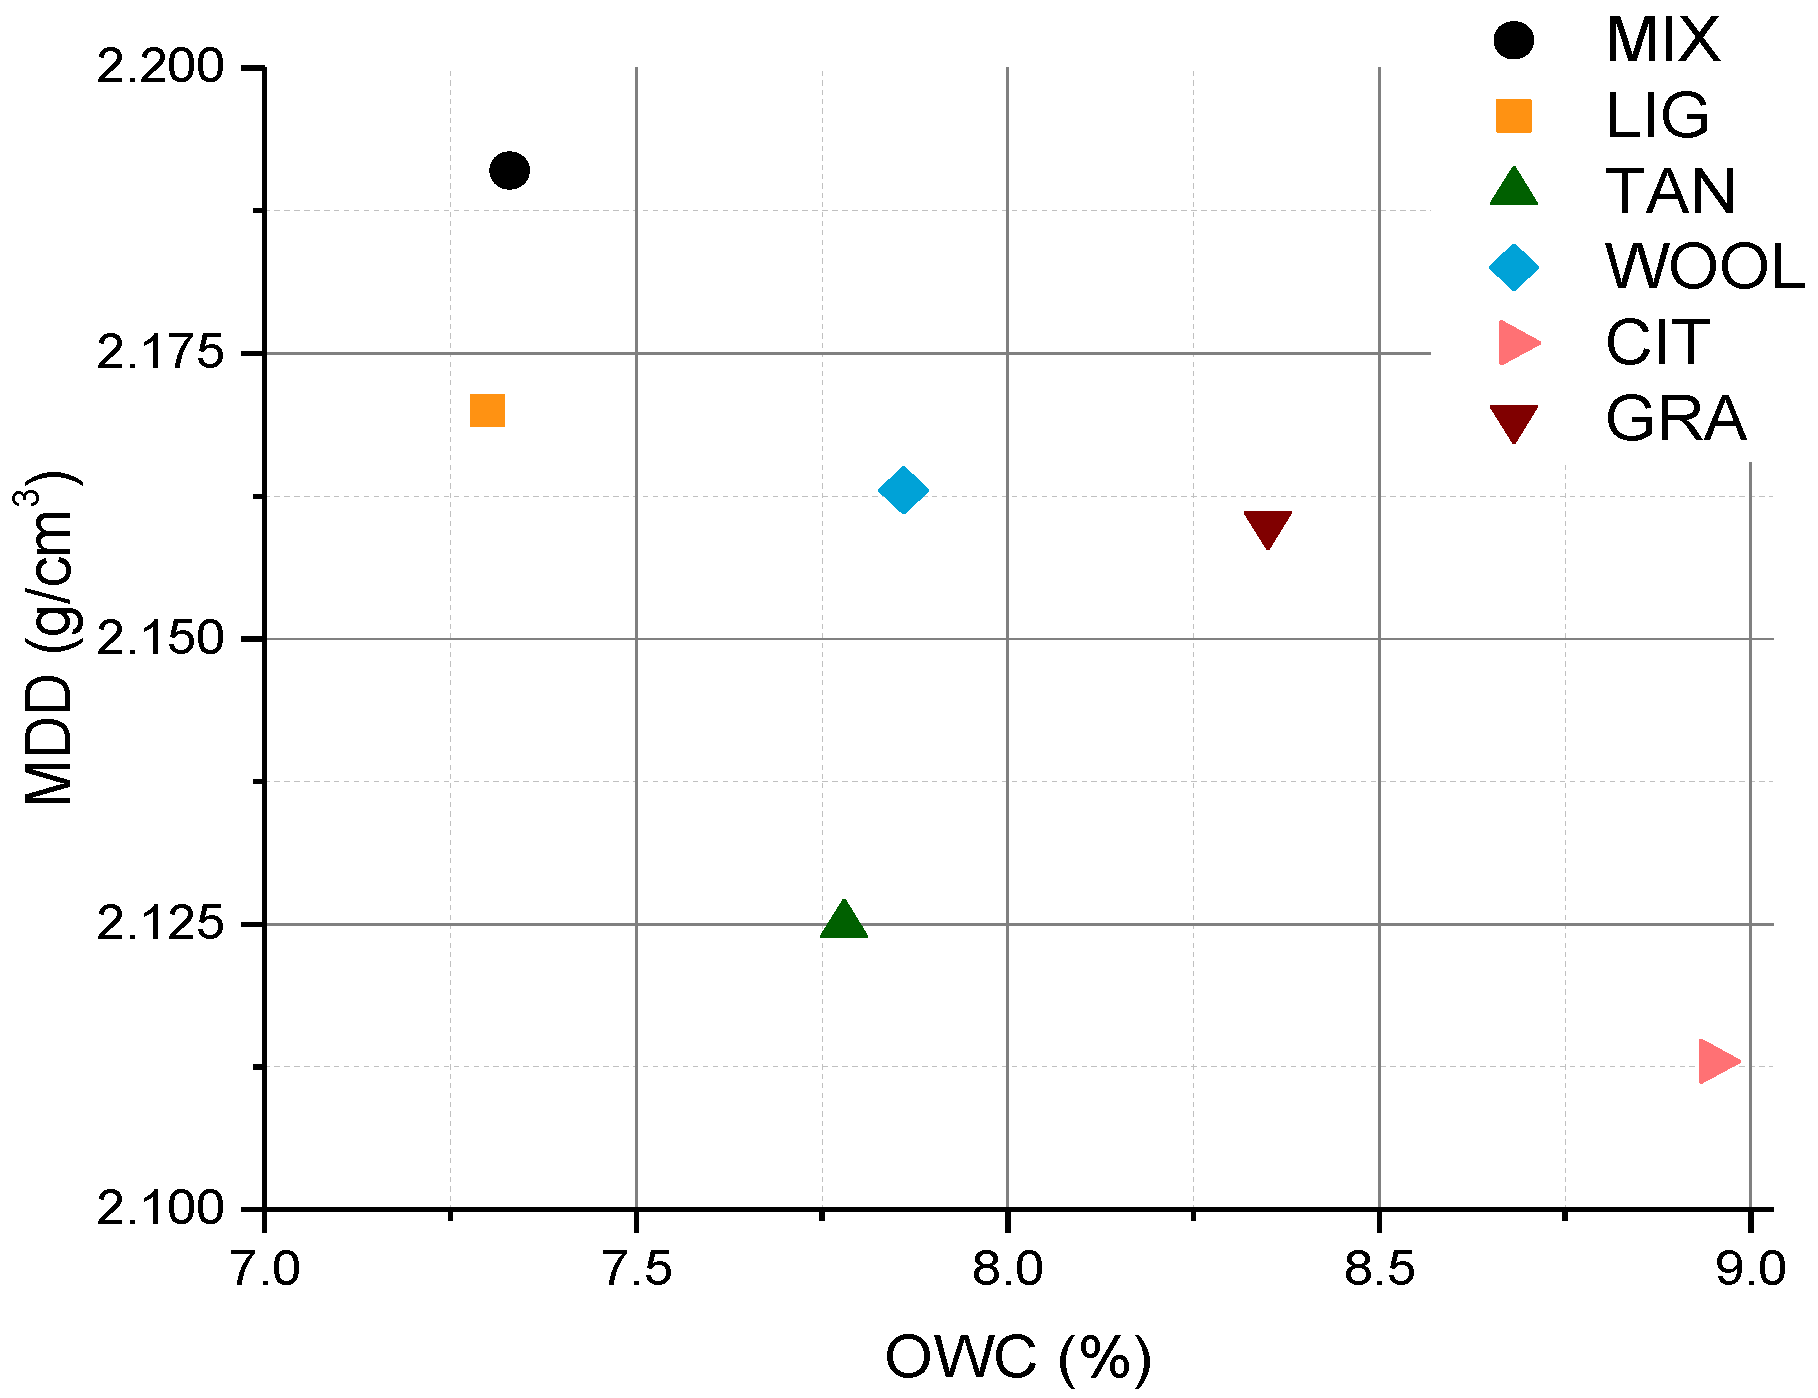
3.1. Proctor Test
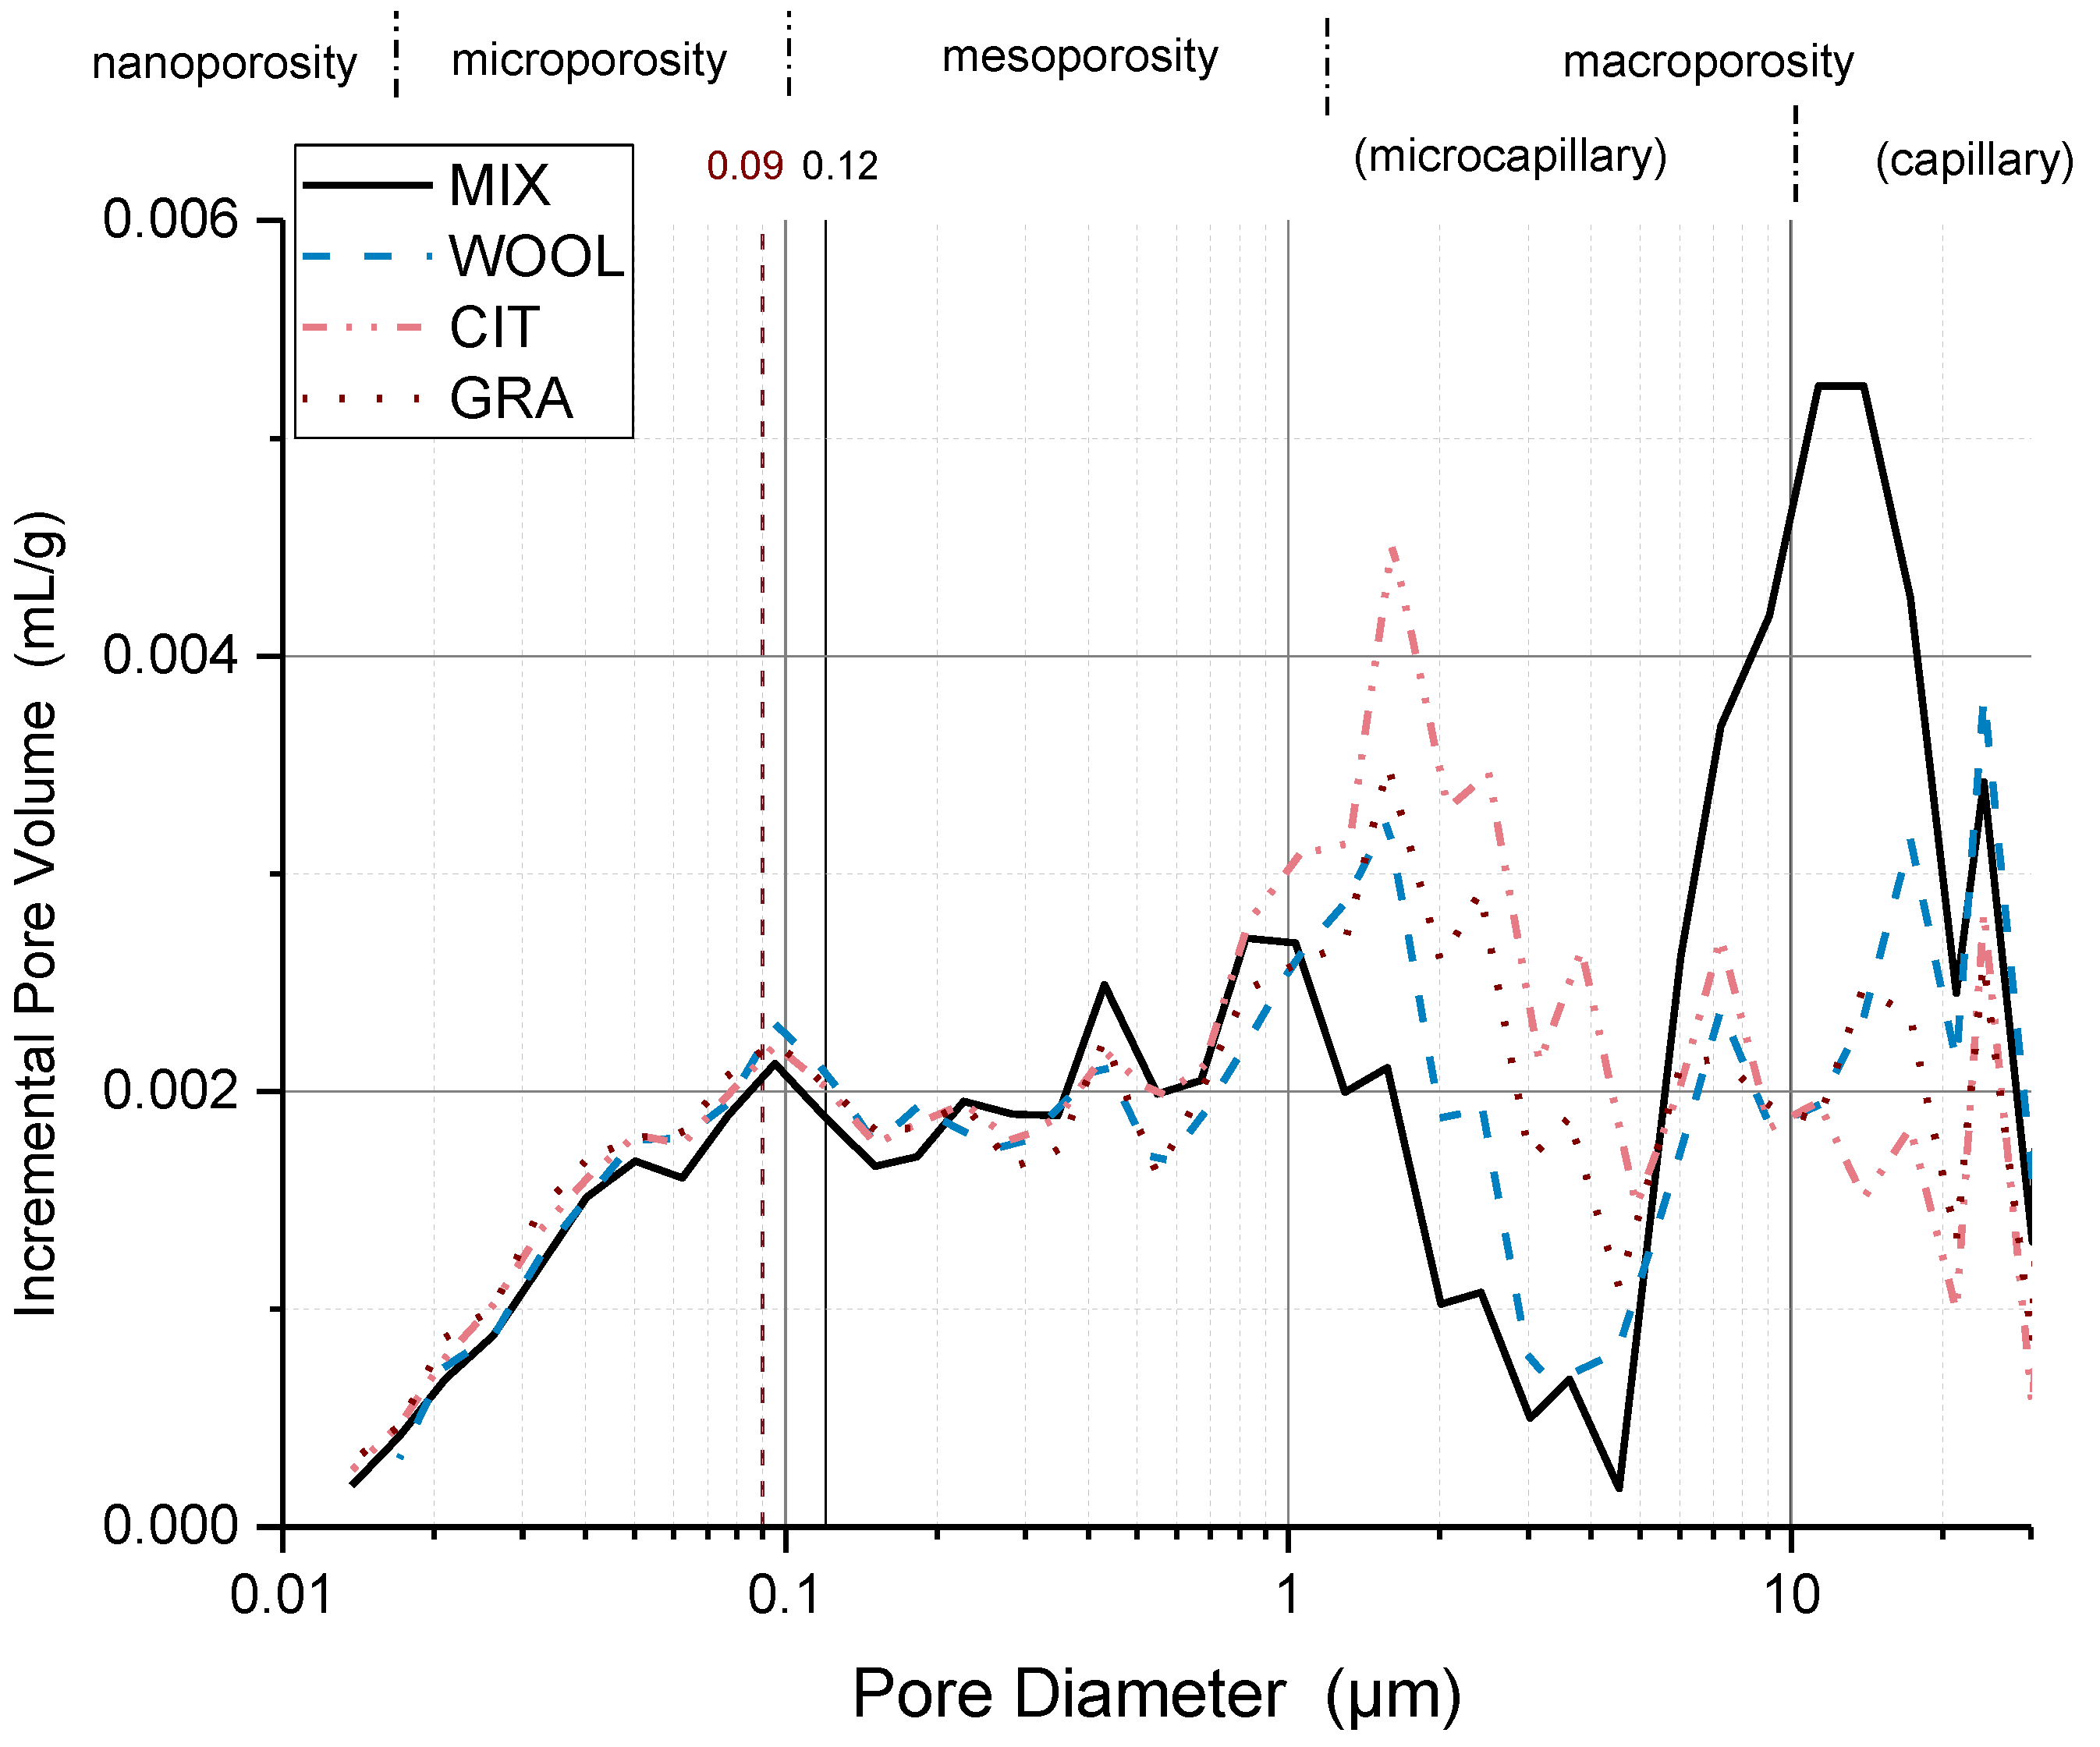
3.2. Mercury Intrusion Porosimetry
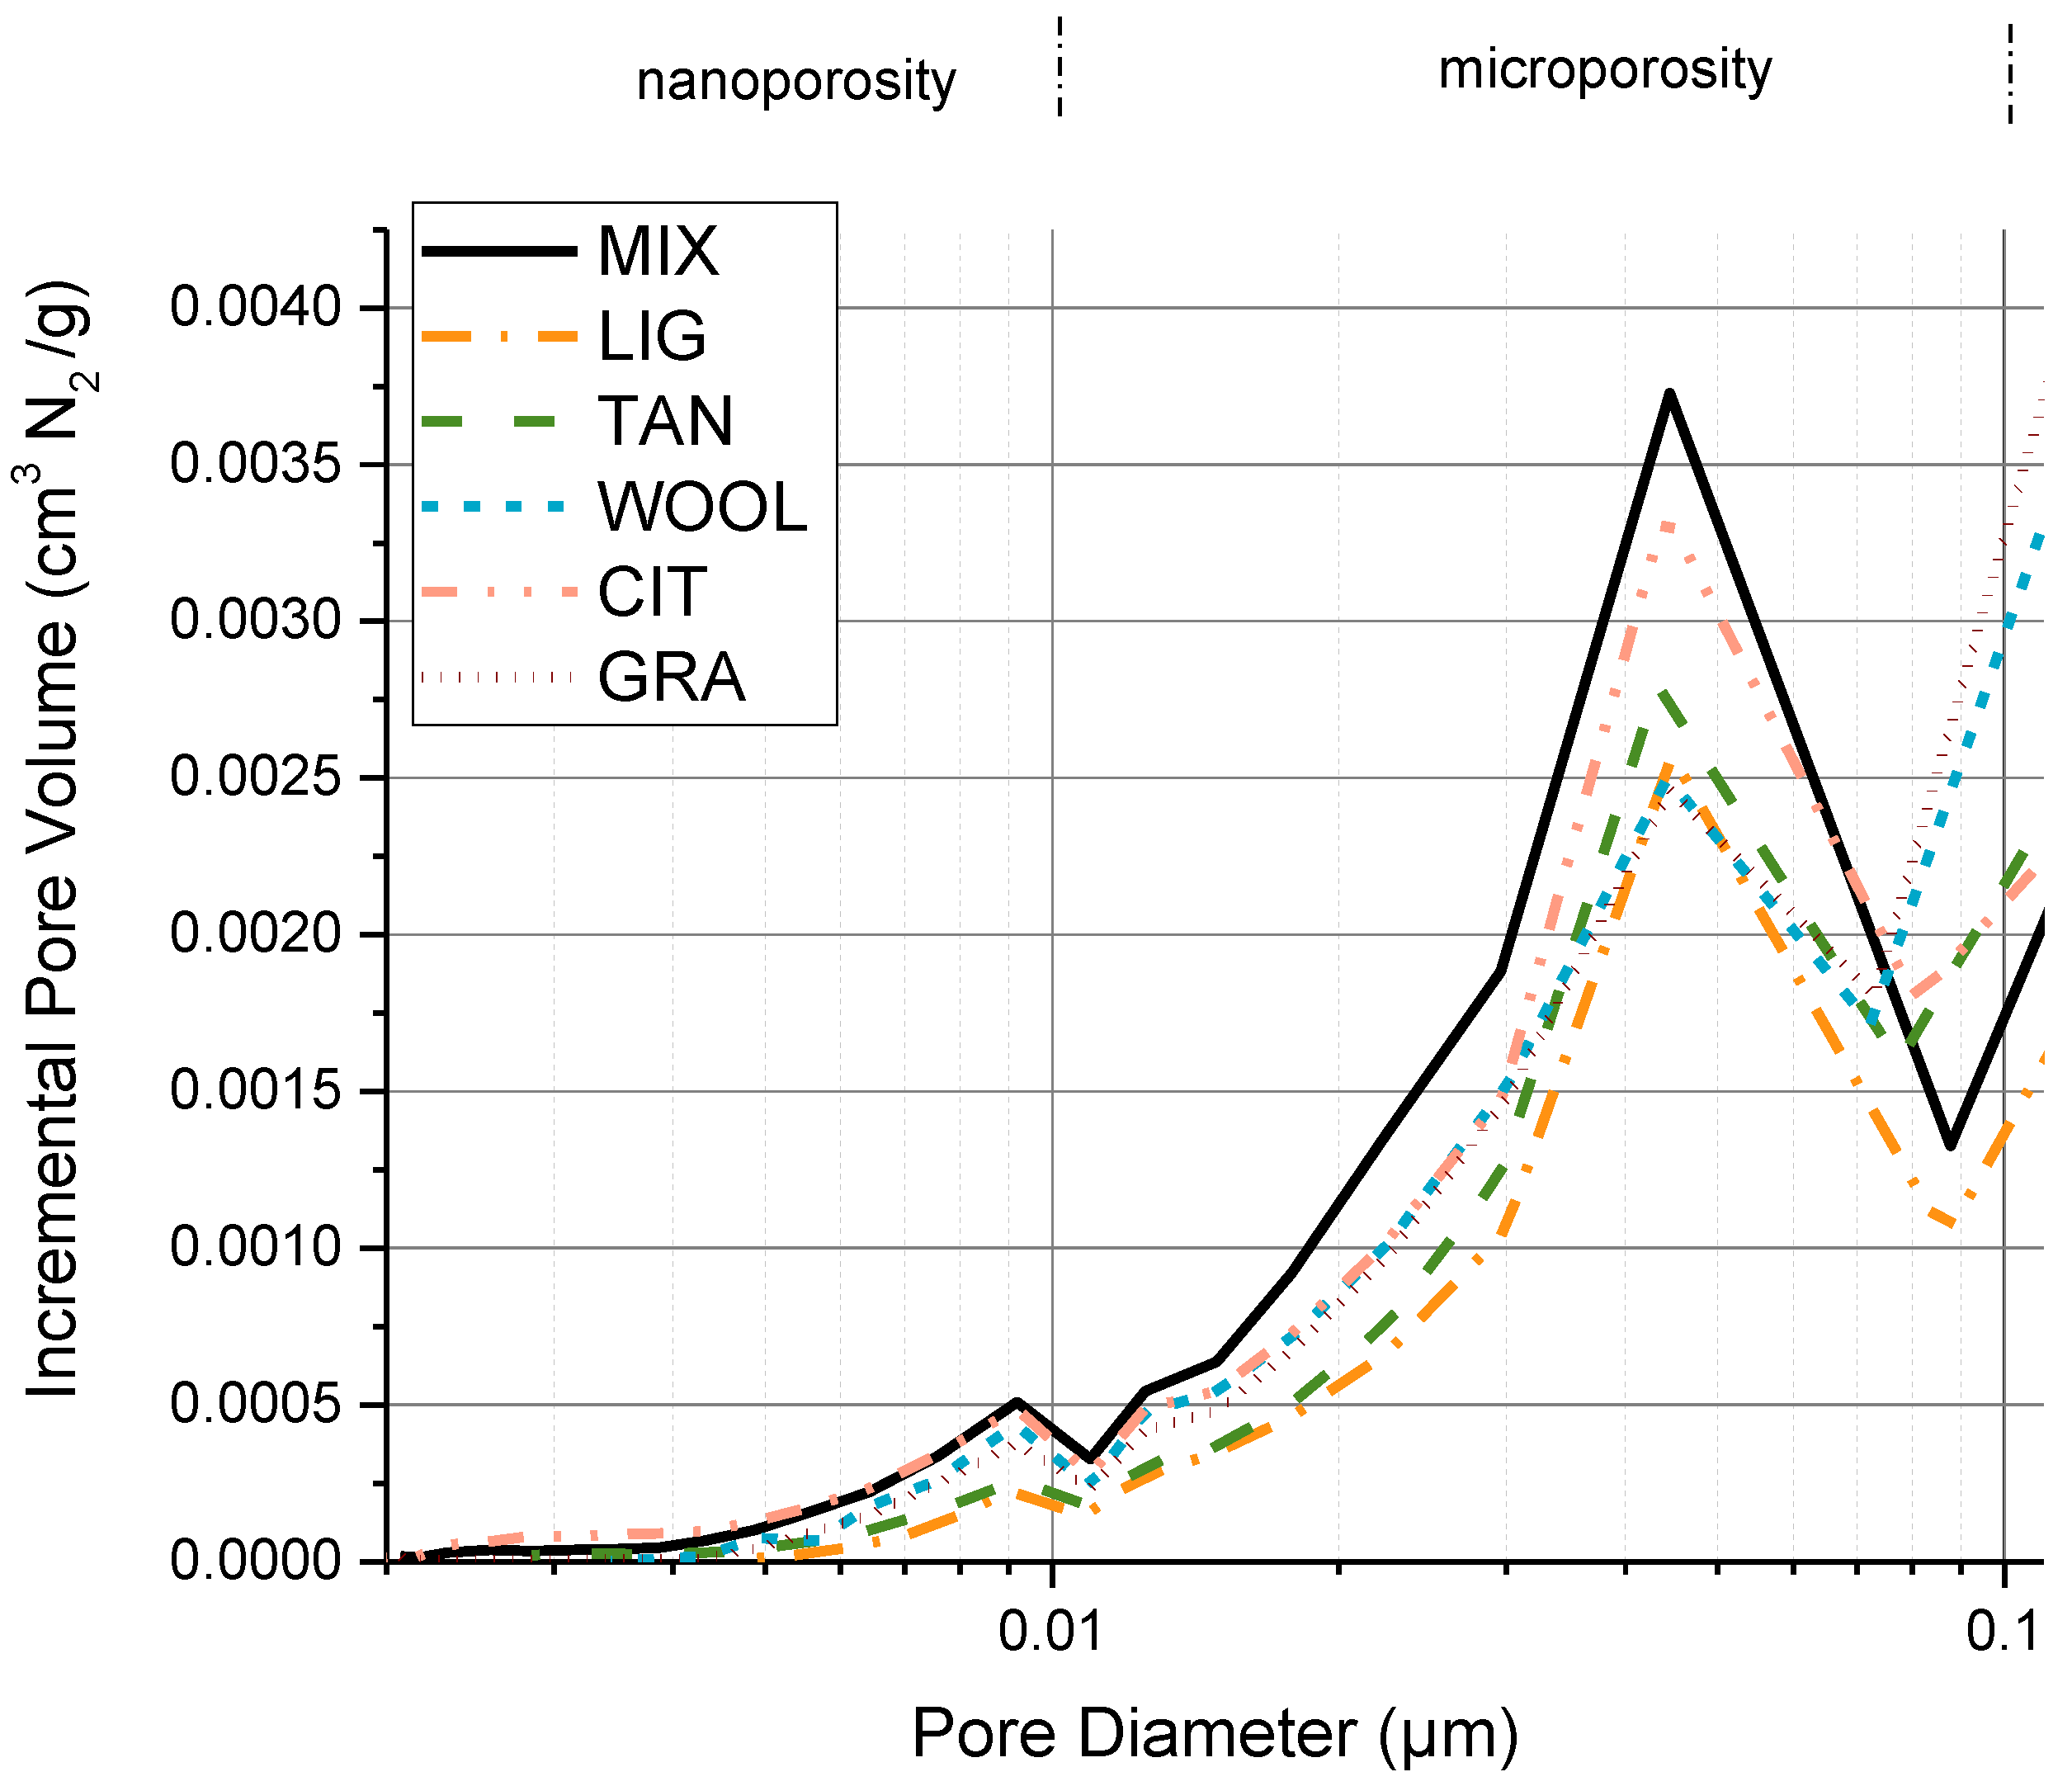
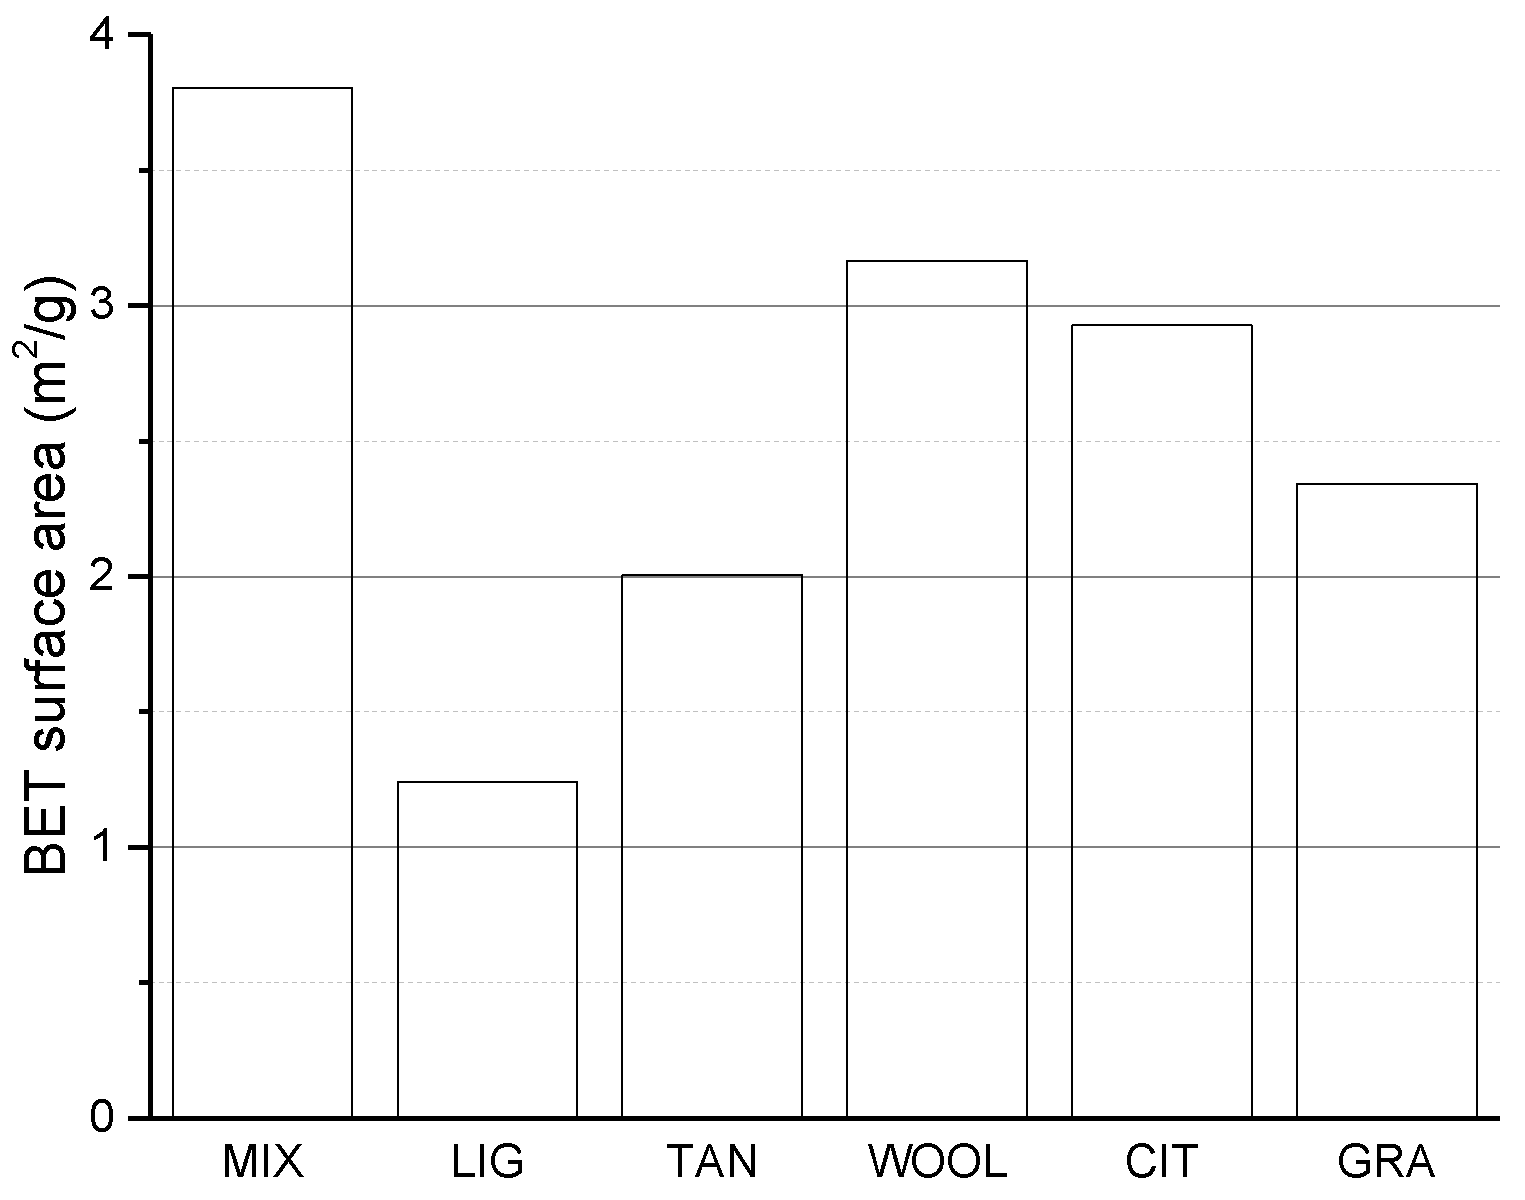
3.3. Nitrogen Adsorption–Desorption Isotherms
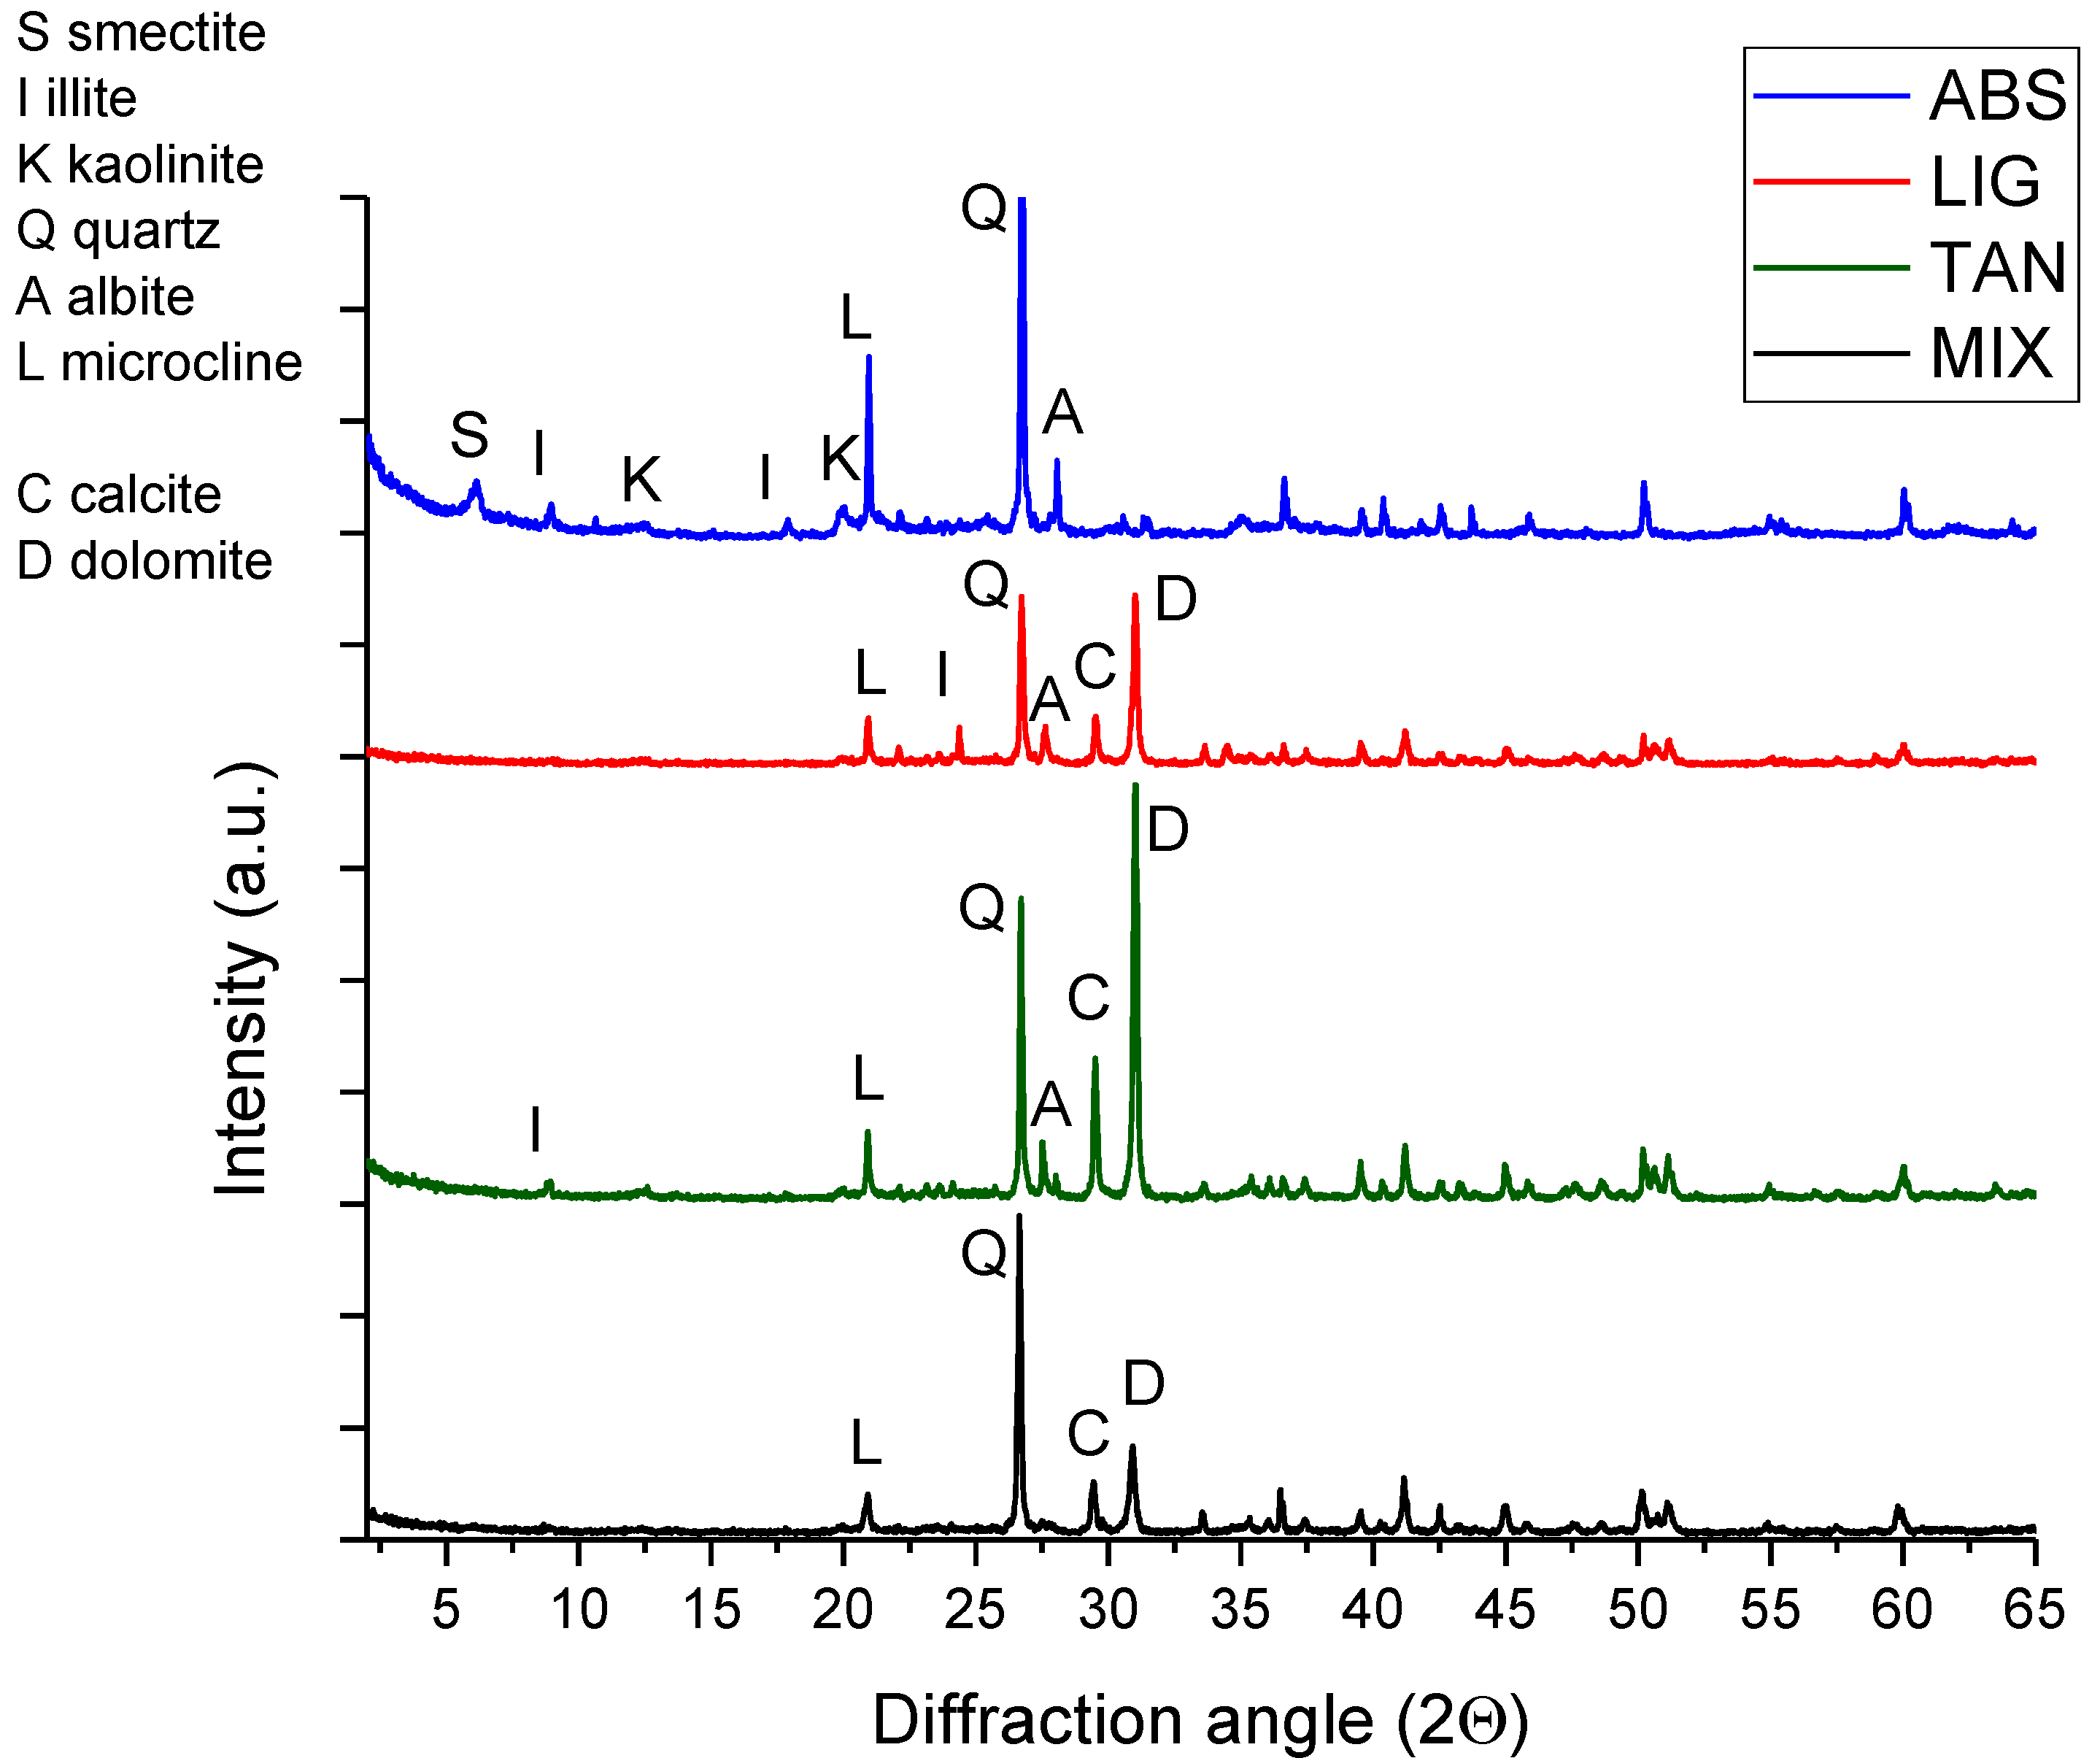
3.4. X-ray Diffraction
3.5. Scanning Electron Microscopy
3.5.1. Additives and Stabilized Samples
3.5.2. High Magnification of Samples Stabilized with Tannins and Lignin Sulfonate
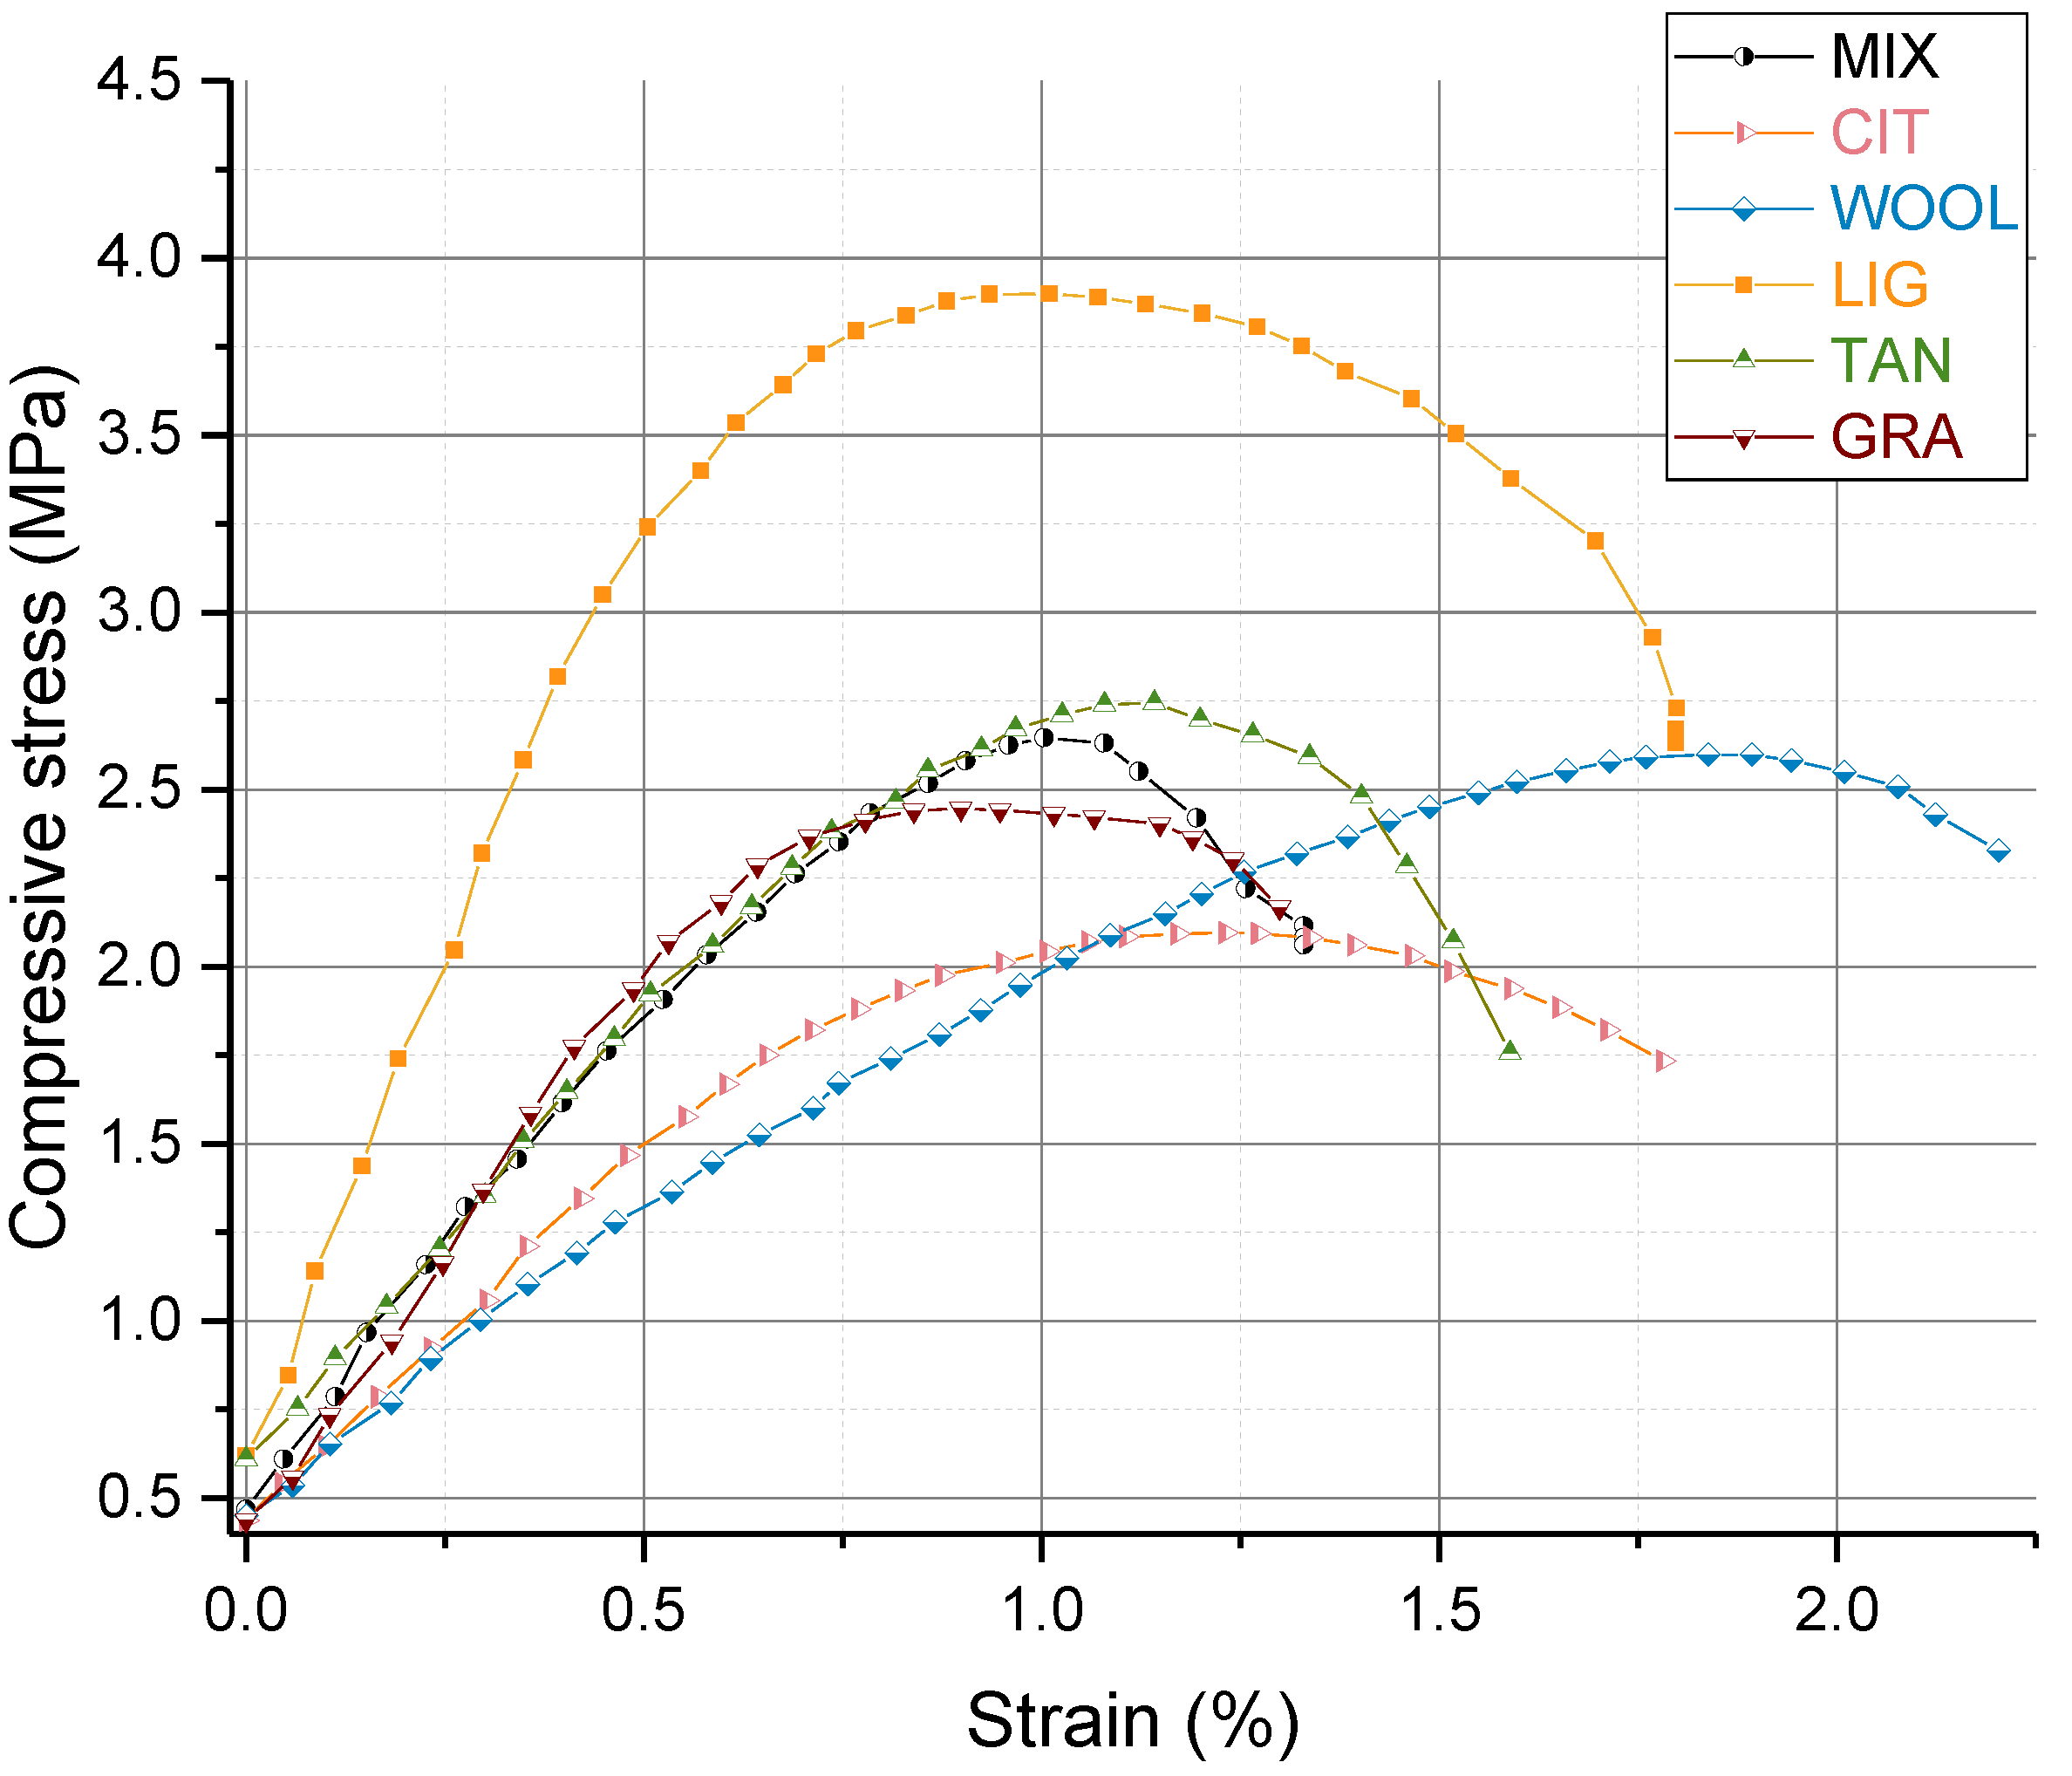
3.6. Mechanical Characterization: Unconfined Compressive Strength Test
4. Discussion of UCS Based on Microscopic Characterization
5. Conclusions and Outlook
Author Contributions
Funding
Institutional Review Board Statement
Informed Consent Statement
Data Availability Statement
Acknowledgments
Conflicts of Interest
Abbreviations
| RE | rammed earth |
| MIX | unstabilized RE specimens |
| LIG | MIX + lignin sulfonate |
| TAN | MIX + tannins |
| WOOL | MIX + sheep wool fibers |
| GRA | MIX + grape-seed flour |
| CIT | MIX + citrus pomace). |
References
- Oliver, J.G.J.; Janssens-Maenhout, G.; Muntean, M.; Peters, J.A.H.W. Trends in Global CO2 Emissions 2015 Report; PBL Publishers: The Hague, The Netherlands, 2015; Volume 39. [Google Scholar]
- Villoria Sáez, P.; Osmani, M. A Diagnosis of Construction and Demolition Waste Generation and Recovery Practice in the European Union. J. Clean. Prod. 2019, 241, 118400. [Google Scholar] [CrossRef]
- Jiménez Delgado, M.C.; Guerrero, I.C.; Delgado, M.C.J.; Guerrero, I.C.; Jiménez Delgado, M.C.; Guerrero, I.C.; Can, I.; Jime, M.C.; Jiménez Delgado, M.C.; Guerrero, I.C.; et al. The Selection of Soils for Unstabilised Earth Building: A Normative Review. Constr. Build. Mater. 2007, 21, 237–251. [Google Scholar] [CrossRef]
- Direction Collectif Terre Crue Pisé—Guide Des Bonnes Pratiques de La Constuction En Terre Crue, Edition 13 Decembre. 2018. Available online: https://www.rehabilitation-bati-ancien.fr/espace-documentaire/guide-des-bonnes-pratiques-la-construction-en-terre-crue (accessed on 18 April 2022).
- Anger, R.; Fontaine, L. Bâtir En Terre: Du Grain de Sable à L’architecture; Belin: Paris, France, 2009. [Google Scholar]
- Moevus, M.; Anger, R.; Fontaine, L. Hygro-Thermo-Mechanical Properties of Earthen Materials for Construction: A Literature Review. In Proceedings of the Terra 2012, XIth International Conference on the Study and Conservation of Earthen Architectural Heritage, Lima, Peru, 22–27 April 2012; pp. 1–10. [Google Scholar]
- Viswanath, S.M.; Gallipoli, D.; Bruno, A.W. Geotechnical Characterisation of Recycled Biopolymer- Stabilised Earthen Materials Caractérisation Géotechnique de Matériaux de Terre Recyclés Stabilisés. In Proceedings of the XVII European Conference on Soil Mechanics and Geotechnical Engineering ECSMGE, Reykjavik, Iceland, 1–6 September 2019. [Google Scholar] [CrossRef]
- Bruno, A.W.; Gallipoli, D.; Perlot, C.; Mendes, J. Mechanical Behaviour of Hypercompacted Earth for Building Construction. Mater. Struct. Constr. 2017, 50, 160. [Google Scholar] [CrossRef]
- Burroughs, S. Recommendations for the Selection, Stabilization, and Compaction of Soil for Rammed Earth Wall Construction. J. Green Build. 2010, 5, 101–114. [Google Scholar] [CrossRef]
- Maniatidis, V.; Walker, P. A Review of Rammed Earth Construction. In Technical report for Innovation Project “Developing Rammed Earth for UK Housing”; Natural Building Technology Group, Department of Architecture & Civil Engineering, University of Bath: Bath, UK, 2003. [Google Scholar]
- Burroughs, S. Soil Property Criteria for Rammed Earth Stabilization. J. Mater. Civ. Eng. 2008, 20, 264–273. [Google Scholar] [CrossRef]
- Ciancio, D.; Beckett, C.T.S.; Carraro, J.A.H. Optimum Lime Content Identification for Lime-Stabilised Rammed Earth. Constr. Build. Mater. 2014, 53, 59–65. [Google Scholar] [CrossRef] [Green Version]
- Arrigoni, A.; Grillet, A.C.; Pelosato, R.; Dotelli, G.; Beckett, C.T.S.; Woloszyn, M.; Ciancio, D. Reduction of Rammed Earth’s Hygroscopic Performance under Stabilisation: An Experimental Investigation. Build. Environ. 2017, 115, 358–367. [Google Scholar] [CrossRef]
- Allinson, D.; Hall, M. Hygrothermal Analysis of a Stabilised Rammed Earth Test Building in the UK. Energy Build. 2010, 42, 845–852. [Google Scholar] [CrossRef]
- Alam, I.; Naseer, A.; Shah, A.A. Economical Stabilization of Clay for Earth Buildings Construction in Rainy and Flood Prone Areas. Constr. Build. Mater. 2015, 77, 154–159. [Google Scholar] [CrossRef]
- Minke, G. Building with Earth, Design and Technology of a Sustainable Architecture; Birkhäuser—Publishers for Architecture: Berlin, Germany, 2012; Volume 2. [Google Scholar]
- Losini, A.E.; Grillet, A.C.; Bellotto, M.; Woloszyn, M.; Dotelli, G. Natural Additives and Biopolymers for Raw Earth Construction Stabilization—A Review. Constr. Build. Mater. 2021, 304, 124507. [Google Scholar] [CrossRef]
- D2166/D2166M; Annual Book of ASTM Standards. Standard Test Method for Unconfined Compressive Strength of Cohesive Soil. ASTM International, Ed.: West Conshohocken, PA, USA, 2013.
- Bui, Q.-B. Stability of Rammed Earth Structures: Durability and Mechanical Characteristics. Ph.D. Thesis, Ecole Nationale des Travaux Publics de l’Etat: Lyon, France, 2008. [Google Scholar]
- Losini, A.E.; Lavrik, L.; Caruso, M.; Woloszyn, M.; Grillet, A.C.; Dotelli, G.; Gallo Stampino, P. Mechanical Properties of Rammed Earth Stabilized with Local Waste and Recycled Materials. Constr. Technol. Archit. 2022, 1, 113–123. [Google Scholar] [CrossRef]
- Annual Book of ASTM; Standard Test Methods for Liquid Limit, Plastic Limit, and Plasticity Index of Soils D 4318—00. ASTM International: West Conshohocken, PA, USA, 2005.
- Losini, A.E.; Stampino, P.G.; Dotelli, G.; Bellotto, M.; Grillet, A.C.; Caruso, M.; Sabbadini, S.; Outin, J. Evaluation of Different Raw Earthen Plasters Stabilized with Lime for Bio-Building Exploitation. Acad. J. Civ. Eng. 2019, 37, 176–183. [Google Scholar] [CrossRef]
- Galimberti, A. Experimental Characterization of the Performances of Naturally-Stabilized Raw Earths against Water Action. Master’s Thesis, Poitenico of Milan, Milan, Italy, 2019. [Google Scholar]
- Choi, I.S.; Lee, Y.G.; Khanal, S.K.; Park, B.J.; Bae, H.J. A Low-Energy, Cost-Effective Approach to Fruit and Citrus Peel Waste Processing for Bioethanol Production. Appl. Energy 2015, 140, 65–74. [Google Scholar] [CrossRef]
- Fantilli, A.P.; Sicardi, S.; Dotti, F. The Use of Wool as Fiber-Reinforcement in Cement-Based Mortar. Constr. Build. Mater. 2017, 139, 562–569. [Google Scholar] [CrossRef]
- Petek, B.; Logar, R.M. Management of Waste Sheep Wool as Valuable Organic Substrate in European Union Countries. J. Mater. Cycles Waste Manag. 1234, 23, 44–54. [Google Scholar] [CrossRef]
- Galán-Marín, C.; Rivera-Gómez, C.; Petric, J. Clay-Based Composite Stabilized with Natural Polymer and Fibre. Constr. Build. Mater. 2010, 24, 1462–1468. [Google Scholar] [CrossRef]
- Aymerich, F.; Fenu, L.; Meloni, P. Effect of Reinforcing Wool Fibres on Fracture and Energy Absorption Properties of an Earthen Material. Constr. Build. Mater. 2012, 27, 66–72. [Google Scholar] [CrossRef]
- Statuto, D.; Sica, C.; Picuno, P. Experimental Development of Clay Bricks Reinforced with Agricultural By-Products. In Proceedings of the 46th Symposium “Actual Tasks on Agricultural Engineering”, Opatija, Croatia, 27 February–1 March 2018. [Google Scholar]
- Parlato, M.C.M.; Porto, S.M.C. Organized Framework of Main Possible Applications of Sheep Wool Fibers in Building Components. Sustainability 2020, 12, 761. [Google Scholar] [CrossRef] [Green Version]
- Xiao, B.; Sun, X.F.; Sun, R. Chemical Modification of Lignins with Succinic Anhydride in Aqueous Systems. Polym. Degrad. Stab. 2001, 71, 223–231. [Google Scholar] [CrossRef]
- Zimbardi, P.; Cardinale, G.; Demichele, M.; Nanna, F.; Viggiano, D.; Bonini, C.; Tofani, D. Lignin Recovery. A Resource to Value; La Lignina: Una Risorsa Da Valorizzare; ENEA, Dipt., Techincal Report Number ENEA-RT-ERG-98-11m; Energia, Centro Ricerche Trisaia: Rotondella, Italy, 1999. [Google Scholar]
- Ta’negonbadi, B.; Noorzad, R. Stabilization of Clayey Soil Using Lignosulfonate. Transp. Geotech. 2017, 12, 45–55. [Google Scholar] [CrossRef]
- Chen, Q.; Indraratna, B. Deformation Behavior of Lignosulfonate-Treated Sandy Silt under Cyclic Loading. J. Geotech. Geoenviron. Eng. 2015, 141, 06014015. [Google Scholar] [CrossRef]
- Tingle, J.S.; Santoni, R.L. Stabilization of Clay Soils with Nontraditional Additives. Transp. Res. Rec. 2003, 1819, 72–84. [Google Scholar] [CrossRef]
- Digrak, M.; Alma, H.; Ilçim, A.; Sen, S. Antibacterial and Antifungal Effects of Various Commercial Plant Extracts. Pharm. Biol. 1999, 37, 216–220. [Google Scholar] [CrossRef]
- Lopes, P.J.G.; Calegari, L.; de Medeiros Silva, W.A.; Gatto, D.A.; de Medeiros Neto, P.N.; de Melo, R.R.; Bakke, I.A.; de Avila Delucis, R.; Missio, A.L. Tannin-Based Extracts of Mimosa Tenuiflora Bark: Features and Prospecting as Wood Adhesives. Appl. Adhes. Sci. 2021, 9, 3. [Google Scholar] [CrossRef]
- Arkema, R.E. Tannin in Earthen Architecture: A Case-Study on the Use of Tannin as an Amendment for Adobe Preservation. J. Chem. Inf. Model. 2013, 53, 1689–1699. [Google Scholar]
- Vissac, A.; Bourgès, A.; Gandreau, D.; Anger, R.; Fontaine, L. Argiles & Biopolymères, Les Stabilisants Naturels Pour La Construction En Terre; CRAterre Editions: Villefontaine, France, 2017; ISBN 9782906901889. [Google Scholar]
- Keita, I.; Sorgho, B.; Dembele, C.; Plea, M.; Zerbo, L.; Guel, B.; Ouedraogo, R.; Gomina, M.; Blanchart, P. Ageing of Clay and Clay-Tannin Geomaterials for Building. Constr. Build. Mater. 2014, 61, 114–119. [Google Scholar] [CrossRef]
- Sorgho, B.; Zerbo, L.; Keita, I.; Dembele, C.; Plea, M.; Sol, V.; Gomina, M.; Blanchart, P. Strength and Creep Behavior of Geomaterials for Building with Tannin Addition. Mater. Struct. 2014, 47, 937–946. [Google Scholar] [CrossRef]
- Banakinao, S.; Tiem, S.; Attipou, K.; Lolo, K. Shear Resistance of Soils Improved with Tannins of Néré Pod. In Proceedings of the International Conference on Engineering, Applied Sciences and System Modeling; Springer: Berlin/Heidelberg, Germany, 2017; pp. 259–265. [Google Scholar]
- Guihéneuf, S.; Rangeard, D.; Perrot, A. Addition of Bio Based Reinforcement to Improve Workability, Mechanical Properties and Water Resistance of Earth-Based Mate-Rials. Acad. J. Civ. Eng. 2019, 37, 184–192. [Google Scholar] [CrossRef]
- Erktan, A.; Balmot, J.; Merino-Martín, L.; Monnier, Y.; Pailler, F.; Coq, S.; Abiven, S.; Stokes, A.; Le Bissonnais, Y.; Le, Y.; et al. Immediate and Long-Term Effect of Tannins on the Stabilization of Soil Aggregates. Soil Biol. Biochem. 2017, 105, 197–205. [Google Scholar] [CrossRef]
- Kaal, J.; Nierop, K.G.J.; Verstraten, J.M. Retention of Tannic Acid and Condensed Tannin by Fe-Oxide-Coated Quartz Sand. J. Colloid Interface Sci. 2005, 287, 72–79. [Google Scholar] [CrossRef]
- Yu, J.; Ahmedna, M. Functional Components of Grape Pomace: Their Composition, Biological Properties and Potential Applications. Int. J. Food Sci. Technol. 2013, 48, 221–237. [Google Scholar] [CrossRef]
- Kalli, E.; Lappa, I.; Bouchagier, P.; Tarantilis, P.A.; Skotti, E. Novel Application and Industrial Exploitation of Winery By-Products. Bioresour. Bioprocess. 2018, 5, 46. [Google Scholar] [CrossRef]
- Rabiei, Z.; Naderi, S.; Rafieian-Kopaei, M. Study of Antidepressant Effects of Grape Seed Oil in Male Mice Using Tail Suspension and Forced Swim Tests. Bangladesh J. Pharmacol. 2017, 12, 397–402. [Google Scholar] [CrossRef] [Green Version]
- Cai, G.; Zhang, T.; Liu, S.; Li, J.; Jie, D. Stabilization Mechanism and Effect Evaluation of Stabilized Silt with Lignin Based on Laboratory Data. Mar. Georesour. Geotechnol. 2016, 34, 331–340. [Google Scholar] [CrossRef]
- Zhang, T.; Cai, G.; Liu, S. Application of Lignin-Based by-Product Stabilized Silty Soil in Highway Subgrade: A Fi Eld Investigation. J. Clean. Prod. 2017, 142, 4243–4257. [Google Scholar] [CrossRef]
- ASTM D1557-07; Annual Book of ASTM Standards. Standard Test Methods for Laboratory Compaction Characteristics of Soil Using Modified Effort. International ASTM: West Conshohocken, PA, USA, 2007.
- Beckett, C. Structures Laboratory: Rammed Earth Testing Procedures; Internal Report; The University of Wenstern Australia: Crawley, WA, Australia, 2013. [Google Scholar]
- UNI CEN ISO/TS 17892-1; European Comeetee for Standardization: Geotechnical Investigation and Testing—Laboratory Testing of Soil—Part 1: Determination of Water Content. UNI: Milano, Italia, 2004.
- Aubert, J.E.; Fabbri, A.; Morel, J.C.; Maillard, P. An Earth Block with a Compressive Strength Higher than 45 MPa! Constr. Build. Mater. 2013, 47, 366–369. [Google Scholar] [CrossRef]
- Fabbri, A.; Morel, J.-C.; Aubert, J.-E.; Bui, Q.-B.; Gallipoli, D.; Reddy, B.V.V. Testing and Characterisation of Earth-Based Building Materials and Elements: State-of-the-Art Report of the RILEM TC 274-TCE; Springer Nature: Cham, Switzerland, 2021. [Google Scholar]
- Annual Book of ASTM Standards. Standard Test Method for Determination of Pore Volume and Pore Volume Distribution of Soil and Rock by Mercury Intrusion Porosimetry—D4404—10; International ASTM: West Conshohocken, PA, USA, 2018; Volume 12, ISBN 5935522004. [Google Scholar]
- Wu, M.; Johannesson, B.; Geiker, M. Application of Water Vapor Sorption Measurements for Porosity Characterization of Hardened Cement Pastes. Constr. Build. Mater. 2014, 66, 621–633. [Google Scholar] [CrossRef]
- Collet, F.; Bart, M.; Serres, L.; Miriel, J. Porous Structure and Water Vapour Sorption of Hemp-Based Materials. Constr. Build. Mater. 2008, 22, 1271–1280. [Google Scholar] [CrossRef]
- Arrigoni Marocco, A. How Sustainable Are Natural Construction Materials? Stabilised Rammed Earth, Hempcrete and Other Strategies to Reduce the Life-Cycle Environmental Impact of Buildings. Ph.D. Thesis, Politenico di Milano, Milano, Italy, 2017. [Google Scholar]
- Shi, B.; Wu, Z.; Inyang, H.; Chen, J.; Wang, B. Preparation of Soil Specimens for SEM Analysis Using Freeze-Cut-Drying. Bull. Eng. Geol. Environ. 1999, 58, 1–7. [Google Scholar] [CrossRef]
- Zdravkov, B.D.; Čermák, J.J.; Šefara, M.; Janků, J. Pore Classification in the Characterization of Porous Materials: A Perspective. Cent. Eur. J. Chem. 2007, 5, 385–395. [Google Scholar] [CrossRef]
- Romero Morales, E. Characterisation and Thermo-Hydro-Mechanical Behavior of Unsaturated Boom Clay: An Experimental Study. Ph.D. Thesis, Polytechnics University, Barcelona, Spain, 1999. [Google Scholar]
- Della Vecchia, G.; Dieudonné, A.; Jommi, C.; Charlier, R. Accounting for Evolving Pore Size Distribution in Water Retention Models for Compacted Clays. Int. J. Numer. Anal. Methods Geomech. 2006, 30, 1303–1336. [Google Scholar] [CrossRef] [Green Version]
- Romero, E.; Gens, A.; Lloret, A. Water Permeability, Water Retention and Microstructure of Unsaturated Compacted Boom Clay. Eng. Geol. 1999, 54, 117–127. [Google Scholar] [CrossRef]
- Bruno, A.W.; Perlot, C.; Mendes, J.; Gallipoli, D. A Microstructural Insight into the Hygro-Mechanical Behaviour of a Stabilised Hypercompacted Earth. Mater. Struct. Constr. 2018, 51, 32. [Google Scholar] [CrossRef]
- Zhang, T.; Liu, S.; Cai, G.; Puppala, A.J. Experimental Investigation of Thermal and Mechanical Properties of Lignin Treated Silt. Eng. Geol. 2015, 196, 1–11. [Google Scholar] [CrossRef]
- Poppe, L.J.; Paskevich, V.F.; Hathaway, J.C.; Blackwood, D.S. A Laboratory Manual for X-ray Powder Diffraction. US Geol. Surv. Open-File Rep. 2001, 1, 1–88. [Google Scholar] [CrossRef]
- Alazigha, D.P.; Indraratna, B.; Vinod, J.S.; Heitor, A. Mechanisms of Stabilization of Expansive Soil with Lignosulfonate Admixture. Transp. Geotech. 2018, 14, 81–92. [Google Scholar] [CrossRef] [Green Version]
- Neville, A. The Properties of Concrete; Pearson Editions: Essex, England, 2011; ISBN 9780273755807. [Google Scholar]
- Rodríguez-Mariscal, J.; Solís, M.; Cifuentes, H. Methodological Issues for the Mechanical Characterization of Unfiredearth Bricks. Constr. Build. Mater. J. 2018, 175, 804–814. [Google Scholar] [CrossRef]


| Earth | Clay (%) | Silt (%) | Sand (%) | Gs Specific Gravity | LL (%) | PL (%) | PI (%) |
|---|---|---|---|---|---|---|---|
| Diameter (mm) | d < 0.002 | 0.002 < d < 0.06 | 0.06 < d < 2 | ||||
| ABS | 36 | 44 | 20 | 2.65 | 42 | 24 | 18 |
| SAND | - | 4 | 96 | 2.78 | - | - | - |
| MIX | 9 | 12 | 79 | 2.77 | 24 | 18 | 6 |
| Samples | Density (g/cm3) | UCS (MPa) | Improvement UCS (%) | Stiffness Ec (MPa) | w (%) | Sr_final (%) |
|---|---|---|---|---|---|---|
| MIX | 2.084 ±0.032 | 2.51 ± 0.17 | - | 285 ± 17 | 0.73 ± 0.02 | 6.71 ± 0.69 |
| LIG | 2.086 ±0.027 | 3.47 ± 0.59 | + 38.3 | 511 ± 53 | 0.74 ± 0.01 | 6.64 ± 0.43 |
| TAN | 2.057 ±0.011 | 2.85 ±0.25 | +13.3 | 270 ± 59 | 1.11 ± 0.02 | 9.36 ± 0.04 |
| WOOL | 2.069 ±0.014 | 2.67 ± 0.18 | + 6.1 | 194 ± 38 | 0.65 ± 0.03 | 5.89 ± 0.42 |
| CIT | 2.049 ±0.016 | 1.90 ± 0.11 | −24.5 | 197 ± 23 | 0.76 ± 0.01 | 6.61 ± 0.34 |
| GRA | 2.054 ±0.044 | 2.14 ± 0.57 | −14.7 | 250 ± 57 | 0.84 ± 0.04 | 7.85 ± 0.84 |
Publisher’s Note: MDPI stays neutral with regard to jurisdictional claims in published maps and institutional affiliations. |
© 2022 by the authors. Licensee MDPI, Basel, Switzerland. This article is an open access article distributed under the terms and conditions of the Creative Commons Attribution (CC BY) license (https://creativecommons.org/licenses/by/4.0/).
Share and Cite
Losini, A.E.; Grillet, A.-C.; Woloszyn, M.; Lavrik, L.; Moletti, C.; Dotelli, G.; Caruso, M. Mechanical and Microstructural Characterization of Rammed Earth Stabilized with Five Biopolymers. Materials 2022, 15, 3136. https://doi.org/10.3390/ma15093136
Losini AE, Grillet A-C, Woloszyn M, Lavrik L, Moletti C, Dotelli G, Caruso M. Mechanical and Microstructural Characterization of Rammed Earth Stabilized with Five Biopolymers. Materials. 2022; 15(9):3136. https://doi.org/10.3390/ma15093136
Chicago/Turabian StyleLosini, Alessia Emanuela, Anne-Cecile Grillet, Monika Woloszyn, Liudmila Lavrik, Chiara Moletti, Giovanni Dotelli, and Marco Caruso. 2022. "Mechanical and Microstructural Characterization of Rammed Earth Stabilized with Five Biopolymers" Materials 15, no. 9: 3136. https://doi.org/10.3390/ma15093136