
Smart Bone Graft Composite for Cancer Therapy Using Magnetic Hyperthermia

 ,
,  , , , and
Abstract
:1. Introduction
2. Materials and Methods
2.1. Materials
2.2. Preparation of Materials
2.2.1. Preparation of LSM
2.2.2. Preparation of Magnetic Biocomposites
2.3. Characterization
2.3.1. Influence of LSM on the Sinterability of Bioactive Glass F18
2.3.2. Microstructure
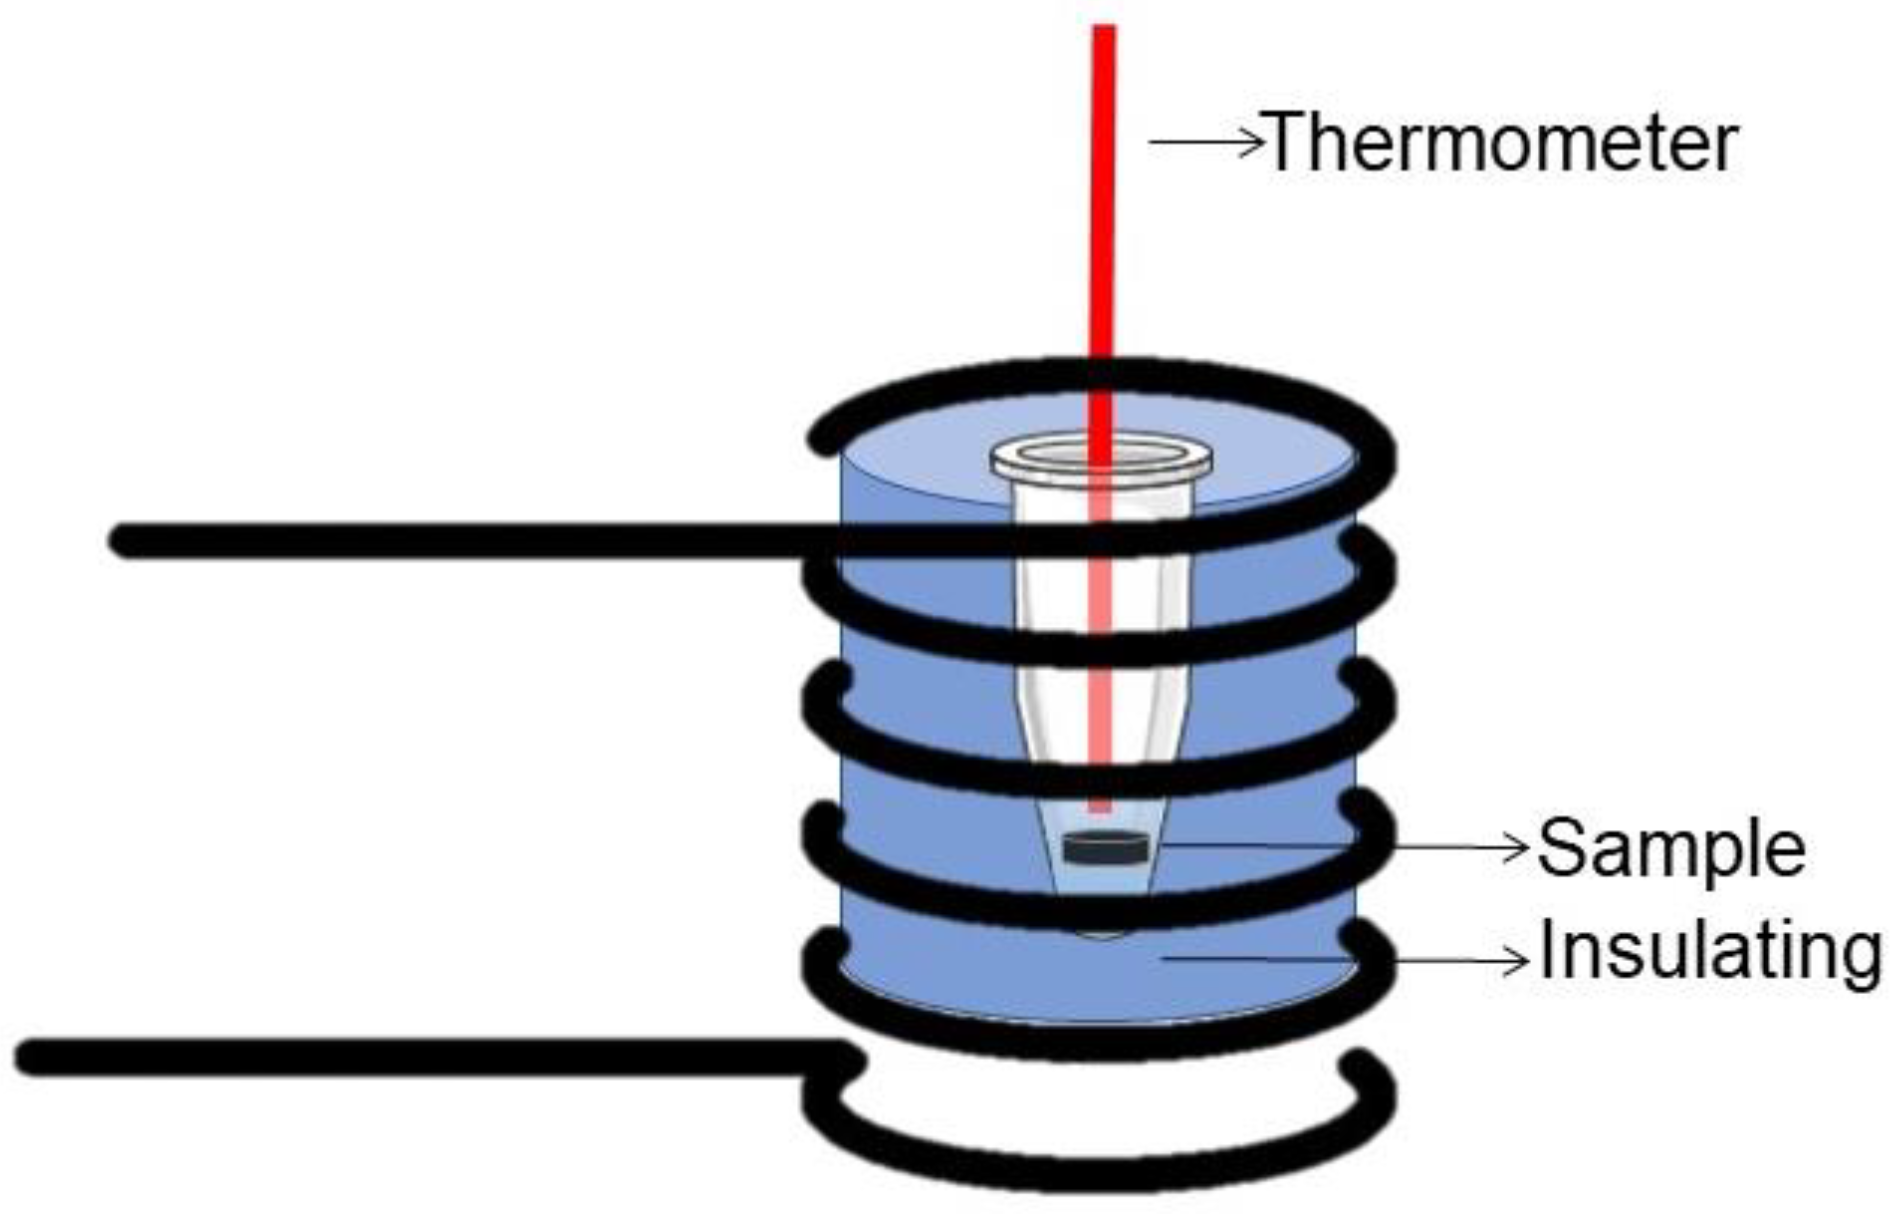
2.3.3. Magnetic Properties and Calorimetry under Alternating Magnetic Field
2.3.4. In Vitro Bioactivity
3. Results
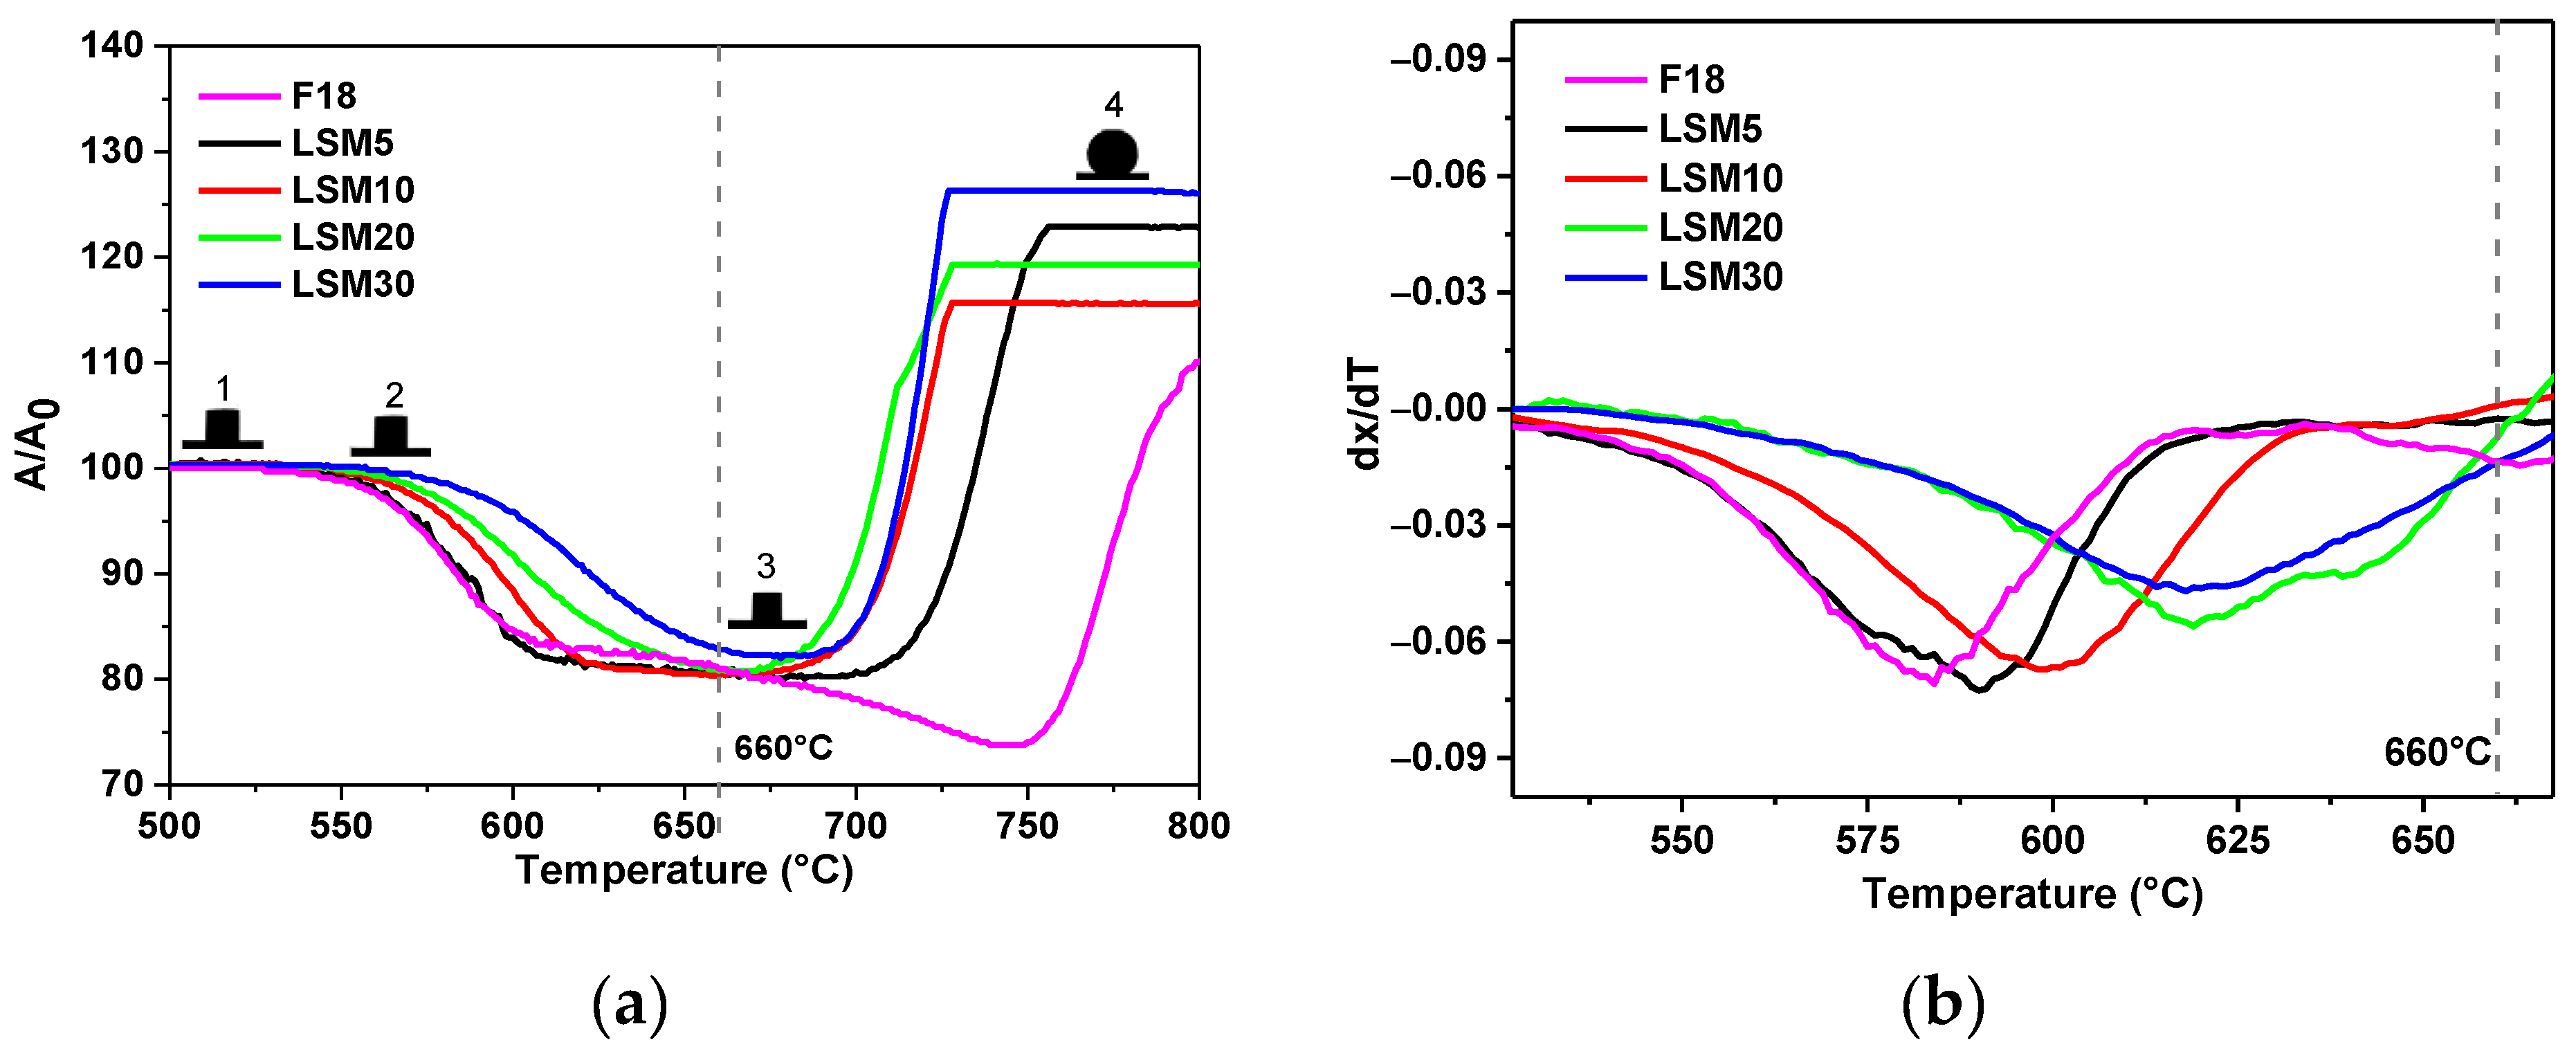
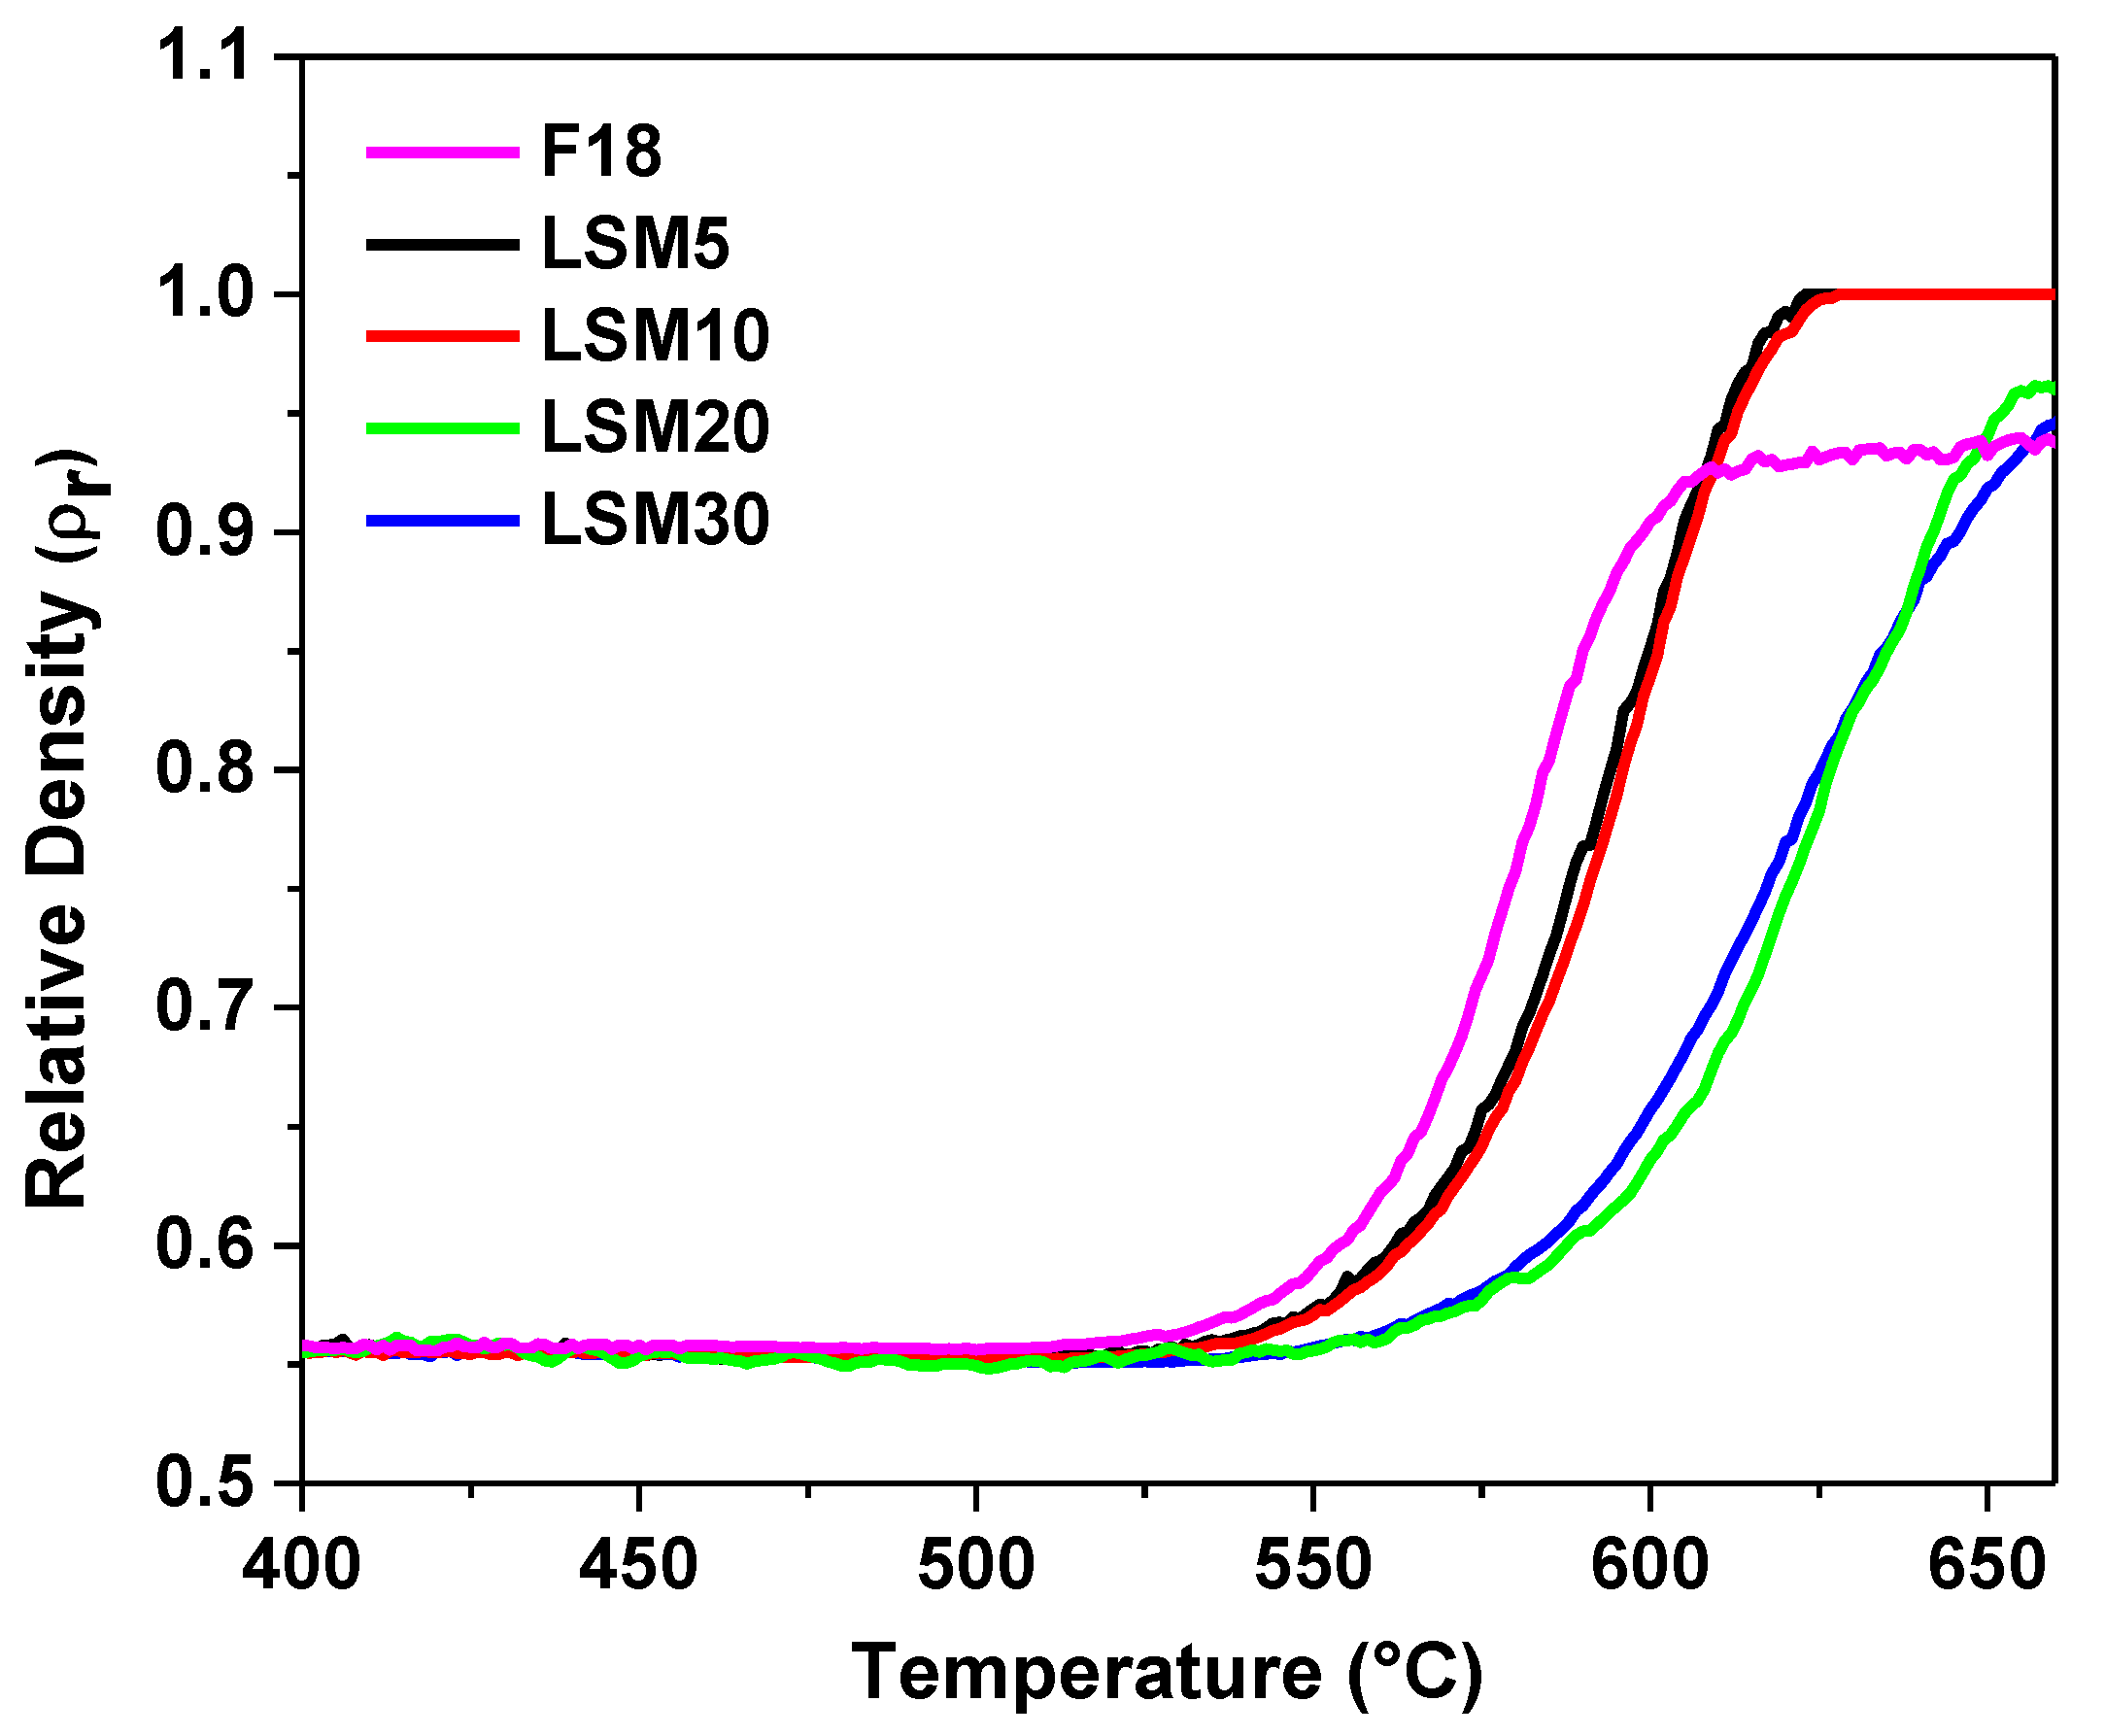
3.1. Influence of LSM on the Sinterability of Bioactive Glass F18
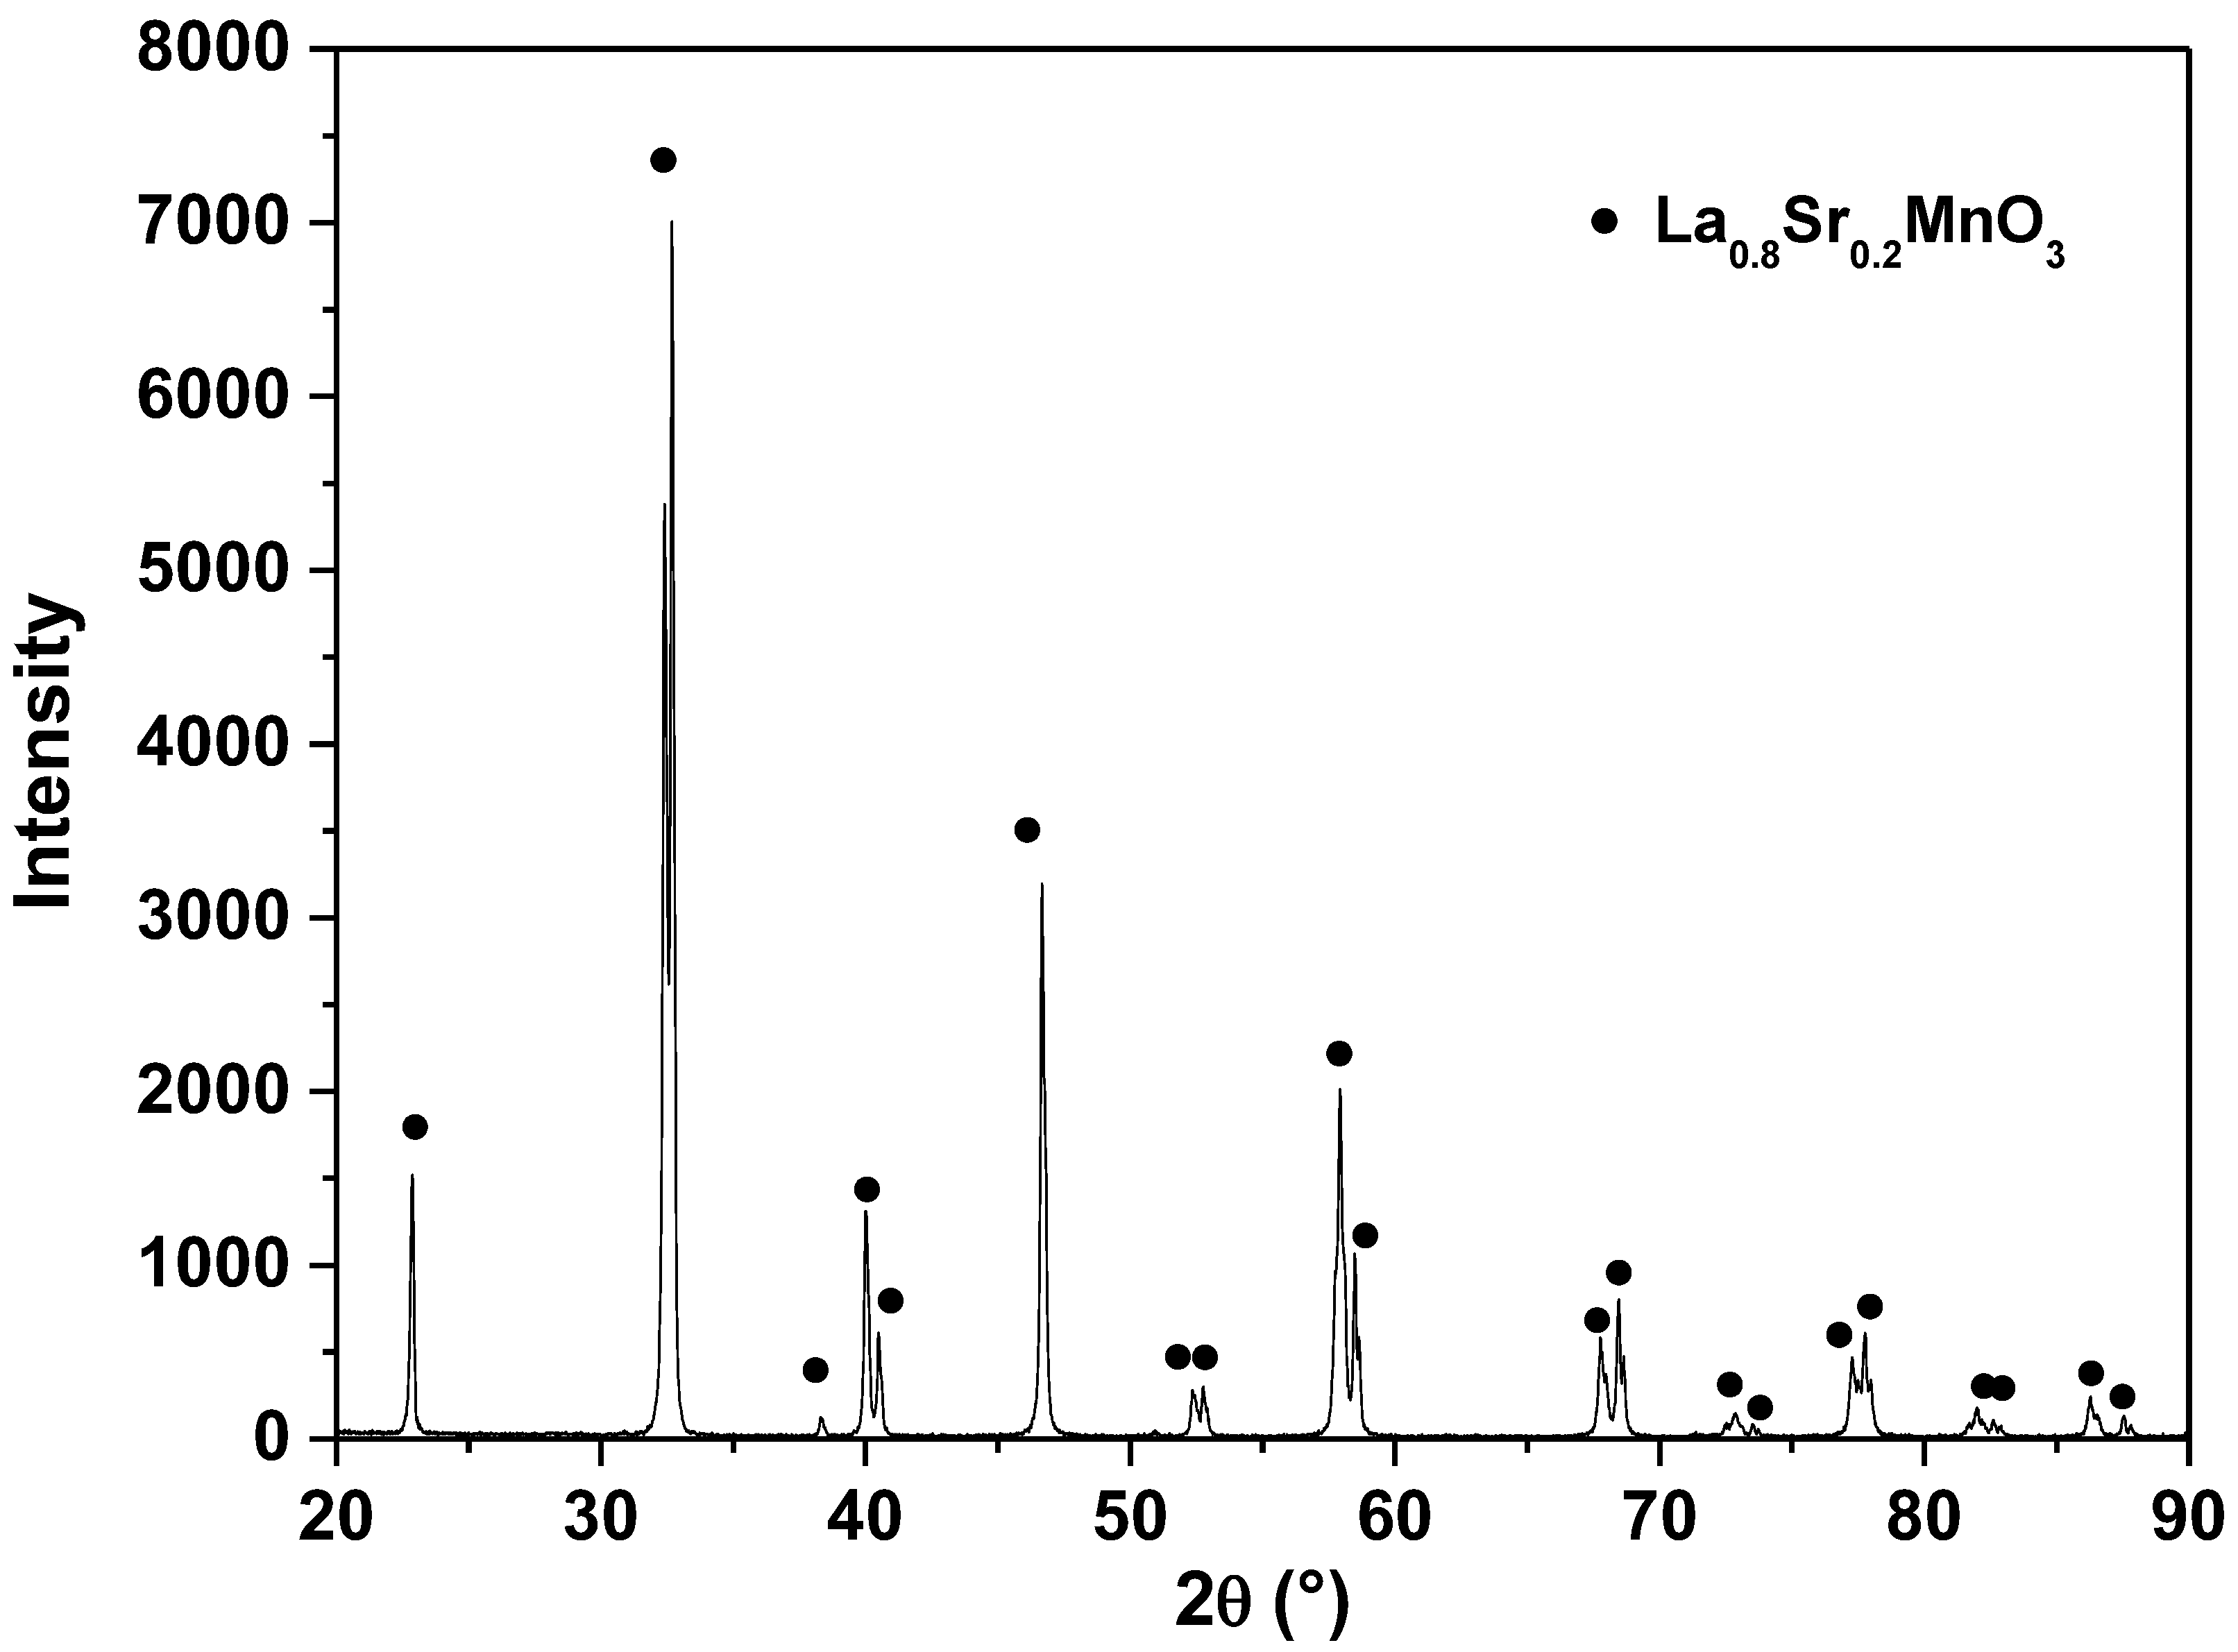
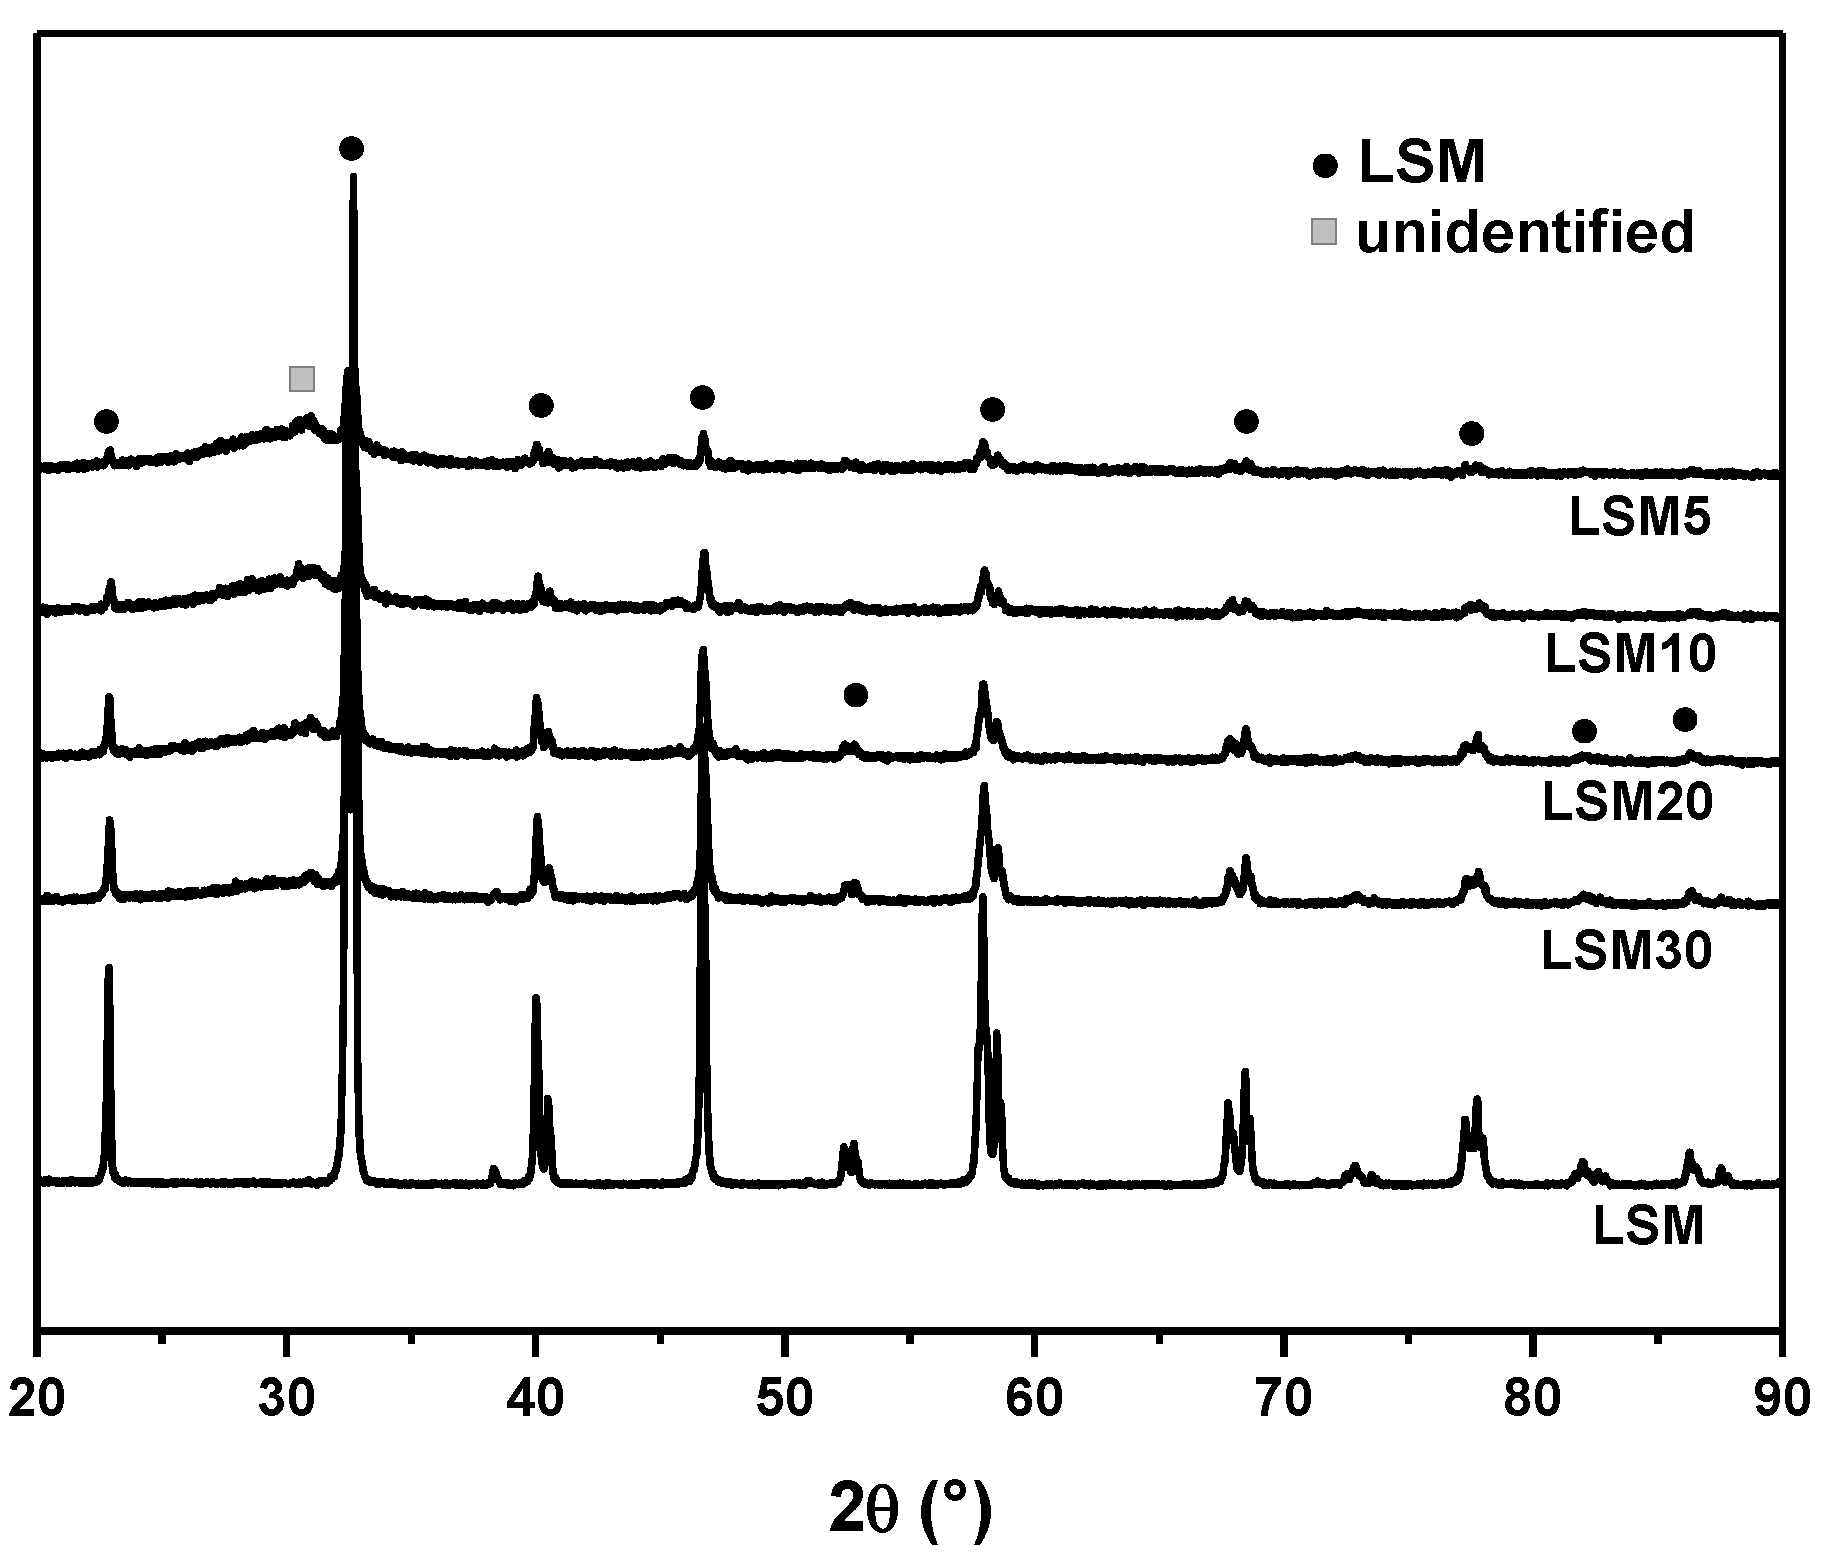
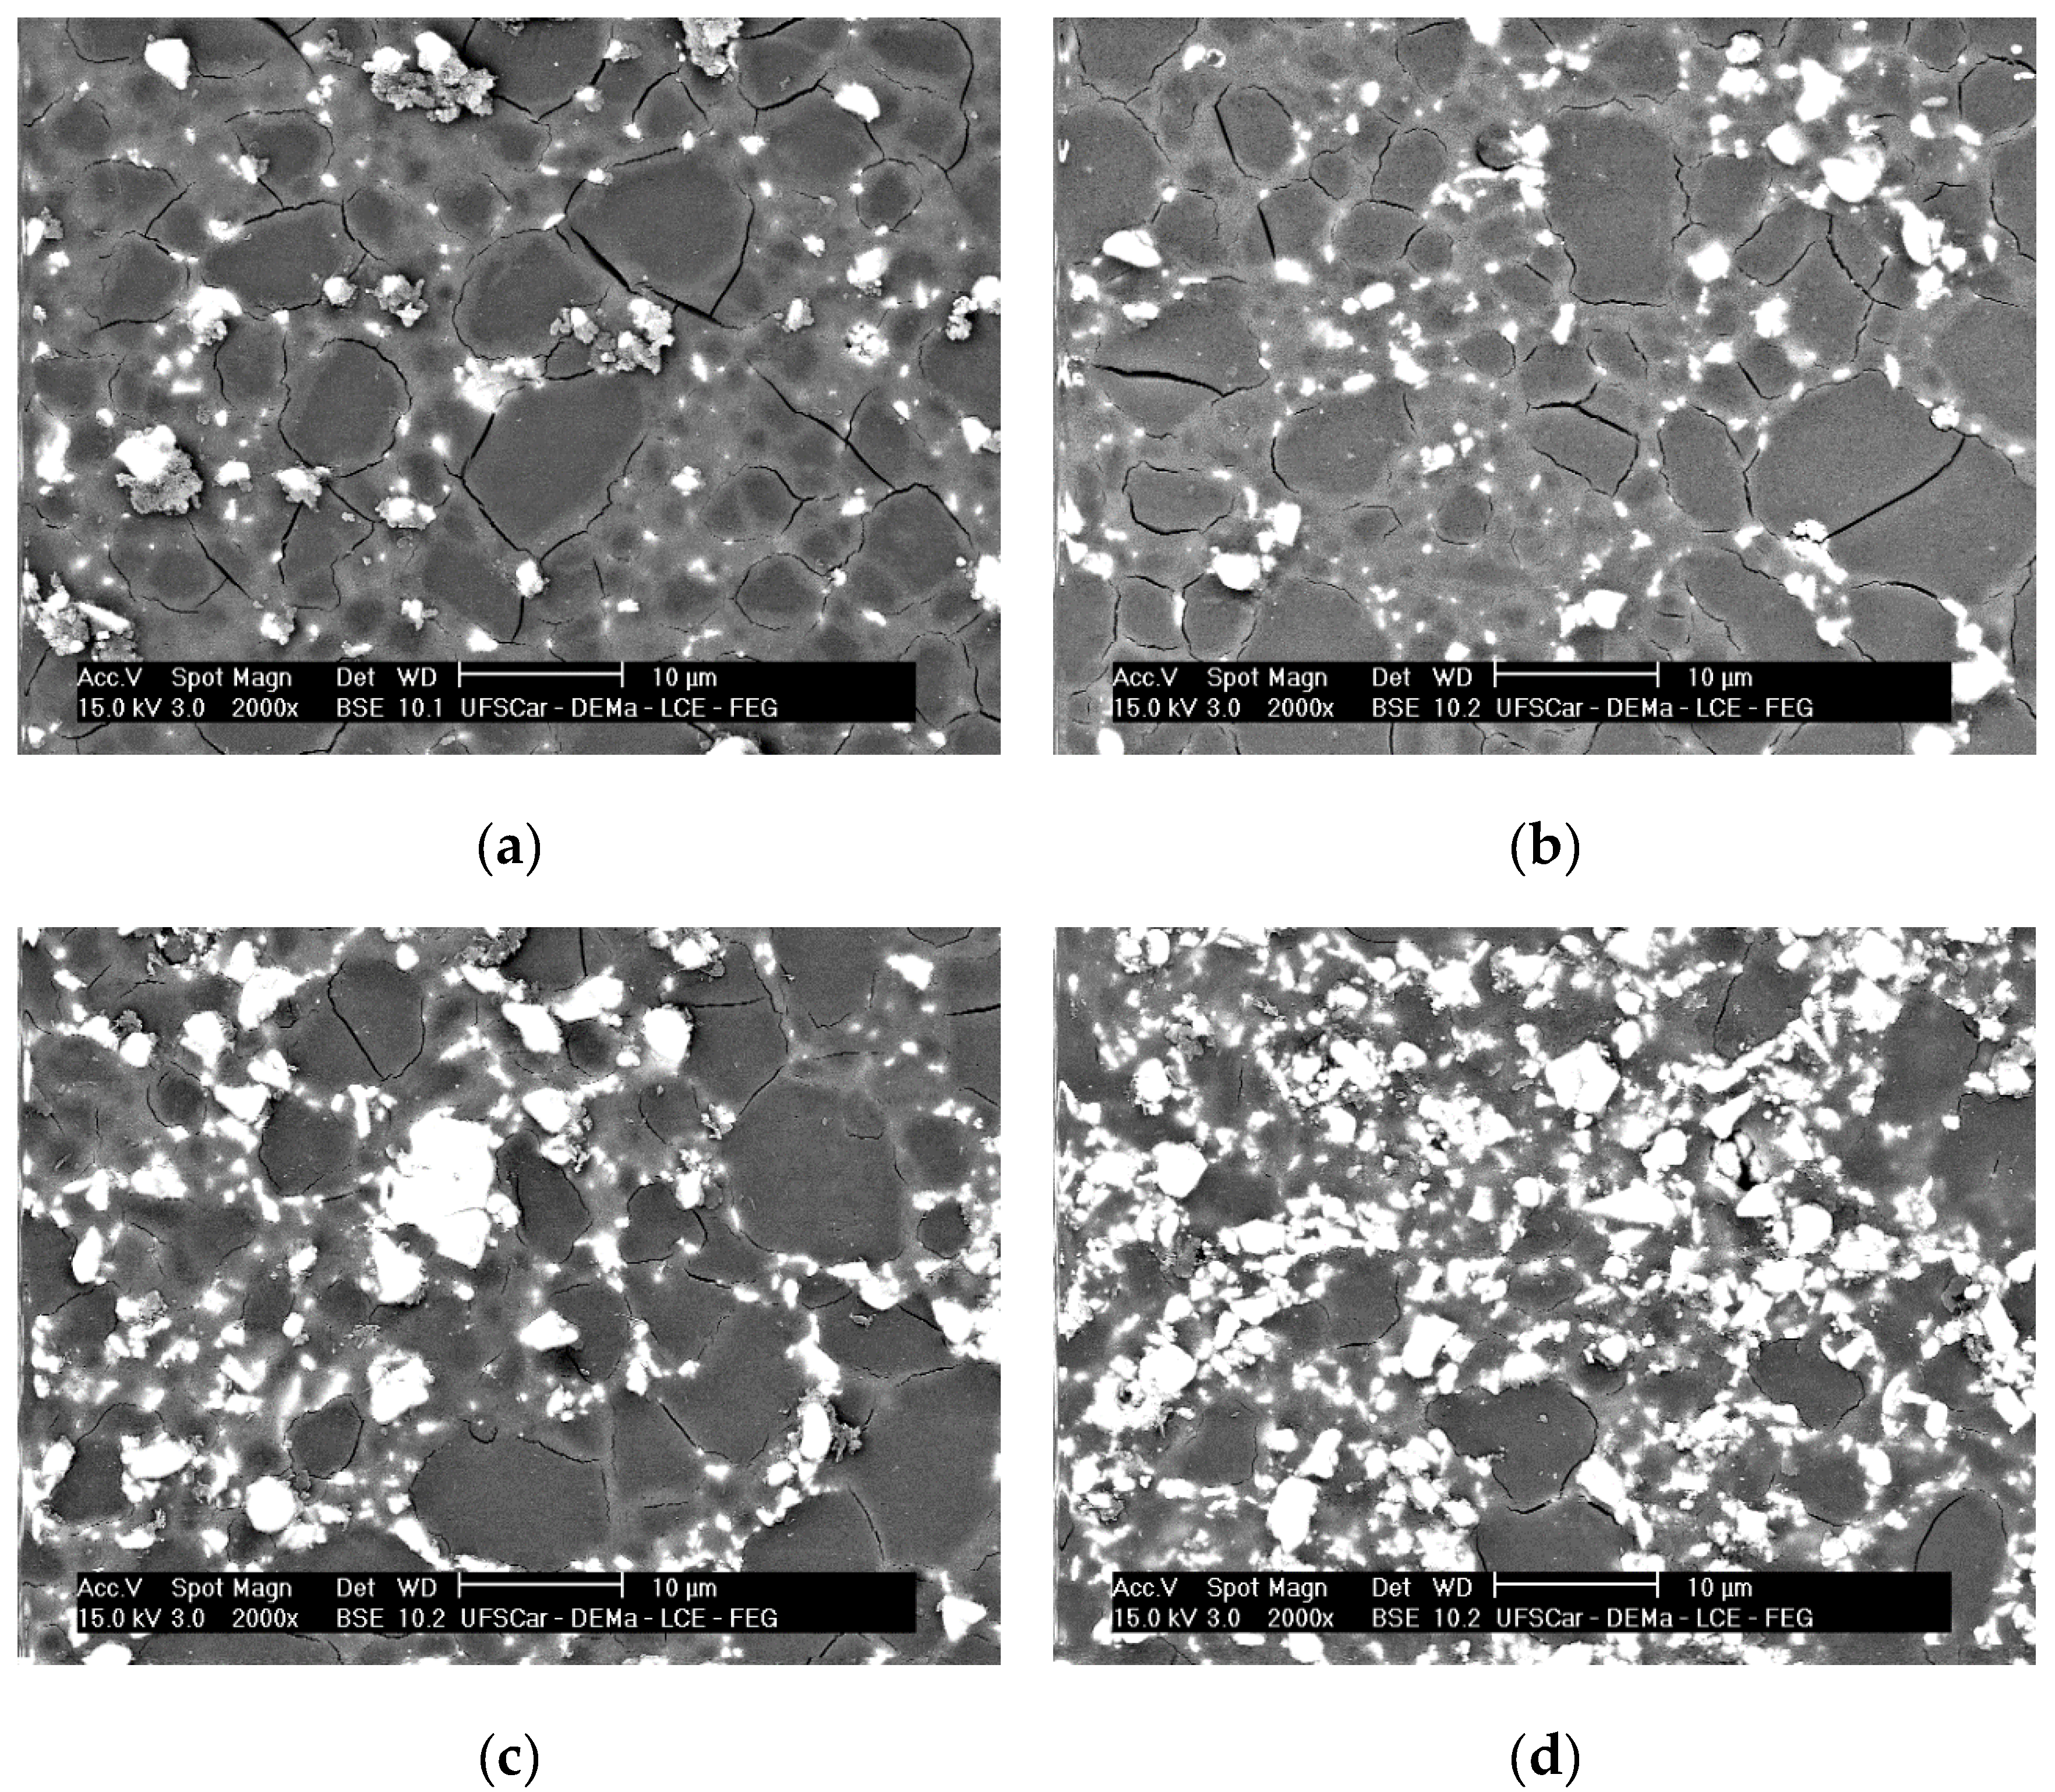
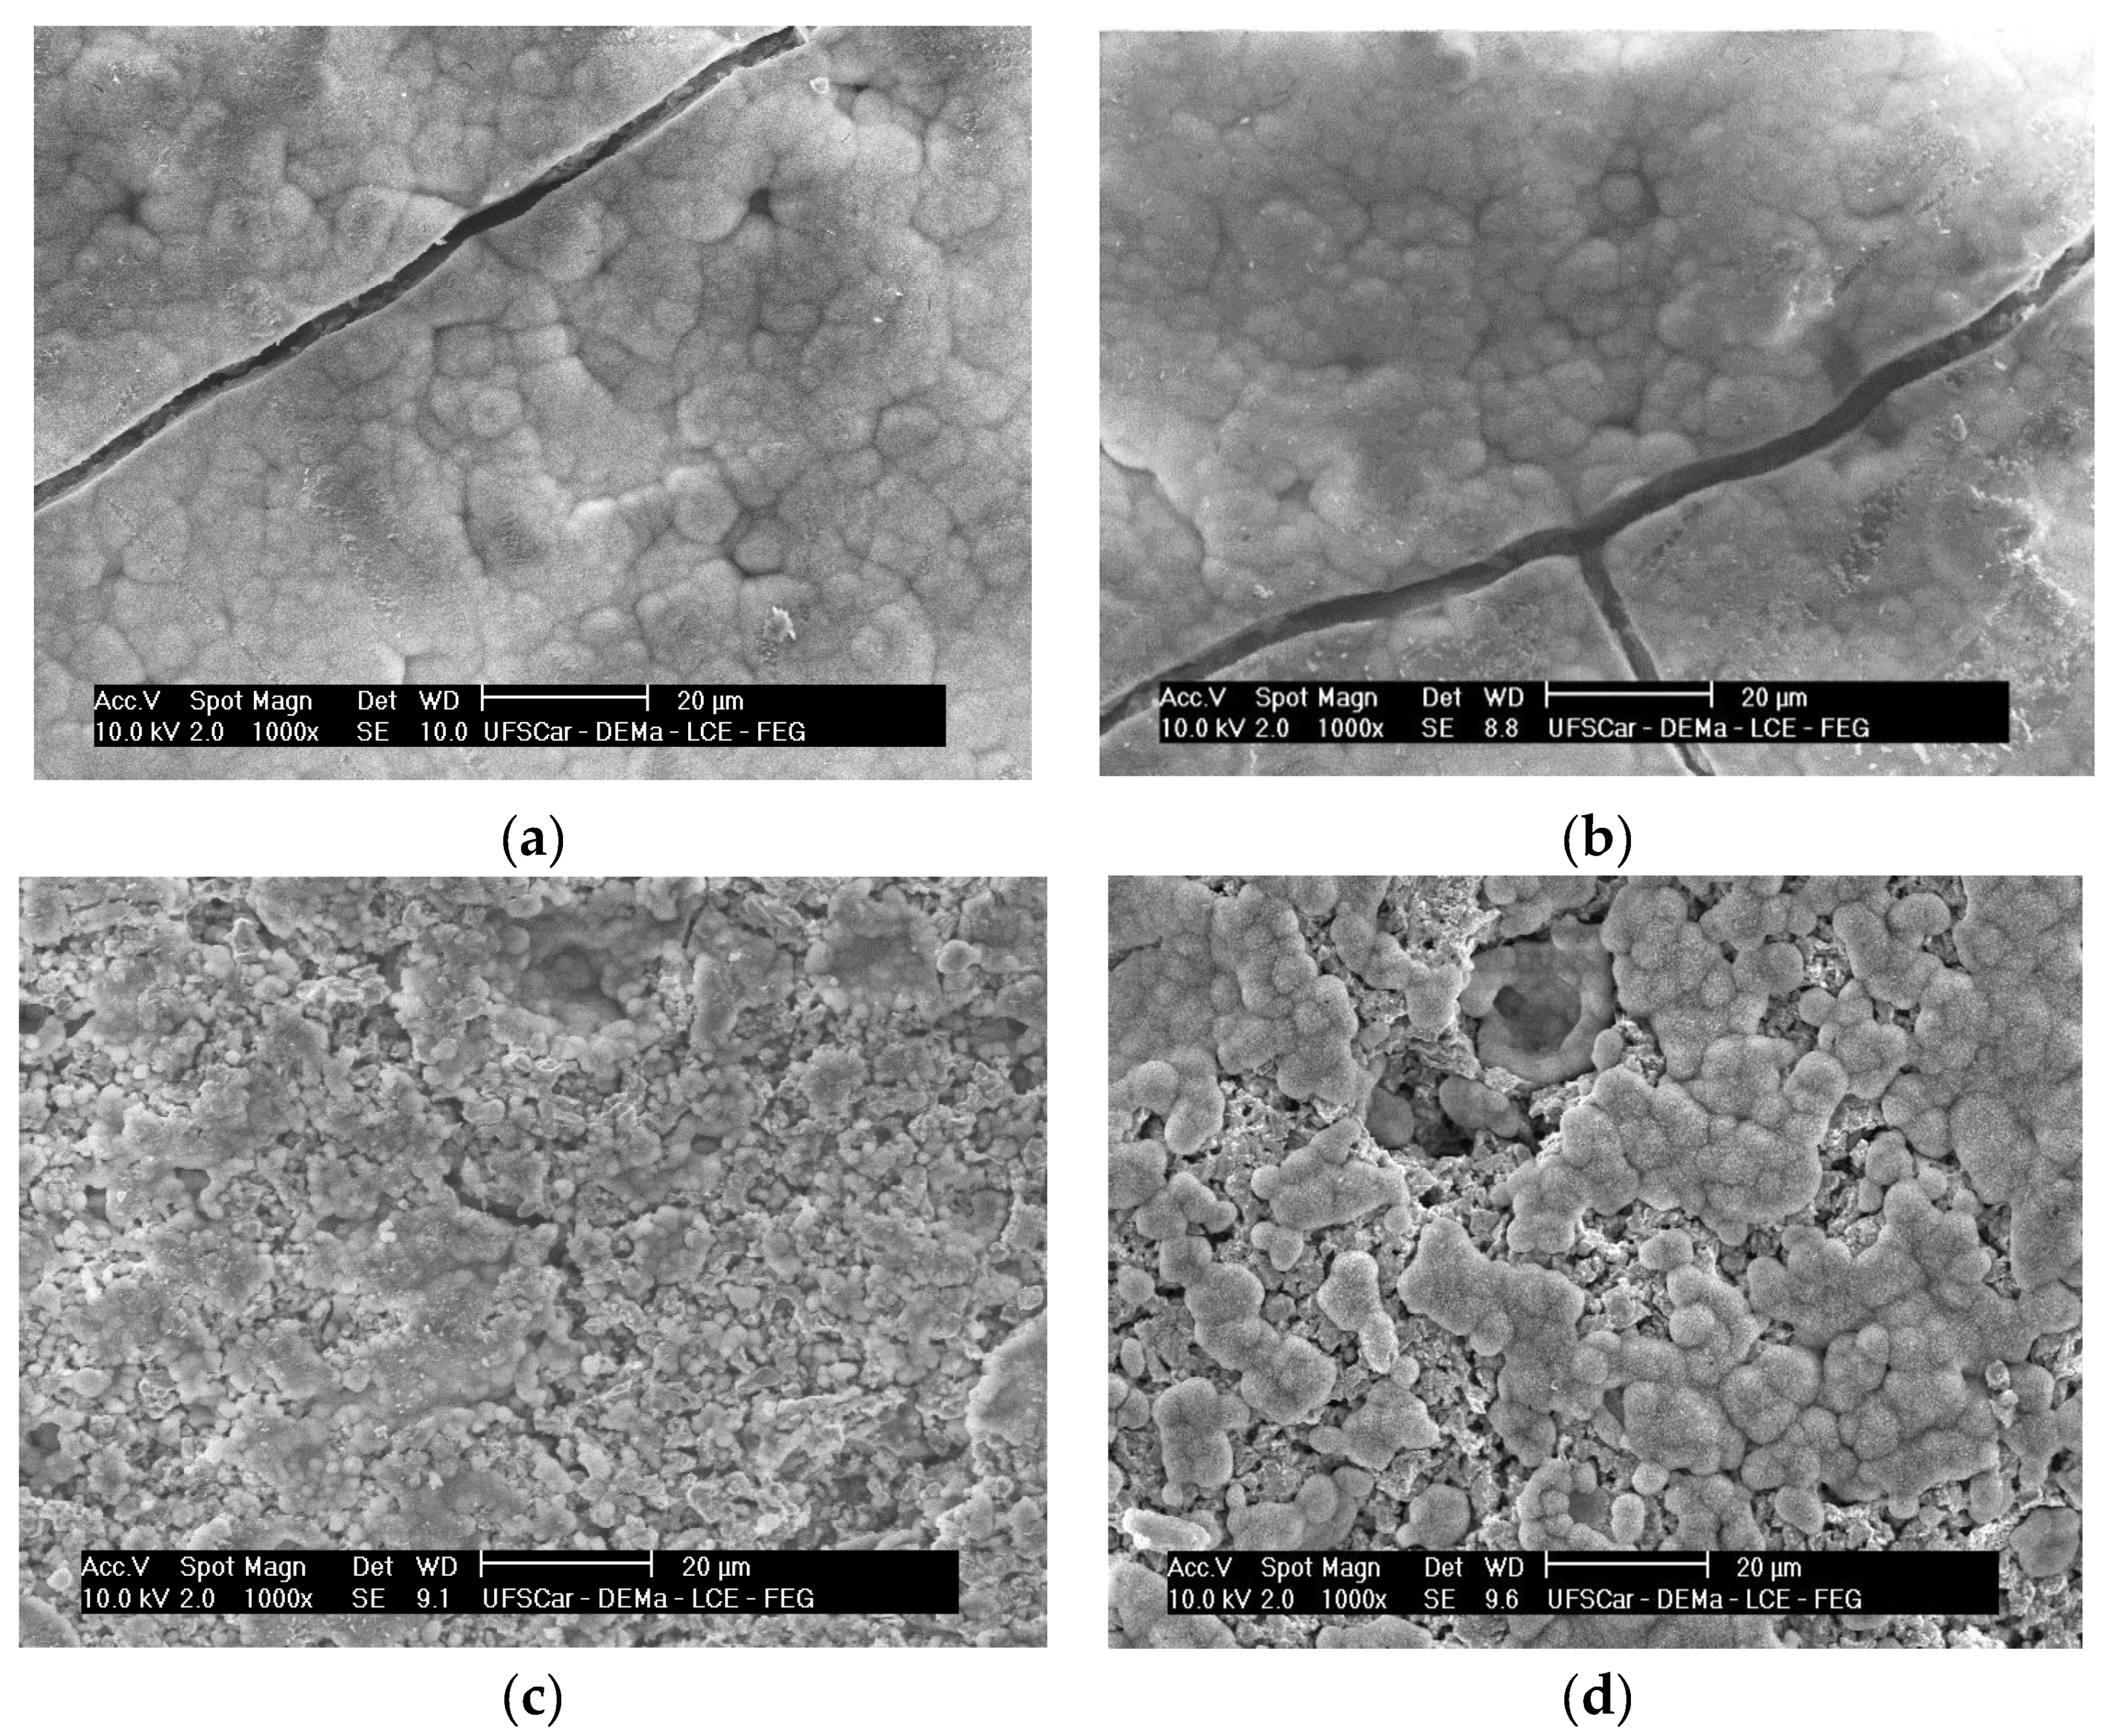
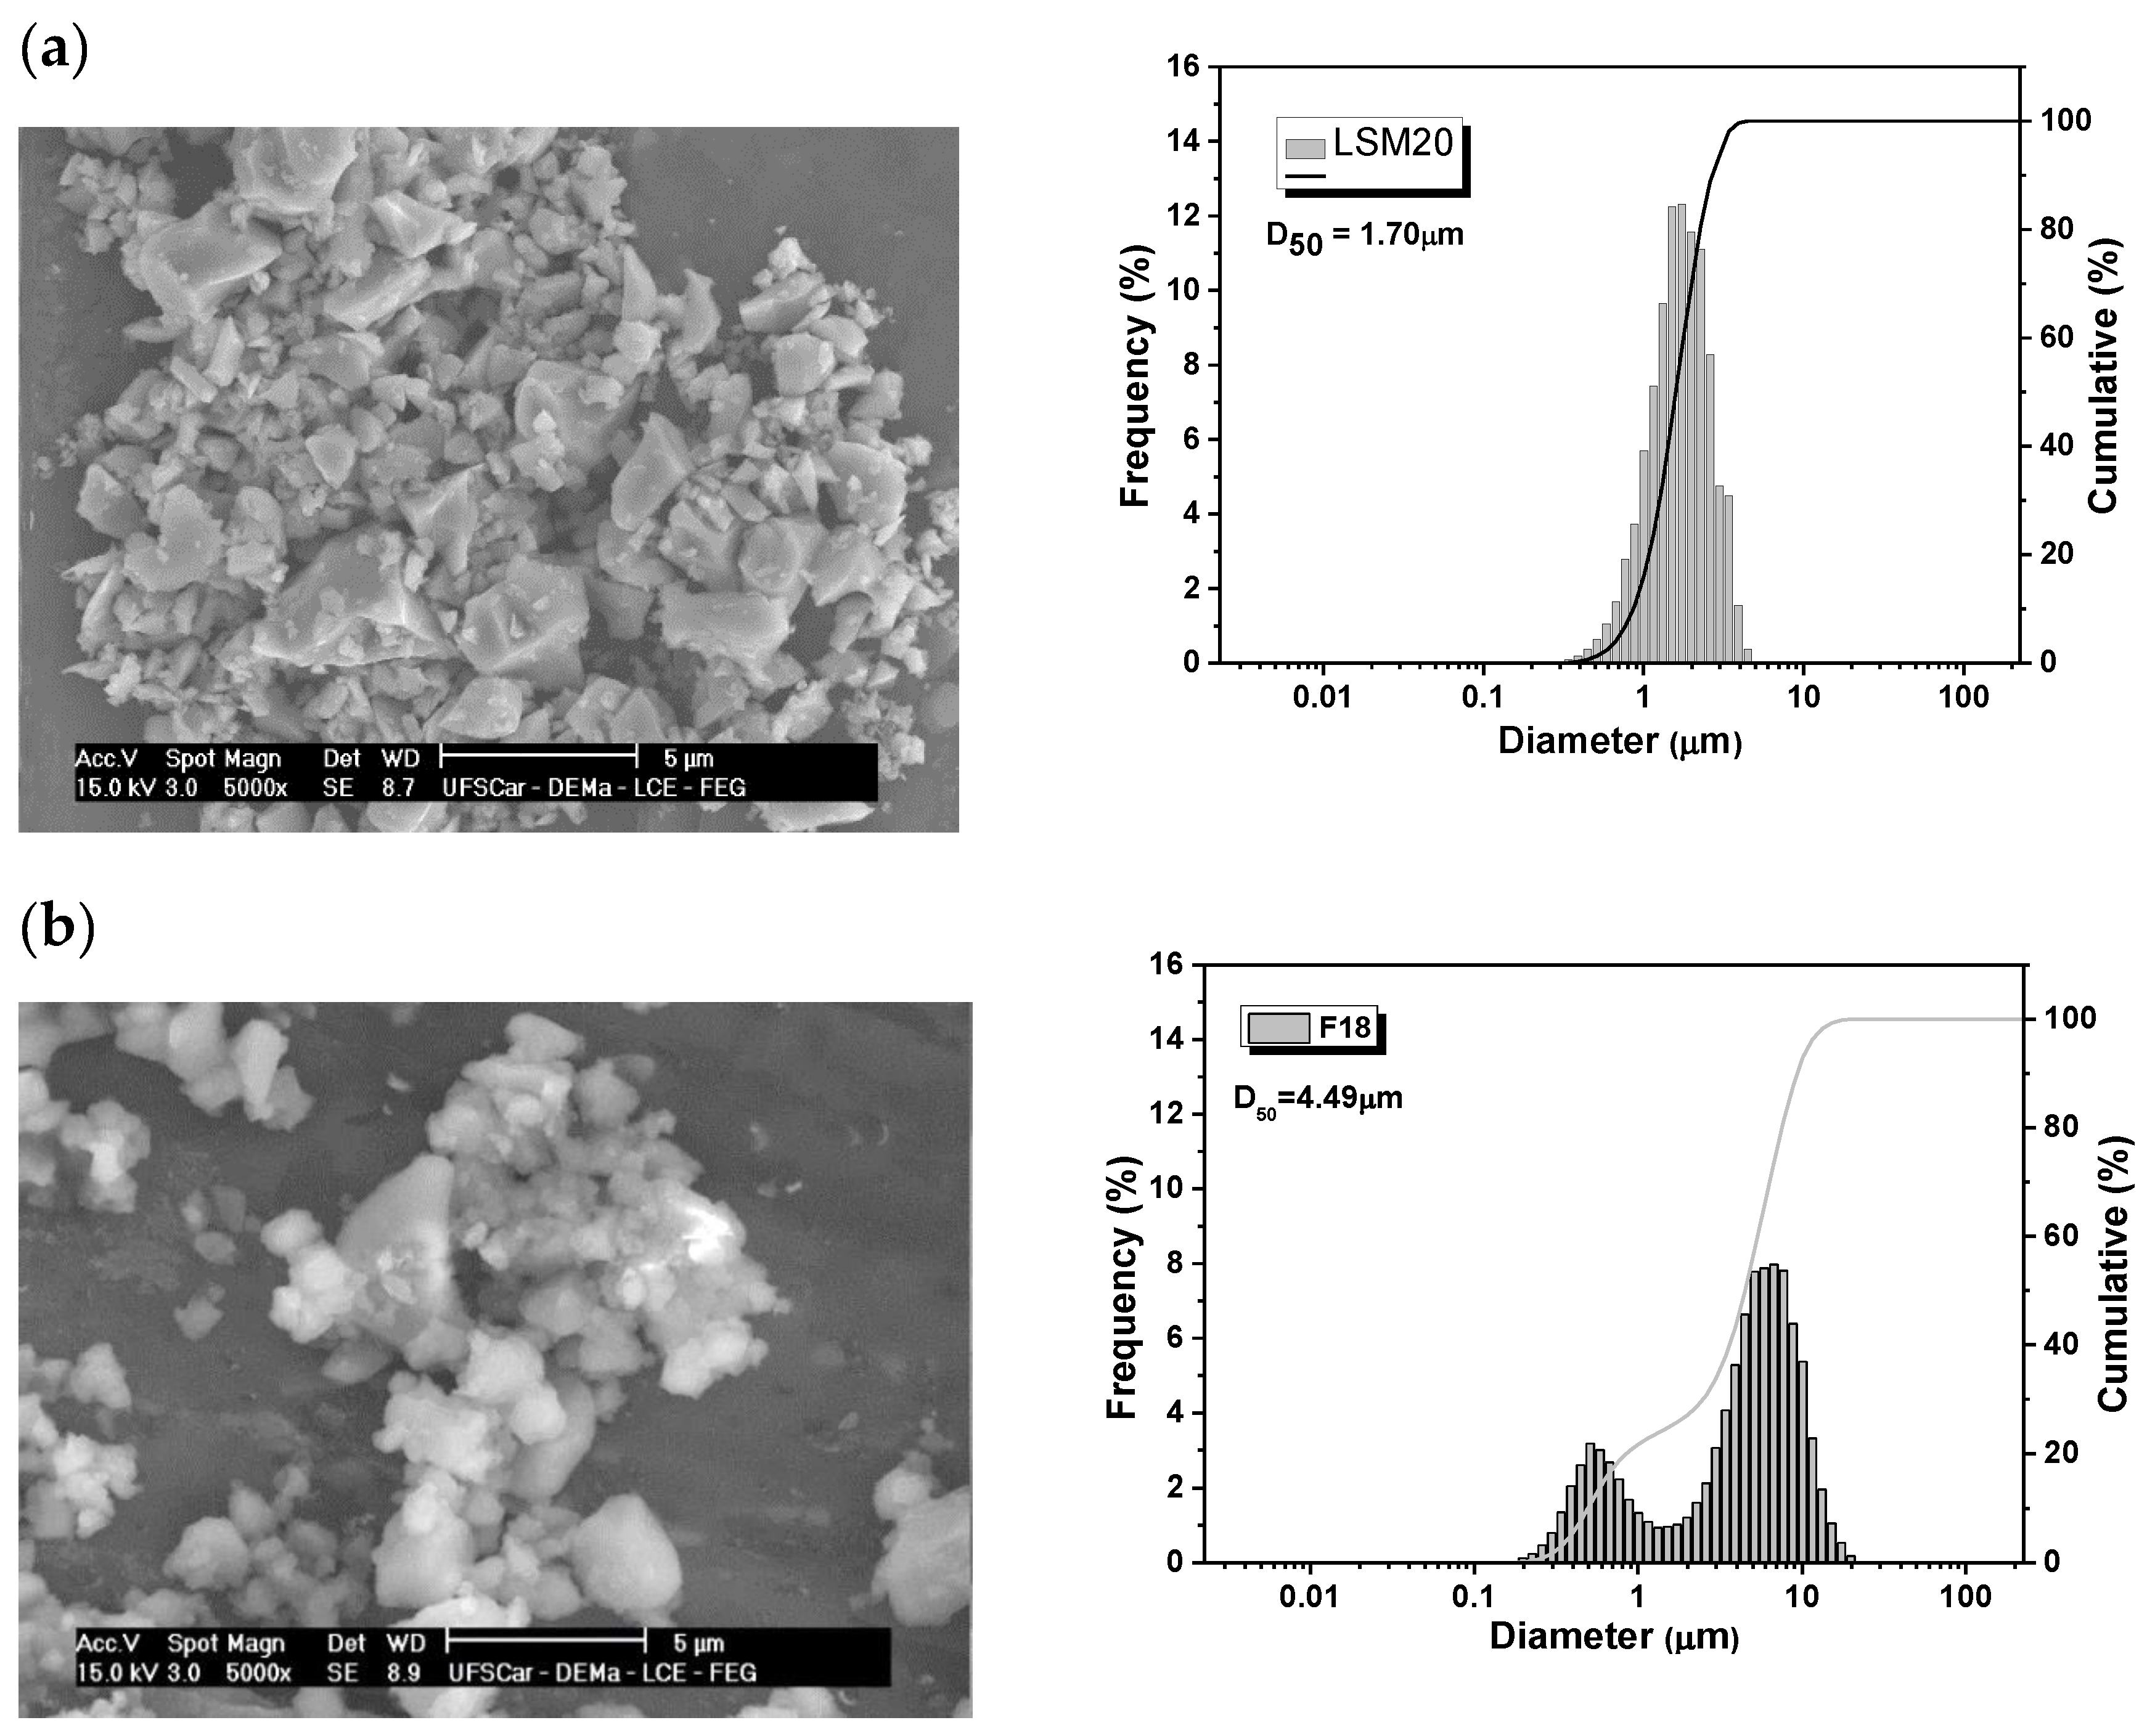
3.2. XRD and SEM
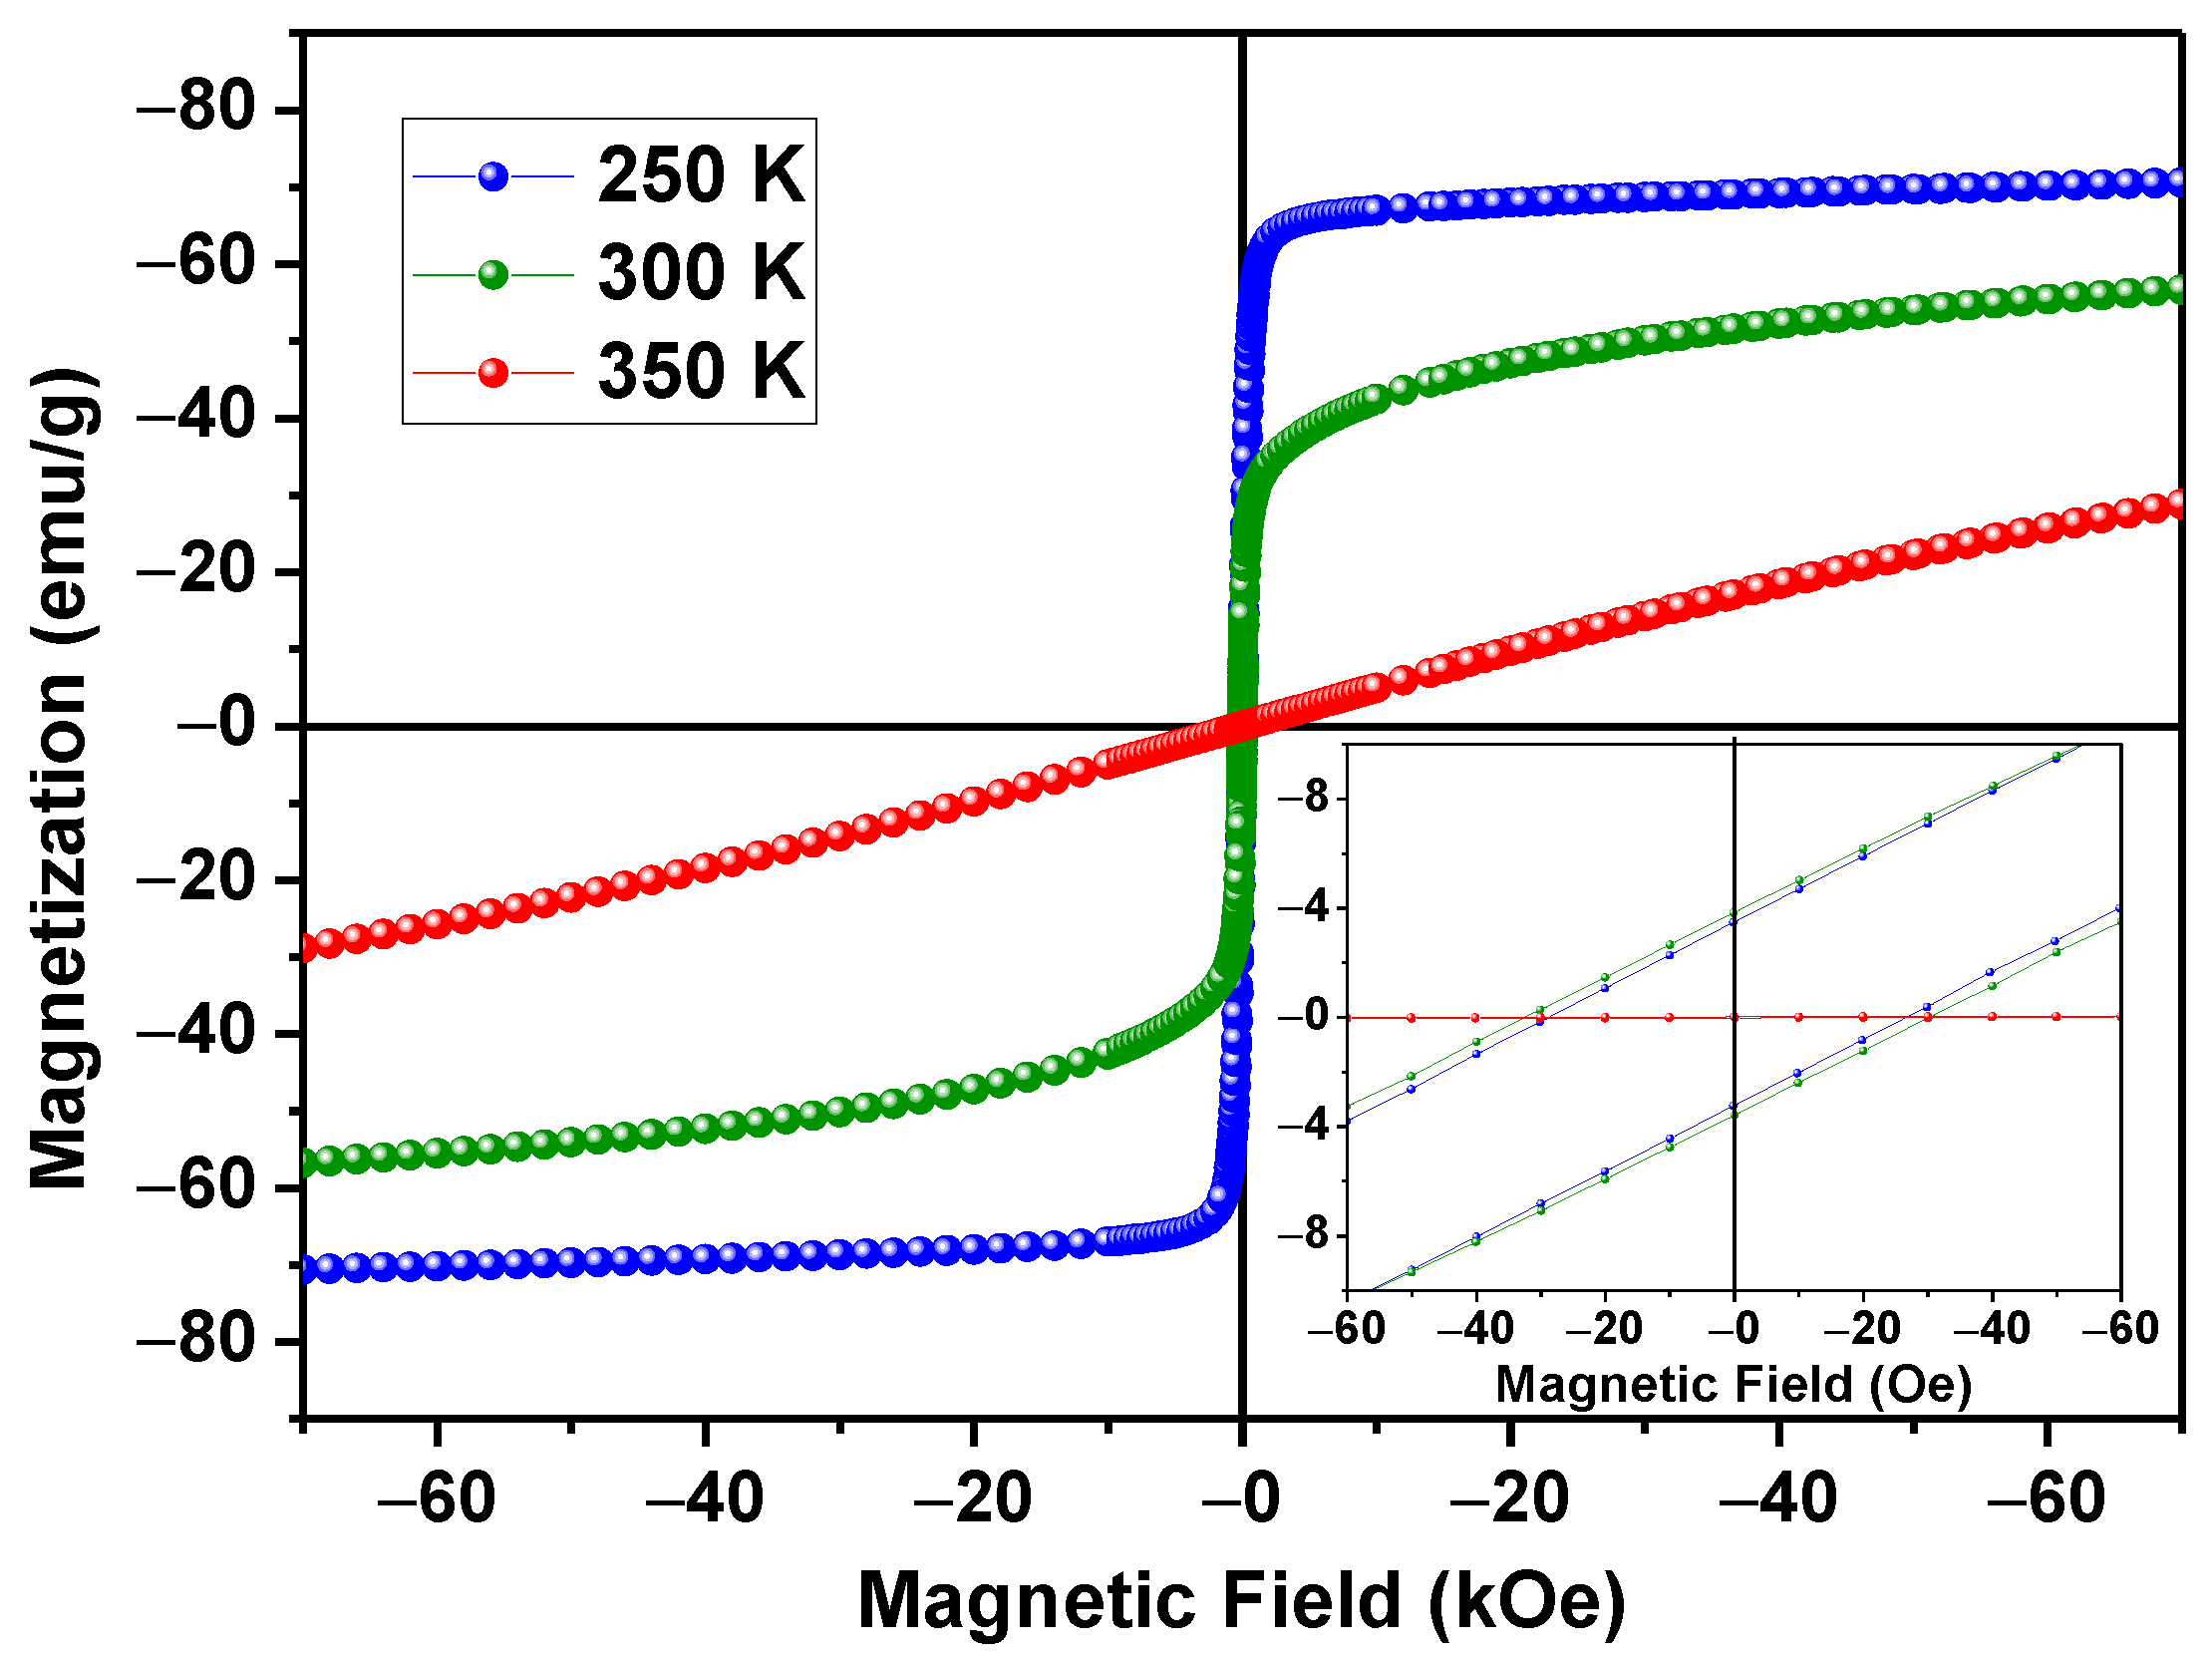
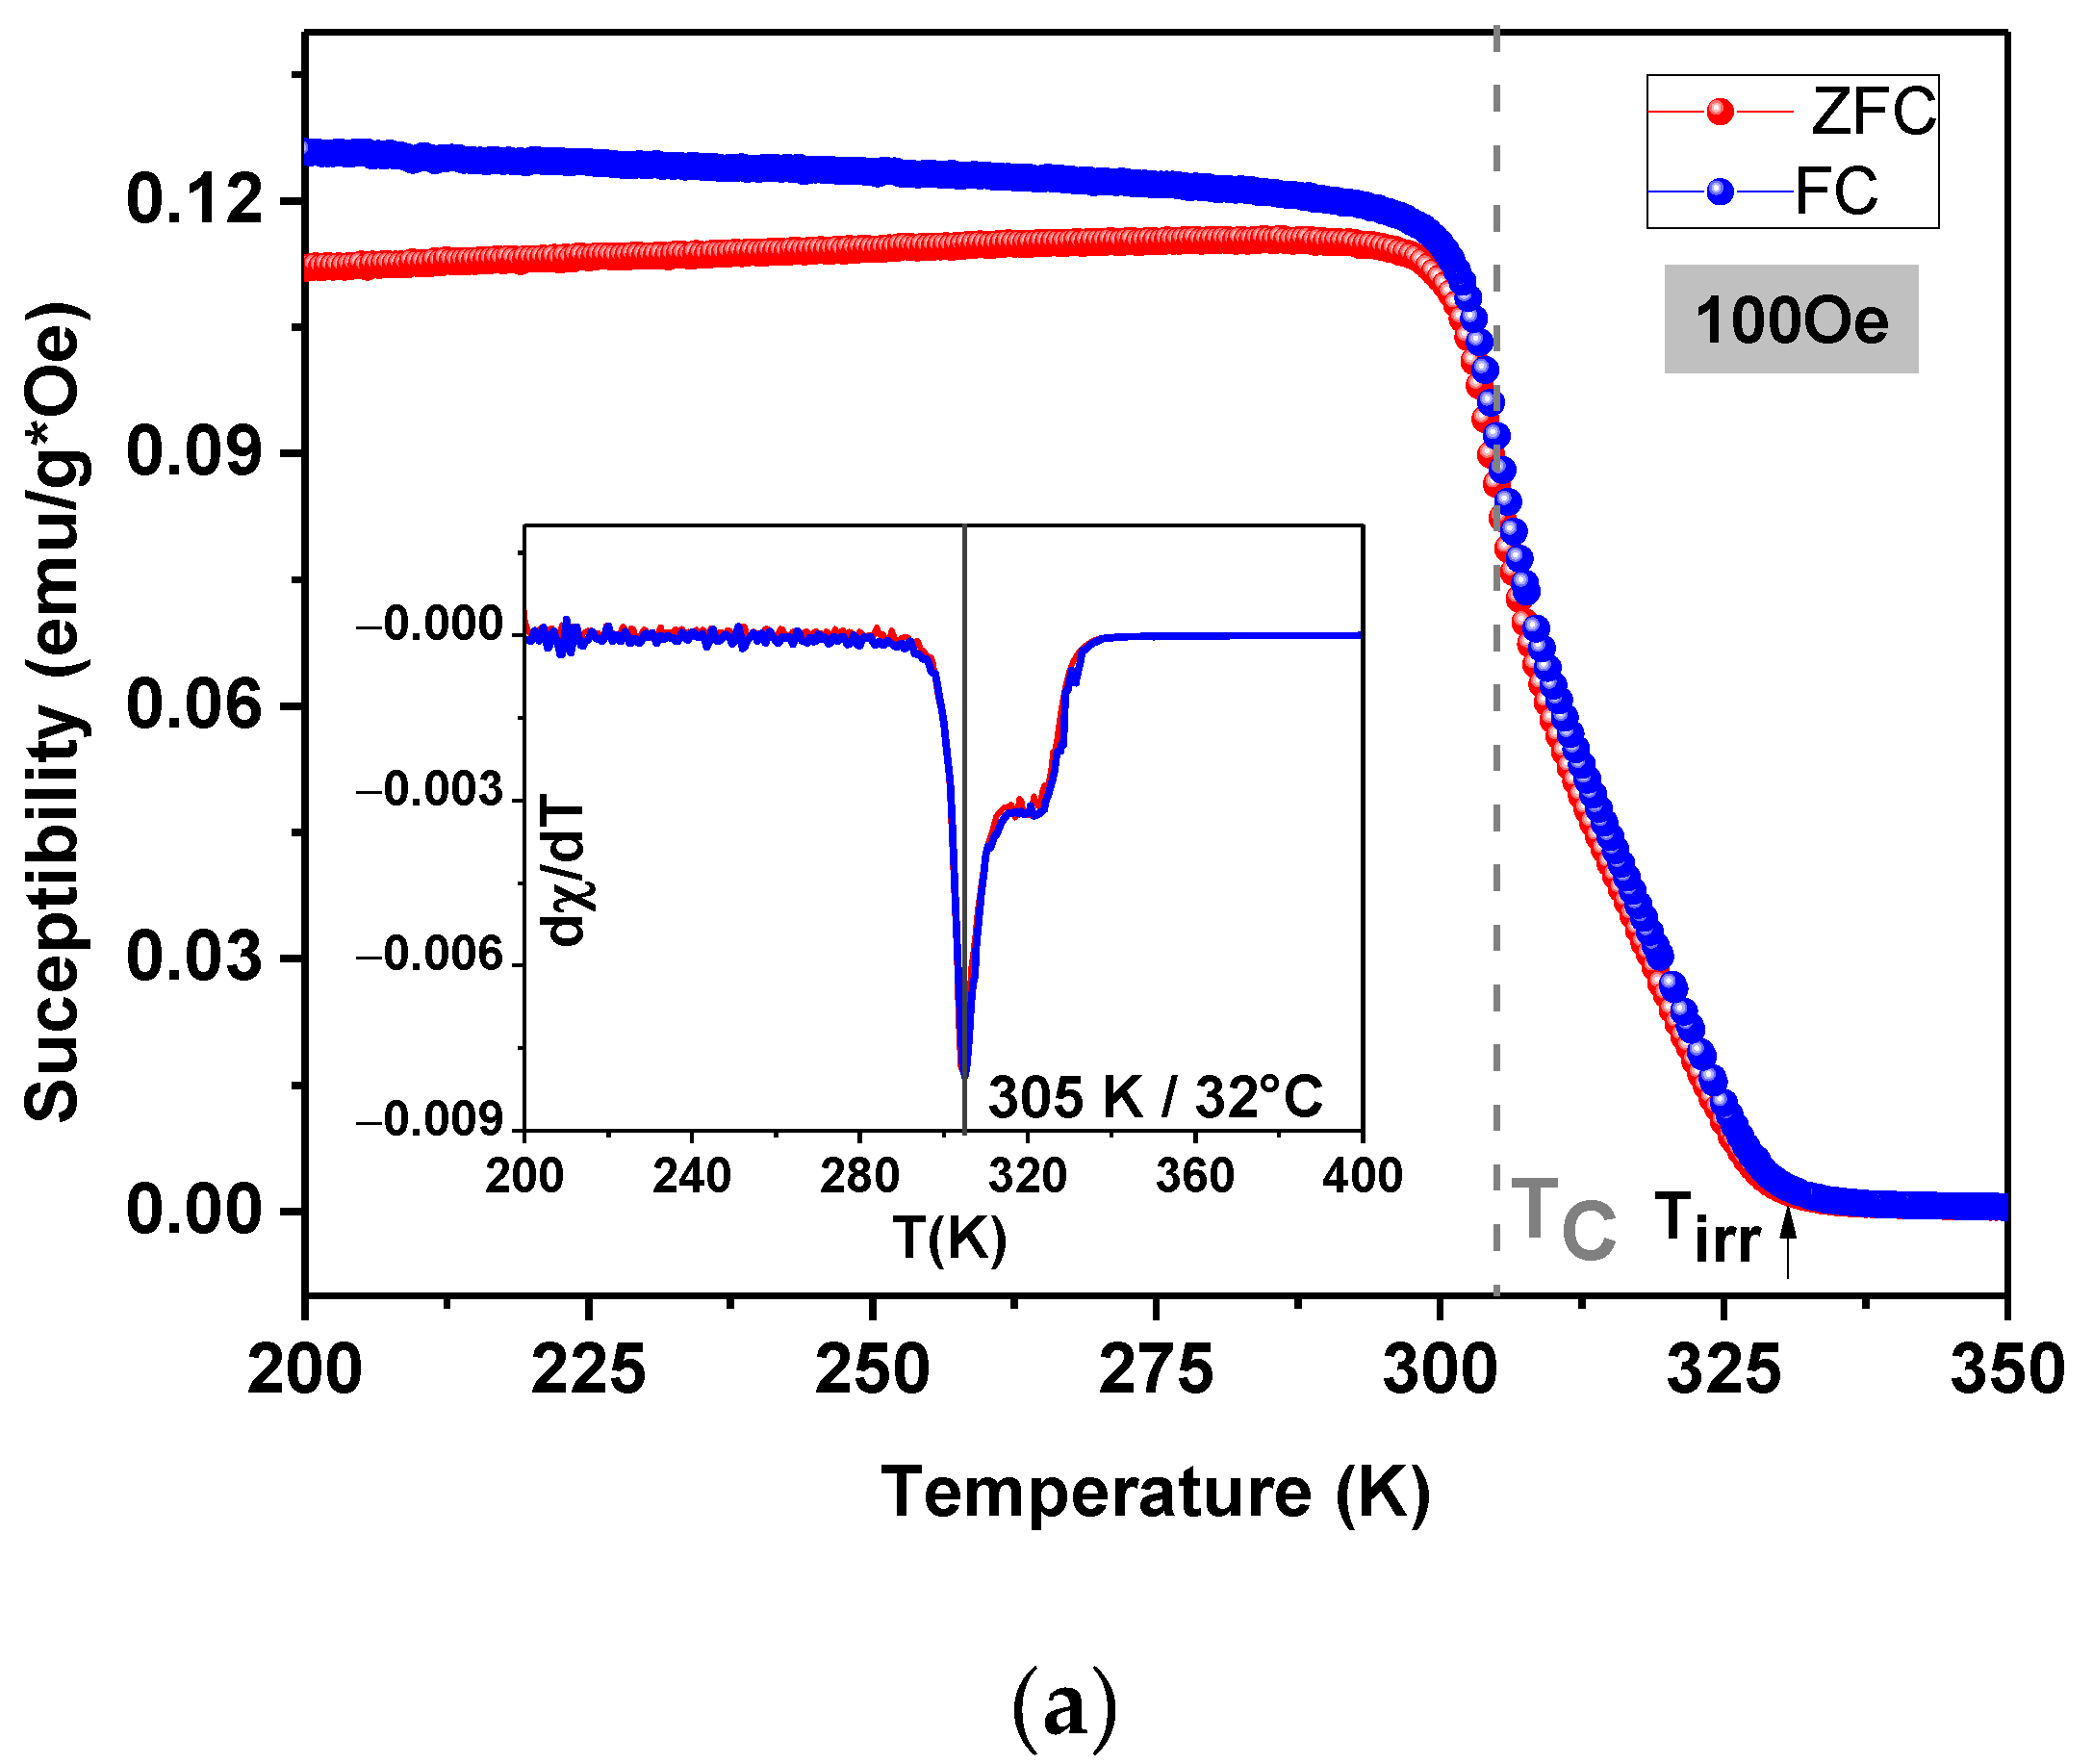
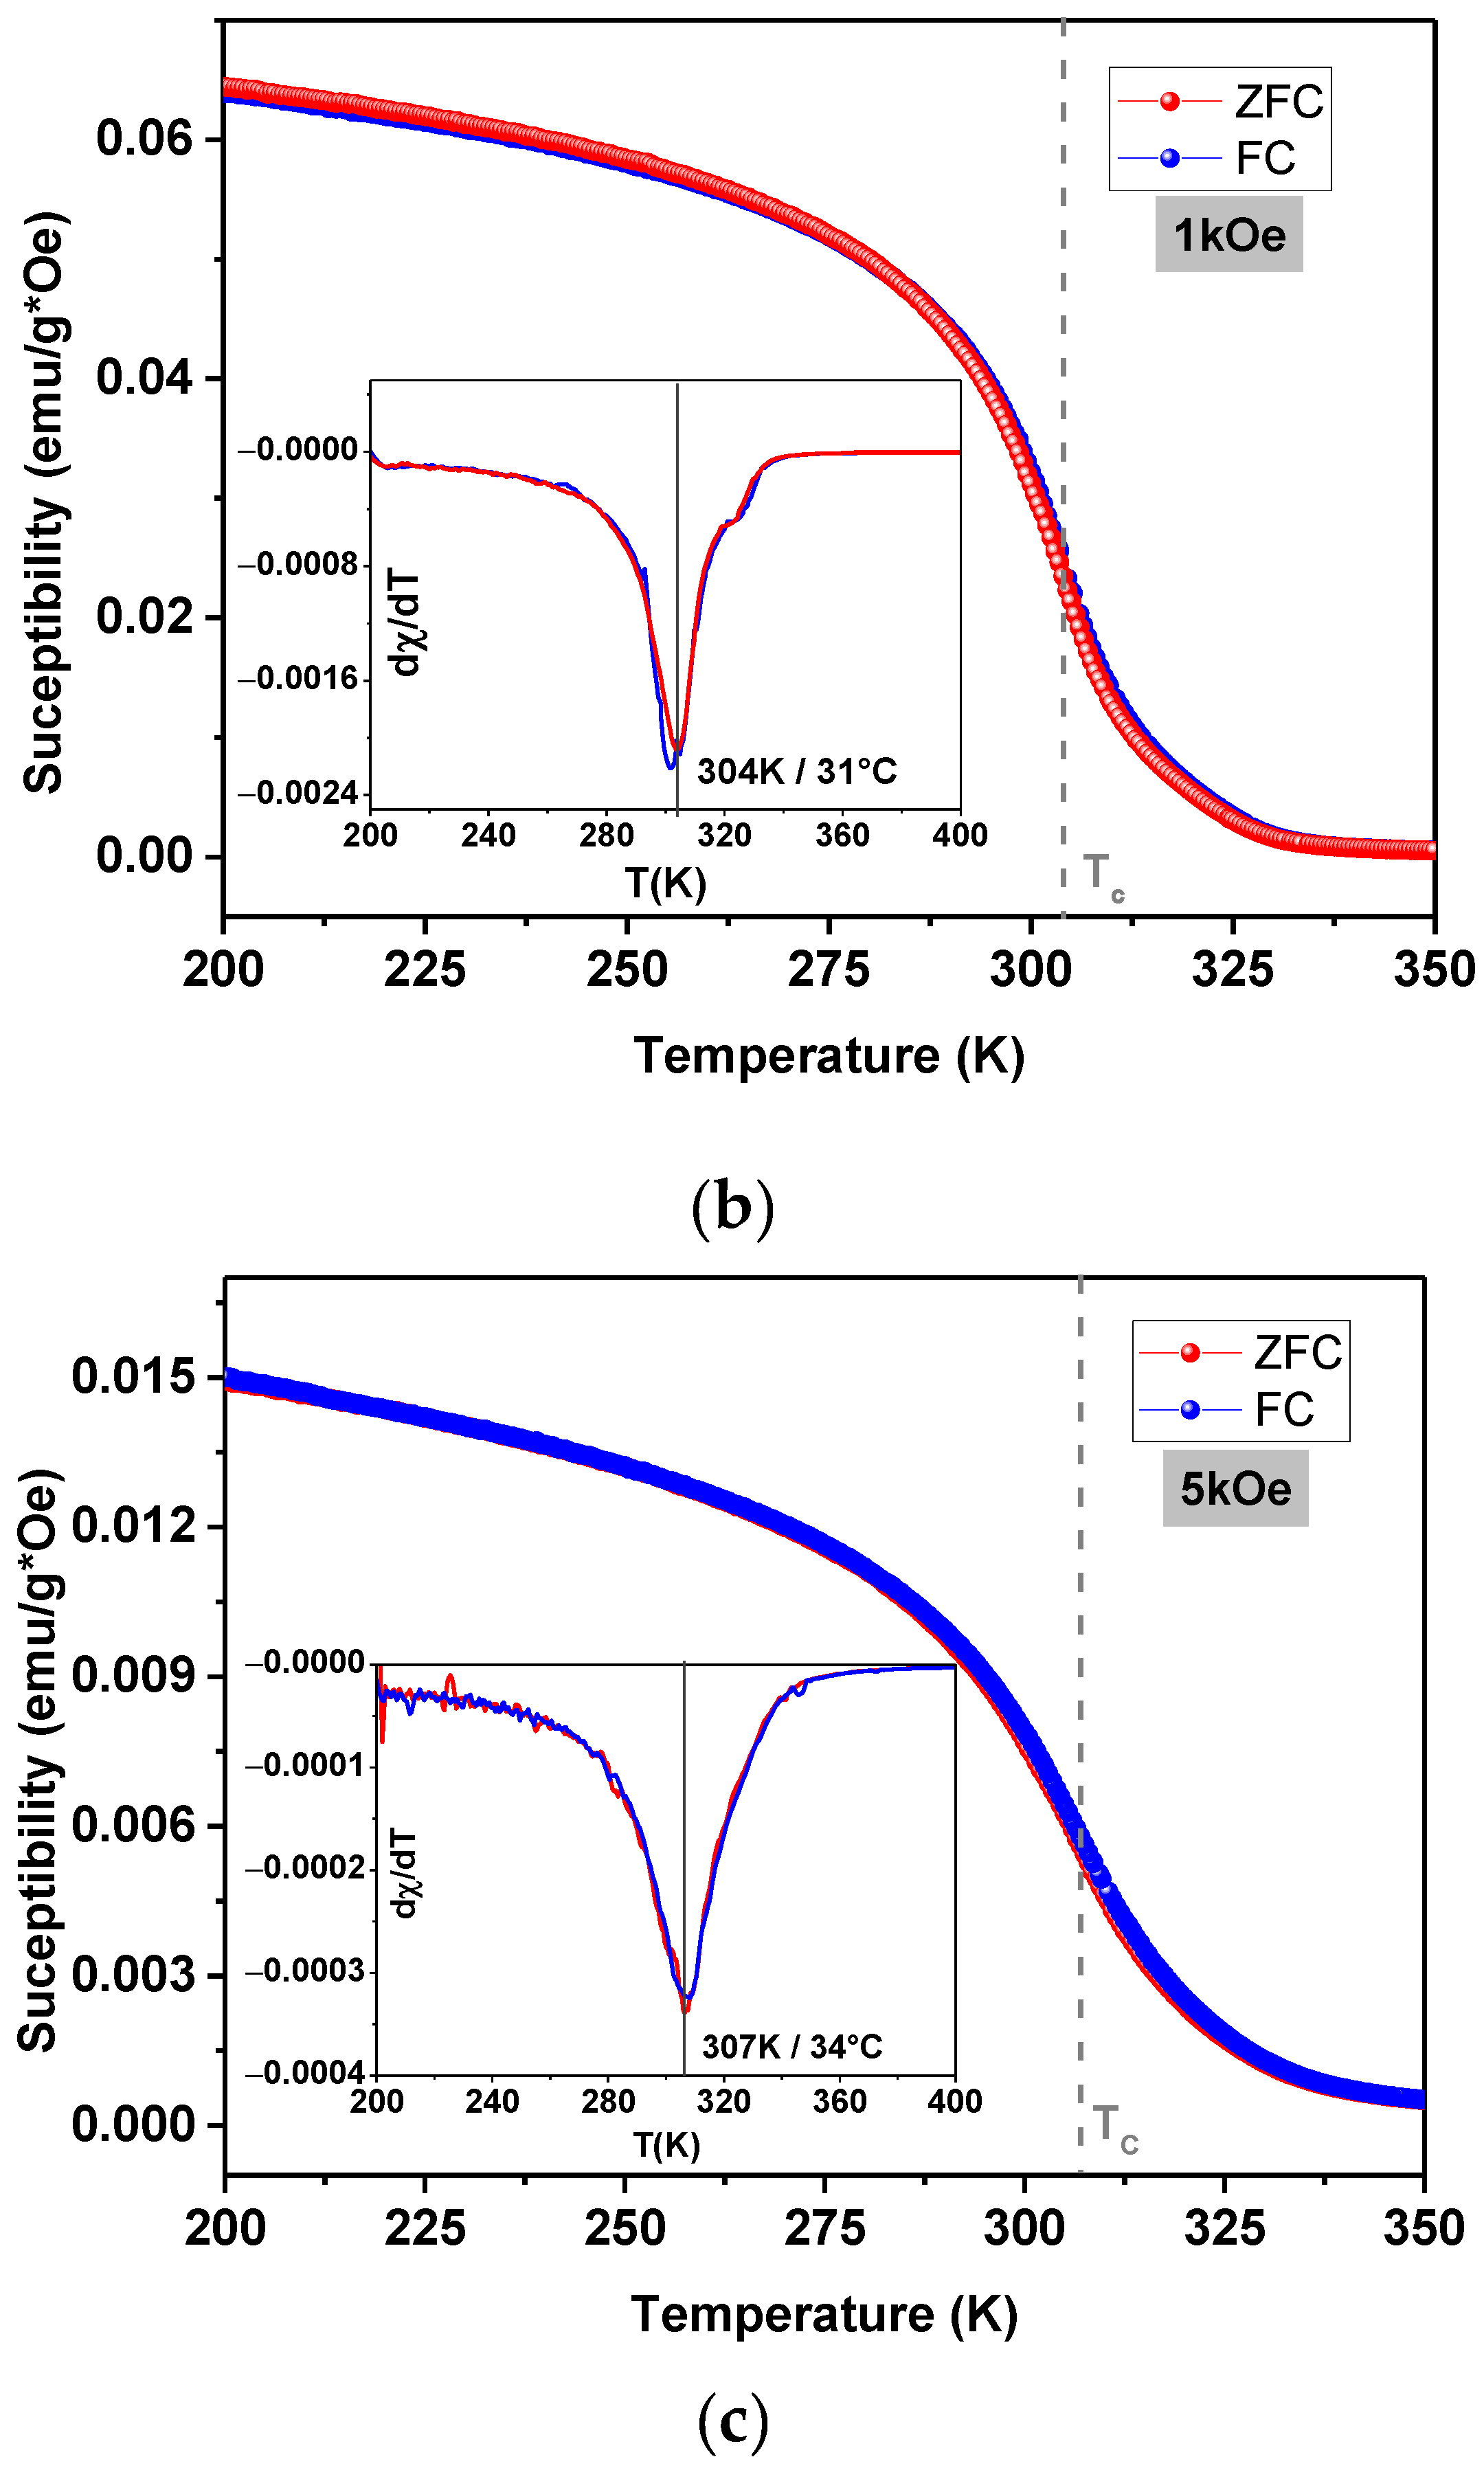
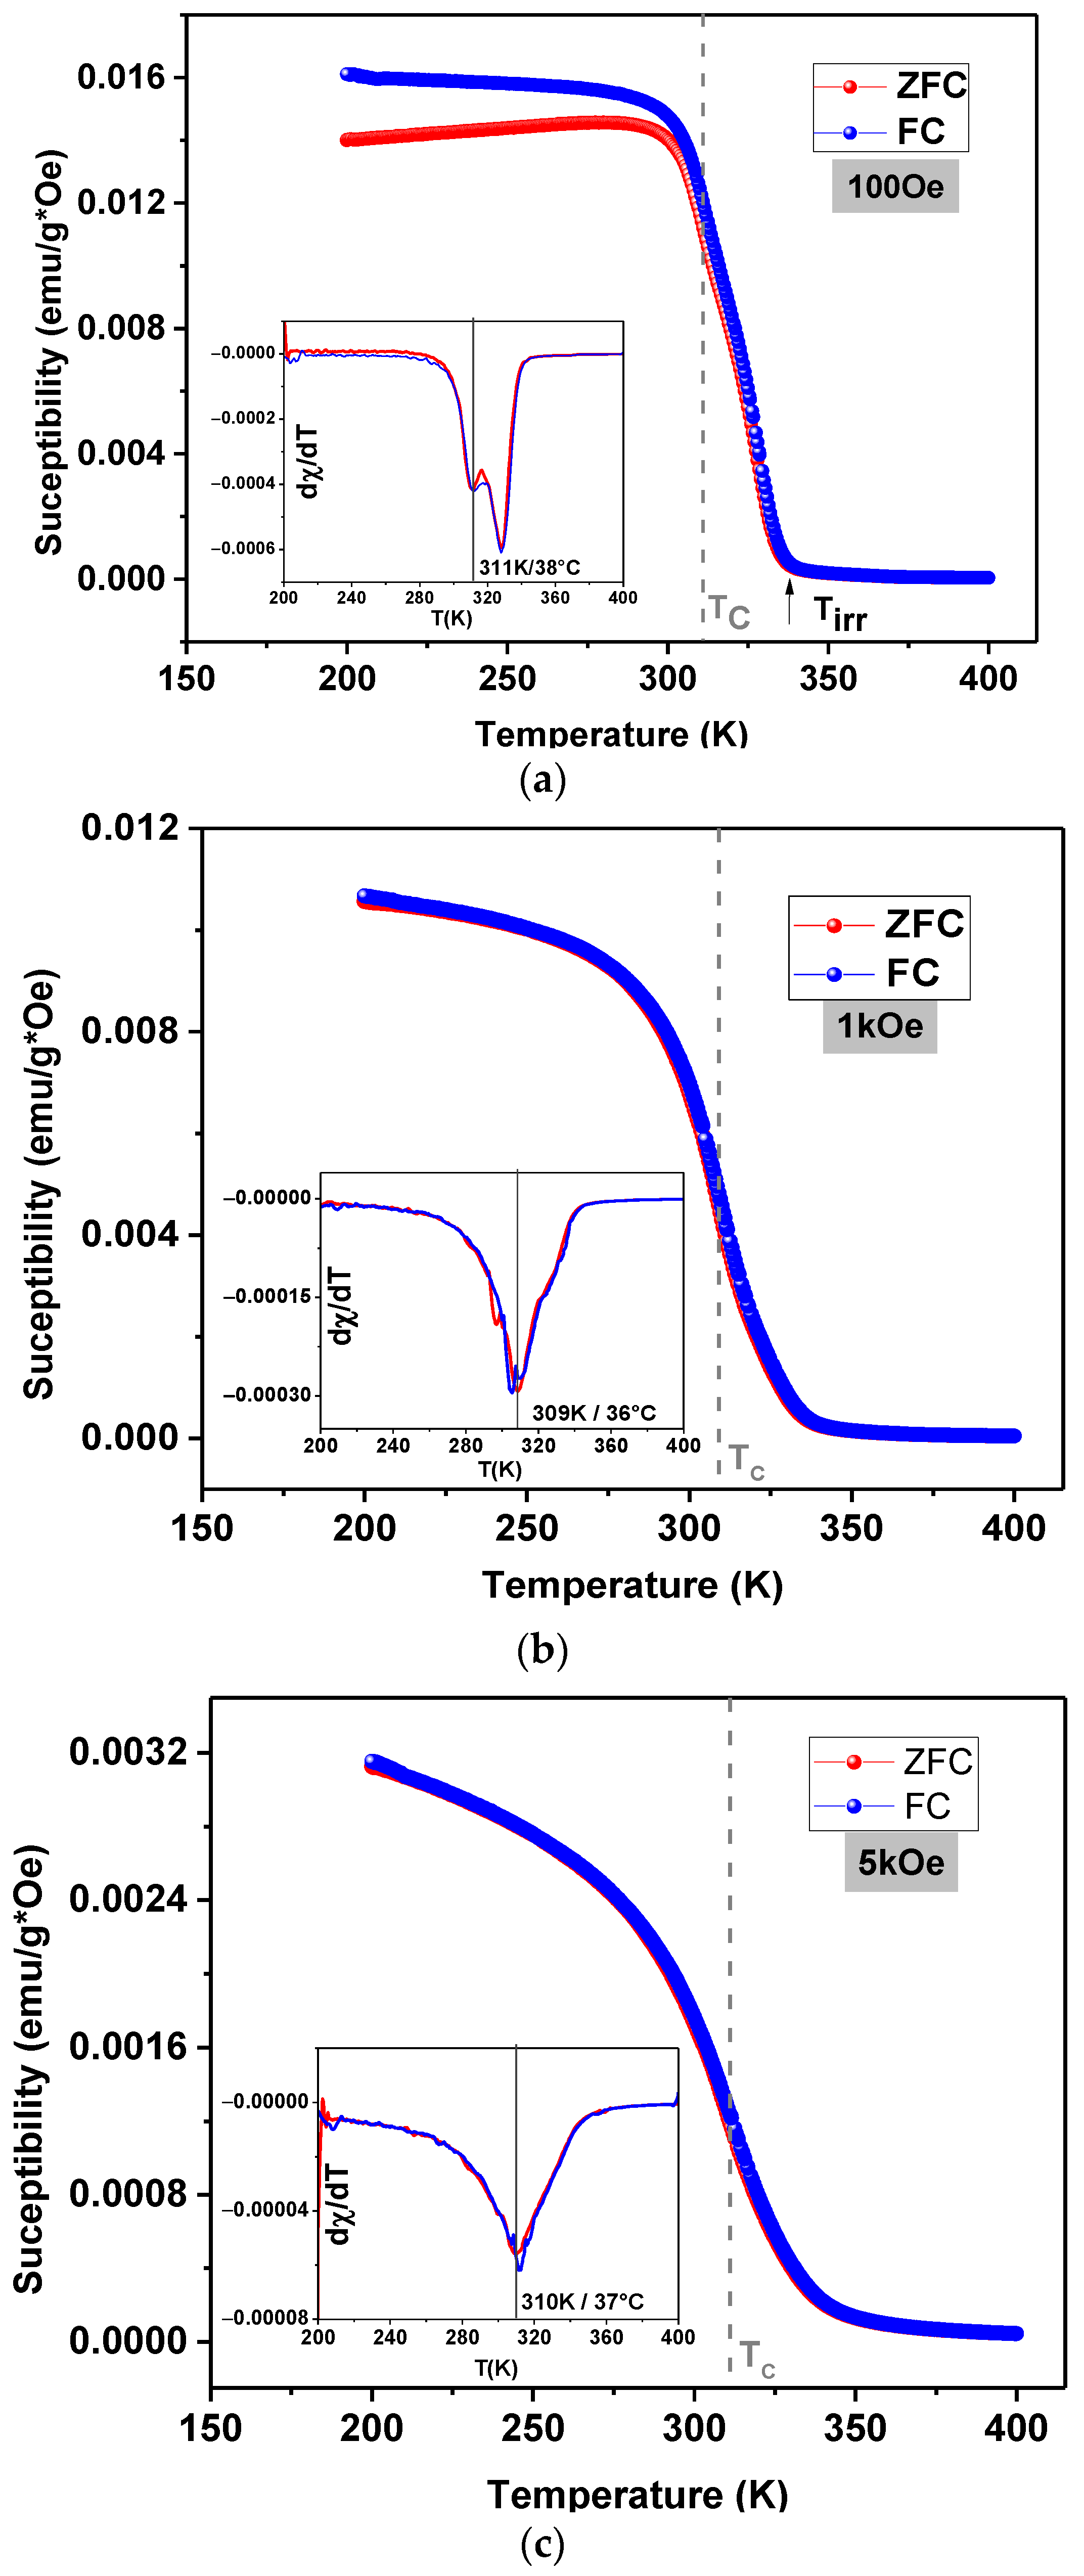
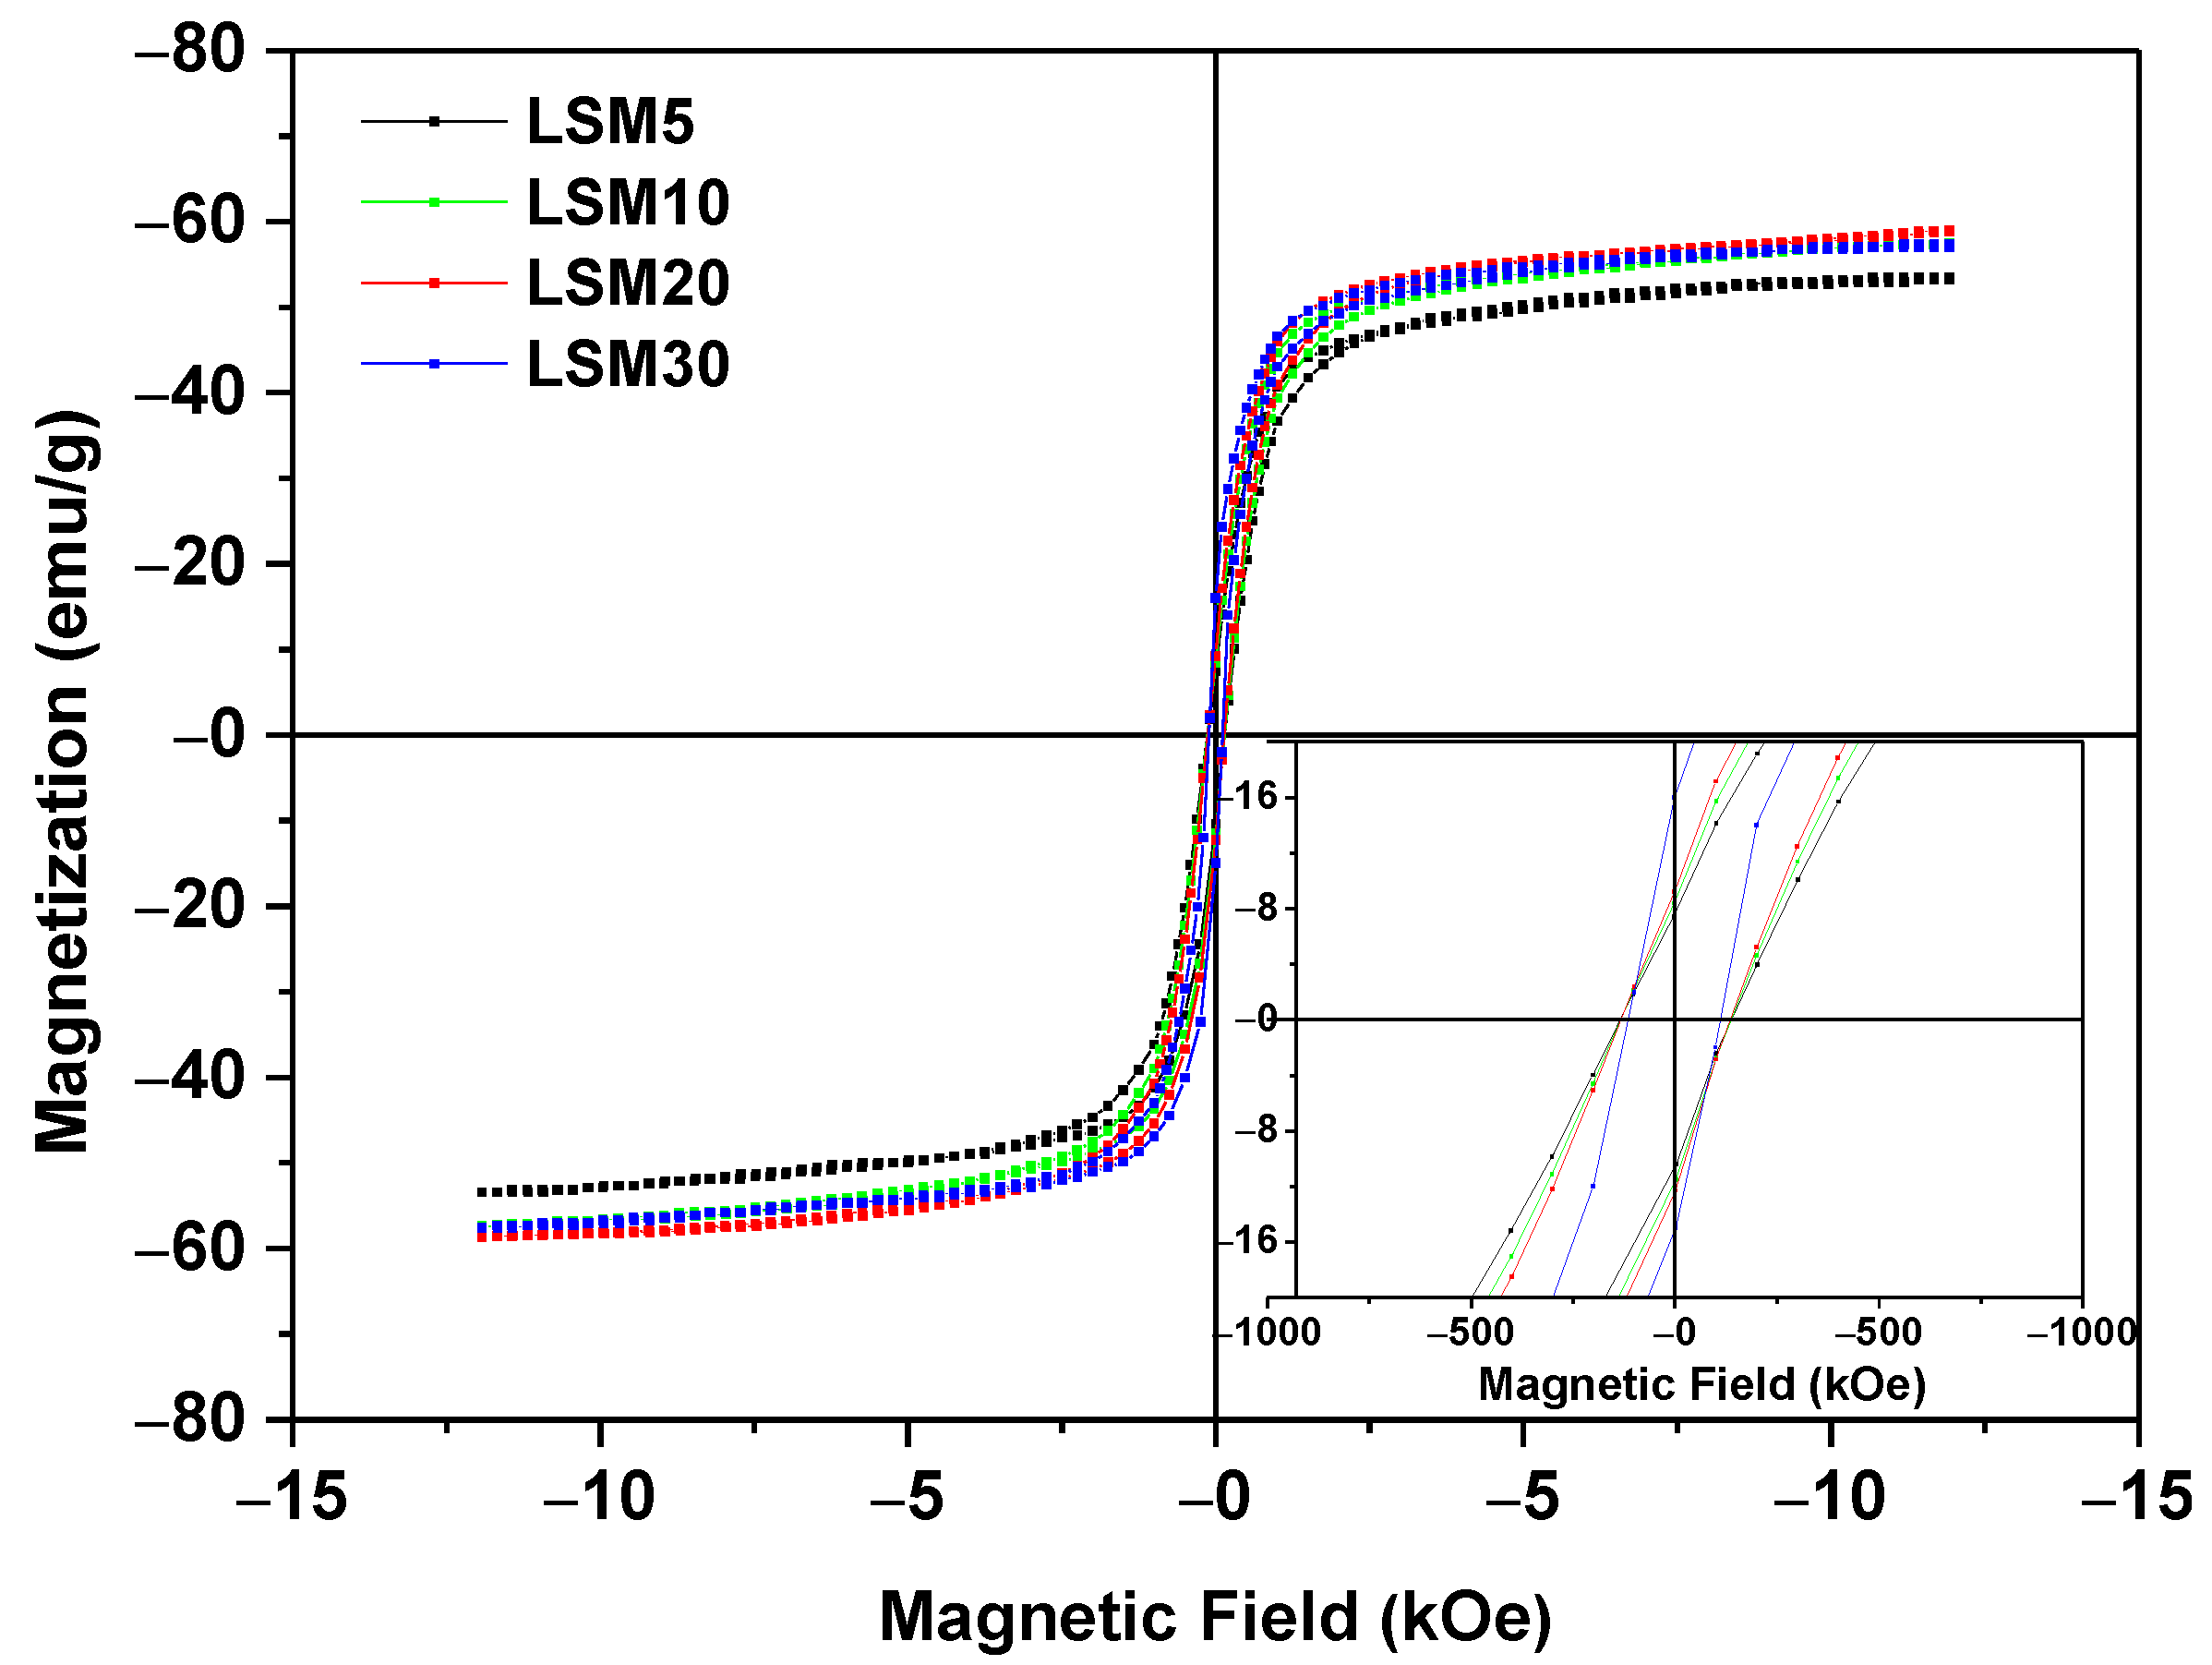
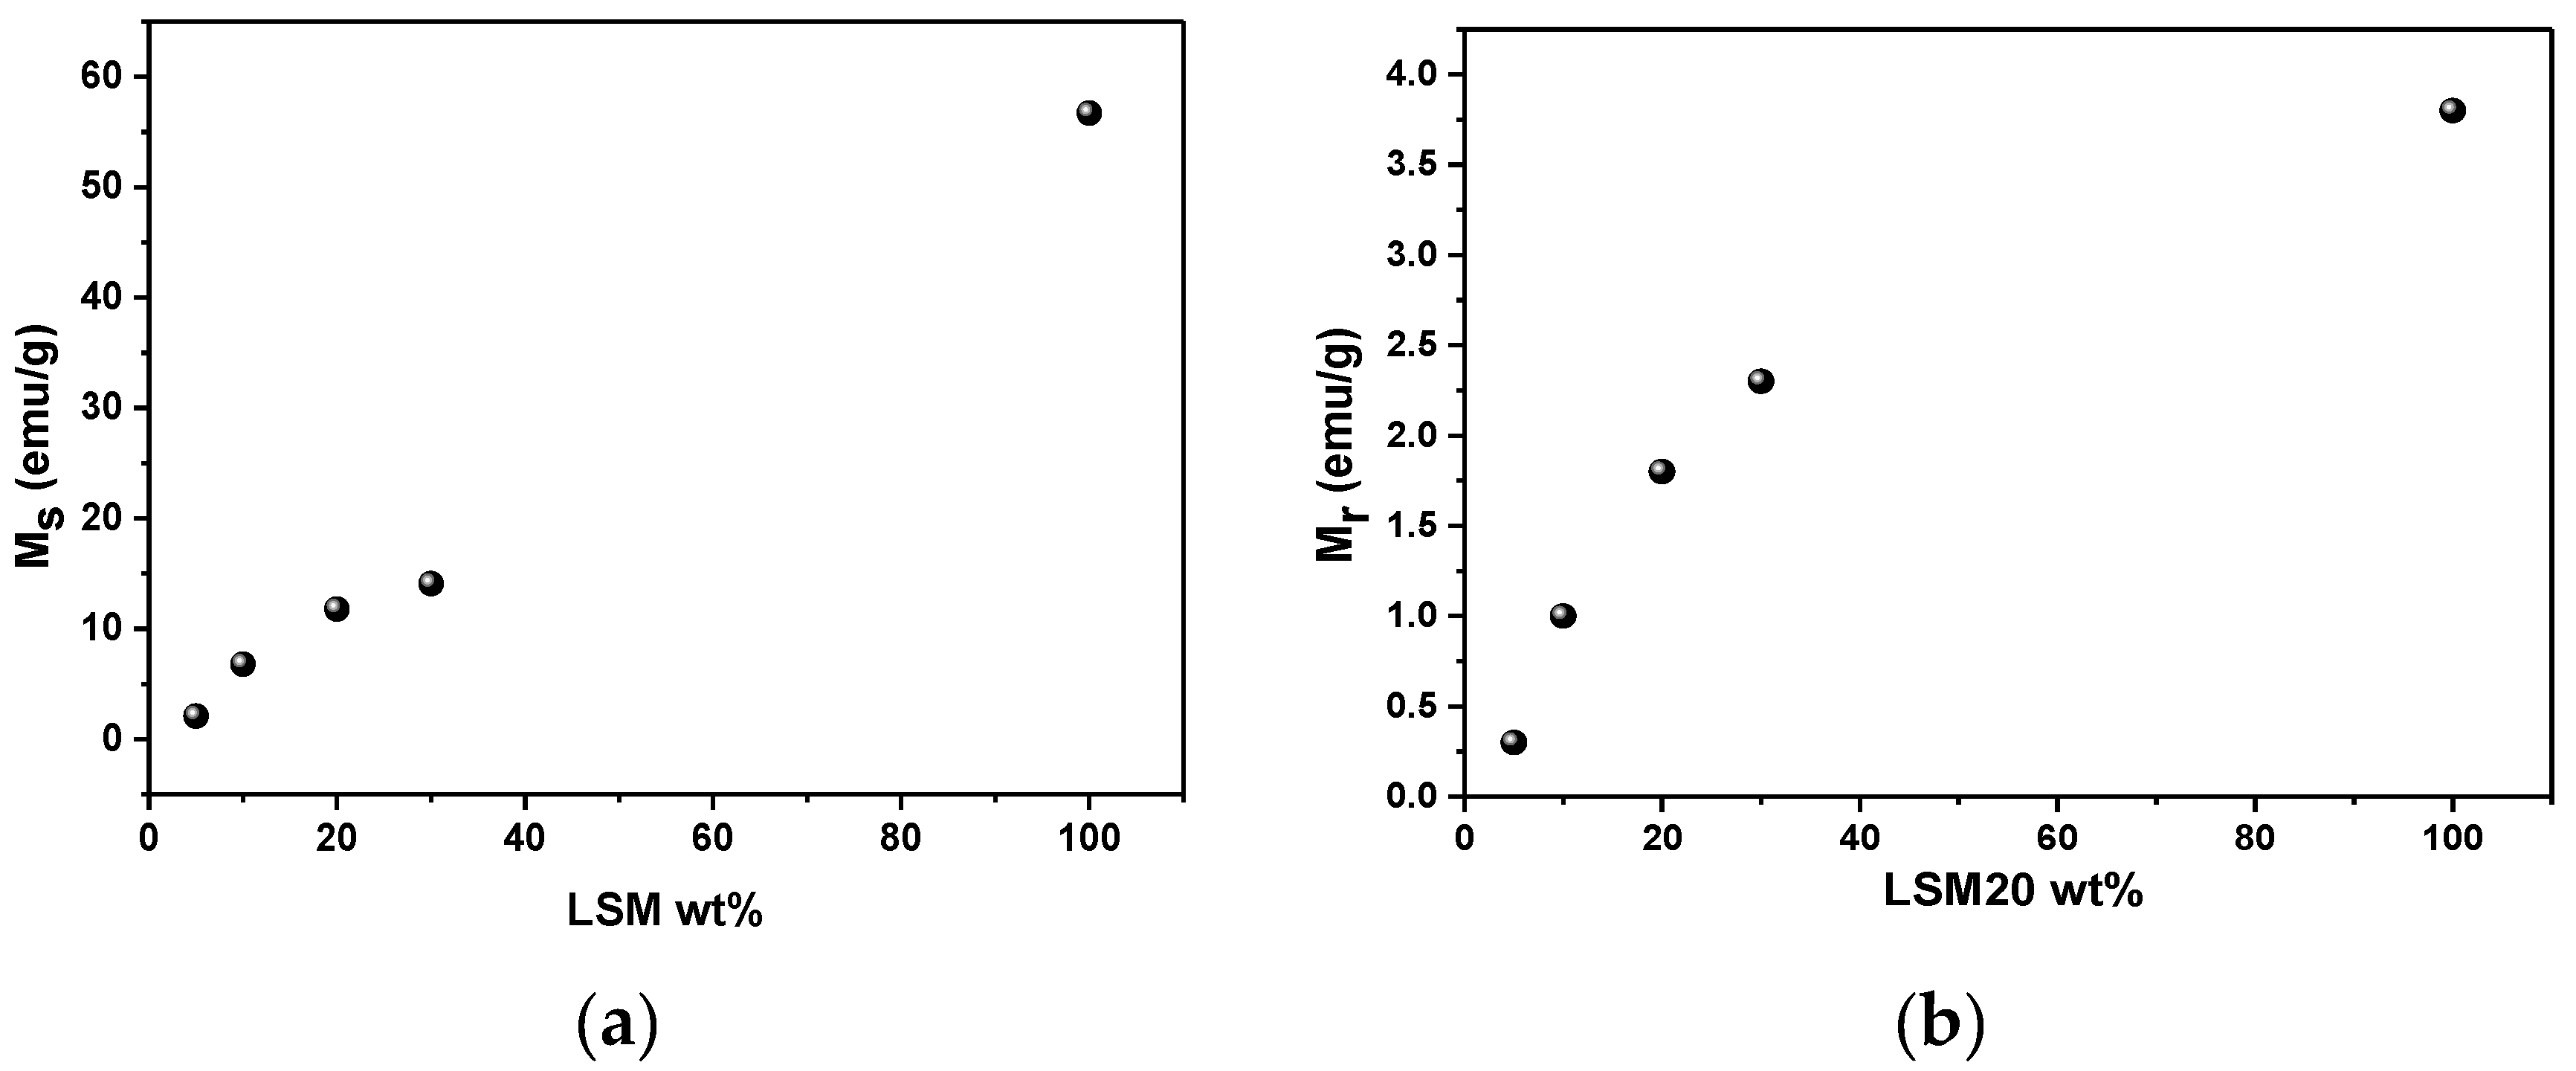
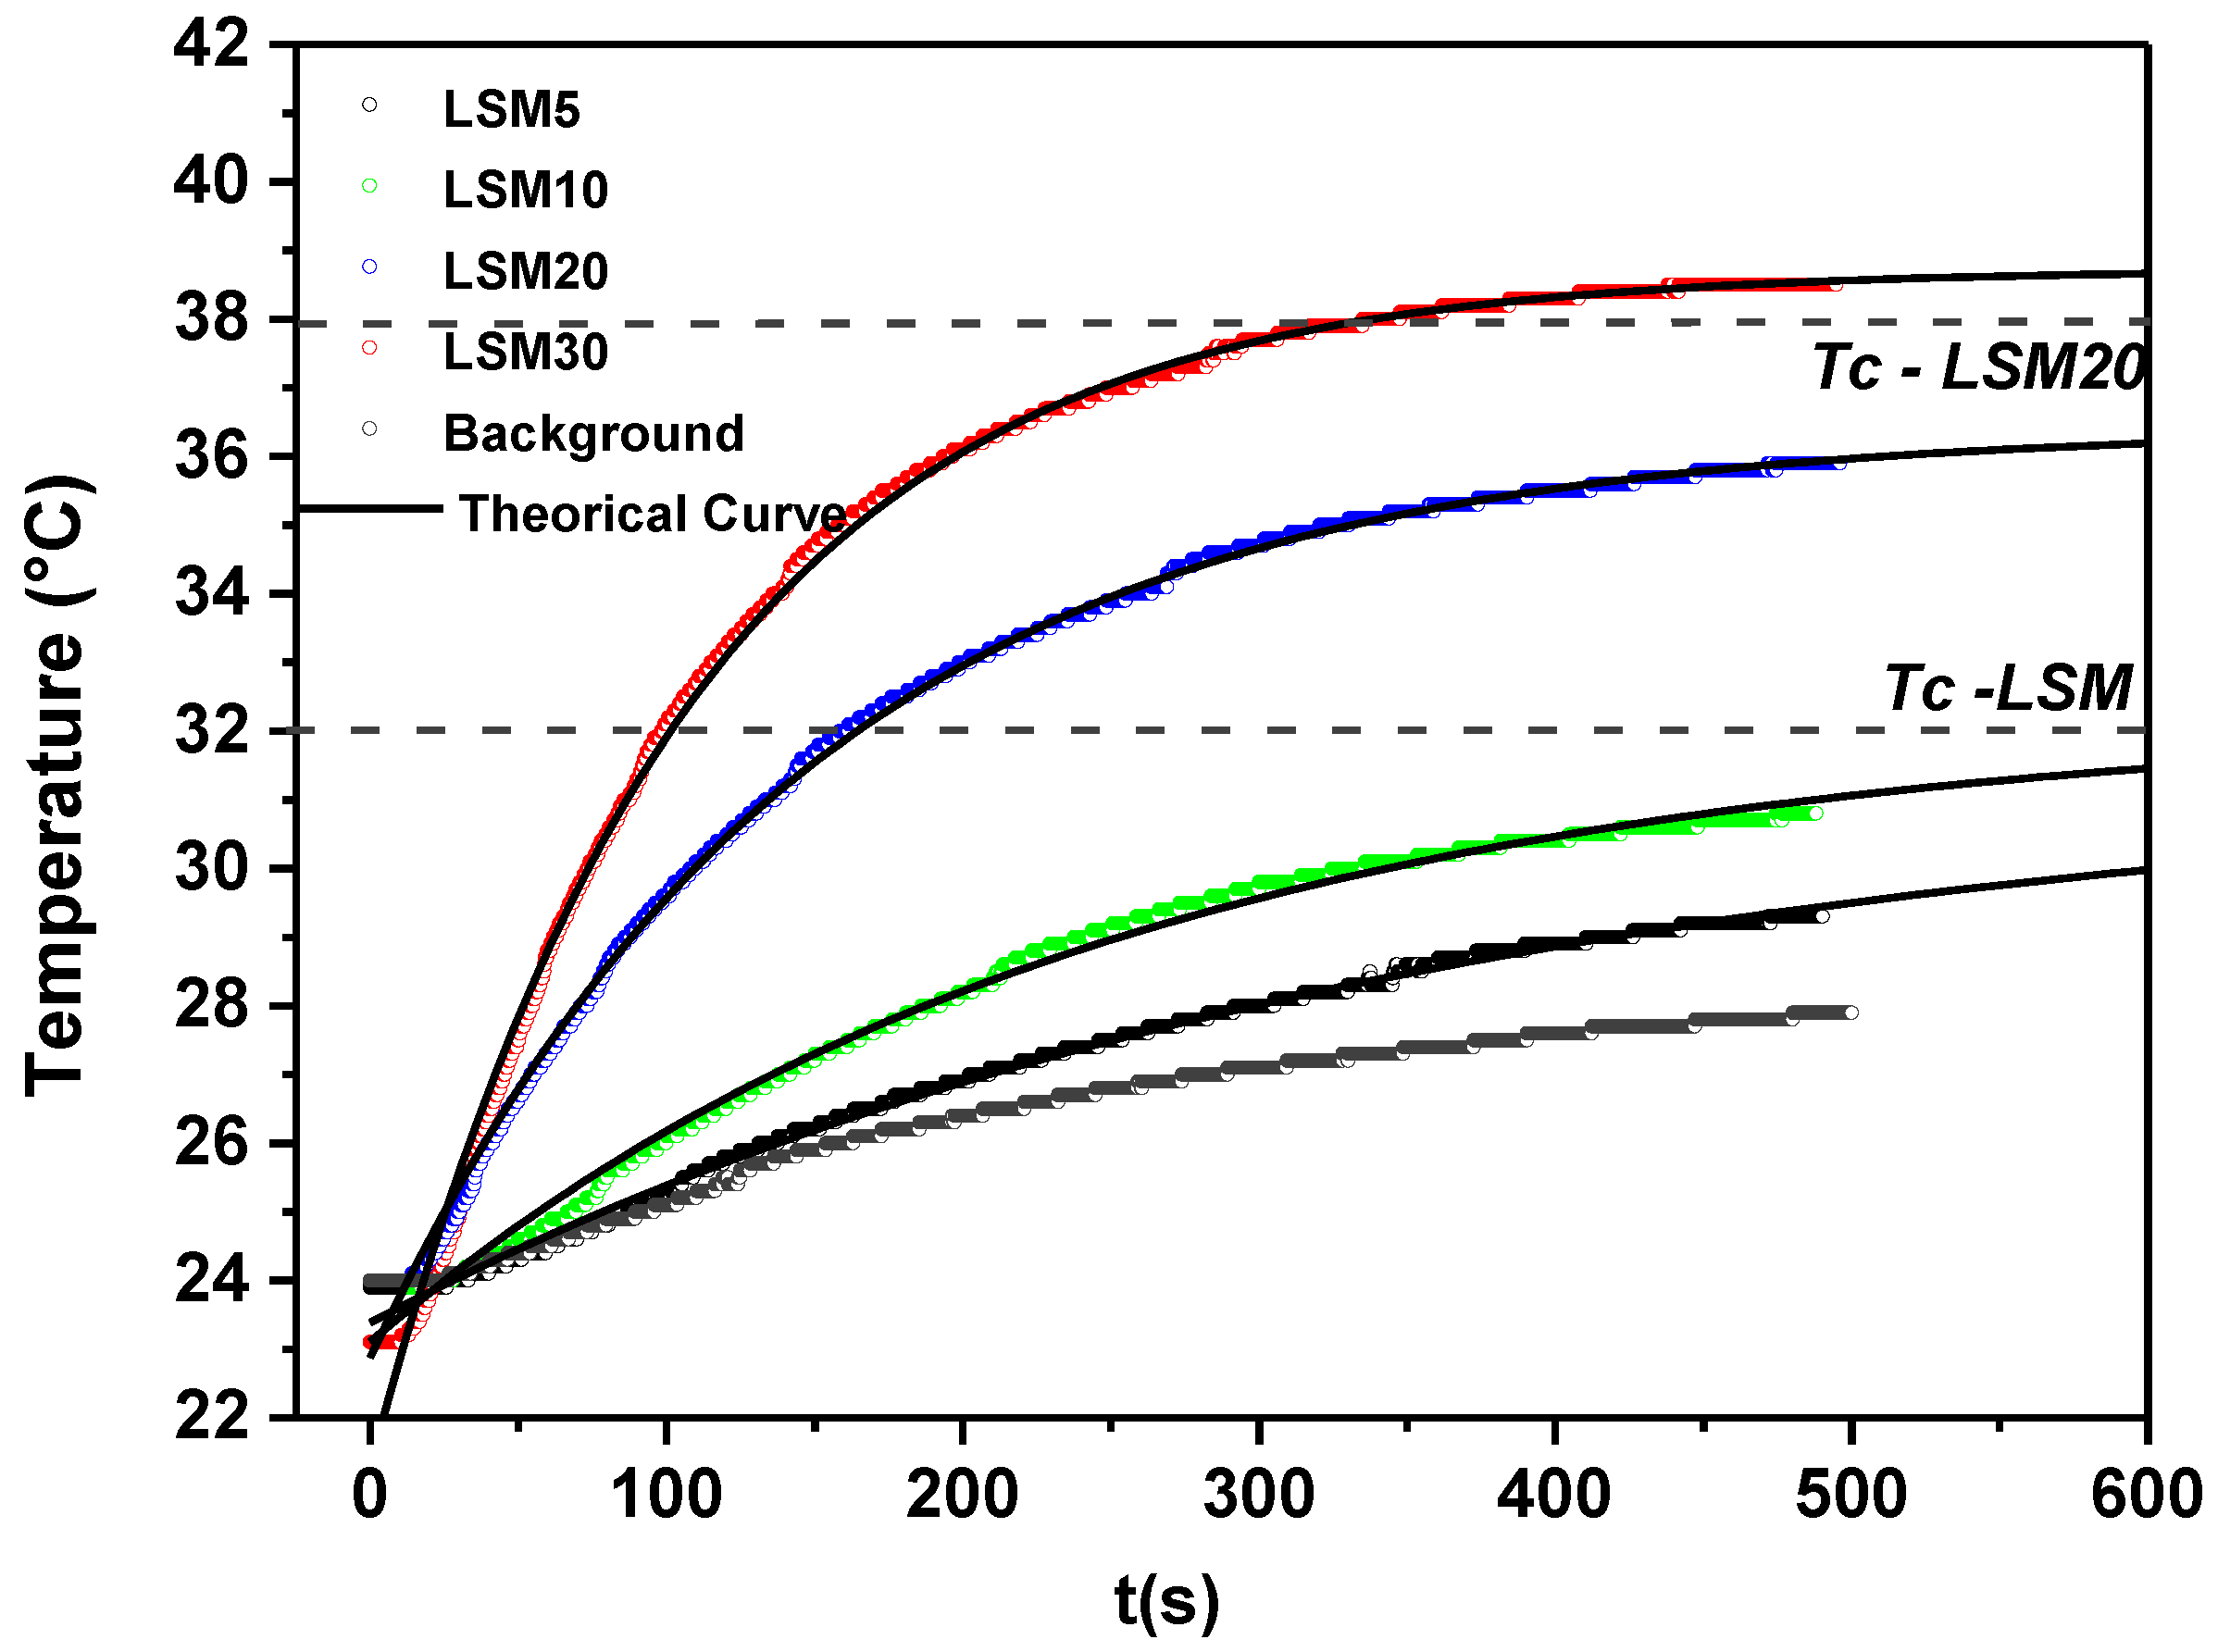
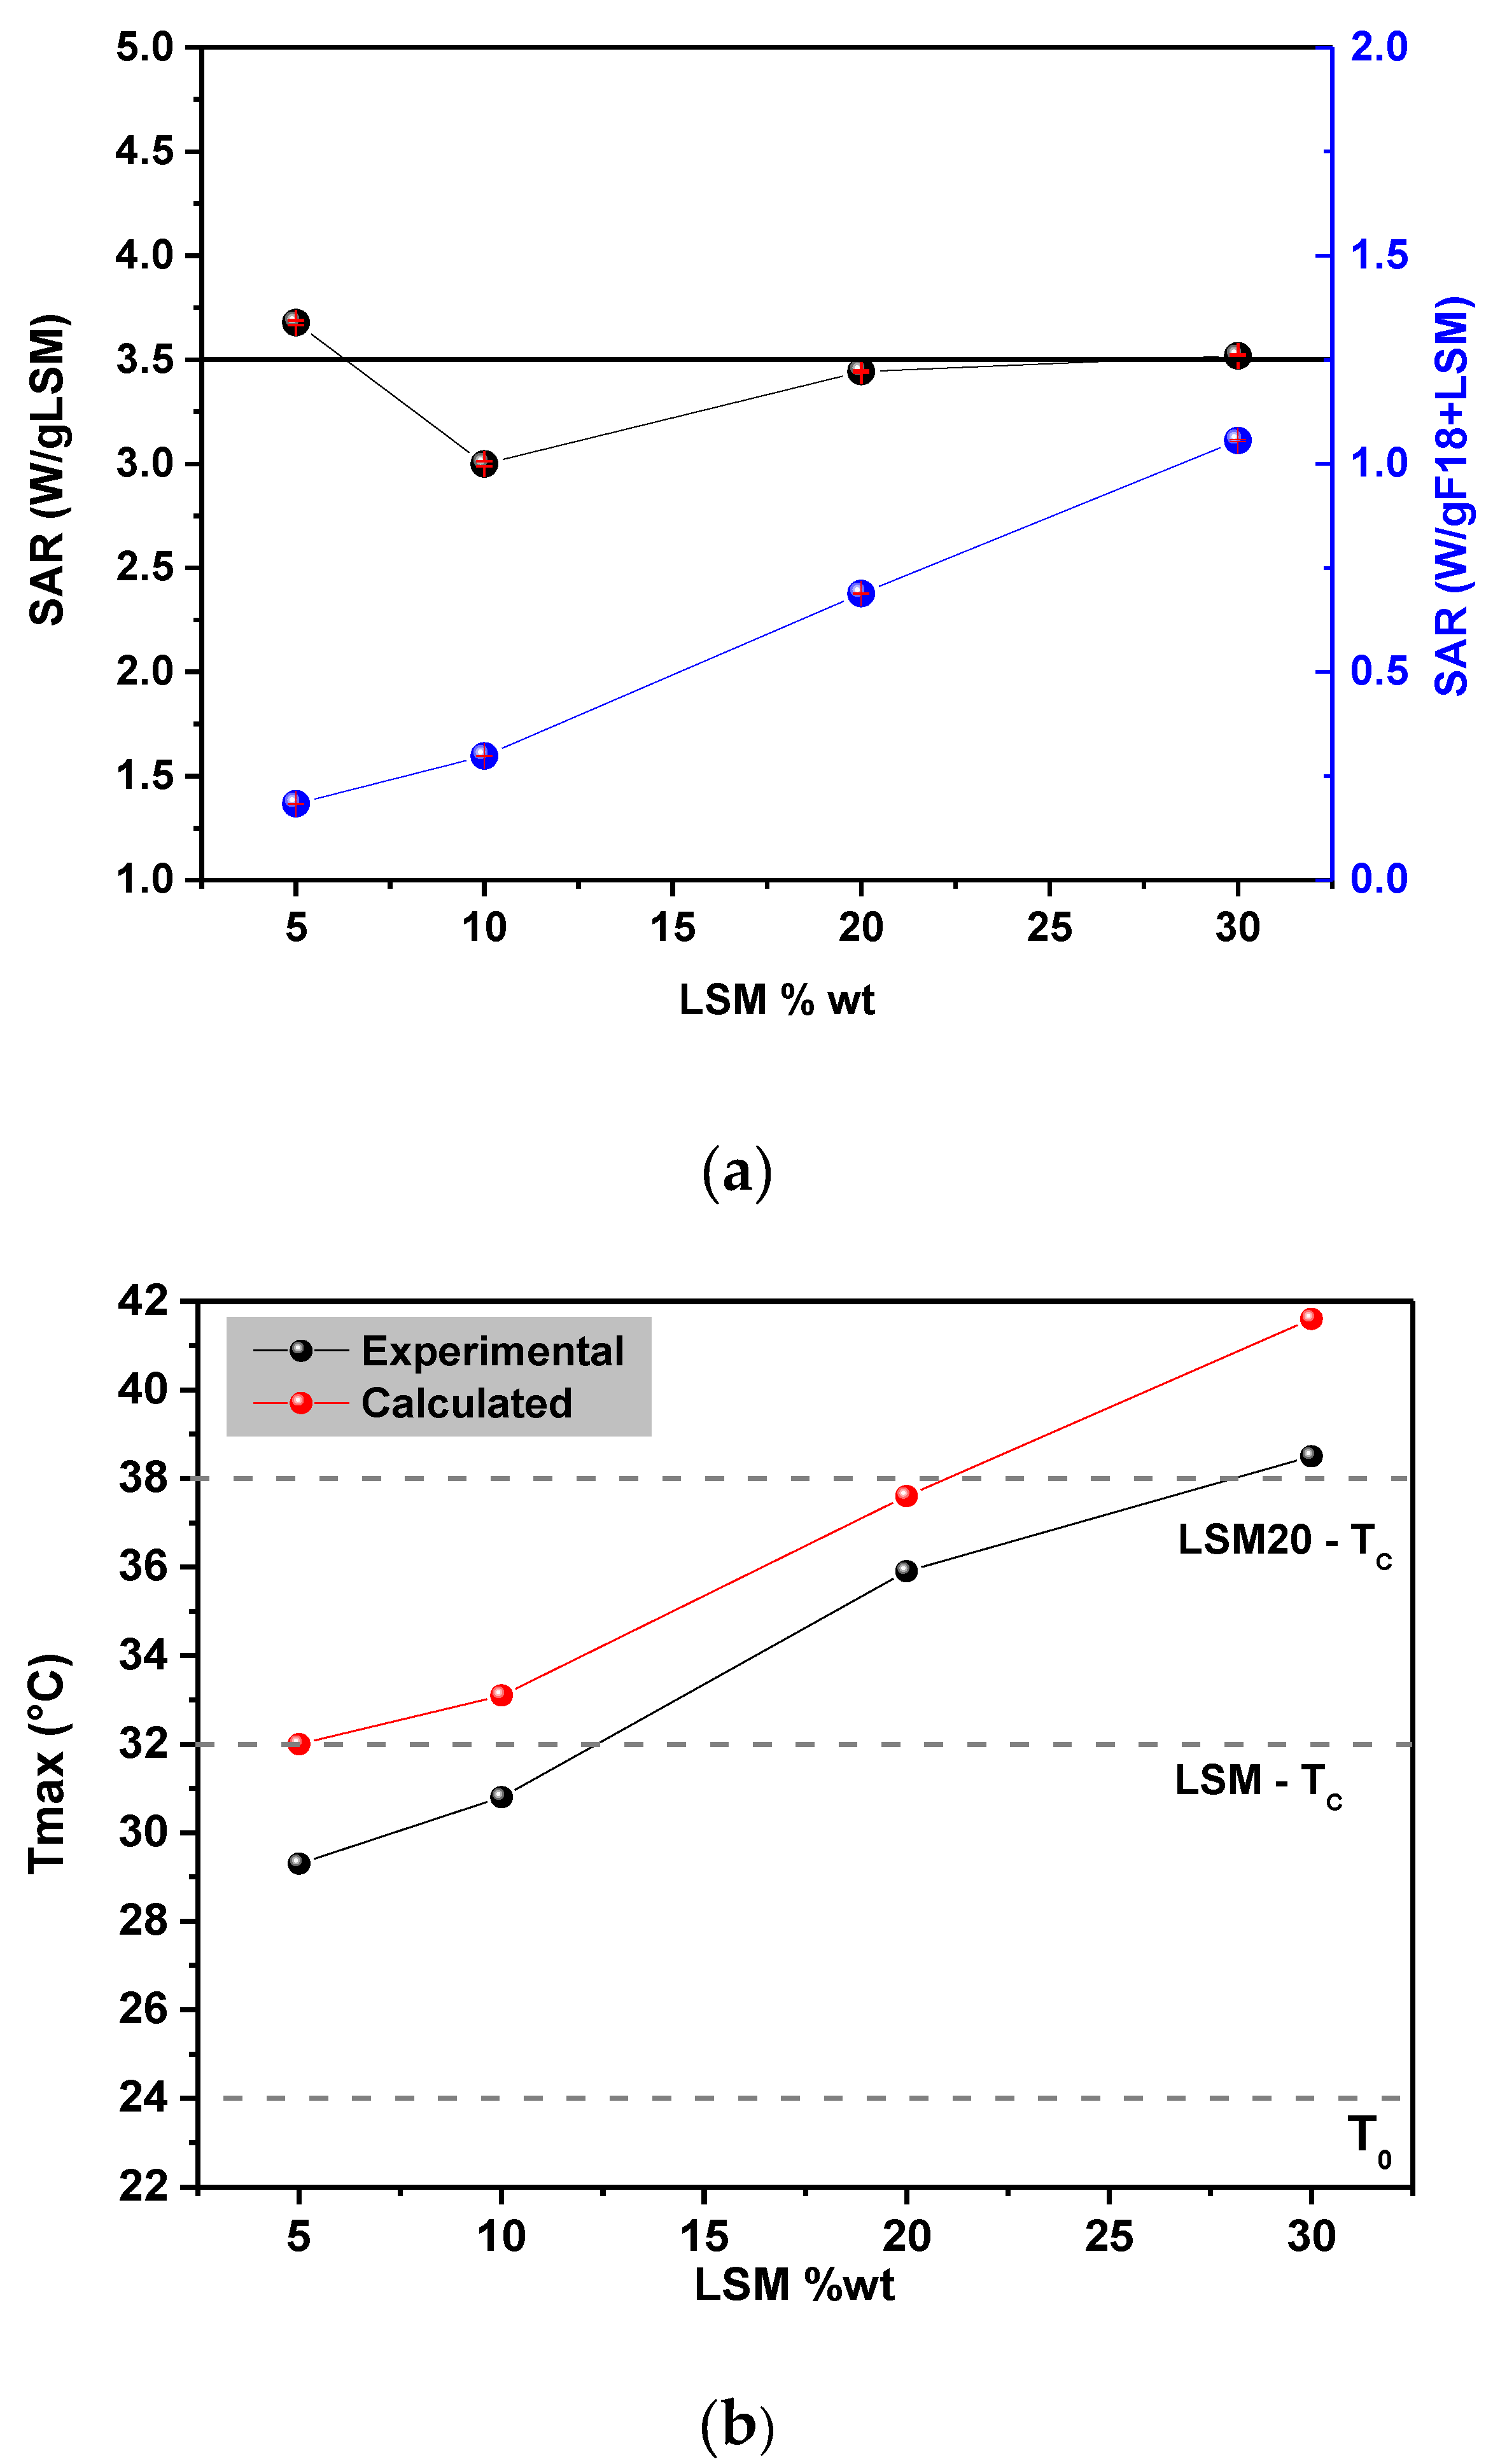
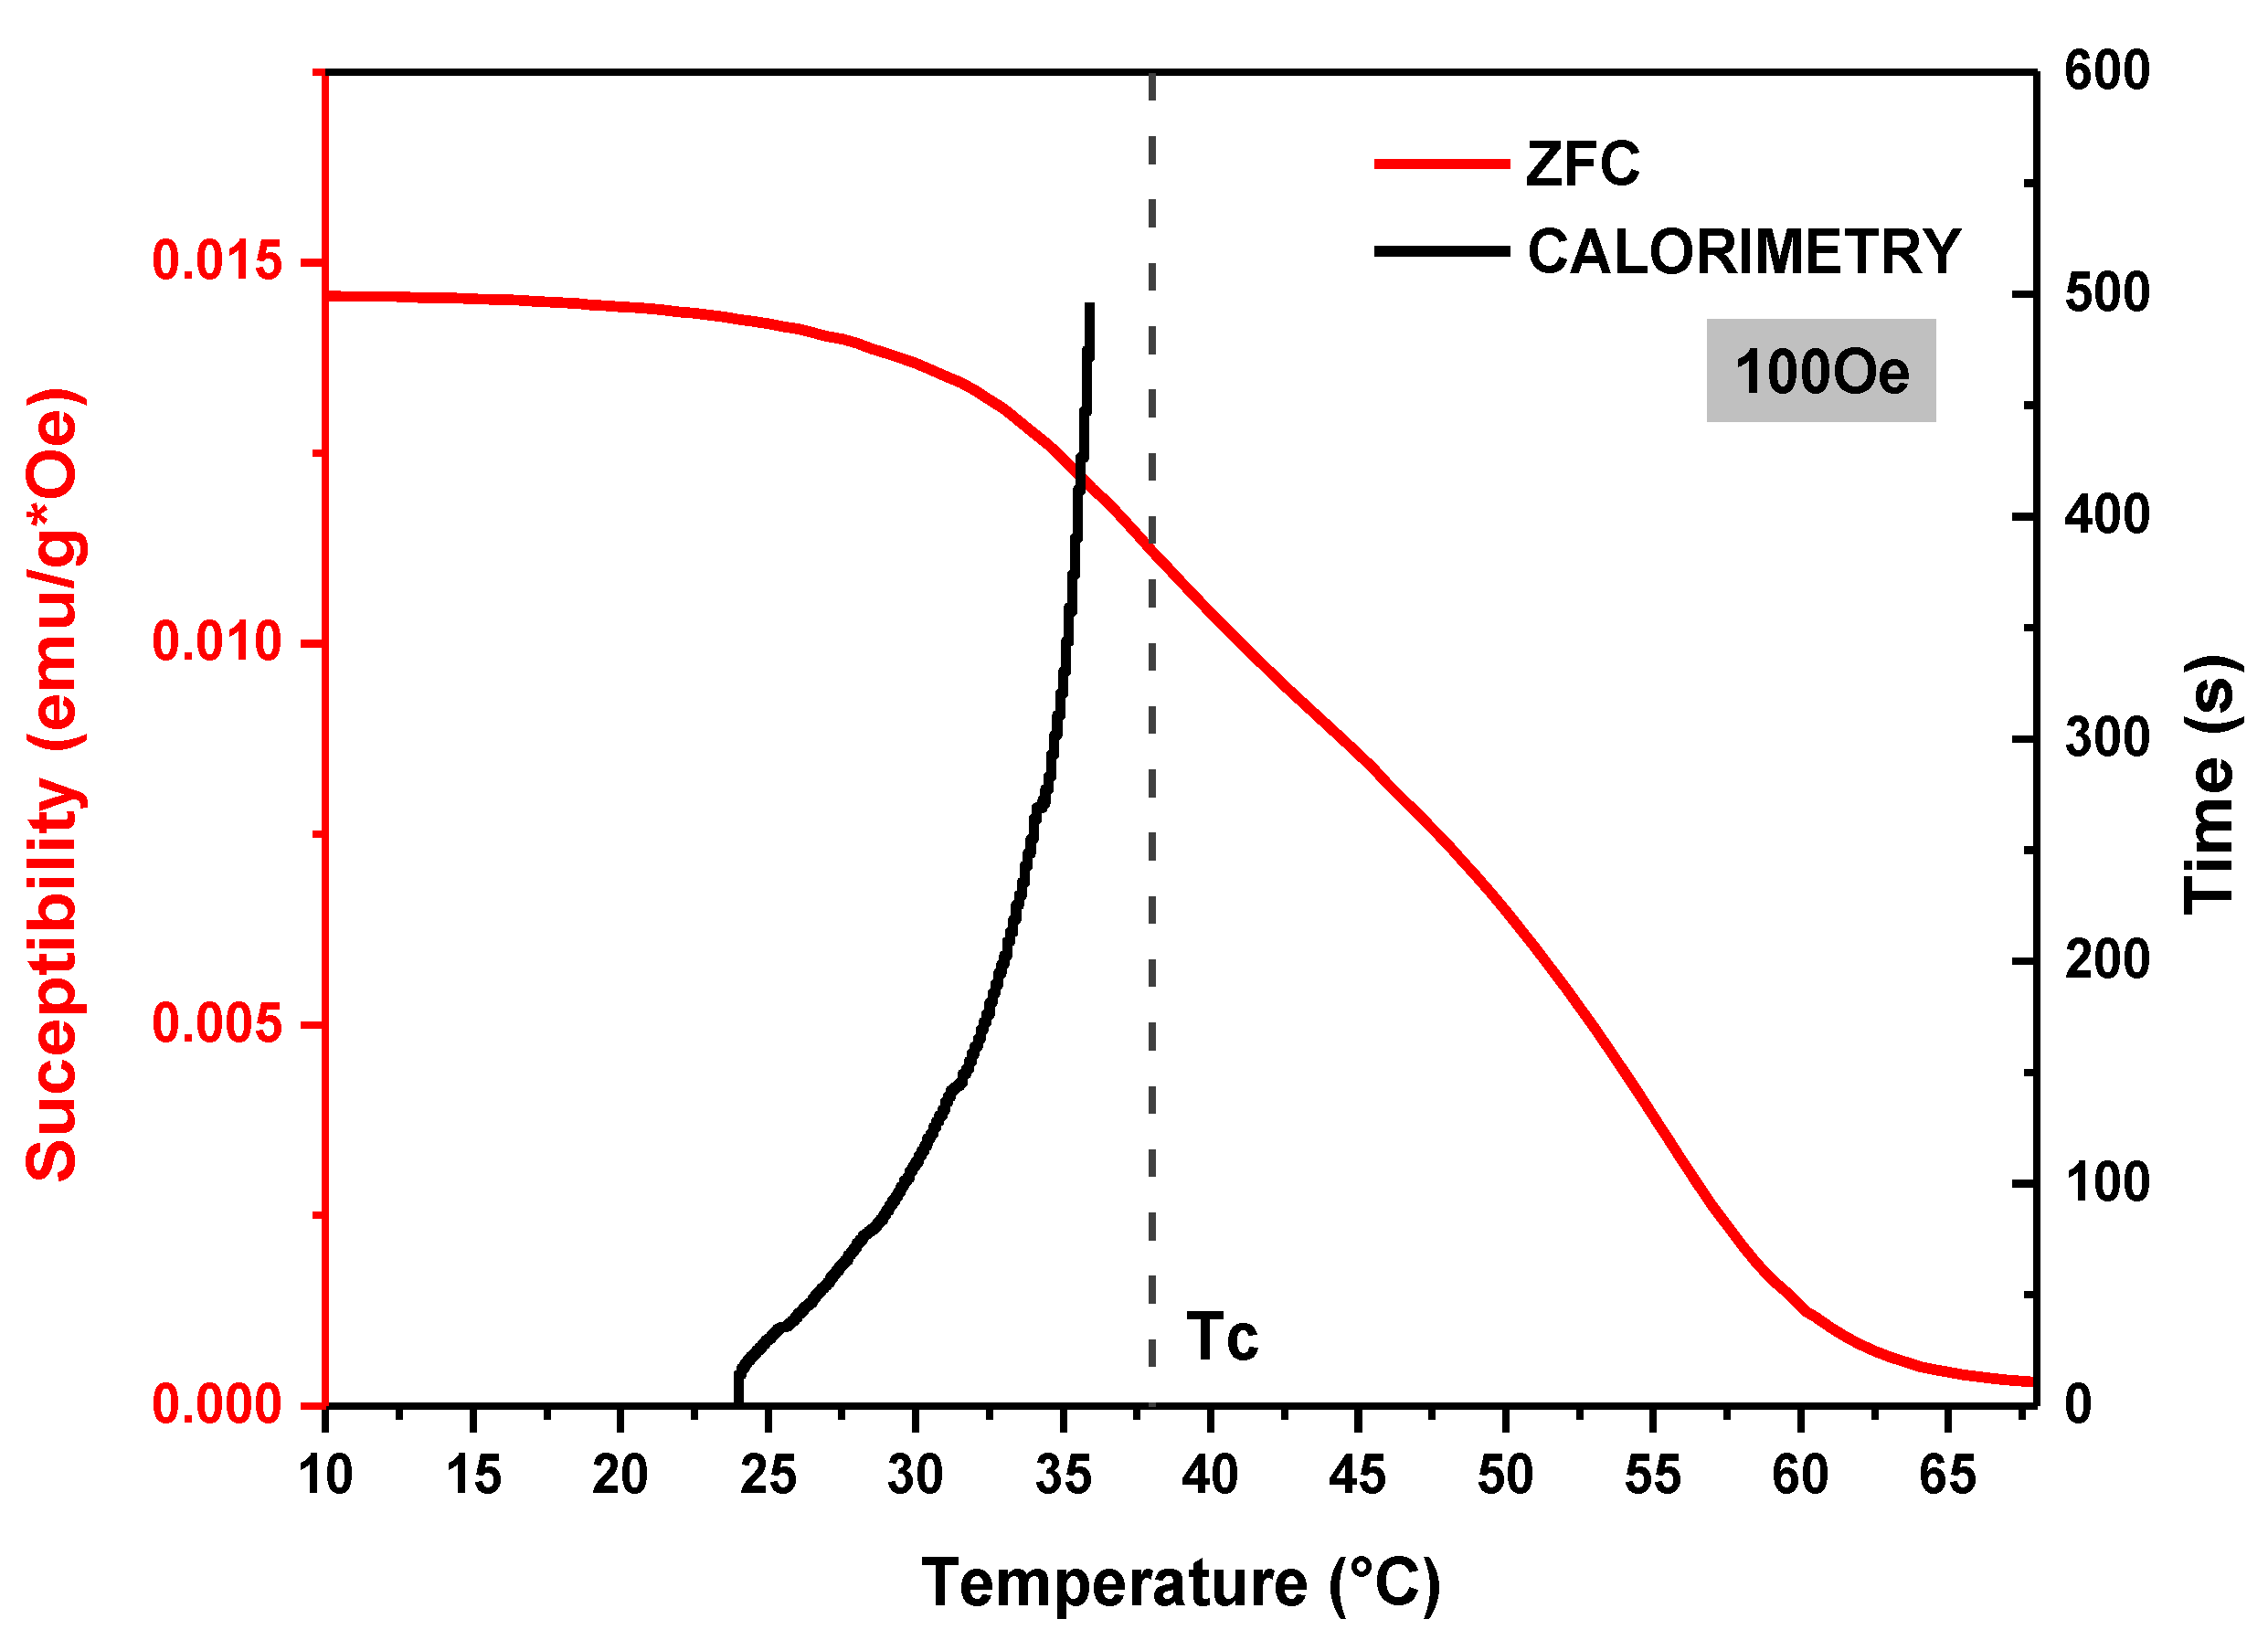
3.3. Magnetic Properties and Heating Efficiency under Alternating Magnetic Field
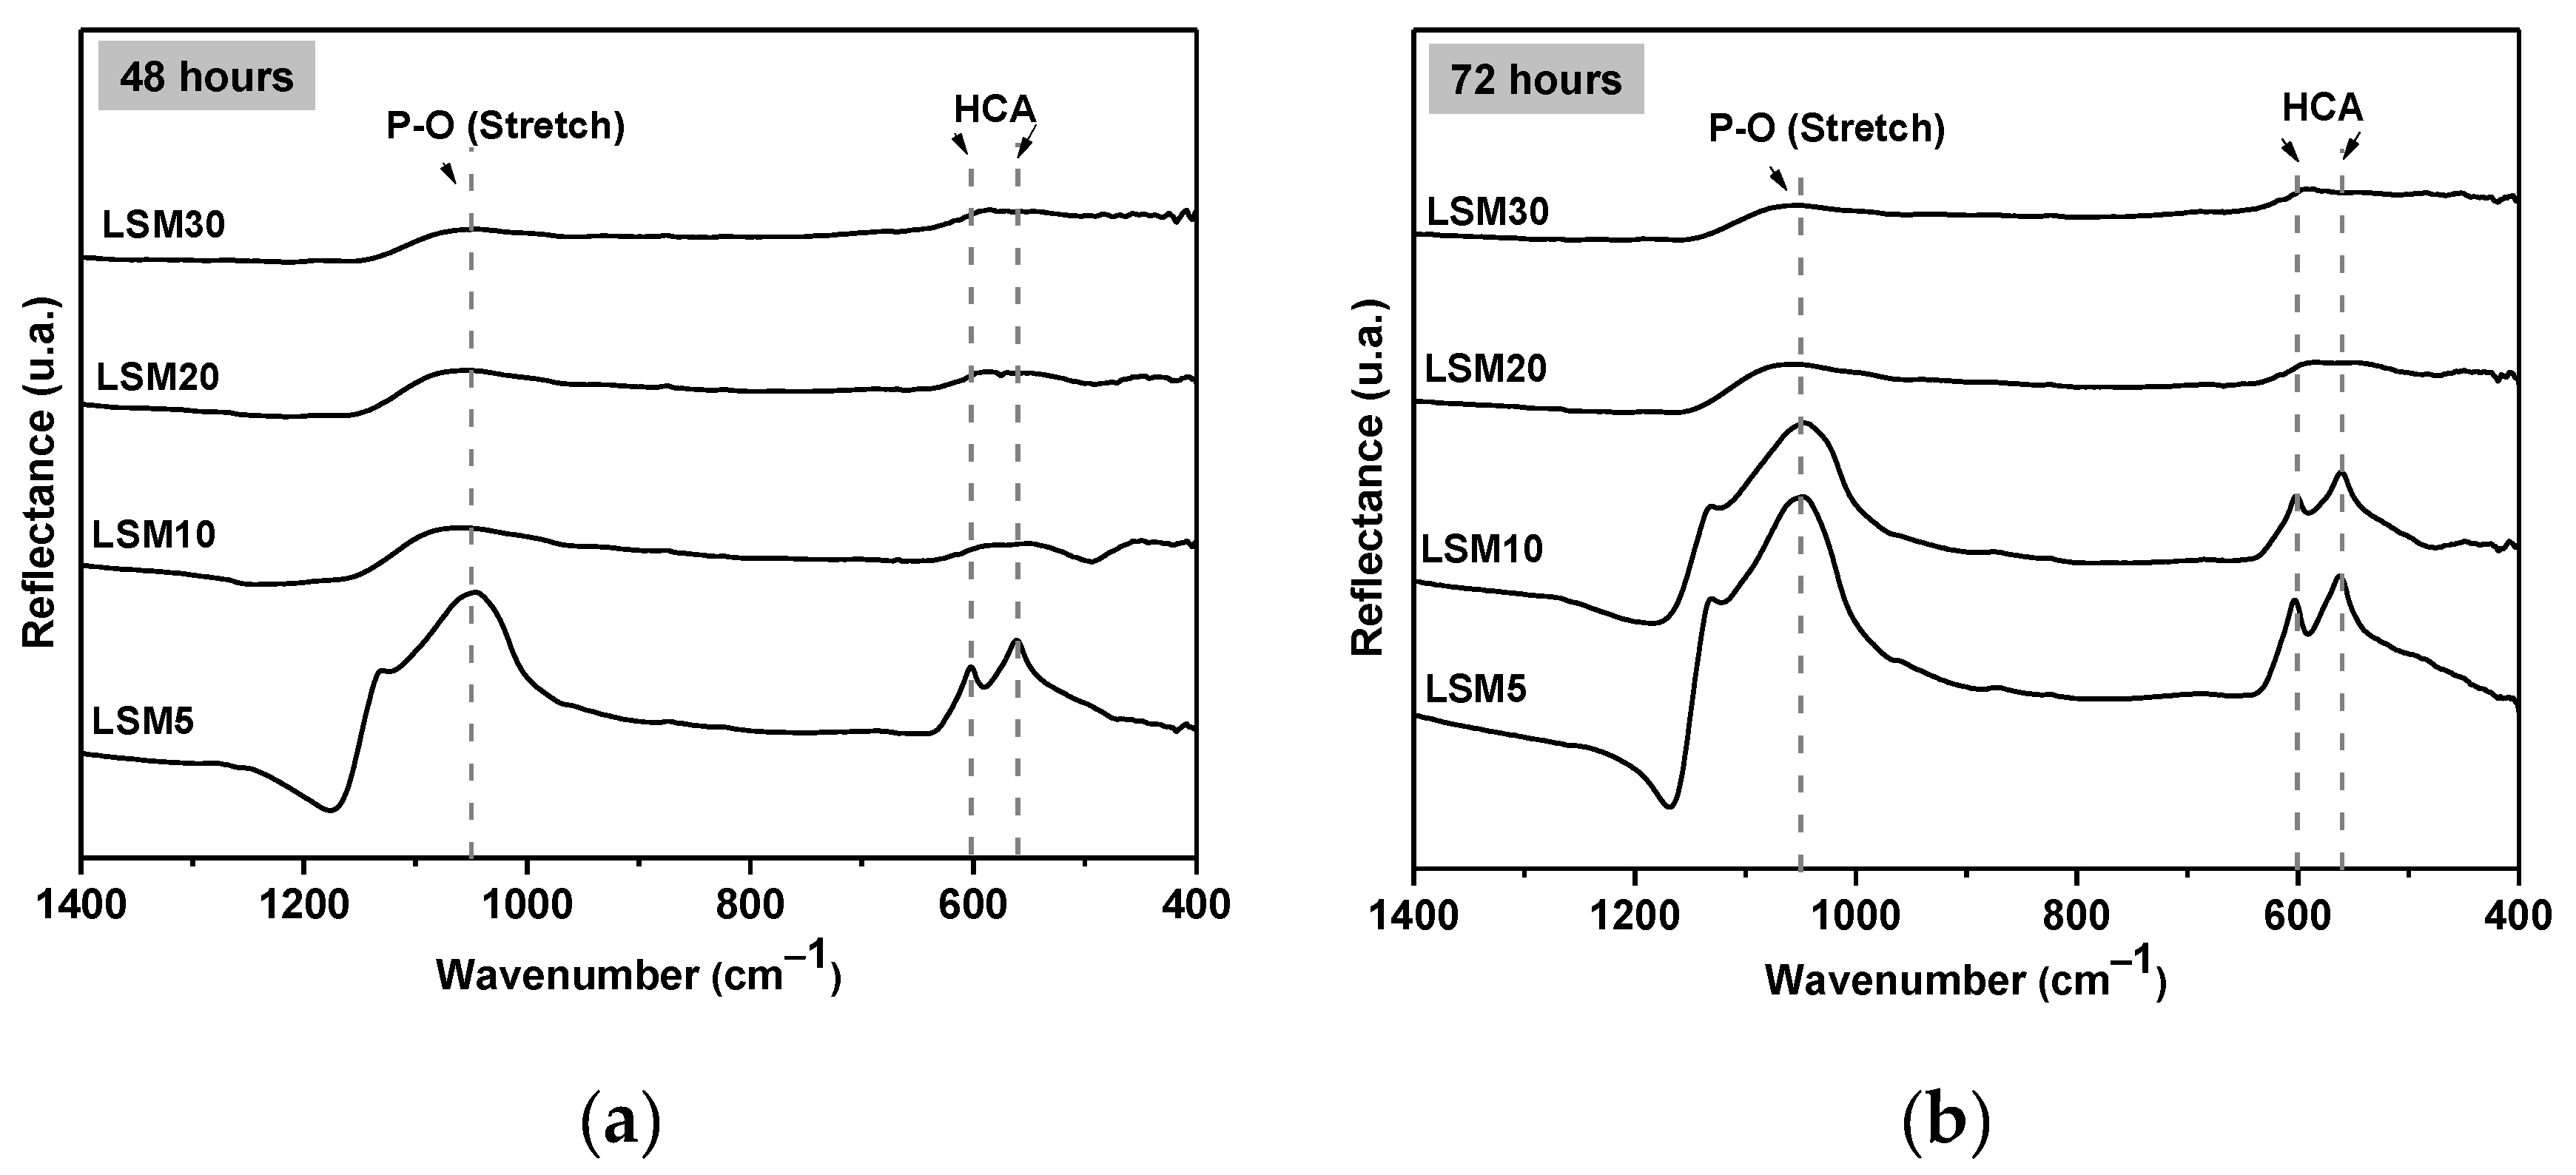
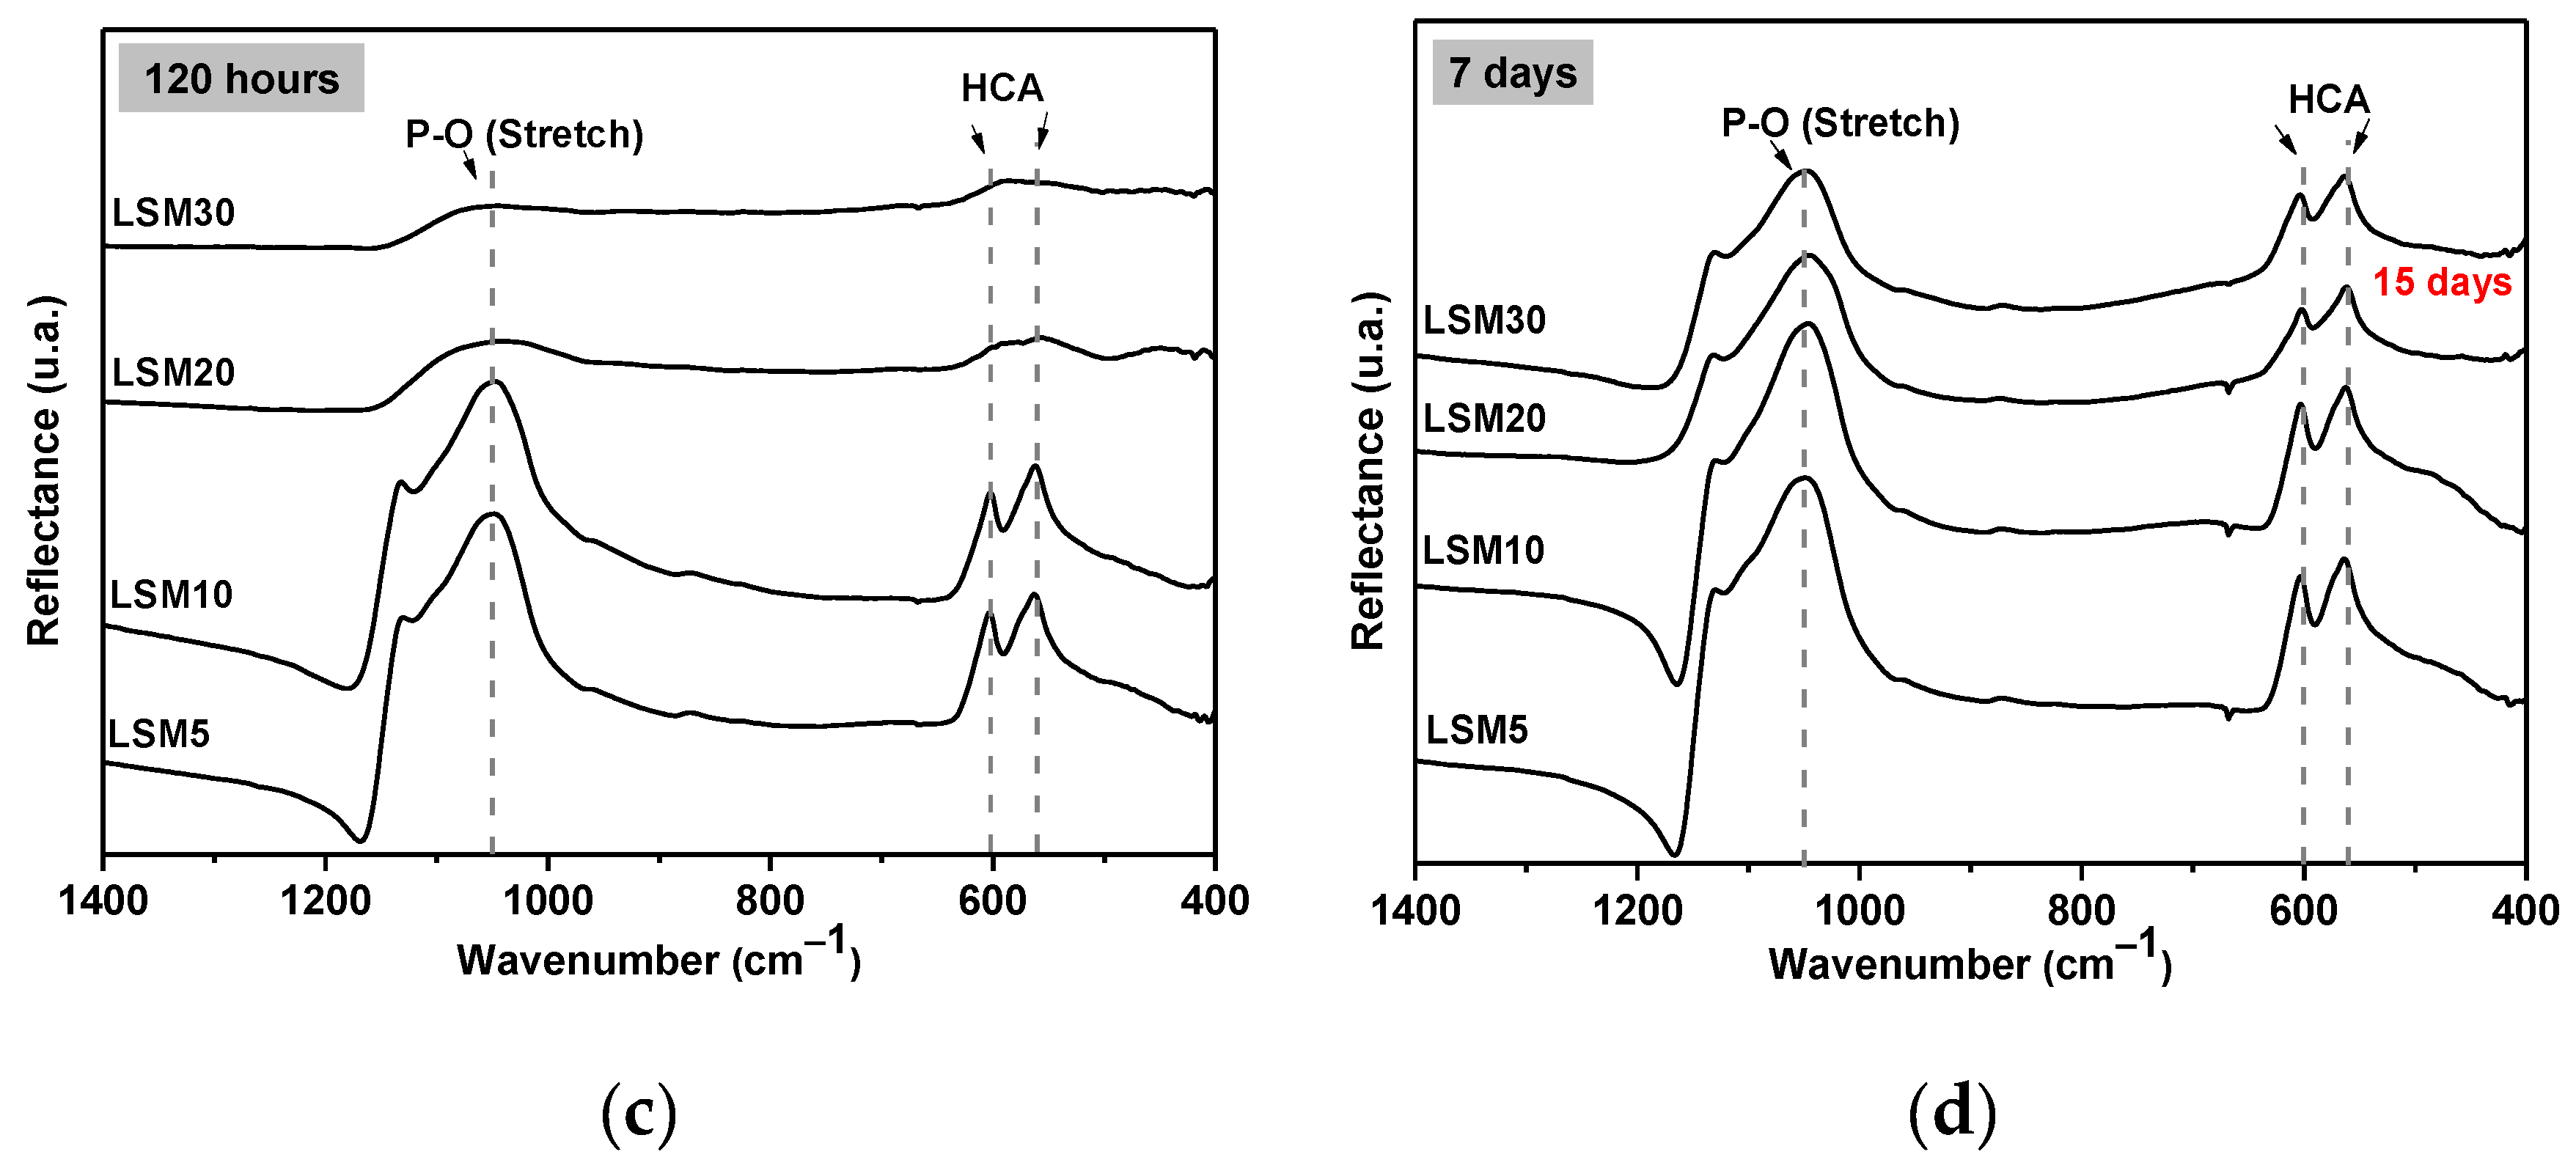
3.4. In Vitro Bioactivity
4. Conclusions
Author Contributions
Funding
Institutional Review Board Statement
Informed Consent Statement
Data Availability Statement
Acknowledgments
Conflicts of Interest
References
- Ashrafizadeh, M.; Paskeh, M.D.A.; Mirzaei, S.; Gholami, M.H.; Zarrabi, A.; Hashemi, F.; Hushmandi, K.; Hashemi, M.; Nabavi, N.; Crea, F.; et al. Targeting autophagy in prostate cancer: Preclinical and clinical evidence for therapeutic response. J. Exp. Clin. Cancer Res. 2022, 41, 105. [Google Scholar] [CrossRef]
- World Health Organization. World Health Statistics 2020: Monitoring Health for the SDGs, Sustainable Development Goals; World Health Organization: Geneva, Switzerland, 2020. [Google Scholar]
- American Cancer Society. Key Statistics about Bone Cancer; American Cancer Society: Atlanta, GA, USA, 2021. [Google Scholar]
- Quadros, M.; Momin, M.; Verma, G. Design strategies and evolving role of biomaterial assisted treatment of osteosarcoma. Mater. Sci. Eng. C 2021, 121, 111875. [Google Scholar] [CrossRef]
- Szasz, A.; Szasz, N.; Szasz, O. Oncothermia: Principles and Practices; Springer: Dordrecht, The Netherlands, 2011; Volume 1. [Google Scholar] [CrossRef]
- Velasco, M.V.; Souza, M.T.; Crovace, M.C.; de Oliveira, A.J.A.; Zanotto, E.D. Bioactive magnetic glass-ceramics for cancer treatment. Biomed. Glas. 2019, 5, 148–177. [Google Scholar] [CrossRef]
- Jha, S.; Sharma, P.K.; Malviya, R. Hyperthermia: Role and Risk Factor for Cancer Treatment. Achiev. Life Sci. 2016, 10, 161–167. [Google Scholar] [CrossRef] [Green Version]
- Perigo, E.A.; Hemery, G.; Sandre, O.; Ortega, D.; Garaio, E.; Plazaola, F.; Teran, F.J. Fundamentals and advances in magnetic hyperthermia. Appl. Phys. Rev. 2015, 2, 041302. [Google Scholar] [CrossRef] [Green Version]
- Das, P.; Colombo, M.; Prosperi, D. Recent advances in magnetic fluid hyperthermia for cancer therapy. Colloids Surf. B Biointerfaces 2019, 174, 42–55. [Google Scholar] [CrossRef]
- Fatima, H.; Charinpanitkul, T.; Kim, K.-S. Fundamentals to Apply Magnetic Nanoparticles for Hyperthermia Therapy. Nanomaterials 2021, 11, 1203. [Google Scholar] [CrossRef] [PubMed]
- Shlapa, Y.; Kulyk, M.; Kalita, V.; Polek, T.; Tovstolytkin, A.; Greneche, J.-M.; Solopan, S.; Belous, A. Iron-Doped (La,Sr)MnO3 Manganites as Promising Mediators of Self-Controlled Magnetic Nanohyperthermia. Nanoscale Res. Lett. 2016, 11, 24. [Google Scholar] [CrossRef] [PubMed] [Green Version]
- Shankhwar, N.; Singh, R.K.; Srinivasan, A. Evolution of Magnetic and Bone Mineral Phases in Heat-Treated Bioactive Glass Containing Zinc and Iron Oxides. Int. J. Appl. Glas. Sci. 2016, 8, 105–115. [Google Scholar] [CrossRef]
- Kulkarni, V.M.; Bodas, D.; Paknikar, K.M. Lanthanum strontium manganese oxide (LSMO) nanoparticles: A versatile platform for anticancer therapy. RSC Adv. 2015, 5, 60254–60263. [Google Scholar] [CrossRef]
- Natividad, E.; Castro, M.; Goglio, G.; Andreu, I.; Epherre, R.; Duguet, E.; Mediano, A. New insights into the heating mechanisms and self-regulating abilities of manganite perovskite nanoparticles suitable for magnetic fluid hyperthermia. Nanoscale 2012, 4, 3954–3962. [Google Scholar] [CrossRef]
- Hedayatnasab, Z.; Abnisa, F.; Daud, W.M.A.W. Review on magnetic nanoparticles for magnetic nanofluid hyperthermia application. Mater. Des. 2017, 123, 174–196. [Google Scholar] [CrossRef]
- Kandasamy, G. Recent advancements in manganite perovskites and spinel ferrite-based magnetic nanoparticles for biomedical theranostic applications. Nanotechnology 2019, 30, 502001. [Google Scholar] [CrossRef]
- Shu, Q.; Zhang, J.; Liu, J.; Zhang, M. Solid-state Reaction for Preparation of Lanthanum Manganite. High Temp. Mater. Process. 2005, 24, 169–174. [Google Scholar] [CrossRef]
- Uskoković, V.; Košak, A.; Drofenik, M.; Košak, A. Preparation of Silica-Coated Lanthanum-Strontium Manganite Particles with Designable Curie Point, for Application in Hyperthermia Treatments. Int. J. Appl. Ceram. Technol. 2006, 3, 134–143. [Google Scholar] [CrossRef] [Green Version]
- Belous, A.G.; V’yunov, O.I.; Pashkova, E.V.; Yanchevskii, O.Z.; Tovstolytkin, A.I.; Pogorelyi, A.M. Effects of Chemical Composition and Sintering Temperature on the Structure of La1-xSrxMnO3±g Solid Solutions. Inorg. Mater. 2003, 39, 161–170. [Google Scholar] [CrossRef]
- Channu, V.S.R.; Holze, R.; Walker, E.H. Synthesis and Characterization of La0.8Sr0.2MnO3−δ Nanostructures for Solid Oxide Fuel Cells. New J. Glas. Ceram. 2013, 3, 29–33. [Google Scholar] [CrossRef] [Green Version]
- Souza, M.T.; Rennó, A.C.M.; Peitl, O.; Zanotto, E.D. New highly bioactive crystallization-resistant glass for tissue engineering applications. Transl. Mater. Res. 2017, 4, 4014002-1–4014002-13. [Google Scholar] [CrossRef]
- Pascual, M.J.; Duran, A.; Oscar, M.; Centro, P.; Bariloche, A. A New Method for Determining Fixed Viscosity Points of Glasses. Phys. Chem. Glas. 2005, 46, 512–520. Available online: https://www.researchgate.net/publication/233558436 (accessed on 4 May 2021).
- Hadadian, Y.; Azimbagirad, M.; Navas, E.A.; Pavan, T.Z. A versatile induction heating system for magnetic hyperthermia studies under different experimental conditions. Rev. Sci. Instrum. 2019, 90, 074701. [Google Scholar] [CrossRef]
- Beković, M.; Hamler, A. Determination of the Heating Effect of Magnetic Fluid in Alternating Magnetic Field. IEEE Trans. Magn. 2010, 46, 552–555. [Google Scholar] [CrossRef]
- Coïsson, M.; Barrera, G.; Celegato, F.; Martino, L.; Kane, S.N.; Raghuvanshi, S.; Vinai, F.; Tiberto, P. Hysteresis losses and specific absorption rate measurements in magnetic nanoparticles for hyperthermia applications. Biochim. Biophys. Acta 2017, 1861, 1545–1558. [Google Scholar] [CrossRef]
- Iglesias, C.A.M.; de Araújo, J.C.R.; Xavier, J.; Anders, R.L.; de Araújo, J.M.; da Silva, R.B.; Soares, J.M.; Brito, E.L.; Streck, L.; Fonseca, J.L.C.; et al. Magnetic nanoparticles hyperthermia in a non-adiabatic and radiating process. Sci. Rep. 2021, 11, 11867. [Google Scholar] [CrossRef] [PubMed]
- Kokubo, T.; Takadama, H. How useful is SBF in predicting in vivo bone bioactivity? Biomaterials 2006, 27, 2907–2915. [Google Scholar] [CrossRef] [PubMed]
- Hernández, E.; Sagredo, V.; Delgado, G.E. Synthesis and magnetic characterization of LaMnO3 nanoparticles. Rev. Mex. Fís. 2015, 61, 166–169. [Google Scholar]
- Eriksson, S.-G.; Ivanov, S.; Eriksen, J.; Valkeapää, M.; Johansson, L.G.; Rundlöf, H.; McGreevy, R.; Berastegui, P.; Björnsson, P.; Rubhausen, M.; et al. A Neutron Powder Diffraction and Inelastic Light Scattering Study of (La,Sr)MnO3+δ. Mater. Sci. Forum 2001, 378, 505–510. [Google Scholar] [CrossRef]
- Souza, M.T. Desenvolvimento e Caracterização de Tecidos Vítreos Flexíveis Altamente Bioativos. Master’s Thesis, Universidade Federal de São Carlos, São Carlos, Brazil, 2015. [Google Scholar]
- Velasco, M.L.V. Bioactive composite for localized cancer treatment by magnetic hyperthermia. Ceram. Int. 2022. [Google Scholar]
- Mody, V.V.; Singh, A.; Wesley, B. Basics of magnetic nanoparticles for their application in the field of magnetic fluid hyperthermia. Eur. J. Nanomed. 2013, 5, 11–21. [Google Scholar] [CrossRef]
- Sahu, B.N.; Suresh, K.G.; Venkataramani, N.; Prasad, S.; Krishnan, R. Temperature and field dependent magnetization studies on nano-crystalline ZnFe2O4 thin films. AIP Adv. 2018, 8, 056118. [Google Scholar] [CrossRef] [Green Version]
- Livesey, K.L.; Ruta, S.; Anderson, N.R.; Baldomir, D.; Chantrell, R.W.; Serantes, D. Beyond the blocking model to fit nanoparticle ZFC/FC magnetisation curves. Sci. Rep. 2018, 8, 11166. [Google Scholar] [CrossRef] [PubMed] [Green Version]
- Li, Q.; Kartikowati, C.W.; Horie, S.; Ogi, T.; Iwaki, T.; Okuyama, K. Correlation between particle size/domain structure and magnetic properties of highly crystalline Fe3O4 nanoparticles. Sci. Rep. 2017, 7, 9894. [Google Scholar] [CrossRef] [PubMed]
- Fujishiro, H.; Ikebe, M.; Konno, Y. Phase transition to antiferromagnetic state in La1-xSrxMnO3 (x ≥ 0.5). J. Phys. Soc. Japan 1998, 67, 1799–1800. [Google Scholar] [CrossRef]
- Troyanchuk, I.O.; Karpinsky, D.; Efimov, V.; Sikolenko, V.; Prokhnenko, O.; Bartkowiak, M. Ferromagnetic interactions in Mn3+ based perovskites. J. Phys. Condens. Matter 2014, 26, 396002. [Google Scholar] [CrossRef]
- McBride, K.; Cook, J.; Gray, S.; Felton, S.; Stella, L.; Poulidi, D. Evaluation of La1−xSrxMnO3 (0 ≤ x <0.4) synthesised via a modified sol-gel method as mediators for magnetic fluid hyperthermia. CrystEngComm 2016, 18, 407–416. [Google Scholar] [CrossRef] [Green Version]
- Cullity, B.D.; Graham, C.D. Introduction to Magnetic Materials, 2nd ed.; Jonh Wiley & Sons: Hoboken, NJ, USA, 2009. [Google Scholar]
- Staneva, A.; Gattef, E.; Dimitriev, Y.; Mikhov, M.; Geshev, J. Magnetic materials containing LaSr manganite phase. Solid State Sci. 2004, 6, 47–51. [Google Scholar] [CrossRef]
- Moskowitz, B.M. High-temperature magnetostriction of magnetite and titanomagnetites. J. Geophys. Res. Earth Surf. 1993, 98, 359–371. [Google Scholar] [CrossRef]
- Bellucci, D.; Cannillo, V.; Sola, A. Coefficient of thermal expansion of bioactive glasses: Available literature data and analytical equation estimates. Ceram. Int. 2011, 37, 2963–2972. [Google Scholar] [CrossRef]
- Mori, M.; Hiei, Y.; Sammes, N.M.; Tompsett, G.A. Thermal-Expansion Behaviors and Mechanisms for Ca- or Sr-Doped Lanthanum Manganite Perovskites under Oxidizing Atmospheres. J. Electrochem. Soc. 2000, 147, 1295–1302. [Google Scholar] [CrossRef] [Green Version]
- Marin, C.P.; Santana, G.L.; Robinson, M.; Willerth, S.M.; Crovace, M.C.; Zanotto, E.D. Effect of bioactive Biosilicate®/F18 glass scaffolds on osteogenic differentiation of human adipose stem cells. J. Biomed. Mater. Res. Part A 2020, 109, 1293–1308. [Google Scholar] [CrossRef]
- Crovace, M.C.; Souza, M.T.; Chinaglia, C.R.; Peitl, O.; Zanotto, E.D. Biosilicate®-A multipurpose, highly bioactive glass-ceramic. In vitro, in vivo and clinical trials. J. Non-Cryst. Solids 2016, 432, 90–110. [Google Scholar] [CrossRef]
- Jones, J.R. Review of bioactive glass: From Hench to hybrids. Acta Biomater. 2013, 9, 4457–4486. [Google Scholar] [CrossRef] [PubMed]


| Composition | Ts (°C) | Ta (°C) | Tmax (°C) |
|---|---|---|---|
| F18 | 571 | 571 | 650 |
| LSM5 | 574 | 574 | 650 |
| LSM10 | 582 | 582 | 655 |
| LSM20 | 602 | 616 | 658 |
| LSM30 | 603 | 605 | 660 |
| Parameters | Rietveld | ICSD 51655 * |
|---|---|---|
| D(g/cm3) | 6.52 | 6.56 |
| a (nm) | 0.5526 | 0.5518 |
| c (nm) | 1.3362 | 1.3344 |
| V (nm−3) | 0.35335 | 0.35180 |
| Rwp (%) | 11.35 | - |
| S | 1.68 | - |
| Material | T (K) | Ms (emu/g) | Mr (emu/g) | Hc (Oe) | Mr/Ms |
|---|---|---|---|---|---|
| LSM, average particle size~1.7 μm | 250 | 70.6 | 3.4 | ~30 | 0.05 |
| 300 | 56.7 | 3.8 | ~30 | 0.08 | |
| Magnetite, average particle size~5 μm. Data from [31] | 300 | 58.8 | 3.8 | ~150 | 0.23 |
| LSM Content (wt%) | Calculated Temperature Increase–ΔT (°C) | Experimental Temperature Increase–ΔT (°C) |
|---|---|---|
| 5 | 8 | 5 |
| 10 | 9 | 7 |
| 20 | 14 | 11 |
| 30 | 18 | 15 |
Publisher’s Note: MDPI stays neutral with regard to jurisdictional claims in published maps and institutional affiliations. |
© 2022 by the authors. Licensee MDPI, Basel, Switzerland. This article is an open access article distributed under the terms and conditions of the Creative Commons Attribution (CC BY) license (https://creativecommons.org/licenses/by/4.0/).
Share and Cite
Santana, G.L.; Crovace, M.C.; Mazón, E.E.; de Oliveira, A.J.A.; Pavan, T.Z.; Zanotto, E.D. Smart Bone Graft Composite for Cancer Therapy Using Magnetic Hyperthermia. Materials 2022, 15, 3187. https://doi.org/10.3390/ma15093187
Santana GL, Crovace MC, Mazón EE, de Oliveira AJA, Pavan TZ, Zanotto ED. Smart Bone Graft Composite for Cancer Therapy Using Magnetic Hyperthermia. Materials. 2022; 15(9):3187. https://doi.org/10.3390/ma15093187
Chicago/Turabian StyleSantana, Geovana L., Murilo C. Crovace, Ernesto E. Mazón, Adilson J. A. de Oliveira, Theo Z. Pavan, and Edgar D. Zanotto. 2022. "Smart Bone Graft Composite for Cancer Therapy Using Magnetic Hyperthermia" Materials 15, no. 9: 3187. https://doi.org/10.3390/ma15093187