
Impact of Novel Varietal and Regional Differences on Cotton Fiber Quality Characteristics


 , ,
, , 

Abstract
:1. Introduction
2. Materials and Methods
2.1. Analysis of Data
2.2. Fiber Physical Characteristics
2.3. Fiber Mechanical Characteristics
2.4. Fiber Chemical Characteristics
Cellulose, Wax Content, and Ash Content
3. Results and Discussion
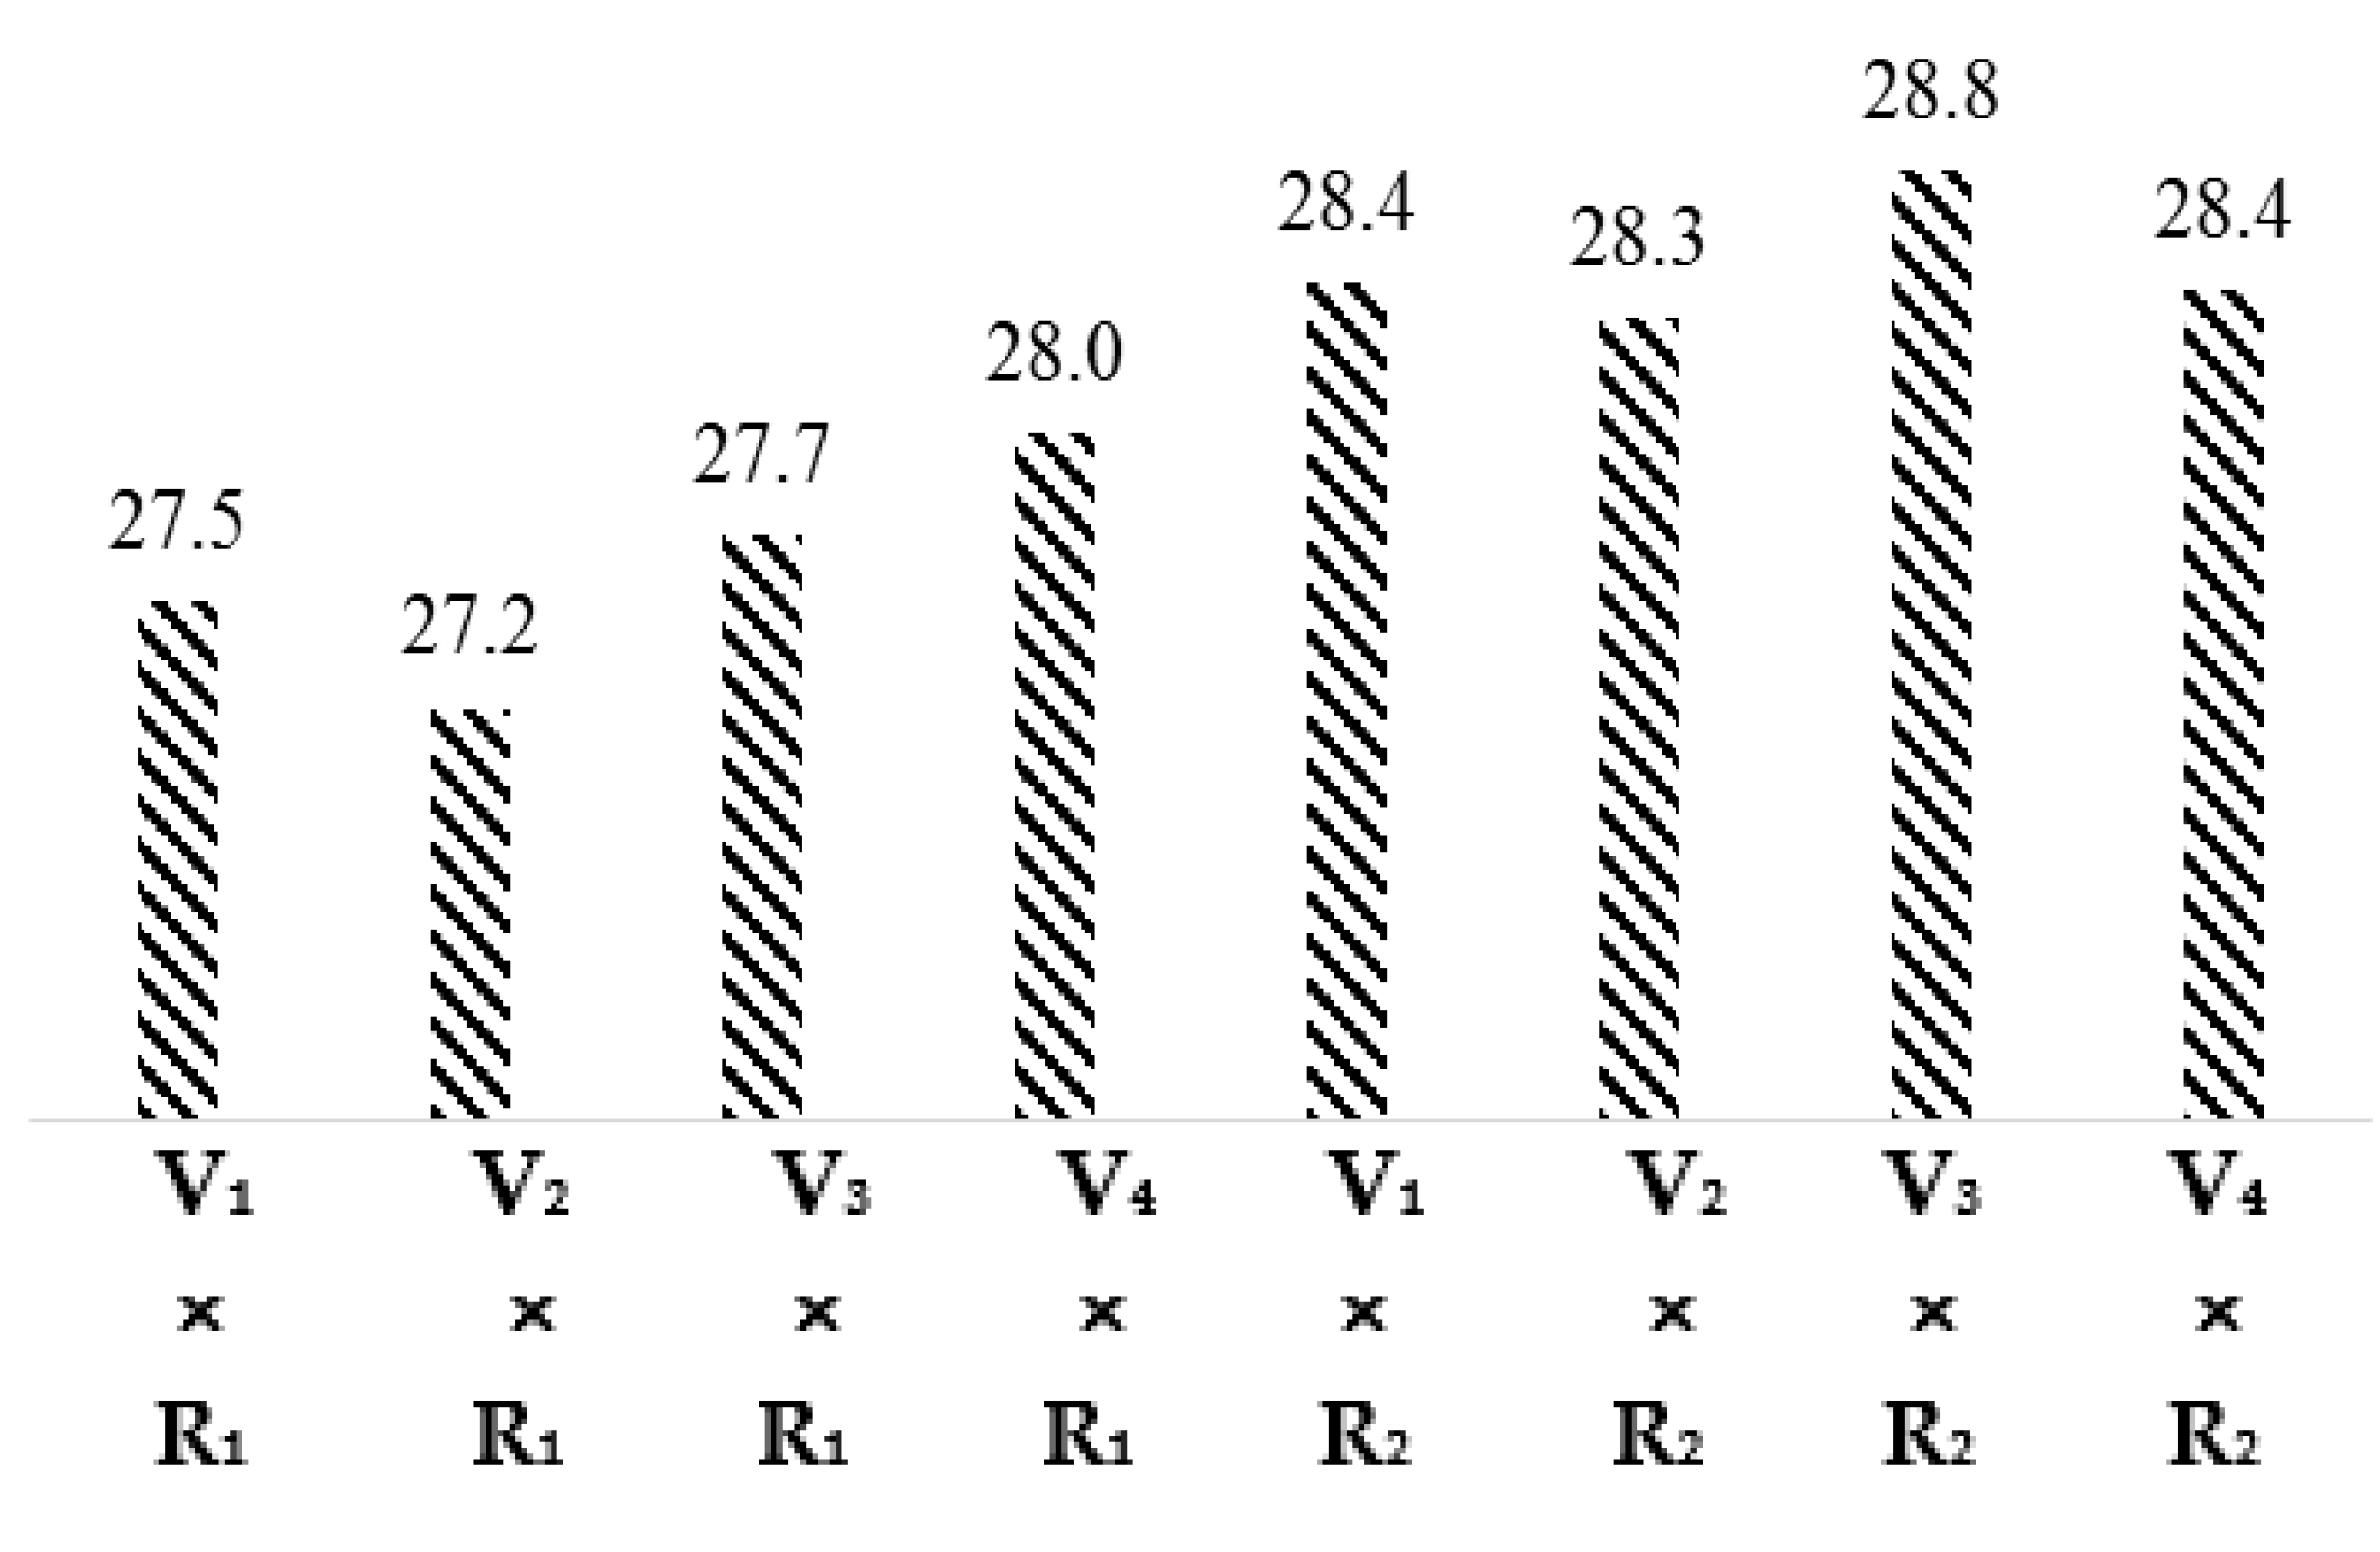
3.1. Fiber Length (mm)
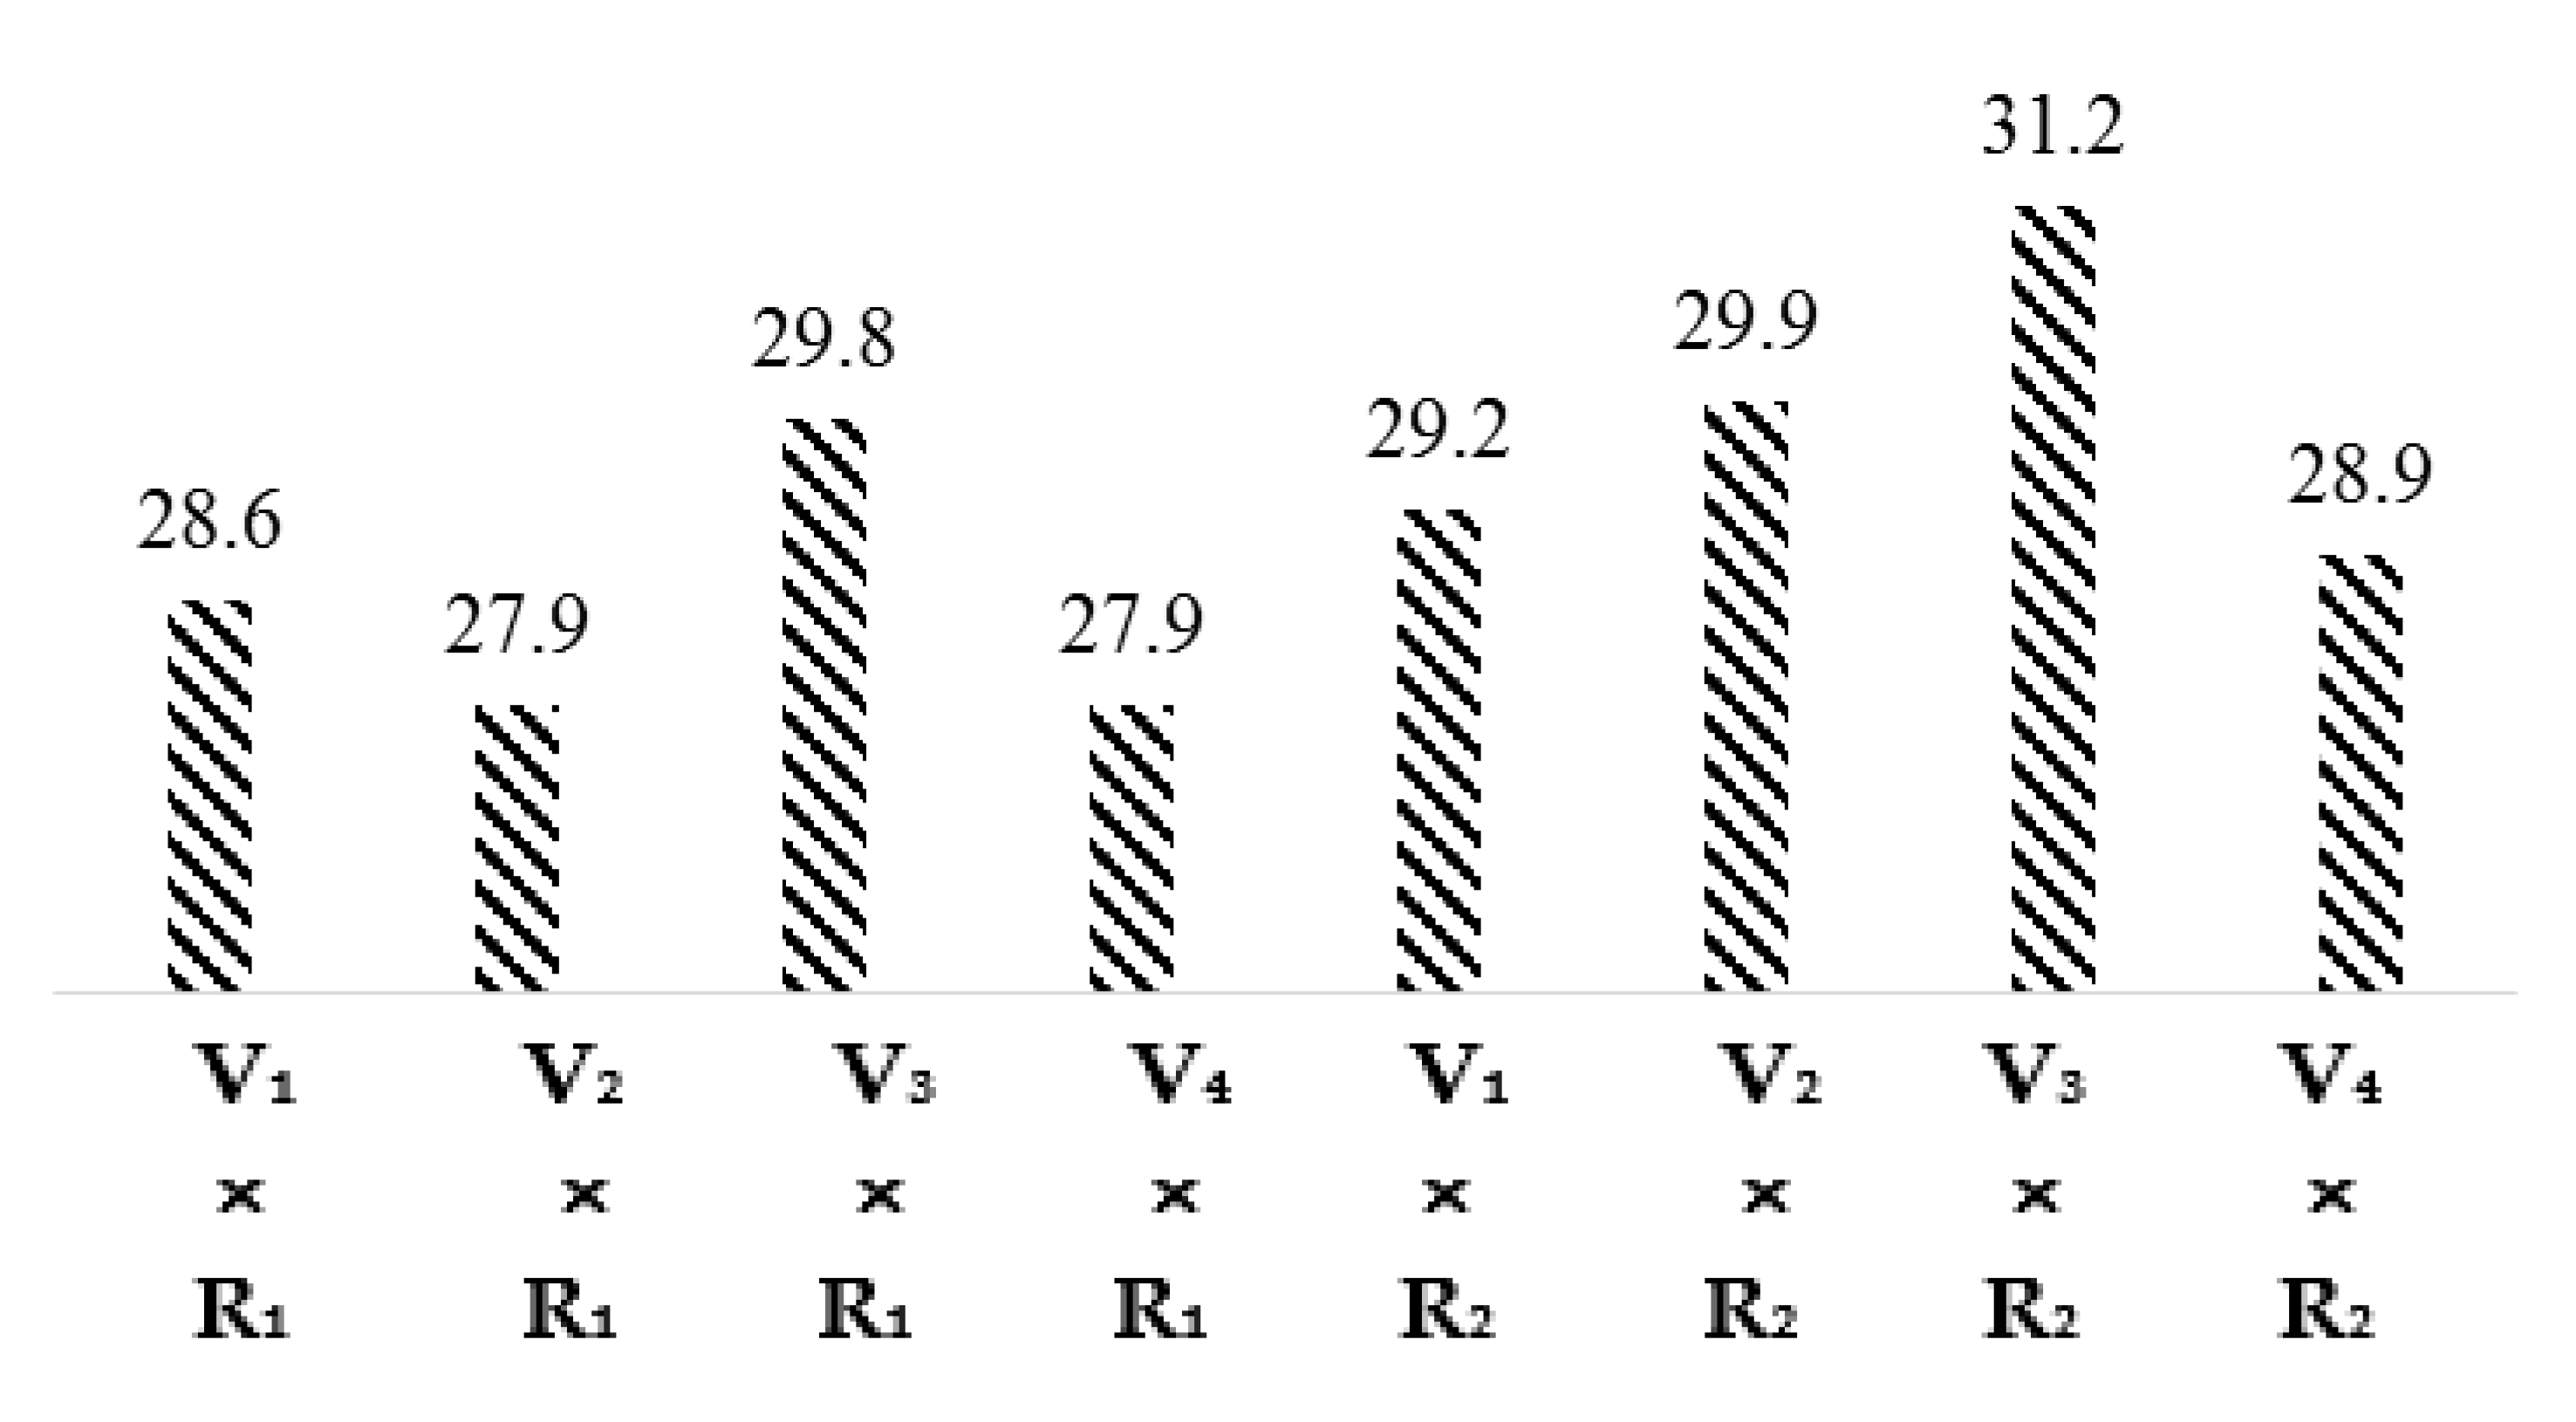
3.2. Fiber Strength (g/tex)
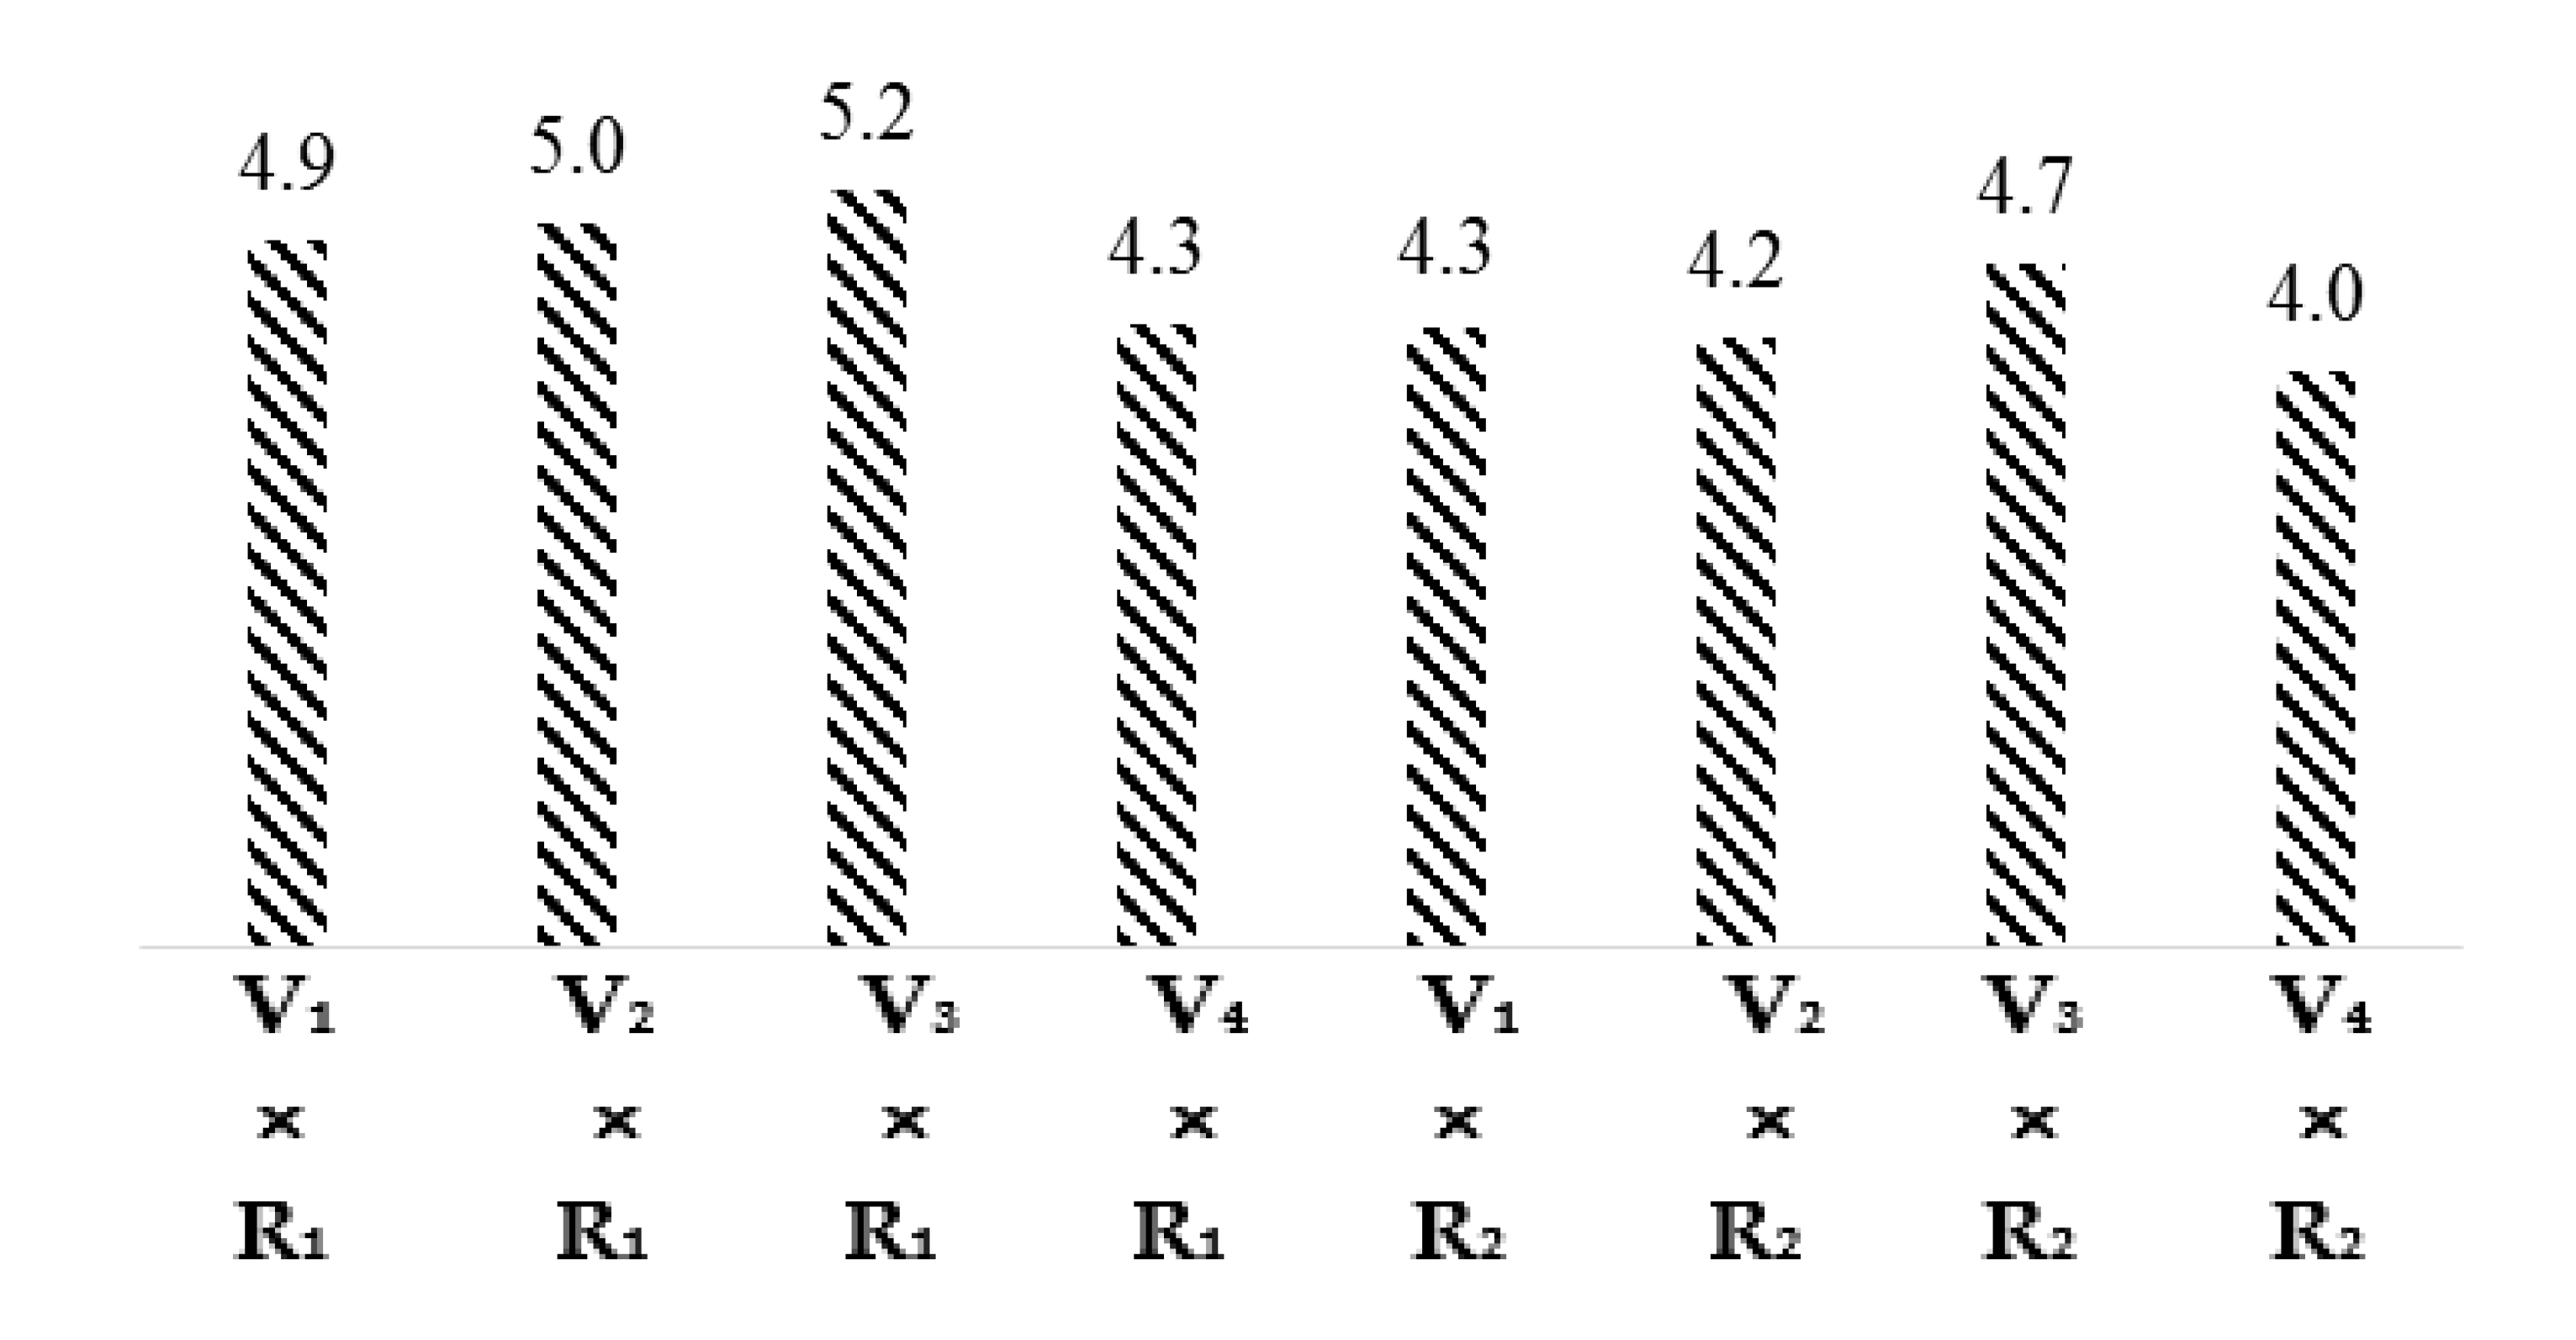
3.3. Micronaire
3.4. Cellulose (%)
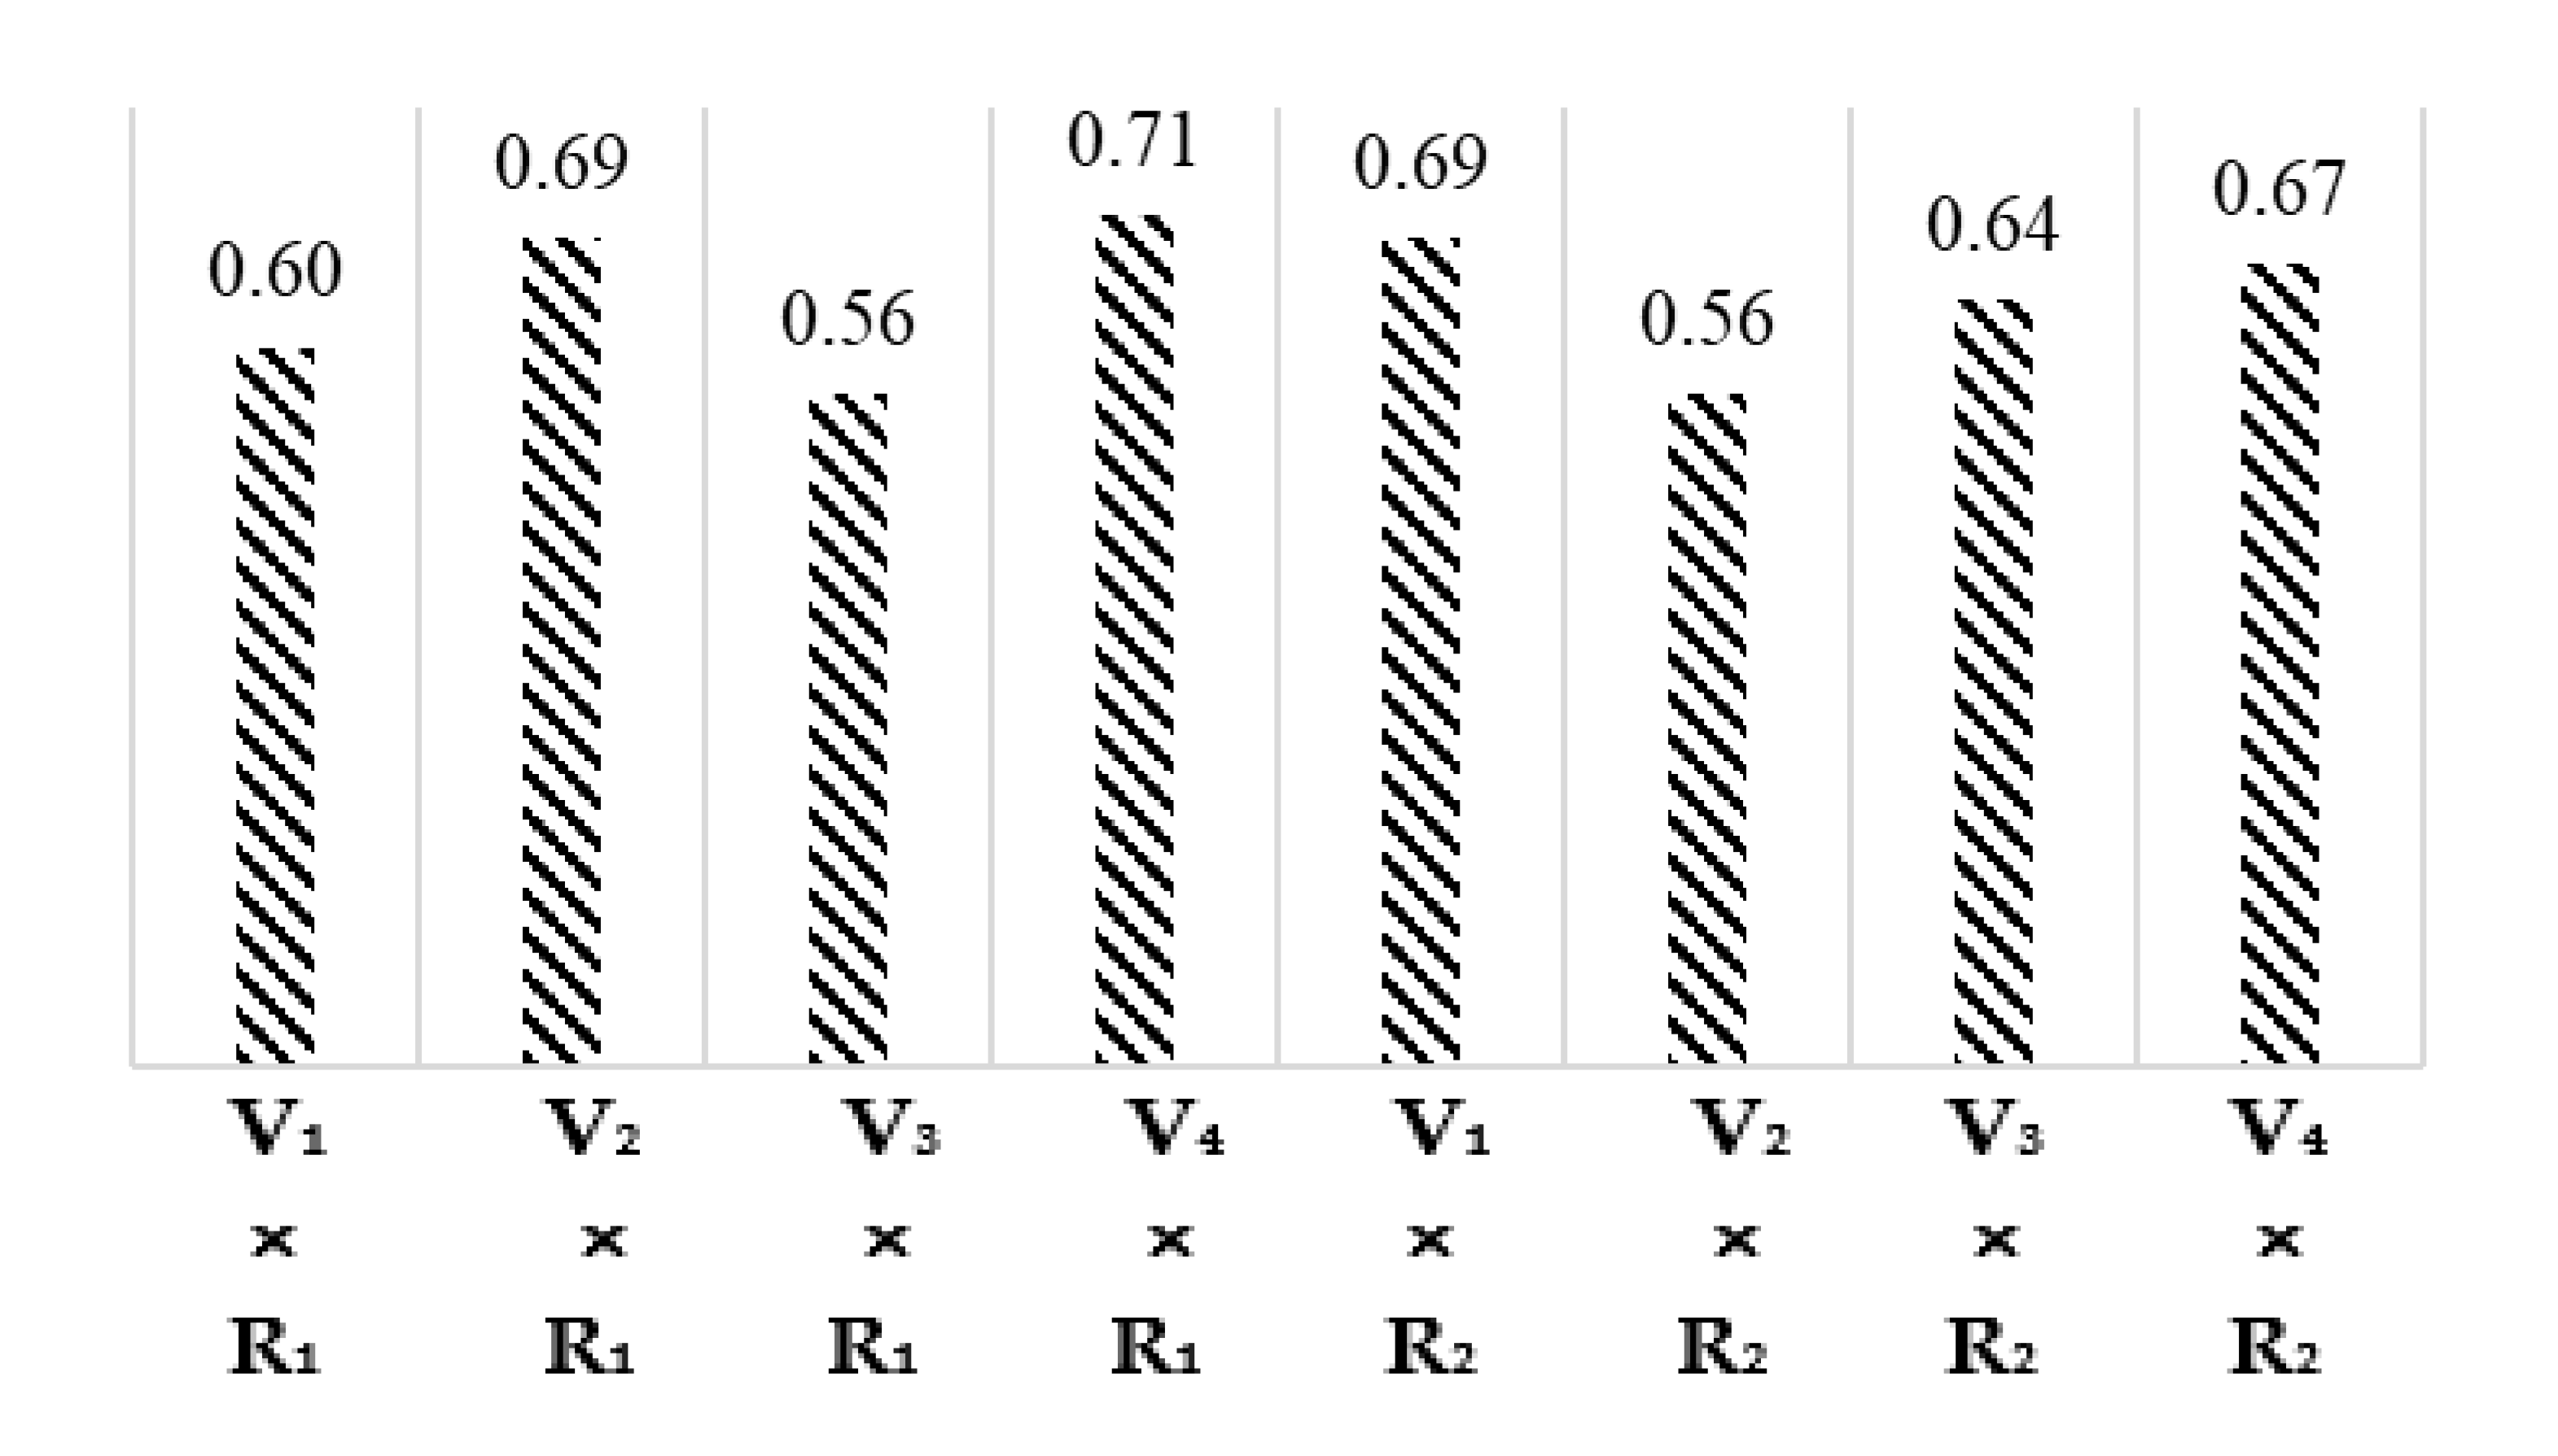
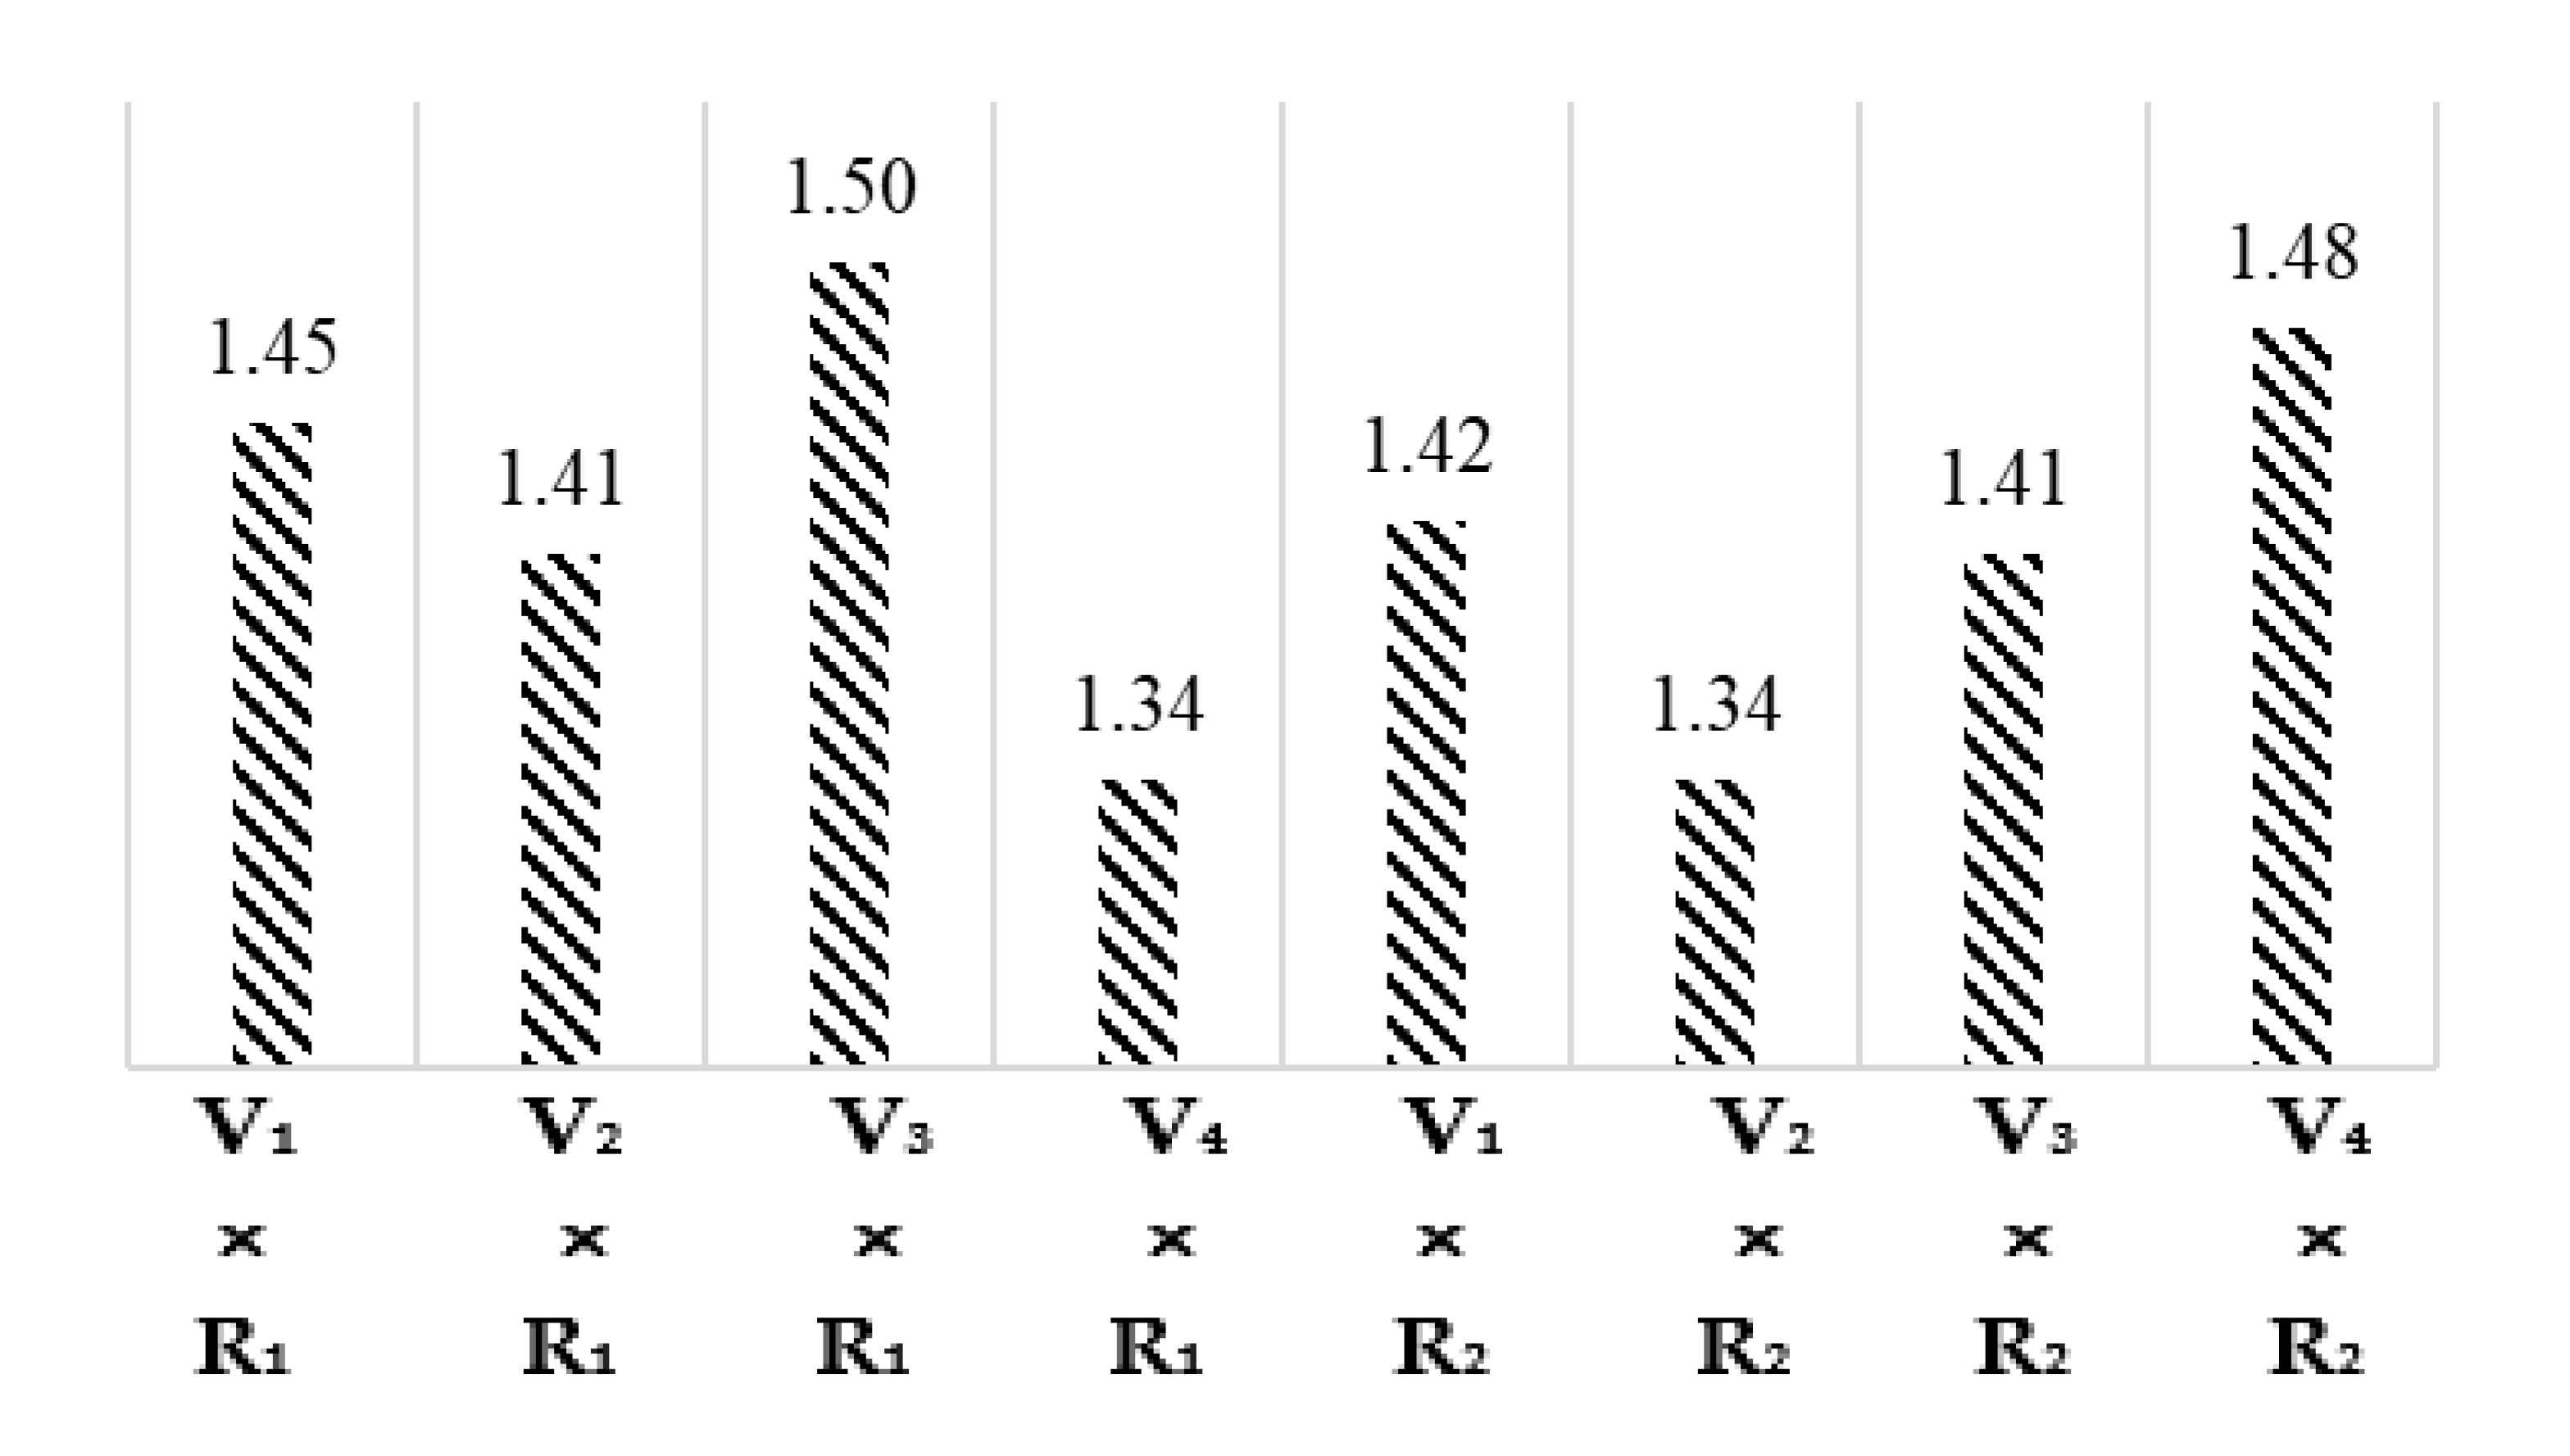
3.5. Wax (%)
3.6. Ash (%)
3.7. Correlation Analysis
4. Conclusions
Author Contributions
Funding
Institutional Review Board Statement
Informed Consent Statement
Data Availability Statement
Acknowledgments
Conflicts of Interest
References
- Council, P.S. In Proceedings of the 53rd meeting of the Special Experts Sub-Committee of the Punjab Seed Corporation, Lahore, Pakistan, 2 June 2007.
- Zeng, L.; Stetina, S.R.; Erpelding, J.E.; Bechere, E.; Turley, R.B.; Scheffler, J. History and current research in the USDA-ARS cotton breeding program at Stoneville, MS. J. Cotton Sci. 2018, 22, 24–35. [Google Scholar]
- Xia, Z.; Xu, W. A review of ring staple yarn spinning method development and its trend prediction. J. Nat. Fibers 2013, 10, 62–81. [Google Scholar] [CrossRef]
- Tan, J.; Tu, L.; Deng, F.; Hu, H.; Nie, Y.; Zhang, X. A genetic and metabolic analysis revealed that cotton fiber cell development was retarded by flavonoid naringenin. Plant Physiol. 2013, 162, 86–95. [Google Scholar] [CrossRef] [PubMed] [Green Version]
- Tang, S.; Teng, Z.; Zhai, T.; Fang, X.; Liu, F.; Liu, D.; Zhang, J.; Liu, D.; Wang, S.; Zhang, K. Construction of genetic map and QTL analysis of fiber quality traits for Upland cotton (Gossypium hirsutum L.). Euphytica 2015, 201, 195–213. [Google Scholar] [CrossRef]
- May, O.L. Quality improvement of upland cotton (Gossypium hirsutum L.). J. Crop Prod. 2002, 5, 371–394. [Google Scholar] [CrossRef]
- ASTM Designation: D-5867-12; Standard Test Methods for Measurement of Physical Properties of Raw cotton by Cotton Classification Instruments. American Society for Testing and Materials: Philadelphia, PA, USA, 2020.
- ASTM Designation: D-1776; Standard Practice for Conditioning and Testing Textiles. American Society for Testing and Materials: Philadelphia, PA, USA, 2020.
- Christensen, R.R. Executive Director’s Report. J. Assoc. Off. Anal. Chem. 1990, 73, 170–171. [Google Scholar] [CrossRef]
- Campbell, B.T.; Dever, J.K.; Hugie, K.L.; Kelly, C.M. Cotton fiber improvement through breeding and biotechnology. In Cotton Fiber: Physics, Chemistry and Biology; Springer: Cham, Switzerland, 2018; pp. 193–215. [Google Scholar]
- Hameed, A. A Comparative Study of Physical Characteristics and Spinning Performance of New Cotton Varieties, CIM-446, CIM-443, FVH-53 with MNH-93. Master’s Thesis, University of Agriculture, Faisalabad, Pakistan, 2000. [Google Scholar]
- Hsieh, Y.-L.; Hu, X.-P.; Wang, A. Single fiber strength variations of developing cotton fibers—strength and structure of G. hirsutum and G. barbedense. Text. Res. J. 2000, 70, 682–690. [Google Scholar] [CrossRef]
- Ali, M.F. Physico-Chemical Characteristics and Spinning Performance Comparison of New Strains NIAB-884, NIAB-814 and NIAB101 with Prevalent NIAB-111 Variety. Master’s Thesis, University of Agriculture, Faisalabad, Pakistan, 2005. [Google Scholar]
- Nazar, A.; Iftikhar, M.; Shahbaz, B.; Ishaq, W. Influence of irrigation water types and stress levels on cotton fiber and yarn quality for different varieties. Pak. J. Agric. Sci. 2012, 49, 597–601. [Google Scholar]
- El Mogahzy, Y.E.; Gowayed, Y. Theory and Practice of Cotton Fiber Selection: Part I: Fiber Selection Techniques and Bale Picking Algorithms. Text. Res. J. 1995, 65, 32–40. [Google Scholar] [CrossRef]
- Liu, Y.; Todd Campbell, B.; Delhom, C. Study to relate mini-spun yarn tenacity with cotton fiber strength. Text. Res. J. 2019, 89, 4491–4501. [Google Scholar] [CrossRef]
- Ahmad, M. Comparative Study of Physical Characteristics and Spinning Performance of Some Early Maturing Varieties NIAB-78, NIAB-Krishma and Late Maturing Varieties FH-634, FH-682. Master’s Thesis, University of Agriculture, Faisalabad, Pakistan, 2000. [Google Scholar]
- Cui, X.L.; Price, J.B.; Calamari, T.A., Jr.; Hemstreet, J.M.; Meredith, W. Cotton wax and its relationship with fiber and yarn properties: Part I: Wax content and fiber properties. Text. Res. J. 2002, 72, 399–404. [Google Scholar] [CrossRef]
- Bange, M.P.; Long, R.L.; Caton, S.J.; Finger, N. Prediction of upland cotton micronaire accounting for the effects of environment and crop demand from fruit growth. Crop Sci. 2022, 62, 397–409. [Google Scholar] [CrossRef]
- Liu, J.; Yang, H.; Hsieh, Y.-L. Variations of mature cotton fiber tensile properties: Association with seed position and fiber length. Text. Res. J. 2001, 71, 1079–1086. [Google Scholar] [CrossRef]
- Brushwood, D.E. Predicting yarn processing performance from the noncellulosic content of raw cottons. Text. Res. J. 2005, 75, 1–5. [Google Scholar] [CrossRef]
- Gipson, J.R.; Joham, H.E. Influence of night temperature on growth and development of cotton (Gossypium hirisutum L.). II. Fiber properties. Agron. J. 1968, 60, 296–298. [Google Scholar] [CrossRef]
- Gipson, J.R.; Ray, L.L. Fiber elongation rates in five varieties of cotton (Gossypium hirisutum L.) as influenced by night temperature. Crop Sci. 1969, 9, 339–341. [Google Scholar] [CrossRef]
- Umar, S. Physico-Chemical Characteristics and Spinning Performance Comparison of New Varieties NIAB-999 and NIAB-111/S with Prevalent NIAB-98, NIAB-Krishma and CRIS-134 Varieties. Master’s Thesis, University of Agriculture, Faisalabad, Pakistan, 2002. [Google Scholar]
- Montalvo, J.G., Jr. Relationships between micronaire, fineness, and maturity. J. Cotton Sci. 2005, 9, 379–392. [Google Scholar]
- Wakelyn, P.J.; Bertoniere, N.R.; French, A.D.; Thibodeaux, D.P.; Triplett, B.A.; Rousselle, A.A.; Goynes, W.R., Jr.; Edwards, J.V.; Hunter, L.; Mcalister, D.D.; et al. Cotton Fiber Chemistry and Technology; CRC Press: Boca Raton, FL, USA, 2007; pp. 11–14. [Google Scholar]
- Wang, Y.; Shu, H.; Chen, B.; McGiffen, M.E.; Zhang, W.; Xu, N.; Zhou, Z. The rate of cellulose increase is highly related to cotton fiber strength and is significantly determined by its genetic background and boll period temperature. Plant Growth Regul. 2009, 57, 203–209. [Google Scholar] [CrossRef]
- Thompson, A.L.; Pauli, D.; Tomasi, P.; Yurchenko, O.; Jenks, M.A.; Dyer, J.M.; Gore, M.A. Chemical variation for fiber cuticular wax levels in upland cotton (Gossypium hirsutum L.) evaluated under contrasting irrigation regimes. Ind. Crops Prod. 2017, 100, 153–162. [Google Scholar] [CrossRef] [Green Version]
- Brushwood, D.E. Changes in non-fibrous material content of cotton during yarn processing. Text. Res. J. 2005, 75, 616–621. [Google Scholar] [CrossRef]
- Hussain, A.A. Comparative Study of Physico-Chemical Characteristics and Spinning Performance of Some Pakistani Cotton Varieties and New Strains Grown at Ayub Agriculture Research Institute (A.A.R.I.), Faisalabad and Cotton Research Station (CRS) Sahiwal. Master’s Thesis, University of Agriculture, Faisalabad, Pakistan, 1994. [Google Scholar]
- Naeem, I.A. Pyhsico-Chemical Studies on MNH-93 and Other Cotton Varieties with Special Reference to Spinning Performance. Master’s Thesis, University of Agriculture, Faisalabad, Paksitan, 1982. [Google Scholar]
- Brushwood, D.E. Metals in Domestic and Non-Domestic Cottons and their Frictional Properties. AATCC Rev. 2002, 2, 20–24. [Google Scholar]


| Cotton Varieties V | Cotton Regions R |
|---|---|
| V1 = CIM-663 | |
| V2 = CIM-678 | R1 = Multan |
| V3 = CIM-785 | R2 = Khanewal |
| V4 = Cyto-535 |
| Source | DF | SS | MS | F | P |
|---|---|---|---|---|---|
| V | 3.0000 | 0.8667 | 0.2889 | 408.2100 | 0.0000 ** |
| R | 1.0000 | 4.6376 | 4.6376 | 6552.7100 | 0.0000 ** |
| V × R | 3.0000 | 0.4743 | 0.1581 | 223.3900 | 0.0000 ** |
| Error | 14.0000 | 0.0099 | 0.0007 | ||
| Total | 21.0000 | 5.9885 |
| Cotton Varieties (V) | Cotton Regions (R) |
|---|---|
| V1 = 27.97 B | |
| V2 = 27.76 C | R1 = 27.60 B |
| V3 = 28.23 A | R2 = 28.48 A |
| V4 = 28.21 A |
| Source | DF | SS | MS | F | P |
|---|---|---|---|---|---|
| V | 3.0000 | 15.1437 | 5.0479 | 1628.3548 | 0.0000 ** |
| R | 1.0000 | 8.9915 | 8.9915 | 2900.4838 | 0.0000 ** |
| V × R | 3.0000 | 1.6967 | 0.5656 | 182.4516 | 0.0000 ** |
| Error | 14.0000 | 0.0437 | 0.0031 | ||
| Total | 21.0000 | 25.8756 |
| Cotton Varieties (V) | Cotton Regions (R) |
|---|---|
| V1 = 28.88 B | |
| V2 = 28.90 B | R1 = 28.55 B |
| V3 = 30.49 A | R2 = 29.76 A |
| V4 = 28.38 C |
| Source | DF | SS | MS | F | P |
|---|---|---|---|---|---|
| V | 3.0000 | 2.0400 | 0.6800 | 1398.2500 | 0.0000 ** |
| R | 1.0000 | 1.8371 | 1.8371 | 3777.5700 | 0.0000 ** |
| V × R | 3.0000 | 0.1629 | 0.0543 | 111.6600 | 0.0000 ** |
| Error | 14.0000 | 0.0068 | 0.0005 | ||
| Total | 21.0000 | 4.0468 |
| Cotton Varieties (V) | Cotton Regions (R) |
|---|---|
| V1 = 4.57 B | |
| V2 = 4.58 B | R1 = 4.84 A |
| V3 = 4.96 A | R2 = 4.29 B |
| V4 = 4.14 C |
| Source | DF | SS | MS | F | P |
|---|---|---|---|---|---|
| V | 3.0000 | 181.0800 | 60.3593 | 1200.5500 | 0.0000 ** |
| R | 1.0000 | 17.3100 | 17.3100 | 384.5000 | 0.0000 ** |
| V × R | 3.0000 | 198.6000 | 66.1900 | 1470.8000 | 0.0000 ** |
| Error | 14.0000 | 0.0099 | 0.0007 | ||
| Total | 21.0000 | 397.6420 |
| Cotton Varieties (V) | Cotton Regions (R) |
|---|---|
| V1 = 89.25 C | |
| V2 = 90.71 B | R1 = 89.85 B |
| V3 = 95.10 A | R2 = 91.55 A |
| V4 = 87.75 D |
| Source | DF | SS | MS | F | P |
|---|---|---|---|---|---|
| V | 3.0000 | 0.0340 | 0.0110 | 916.0000 | 0.0000 ** |
| R | 1.0000 | 0.0037 | 0.0037 | 300.0000 | 0.0000 ** |
| V × R | 3.0000 | 0.0330 | 0.0110 | 900.0000 | 0.0000 ** |
| Error | 14.0000 | 0.0001 | 0.0000 | ||
| Total | 21.0000 | 0.0708 |
| Cotton Varieties (V) | Cotton Regions (R) |
|---|---|
| V1 = 0.59 D | |
| V2 = 0.63 B | R1 = 0.64 A |
| V3 = 0.60 C | R2 = 0.62 B |
| V4 = 0.69 A |
| Source | DF | SS | MS | F | P |
|---|---|---|---|---|---|
| V | 3.0000 | 0.0220 | 0.0074 | 1772.0000 | 0.0000 ** |
| R | 1.0000 | 0.0011 | 0.0011 | 256.0000 | 0.0000 ** |
| V × R | 3.0000 | 0.0500 | 0.0170 | 4008.0000 | 0.0000 ** |
| Error | 14.0000 | 0.0003 | 0.0004 | ||
| Total | 21.0000 | 0.0734 |
| Cotton Varieties (V) | Cotton Regions (R) |
|---|---|
| V1 = 1.44 B | |
| V2 = 1.37 D | R1 = 1.43 A |
| V3 = 1.46 A | R2 = 1.41 B |
| V4 = 1.41 C |
| Fiber Length | Fiber Strength | Micronaire | Cellulose (%) | Wax (%) | Ash (%) | |
|---|---|---|---|---|---|---|
| Fiber Length | 1 | 0.683 ** | −0.675 ** | 0.091 | −0.241 | −0.298 |
| Fiber Strength | 1 | −0.021 | 0.539 ** | −0.578 ** | −0.212 | |
| Micronaire | 1 | 0.317 | 0.028 | 0.433 * | ||
| Cellulose (%) | 1 | −0.529 ** | 0.104 | |||
| Wax (%) | 1 | 0.453 * | ||||
| Ash (%) | 1 |
Publisher’s Note: MDPI stays neutral with regard to jurisdictional claims in published maps and institutional affiliations. |
© 2022 by the authors. Licensee MDPI, Basel, Switzerland. This article is an open access article distributed under the terms and conditions of the Creative Commons Attribution (CC BY) license (https://creativecommons.org/licenses/by/4.0/).
Share and Cite
Hussain, A.; Sajid, M.; Iqbal, D.; Sarwar, M.I.; Farooq, A.; Siddique, A.; Khan, M.Q.; Kim, I.-S. Impact of Novel Varietal and Regional Differences on Cotton Fiber Quality Characteristics. Materials 2022, 15, 3242. https://doi.org/10.3390/ma15093242
Hussain A, Sajid M, Iqbal D, Sarwar MI, Farooq A, Siddique A, Khan MQ, Kim I-S. Impact of Novel Varietal and Regional Differences on Cotton Fiber Quality Characteristics. Materials. 2022; 15(9):3242. https://doi.org/10.3390/ma15093242
Chicago/Turabian StyleHussain, Azmat, Muhammad Sajid, Danish Iqbal, Muhammad Ilyas Sarwar, Assad Farooq, Amna Siddique, Muhammad Qamar Khan, and Ick-Soo Kim. 2022. "Impact of Novel Varietal and Regional Differences on Cotton Fiber Quality Characteristics" Materials 15, no. 9: 3242. https://doi.org/10.3390/ma15093242
APA StyleHussain, A., Sajid, M., Iqbal, D., Sarwar, M. I., Farooq, A., Siddique, A., Khan, M. Q., & Kim, I.-S. (2022). Impact of Novel Varietal and Regional Differences on Cotton Fiber Quality Characteristics. Materials, 15(9), 3242. https://doi.org/10.3390/ma15093242