

Investigations on Fatigue Life of Tube Connections Based on International Codes of Pressure Vessel

Abstract
:1. Introduction
2. Current Approaches to Fatigue Life Assessment in Codes
2.1. Elastic Stress Analysis and Equivalent Stresses-Method 1
2.2. Elastic–Plastic Stress Analysis and Equivalent Strains-Method 2
2.3. Fatigue Assessment of Welds—Elastic Analysis and Structural Stress—Method 3
2.4. Detailed Assessment of Fatigue Life-Method 4
3. Differences and Similarities
3.1. Design Principles and Assessment Parameters
3.2. Fatigue Design Curve
3.3. Welding Material
3.4. Correction Coefficient
- (a)
- Plastic correction. In Method 1, the fatigue loss coefficient Ke is introduced to consider the influence of the plastic. Method 2 is about the elastic–plastic analysis. The stable cycle stress–strain curve is applied to analyze the material property, and the plastic correction coefficient is no longer considered because the influence of the material in the plastic stage has been calculated. In Method 3, the Formulas are determined by the Neubers principle and the stress–strain curve model of the material hysteretic property, which is applied to calculate the corresponding local nonlinear structural stress and strain range. On this basis, the calculated structural stress range should be corrected for low cycle fatigue. According to Method 4, for both the weld and the unwelded, if the calculated nominal elastic structural stress range exceeds twice the yield stress of the material, the plastic correction coefficient Ke (referring to the mechanical load) or Kν (referring to the thermal load) should be considered. For the results obtained by the elastic–plastic analysis in Method 4, if the total strain range (including the elastic and plastic strain) caused by all the loads is known, then the plastic correction is unnecessary.
- (b)
- Thickness correction. In Methods 1 and 2, the fatigue curves of the smooth specimens are applied, so the thickness correction has been included in the curves. In Method 3, the corresponding parameter is applied to the formula to analyze the influence of the thickness. Method 4 defines the calculation method of the thickness correction coefficient for the weldments, unweldments and bolts. The formula of the thickness correction coefficient of the non-weldments involves the unknown allowable load cycle, so the calculation needs a hypothesis for the iterative computations, which greatly increases the complexity of the computation [18].
- (c)
- Temperature correction. There are usually differences between the design temperature of the vessel and the test temperature of the fatigue design curve, which will influence the assessment of the actual allowable life. In the ASME VIII-2, based on the ratio between the elasticity modulus of the specimen material at the test temperature (the environment temperature) of the design fatigue curve and the elasticity modulus of the specimen material at the design temperature, the allowable cycle index is adjusted. Method 4 determines the calculation method of the coefficient for temperature correction to the weldments, non-weldments and bolts. In the design, we should consider that the strength of the metal at high temperatures is reduced, and creep failure may be caused when the temperature is too high; low temperature can improve the fatigue strength of metal materials to a certain extent, but at the same time, it will also reduce the toughness of the material and increase the brittleness, so too-high temperature and too-low temperature are harmful to fatigue.
- (d)
- Mean stress correction. In Method 1 and Method 2, the fatigue curve of the smooth specimen is adopted, and the mean stress correction is included in the curves. In Method 3, the relevant parameter is applied to evaluate the influence of the thickness in the formula. Similar to Method 1 and Method 2, the influence of the mean stress is involved in the fatigue design curve of the weld in Method 4; however, for the unweld, the corrections are made separately according to the absolute value of the maximum stress and the range of stress. It uses the full mean stress correction under the purely elastic state and the reducing mean stress correction under the shakedown elastic–plastic state. Under the cyclic plastic state, the plastic correction is considered instead of the mean stress correction. The mean stress correction coefficient is related to the yield strength, the tensile strength, the maximum stress, the stress range, the mean stress, the allowable cycle number, etc., where the initial value for the iteration needs to be assumed.
- (e)
- Surface treatment correction. For the three methods in ASME VIII-2, the correction factor of 20 for the number of cycles accounts for factors that actually affect the fatigue life but have not been considered in tests, including surface correction factors. In Method 4, the smooth standard specimen is applied to the assessment of the unweld, but it does not resemble the structure in the real world. Thus, the correction coefficient of the surface roughness is introduced to the assessment. Similar to the calculation of the thickness correction coefficient, because of the unknown allowable cycle number, iterative computation is required in the assessment, which makes the computation more complex [19].
3.5. Histogram Development and Cycle Counting
3.6. Linear Fatigue Damage Cumulation
3.7. Strength Theory
4. Finite Element Analysis of Opening Tubing Connection
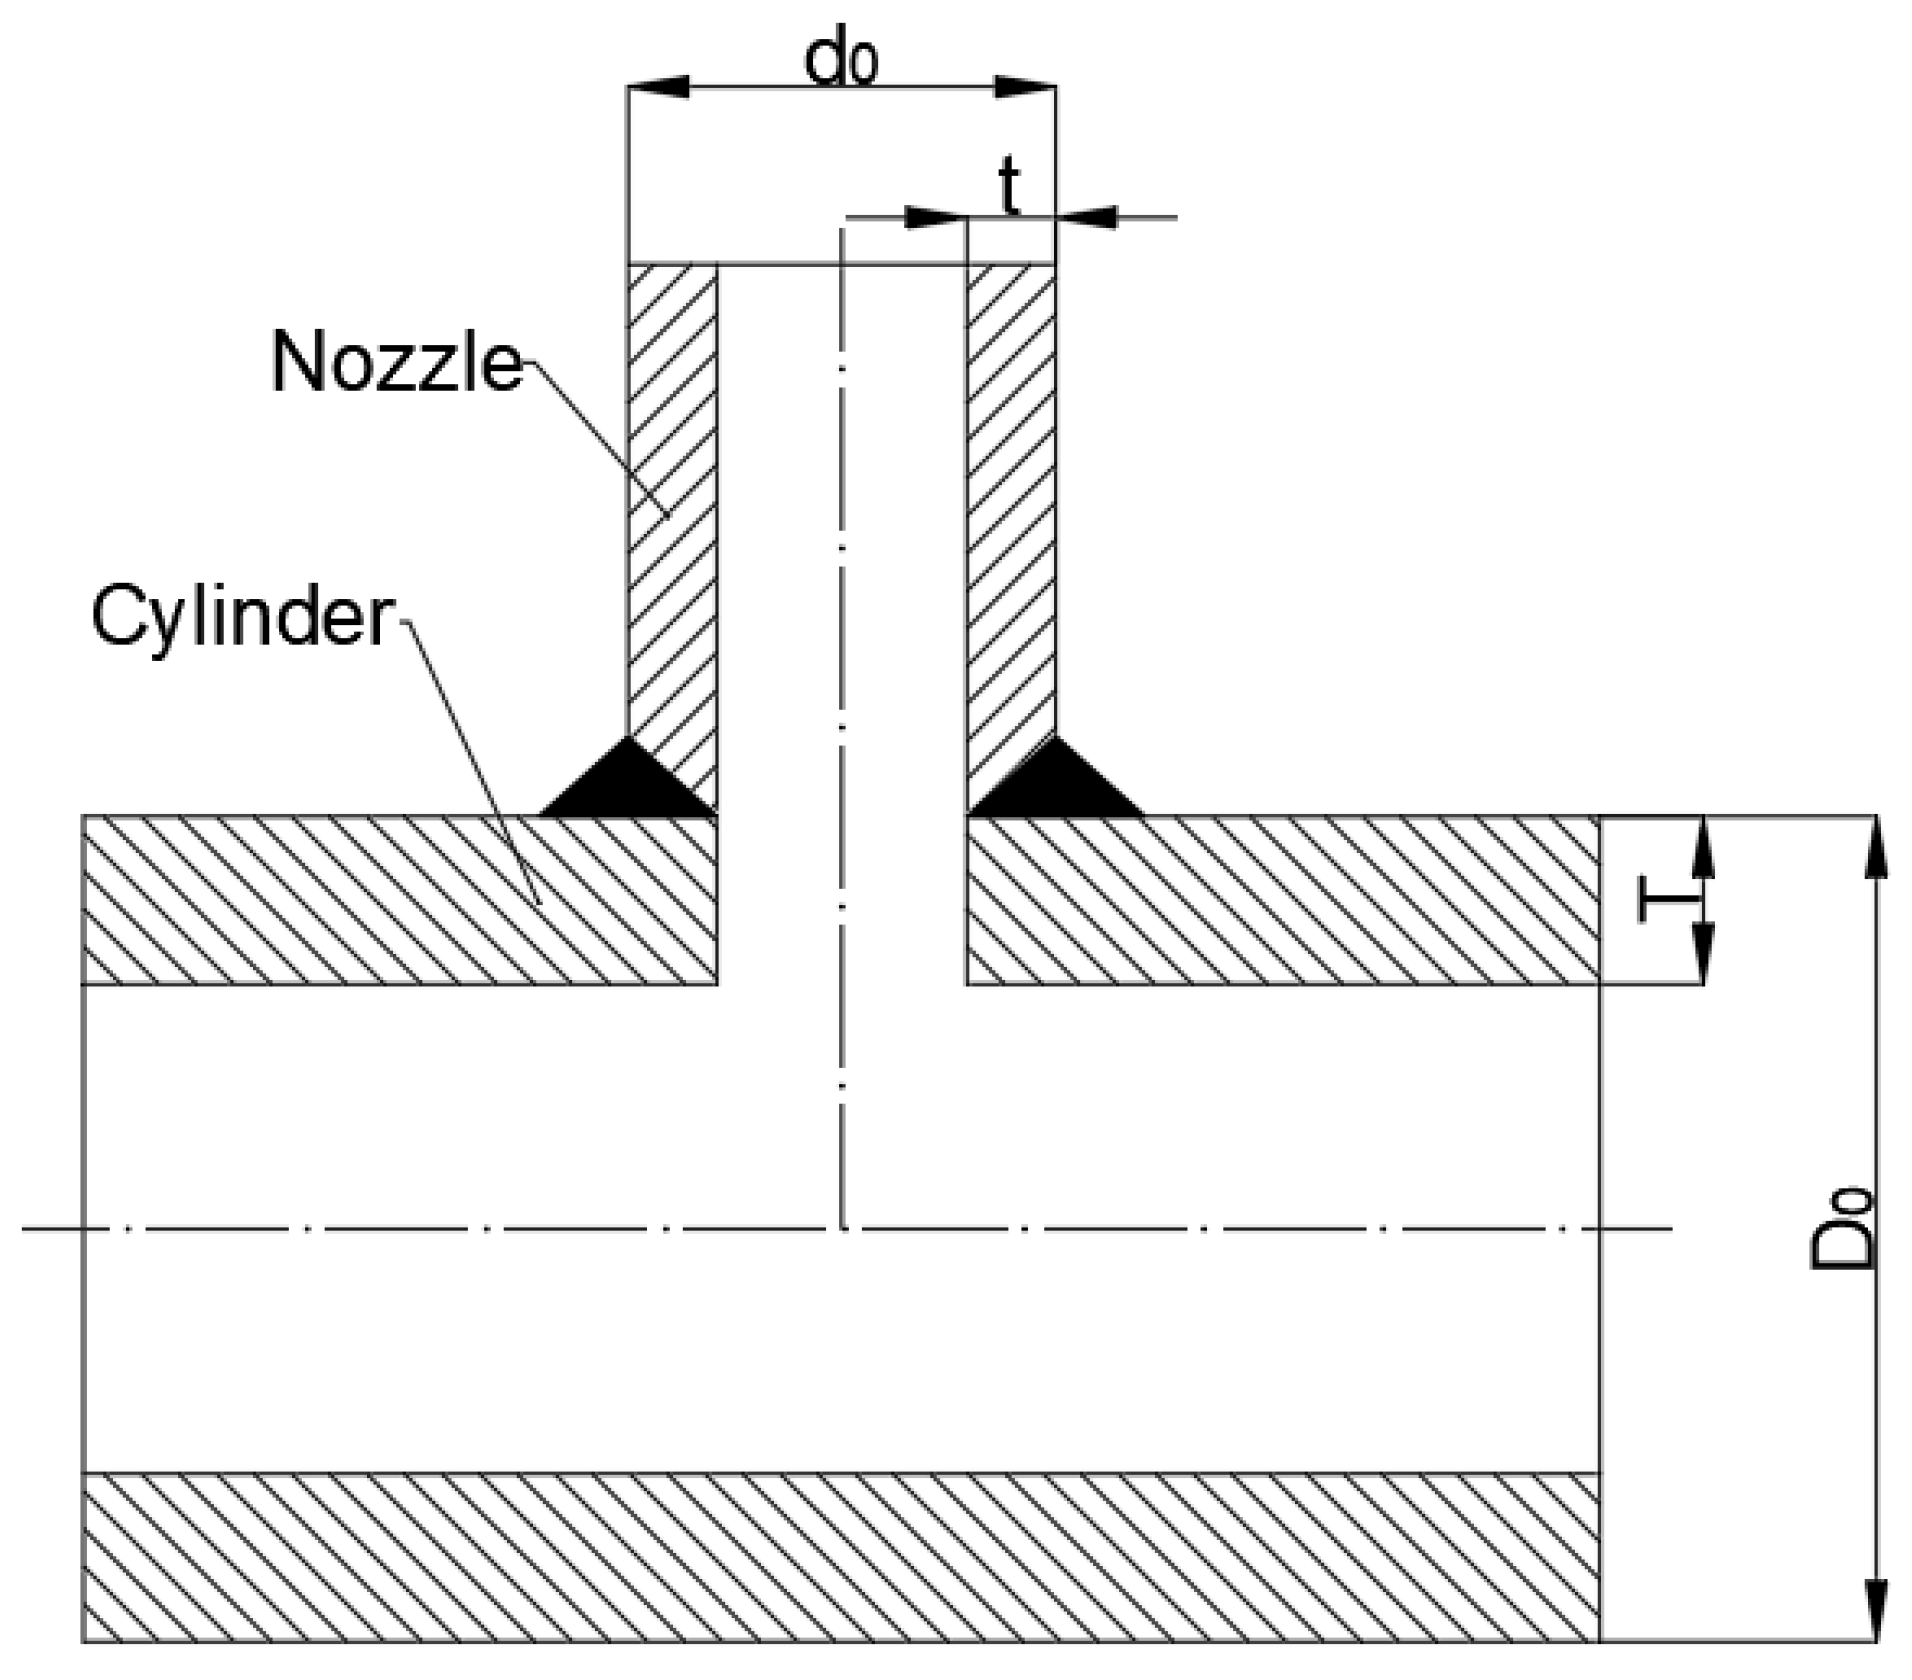
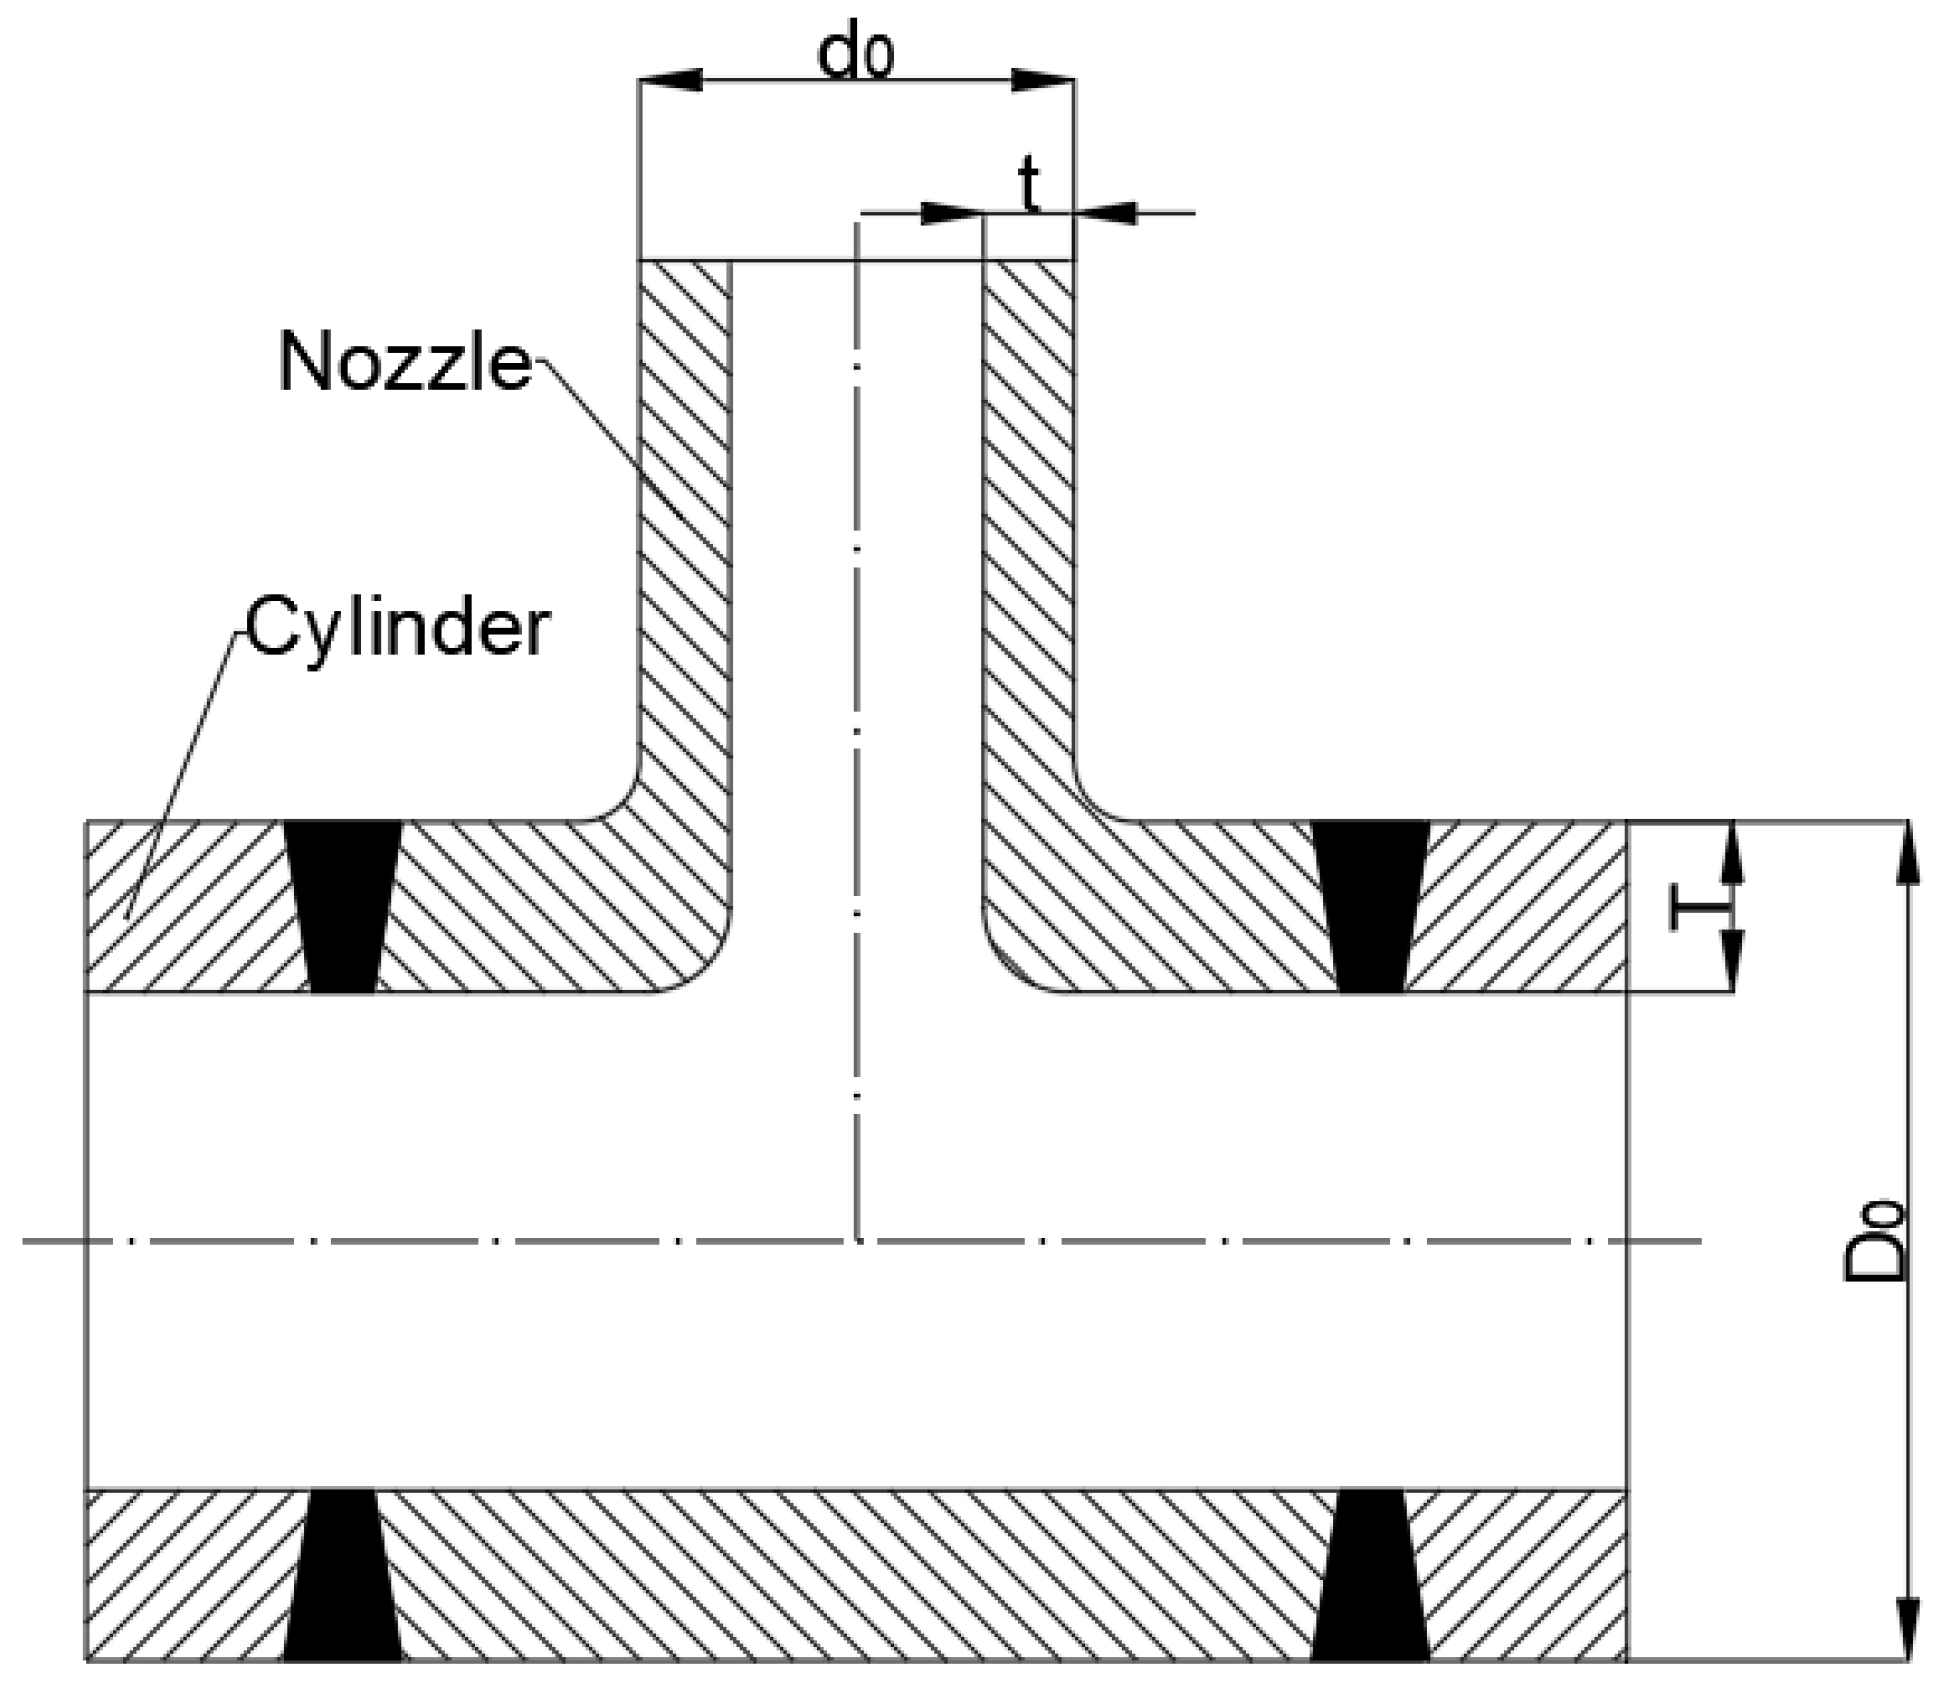
4.1. Structure Dimension and Design Parameter
4.2. Finite Element Model
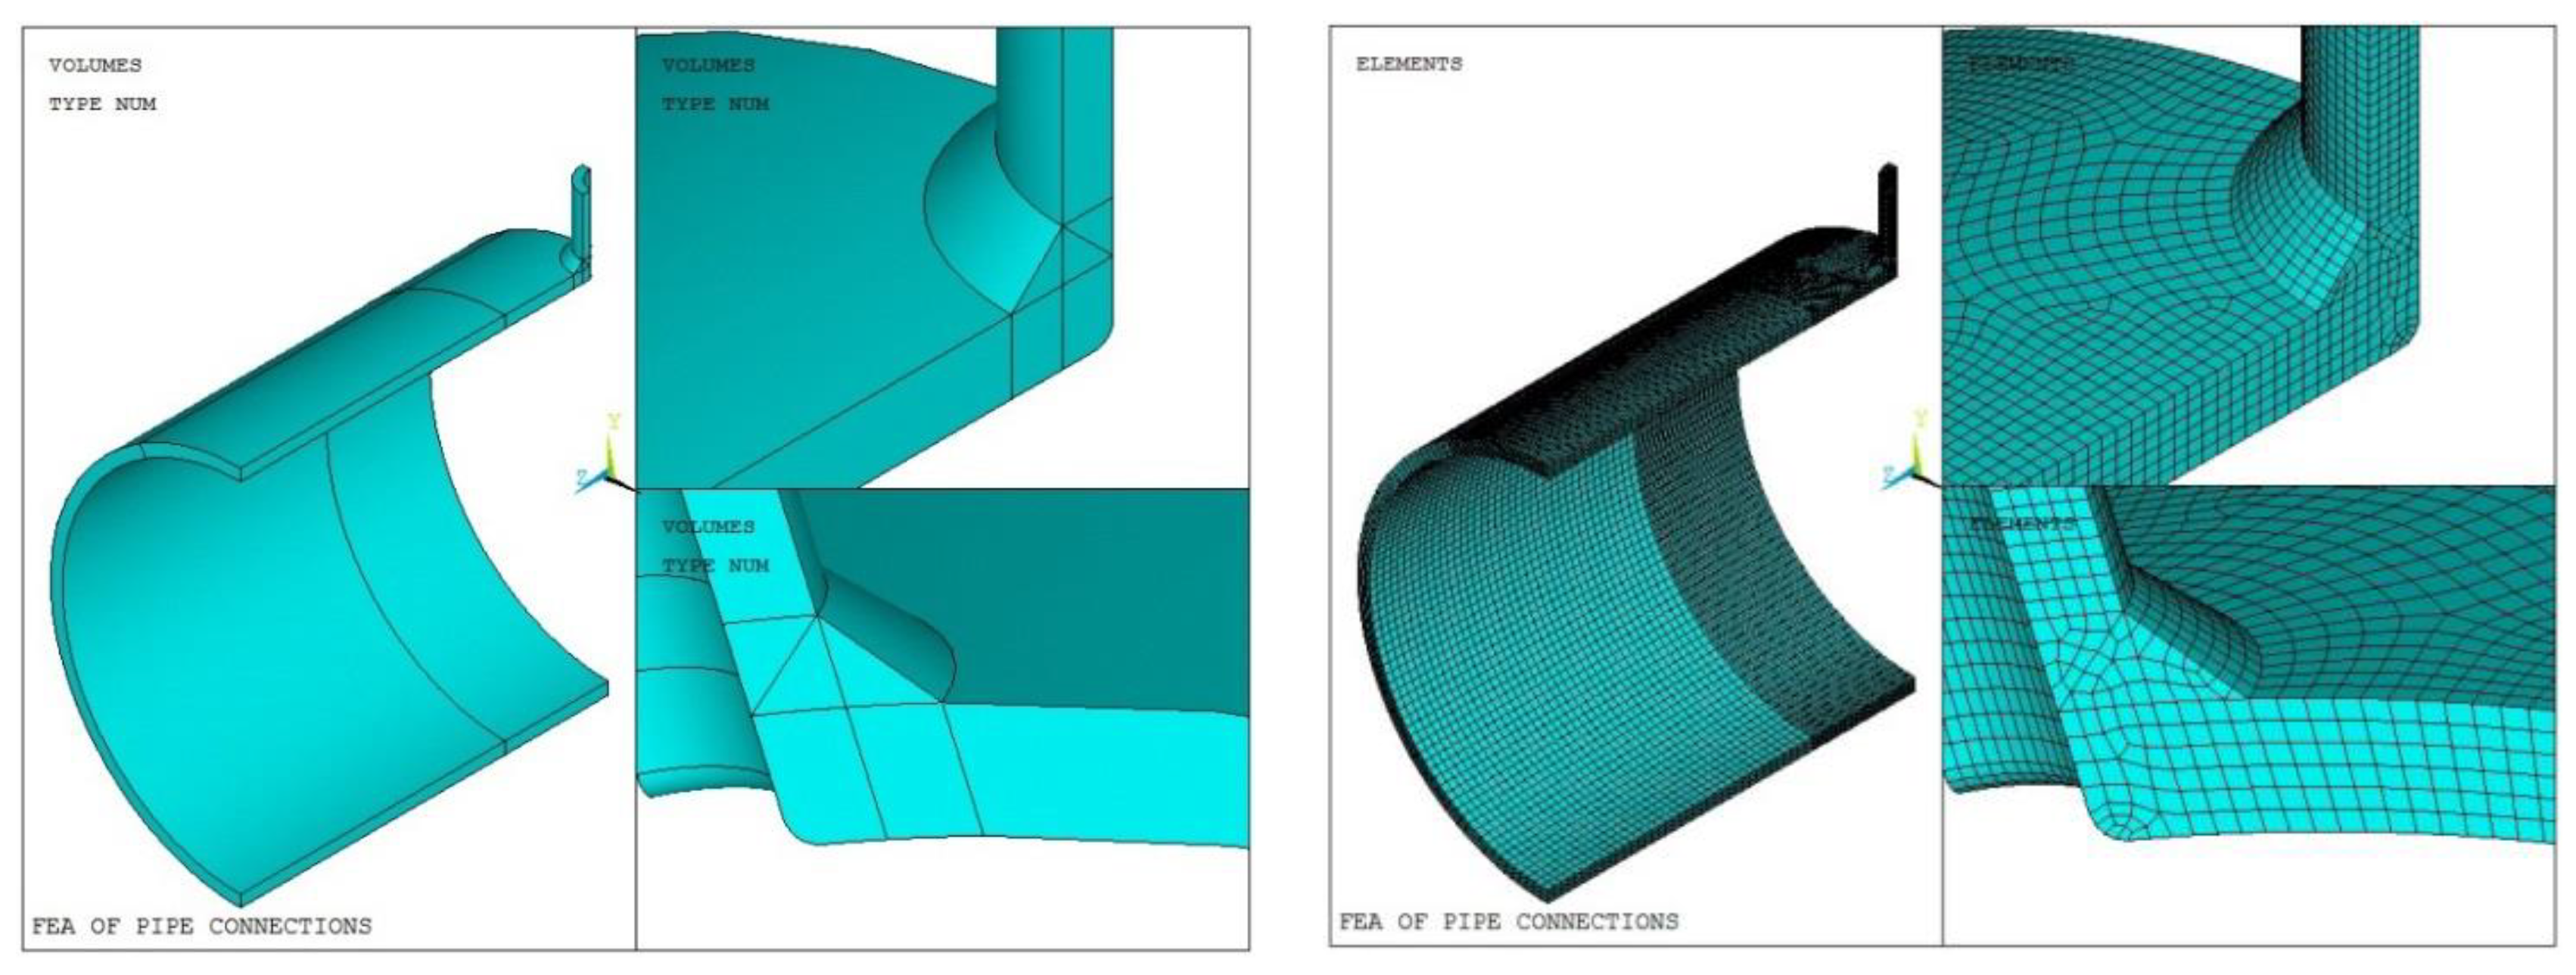
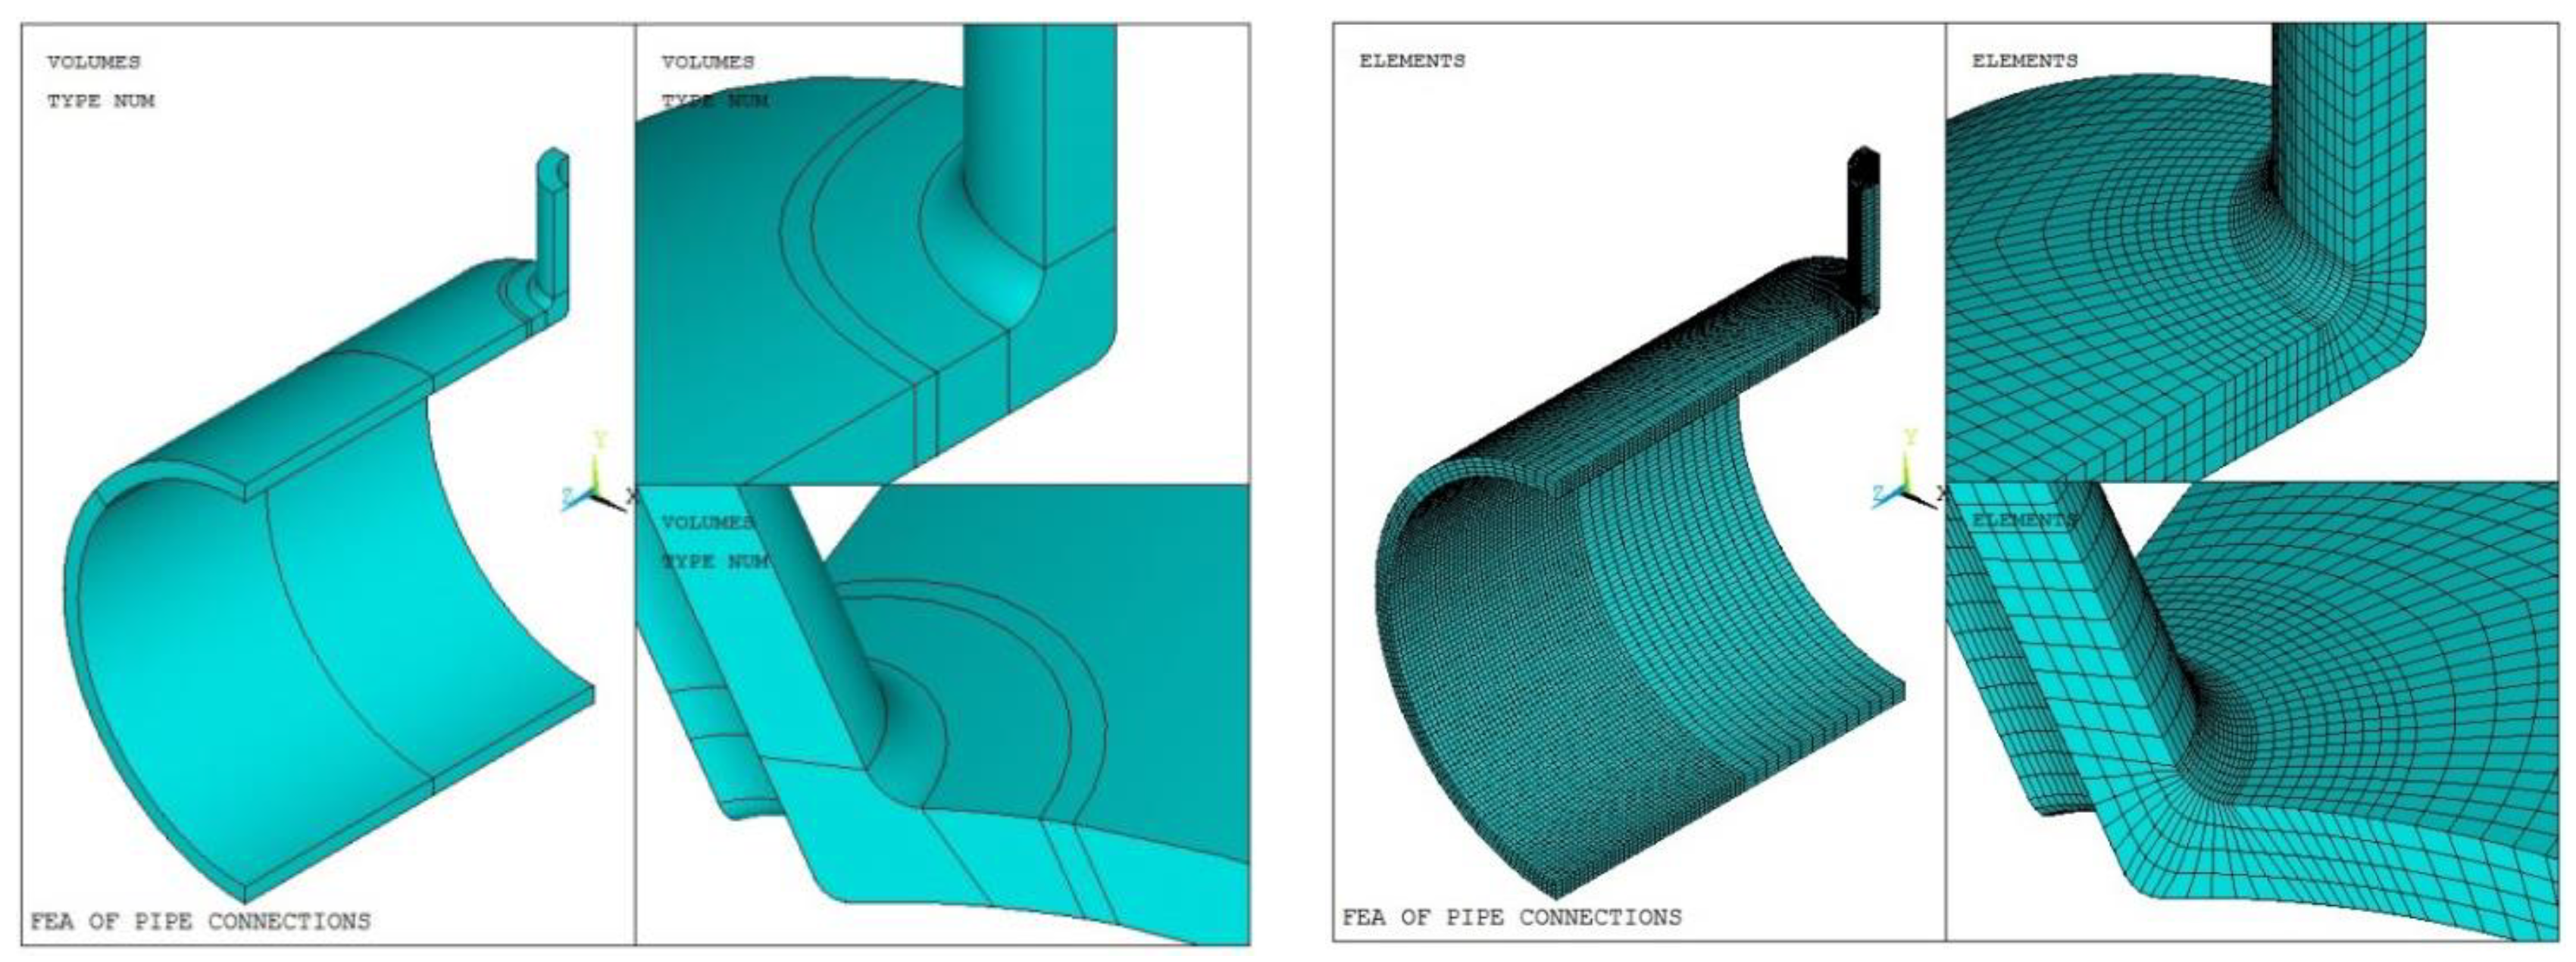
4.2.1. Models and Grids
4.2.2. Loads and Boundary Conditions
- (1)
- Apply the symmetry constraint to the symmetry plane.
- (2)
- In order to avoid the global displacement of the model, the displacement of the Y-direction at the end face of the nozzle is restricted.
- (3)
- Apply the pressure to the internal surface of the model.
- (4)
- Apply the equivalent end force to the shell end: The end force is expressed as the uniform pressure acting on the shell end, which is equal to the axial force generated by the internal pressure at the shell end face, divided by the cylinder cross-sectional area.
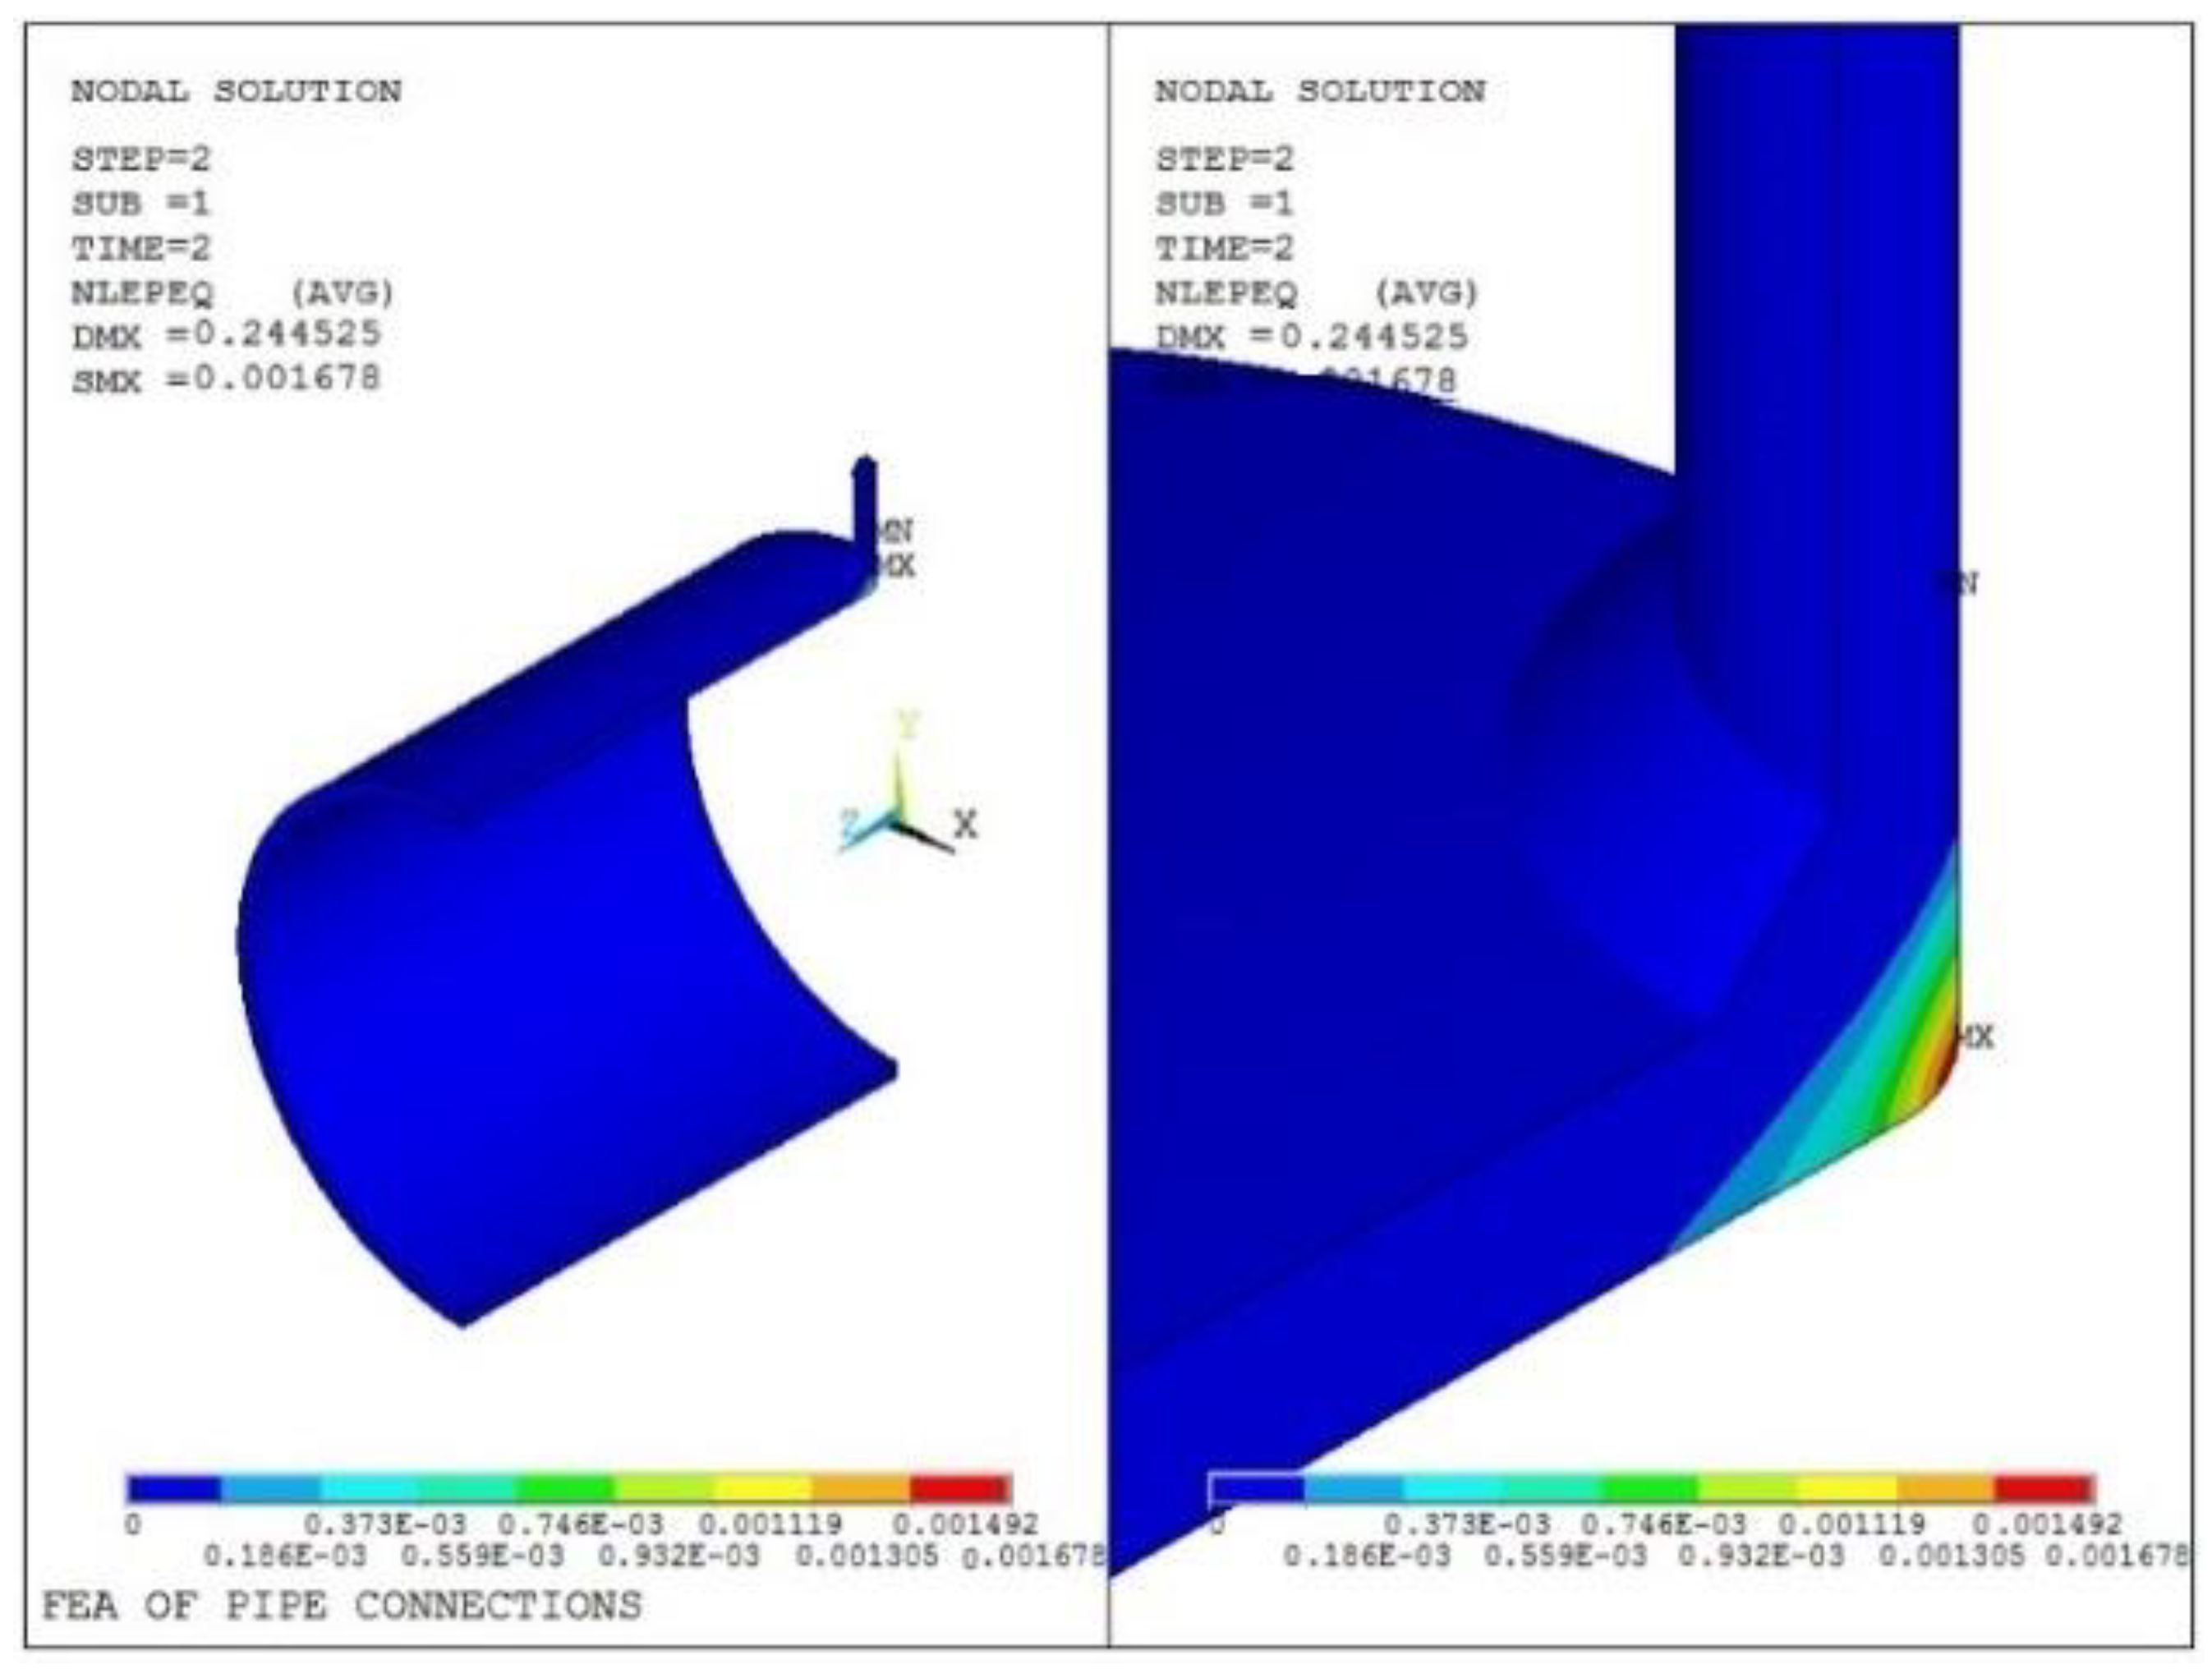
4.3. Finite Element Calculation Results
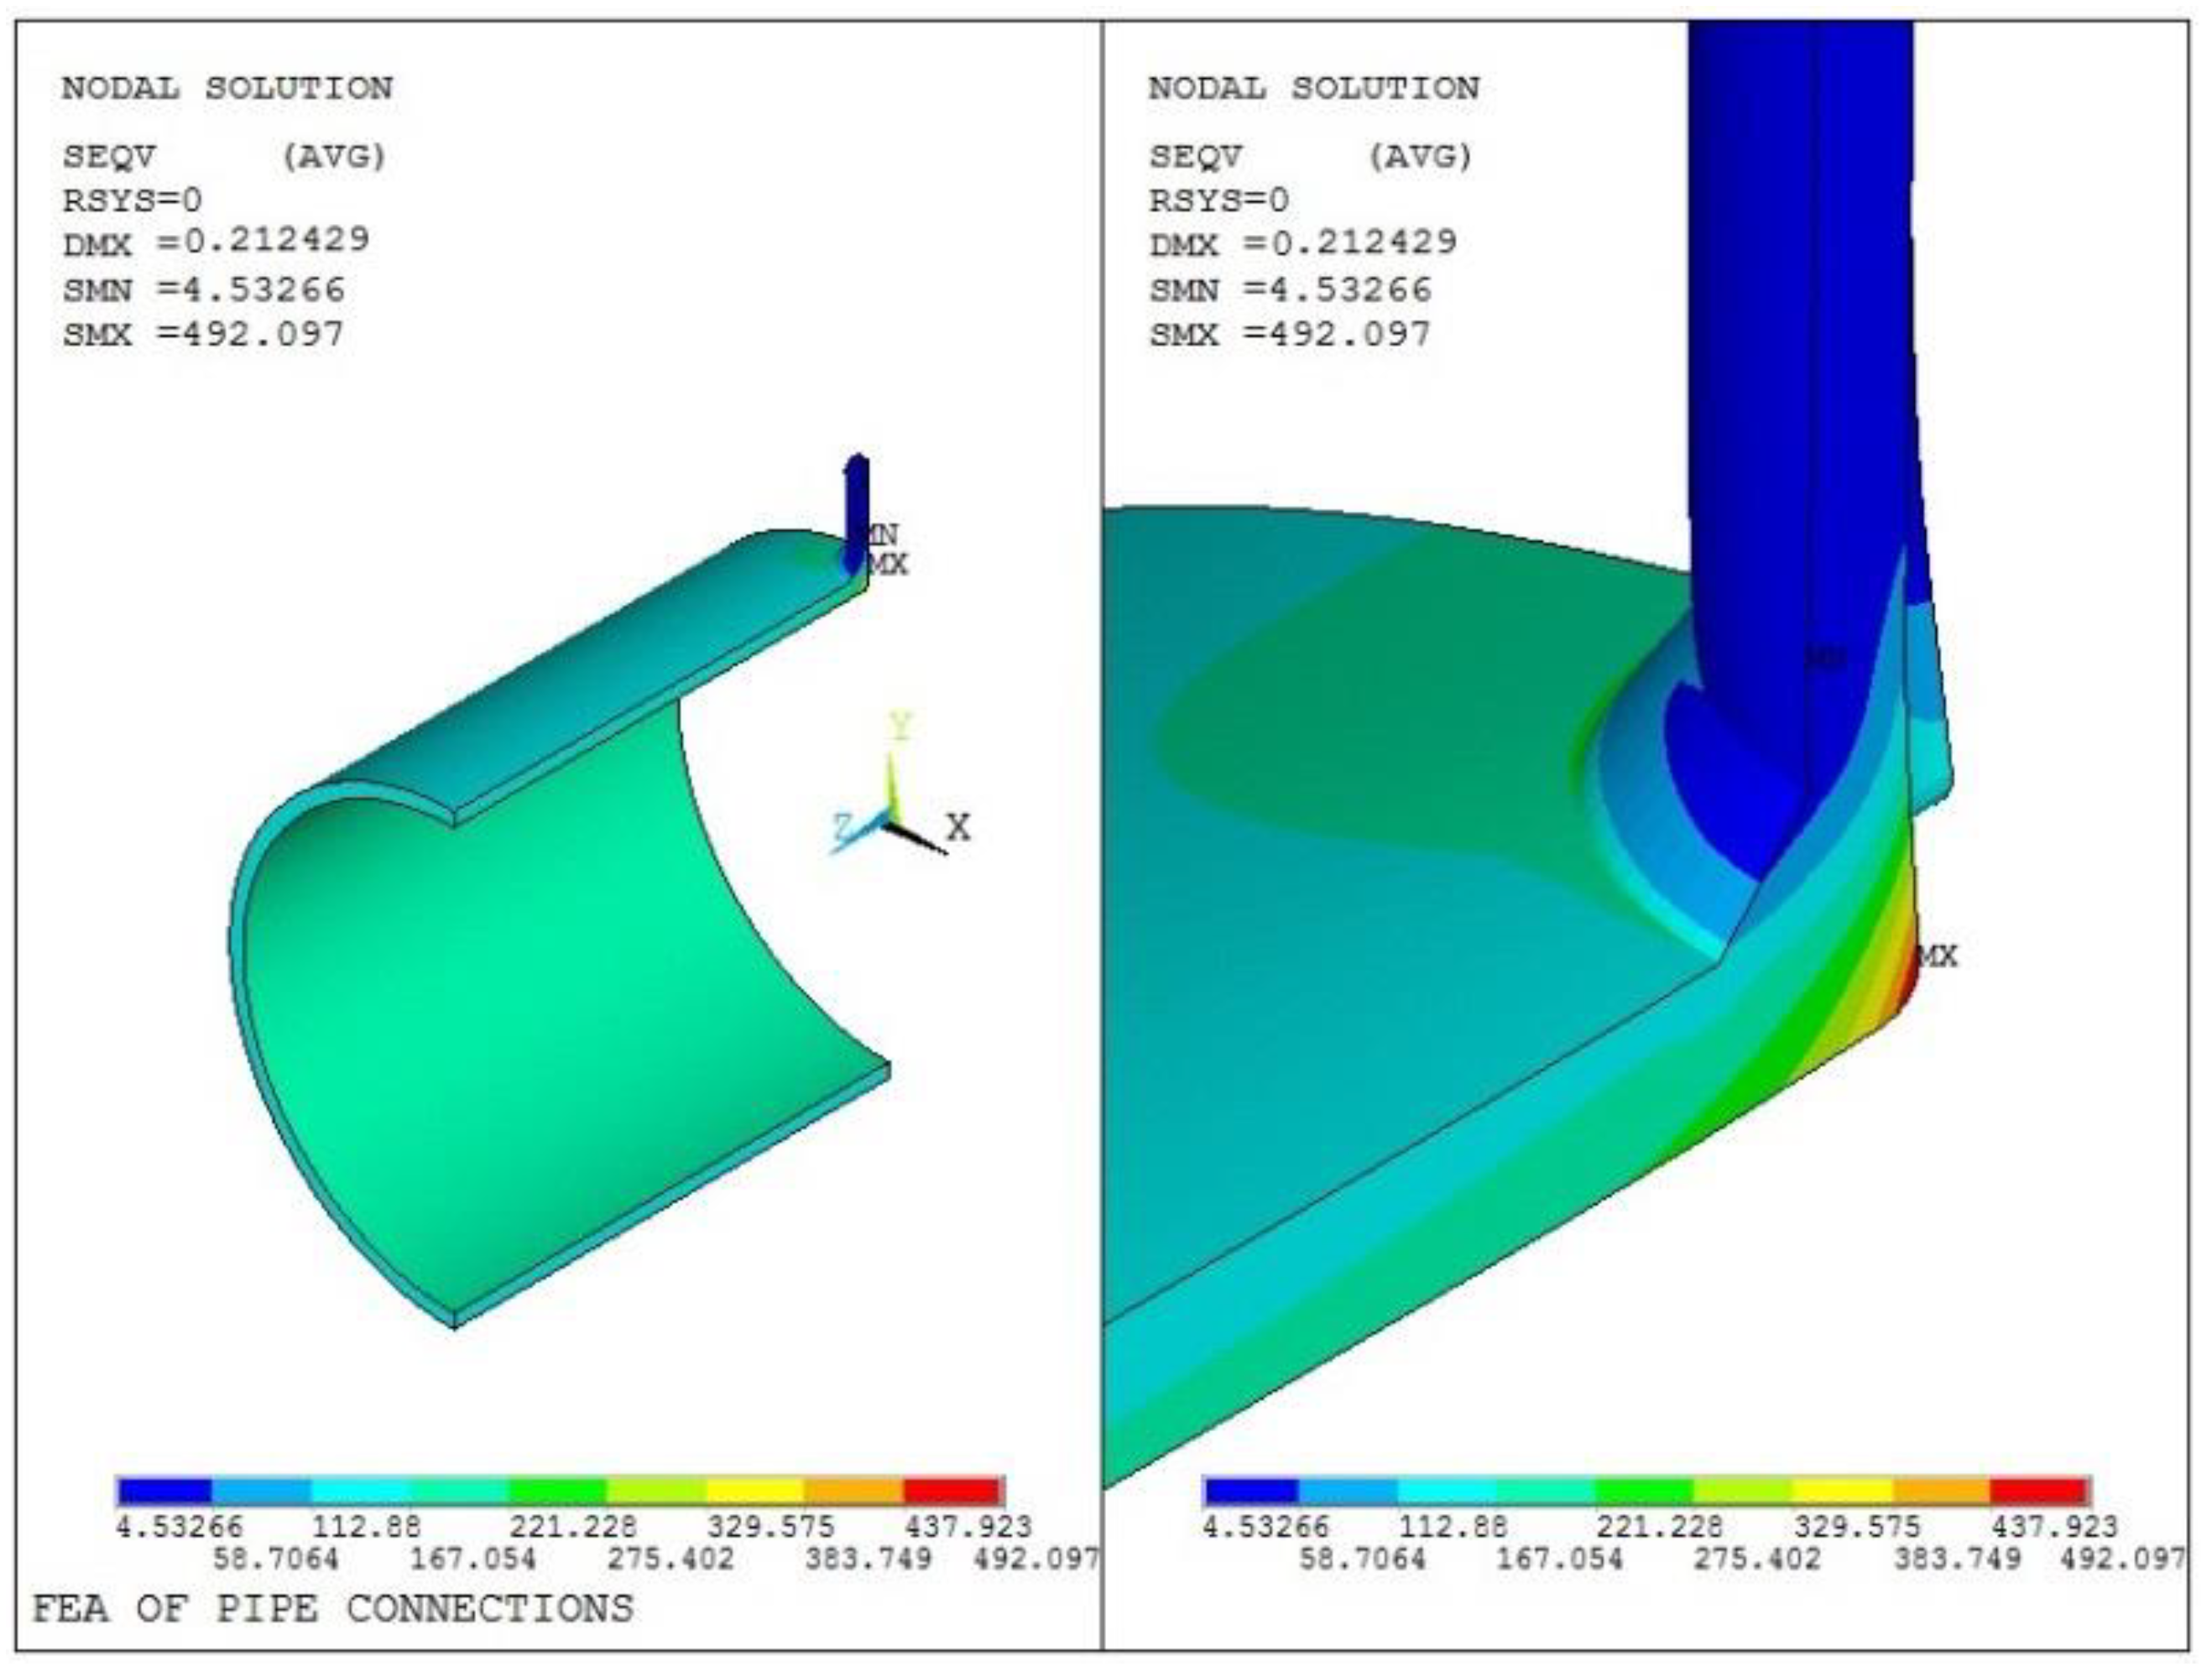
4.3.1. Elastic Stress Calculation
4.3.2. Elastic–Plastic Stress Calculation
4.3.3. Stress Intensity Analysis
5. Fatigue Evaluation Result and Analysis
5.1. Evaluation Results of Table 3
5.2. Evaluation Results of Table 4
5.3. Evaluation Results of Table 5
5.4. Result Analysis
6. Conclusions
- (1)
- For the calculation of the elastic stress, Method 1 adopts the effective total equivalent stress amplitude for assessing the fatigue damage. Method 1 is the most widely used traditional method and can be used in both welded structure and un-welded structures. This method has simple operation, safety and reliability.
- (2)
- For the elastic–plastic calculation, Method 2 adopts the effective strain range for assessing the fatigue damage and can be used in both the welded structure and the unwelded structure. This method is with high accuracy, good stability, safety and reliability, but it is difficult to obtain the stable stress–strain cyclic curves of the corresponding materials. Furthermore, the elastic–plastic analysis is very complicated.
- (3)
- For the calculation of the elastic stress, Method 3 adopts the equivalent structure stress for assessing the fatigue damage. This method is applied for the fatigue assessment of the welded. It is suggested to be used for the welded joint without mechanical processing. This method is developed under fracture mechanics, but it is still conservative and unstable, and the procedure is very complicated.
- (4)
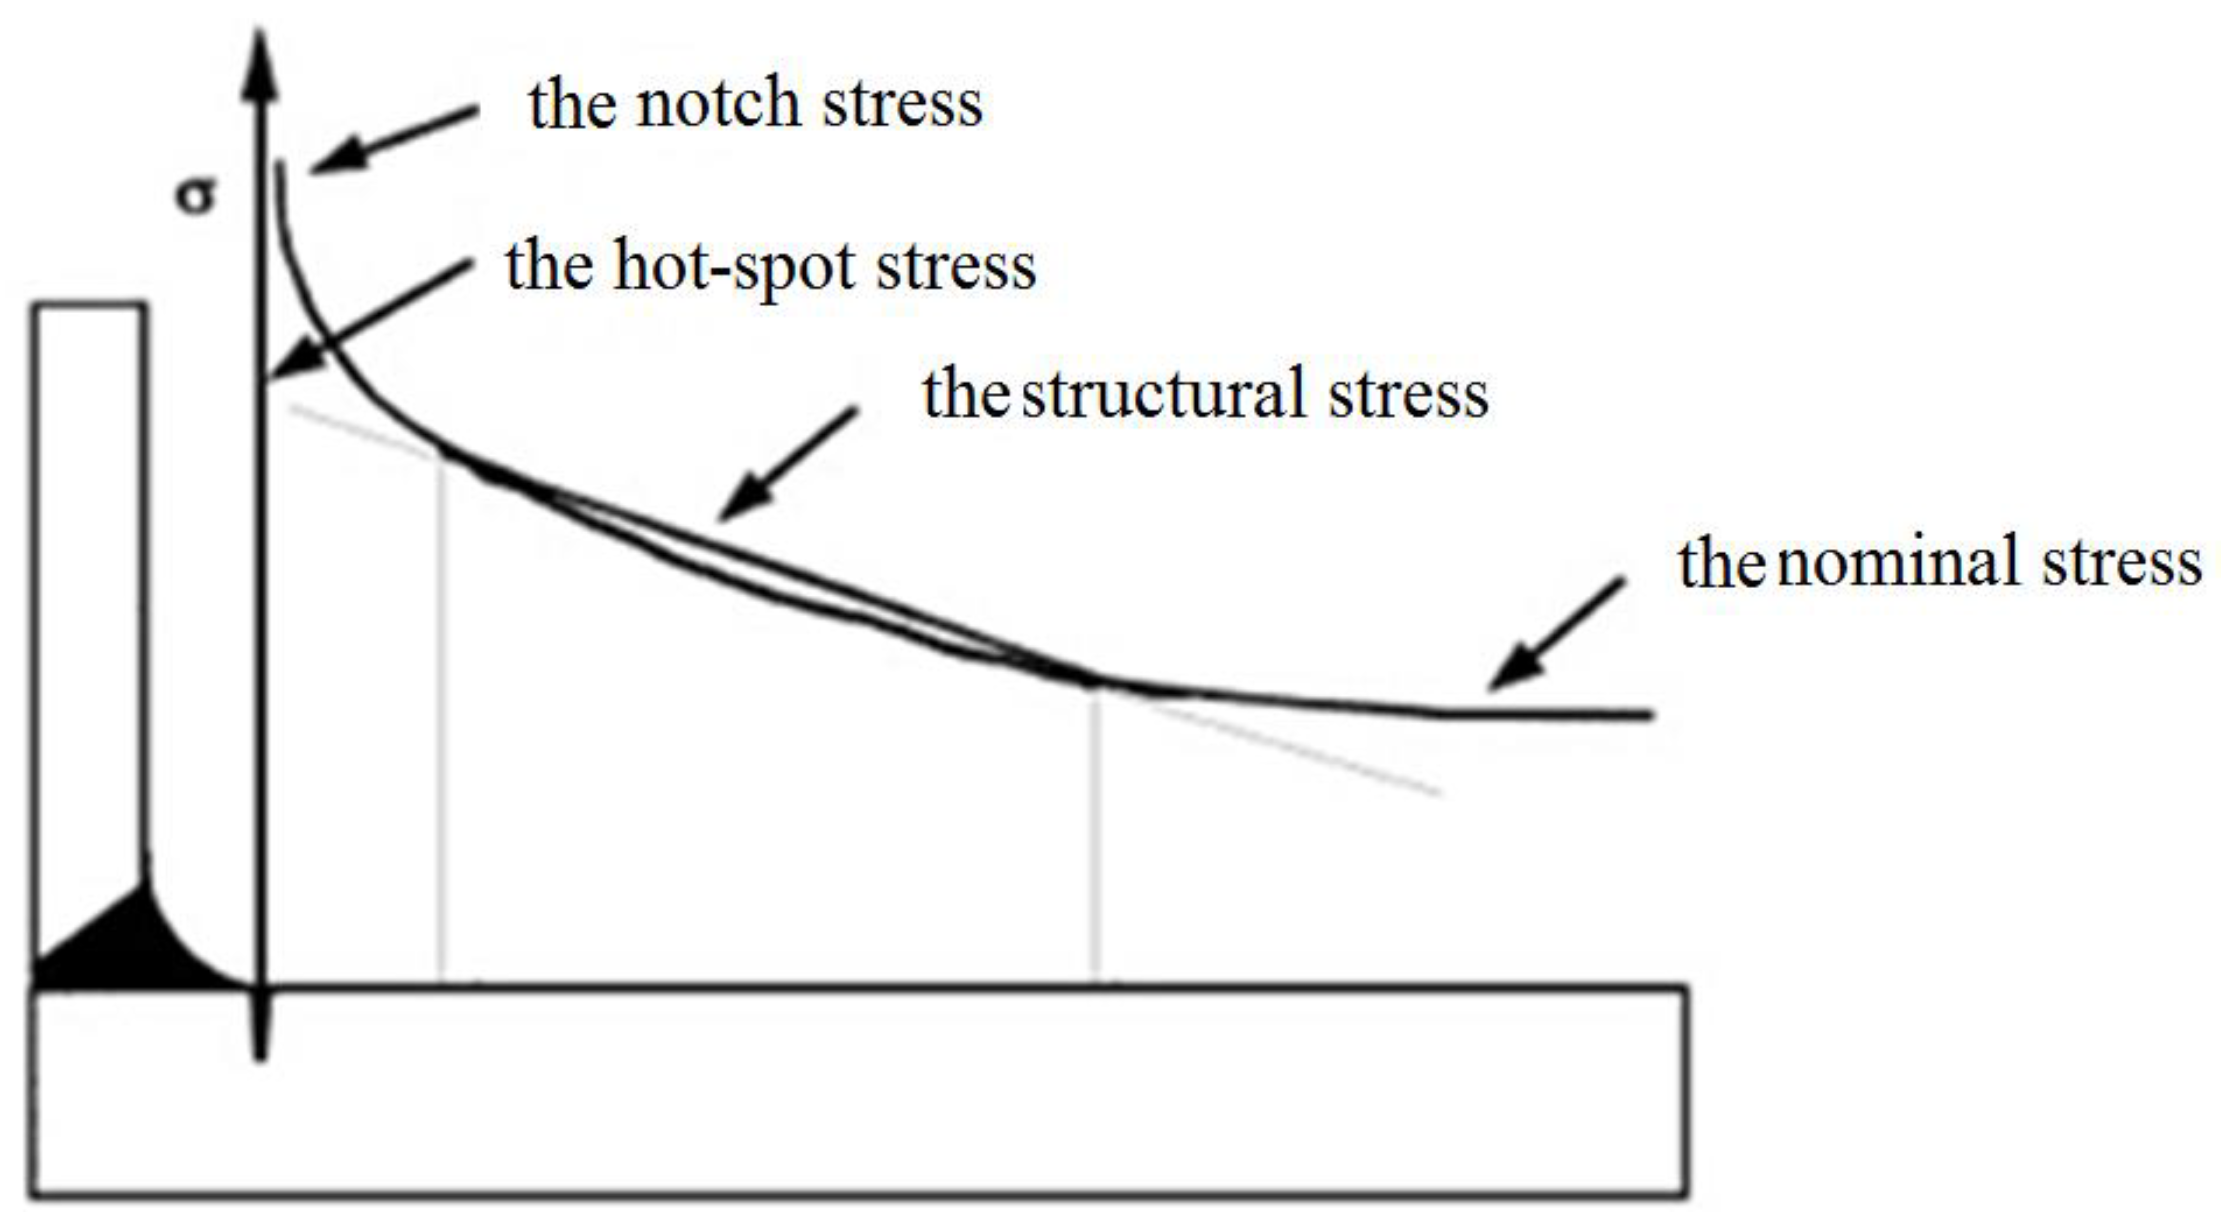
- In Method 4, the detailed assessing procedure is performed separately for the welded and unwelded. For the welded, Method 4 applies the hot-spot stress obtained from the principal stress by the extrapolation for the assessment. For the unweldment, it applies the notch stress as the assessment parameter. The iterative calculations are required. This method is the most accurate, stable and reliable.
Author Contributions
Funding
Institutional Review Board Statement
Informed Consent Statement
Data Availability Statement
Conflicts of Interest
References
- Xiao, H.; Hu, W.; Zhang, M.; Meng, Q. Post-buckling damage analysis and fatigue life prediction of thin plate. J. Beijing Univ. Aeronaut. Astronaut. 2015, 41, 523–529. [Google Scholar]
- Pierce, S.O.; Evans, J.L. Failure analysis of a metal bellows flexible hose subjected to multiple pressure cycles. Eng. Fail. Anal. 2012, 22, 11–20. [Google Scholar] [CrossRef]
- Ma, K.; Zheng, J.Y.; Hua, Z.L.; Gu, C.H.; Zhang, R.M.; Liu, Y.Y. Hydrogen assisted fatigue life of Cr-Mo steel pressure vessel with coplanar cracks based on fatigue crack growth analysis. Int. J. Hydrog. Energy 2020, 45, 20132–20141. [Google Scholar] [CrossRef]
- Mayer, H.; Stark, H.L.; Ambrose, S. Review of fatigue design procedures for pressure vessels. Int. J. Press. Vessels Pip. 2000, 77, 775–781. [Google Scholar] [CrossRef]
- Niu, X.P.; Zhu, S.P.; He, J.C.; Ai, Y.; Shi, K.K.; Zhang, L.P. Fatigue reliability design and assessment of reactor pressure vessel structures: Concepts and validation. Int. J. Fatigue 2021, 153, 106524. [Google Scholar] [CrossRef]
- Giglio, M. Fatigue analysis of different types of pressure vessel nozzle. Int. J. Press. Vessels Pip. 2003, 80, 1–8. [Google Scholar] [CrossRef]
- Rudolph, J.; Schmitt, C.; Weiss, E. Fatigue lifetime assessment procedures for welded pressure vessel components. Int. J. Press. Vessels Pip. 2002, 79, 103–112. [Google Scholar] [CrossRef]
- Okrajni, J.; Twardawa, M. Description of the thermo-mechanical fatigue of thick-walled pressure vessels. In Proceedings of the 20th European Conference on Fracture, Trondheim, Norway, 30 June–4 July 2014; pp. 918–923. [Google Scholar]
- Margolin, B.Z.; Shvetsova, V.A.; Karzov, G.P. Fatigue failure of nuclear pressure vessel steels. I. Local criterion of fatigue failure. Int. J. Press. Vessels Pip. 1997, 74, 105–109. [Google Scholar] [CrossRef]
- Mashiri, F.R.; Zhao, X.L.; Grundy, P. Fatigue tests and design of thin cold-formed square hollow section-to-plate T connections under cyclic in-plane bending. J. Struct. Eng.—ASCE 2002, 128, 22–31. [Google Scholar] [CrossRef]
- Dong, P.; Hong, J.K.; Osage, D.; Prager, M. Assessment of Asme’s FSRF Rules for Vessel and Piping Welds using a New Structural Stress Method. Weld. World 2003, 47, 31–43. [Google Scholar] [CrossRef]
- ASME. Boiler and Pressure Vessel Code; Library of Congress: New York, NY, USA, 2019. [Google Scholar]
- Alexandre, P.; European Committee for Standardization. Dictionary Geotechnical Engineering/Wörterbuch GeoTechnik; Springer: Berlin/Heidelberg, Germany, 2014; p. 486. [Google Scholar]
- Yao, H.T.; Wang, Z.D. Simplified Assessment of Fatigue Life for Pressure Vessels. Press. Vessel Technol. 2006, 141, 44–48. [Google Scholar]
- Rodabaugh, E.C. Review of Area Replacement Rules for Pipe Connections in Pressure Vessels and Piping; Welding Research Council: Shaker Heights, OH, USA, 1988. [Google Scholar]
- Schijve, J. Fatigue of structures and materials in the 20th century and the state of the art. Int. J. Fatigue 2003, 25, 679–702. [Google Scholar] [CrossRef]
- Kalnins, A.; Rana, M.; Karcher, G.G. Design Fatigue Life Comparison of ASME Section VIII and EN 13445 Vessels with Welded Joints. In Proceedings of the ASME Pressure Vessels and Piping Conference, Vancouver, BC, Canada, 23–27 July 2006; pp. 215–223. [Google Scholar]
- Wei, T.; Wang, Z.J. Fatigue Assessment Method in EN 13445 and An Application Case. Press. Vessel Technol. 2013, 30, 60–63, 79. [Google Scholar]
- Ding, B.M. ASME VIII Pressure Vessel Code Analysis; Chemical Industry Press: Beijing, China, 2014. [Google Scholar]
- Kalnins, A. Fatigue analysis of pressure vessels with twice-yield plastic FEA. In Proceedings of the ASME Pressure Vessel and Piping Conference, Atlanta, GA, USA, 22–26 July 2001; Volume 419, pp. 13–21. [Google Scholar]


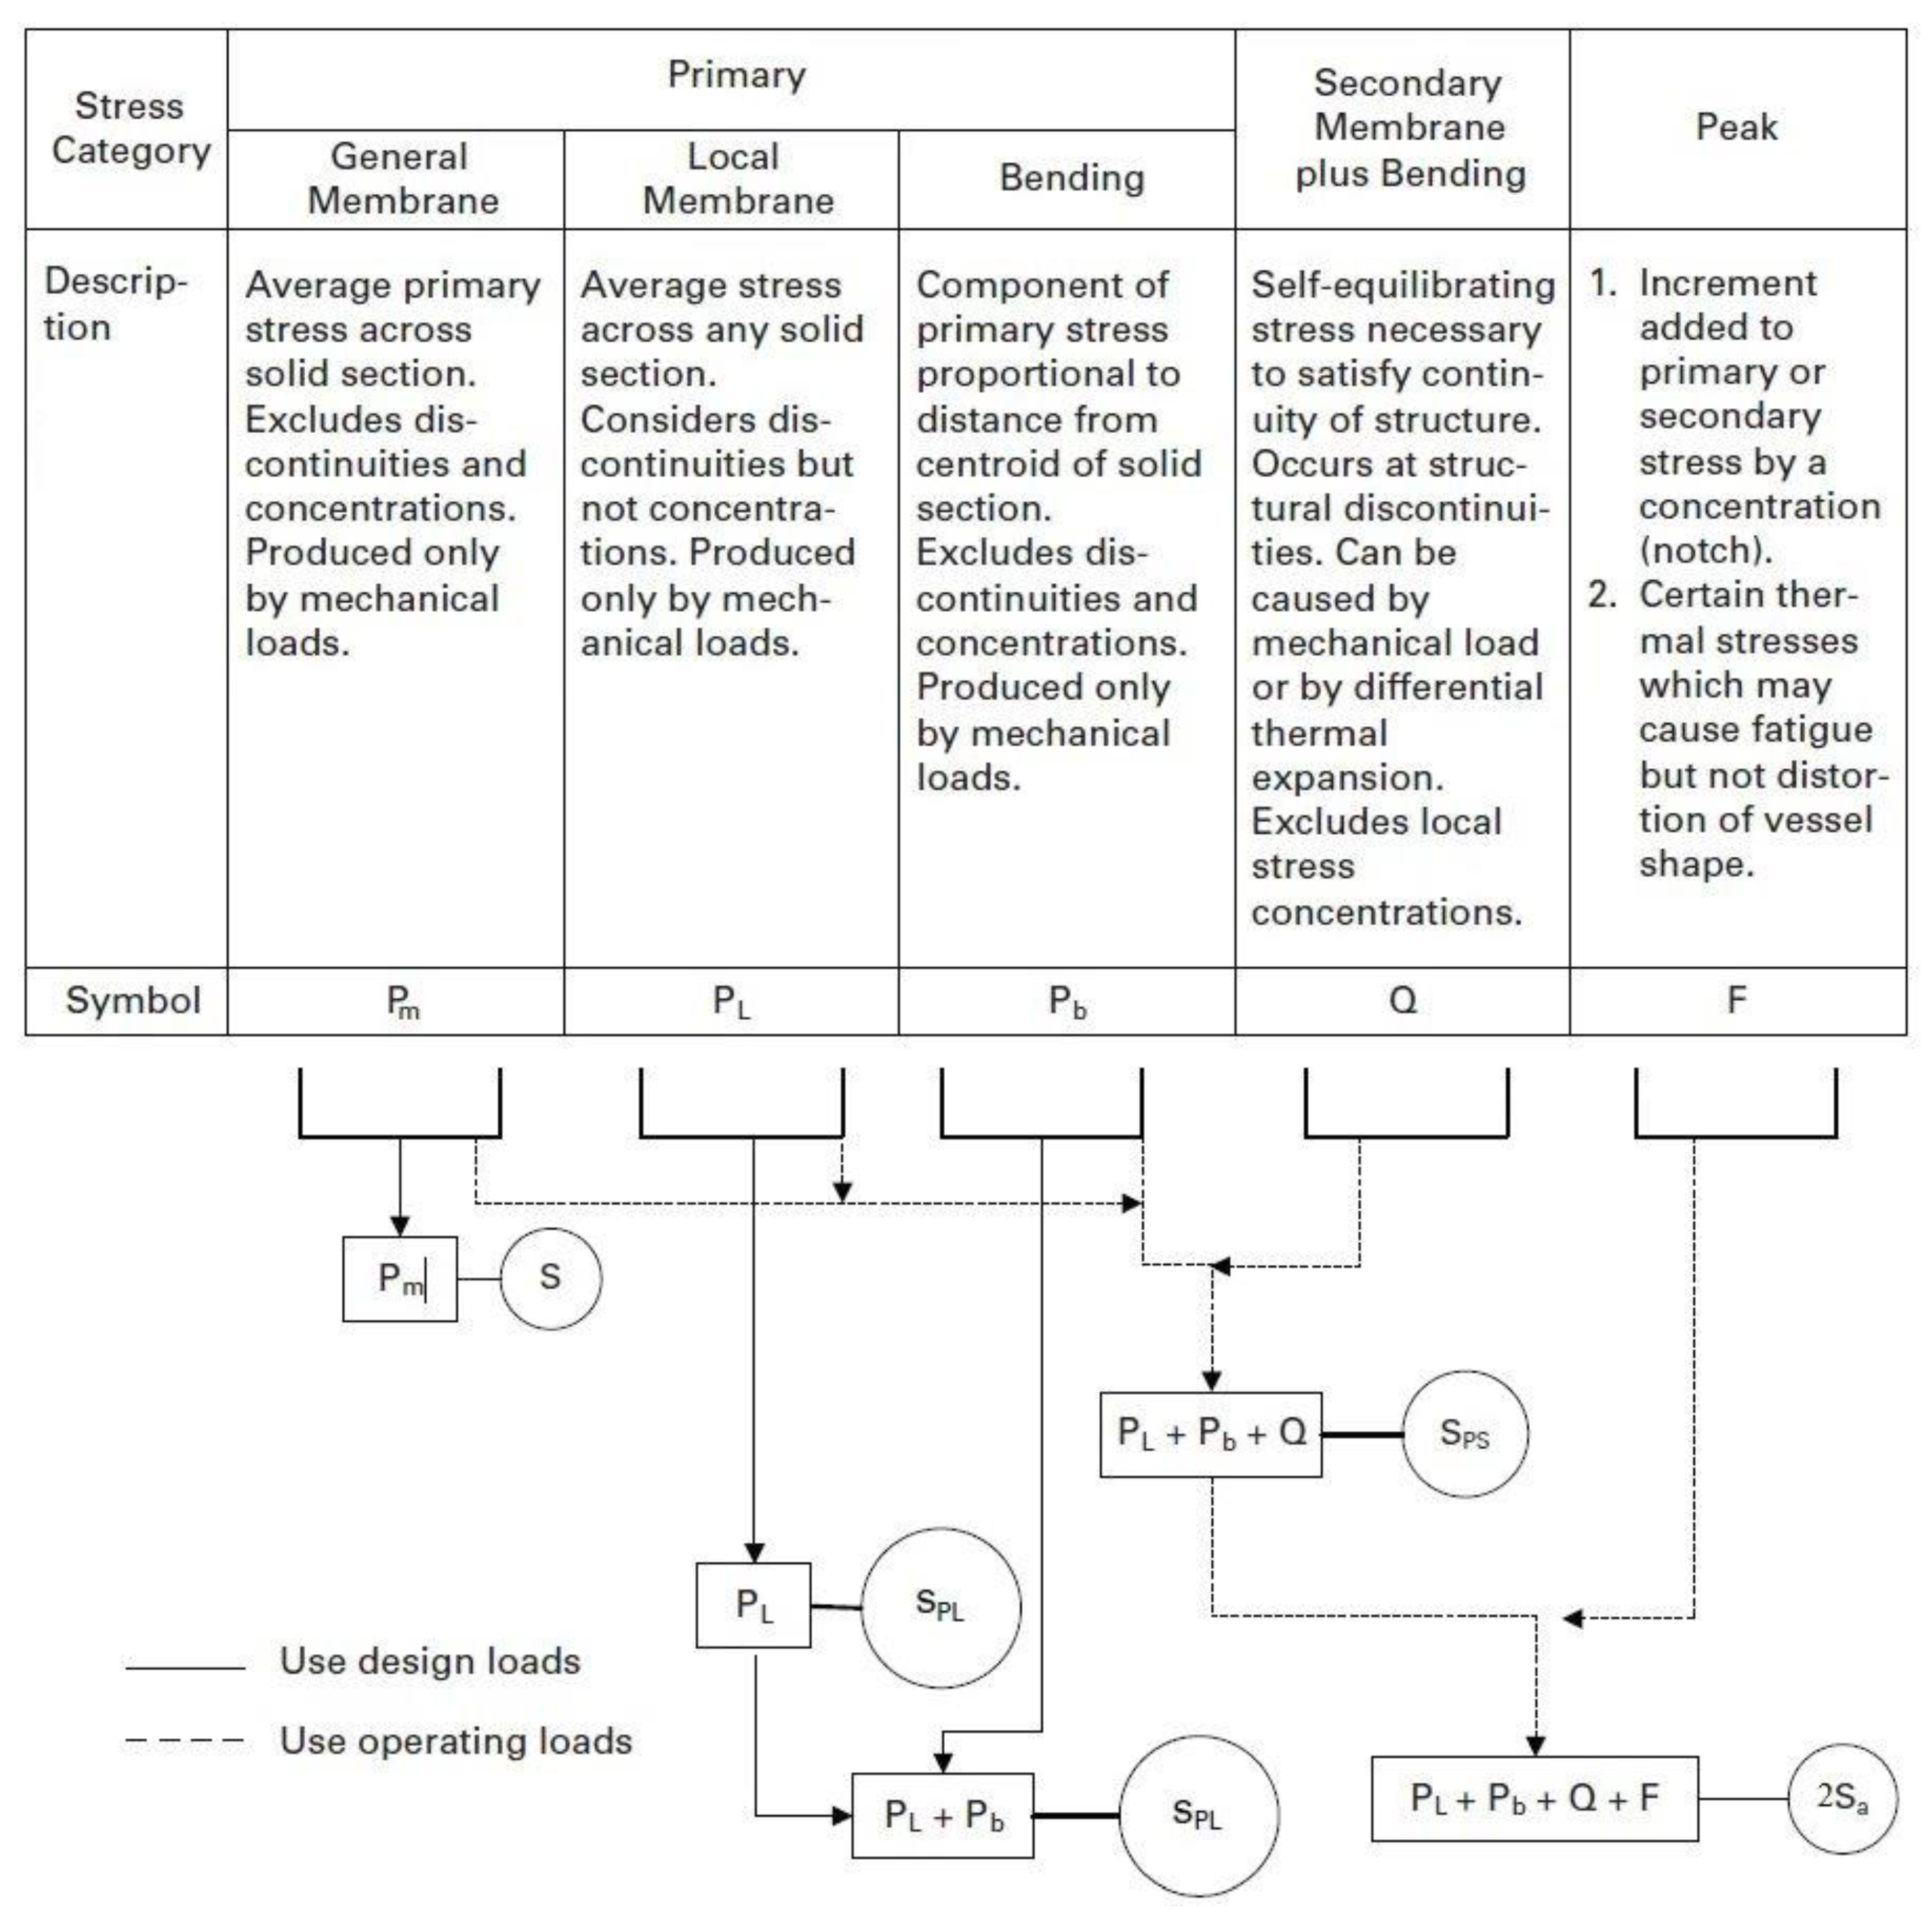
| Design Load Combination | Allowable Stress |
|---|---|
| (1) P + Ps + D (2) P + Ps + D + L (3) P + Ps + D + L + T (4) P + Ps + D + Ss (5) 0.6 D + (0.6 W or 0.7 E) (6) 0.9 P + Ps + D + (0.6 W or 0.7 E) (7) 0.9 P + Ps + D + 0.75 (L + T) + 0.75 Ss (8) 0.9 P + Ps + D + 0.75 (0.6 W or 0.7 E) + 0.75 L + 0.75 Ss | Determined based on the stress category shown in Figure 1 |
| Design Load Parameter | Description |
|---|---|
| L |
|
| E | Earthquake loads |
| W | Wind loads |
| Wpt | The pressure test wind load case. The design wind speed for this case shall be specified by the owner user. |
| Ss | Snow loads |
| T | The self-restraining load case (i.e., thermal loads, applied displacements). This load case does not usually affect the collapse load but should be considered in cases where the elastic follow-up causes stress to be insufficient to redistribute the load without excessive deformation. |
| NO. | Cylinder Diameter | Cylinder Thickness | Nozzle Diameter | Nozzle Thickness | Testing Pressure | Testing Cycle Life | |
|---|---|---|---|---|---|---|---|
| Do/mm | T/mm | do/mm | t/mm | Pmax/MPa | Pmin/MPa | n | |
| 1 | 325 | 10 | 44.2 | 7 | 1.2931 | Pmin = 0.1 Pmax | 180,200 |
| 2 | 325 | 10 | 44.2 | 7 | 1.3272 | 182,100 | |
| 3 | 325 | 10 | 140.2 | 11 | 1.1223 | 150,900 | |
| 4 | 325 | 10 | 159.5 | 15.9 | 1.3272 | 104,800 | |
| 5 | 325 | 10 | 159.3 | 22 | 1.4199 | 155,000 | |
| 6 | 325 | 10 | 159.3 | 22 | 1.376 | 149,700 | |
| 7 | 325 | 10 | 252 | 22 | 1.1174 | 90,100 | |
| 8 | 325 | 10 | 252 | 22 | 1.1711 | 42,100 | |
| 9 | 325 | 10 | 268.3 | 32 | 1.1711 | 79,600 | |
| 10 | 600 | 20 | 303.7 | 34 | 1.3367 | 79,400 | |
| 11 | 600 | 20 | 303.7 | 34 | 1.2839 | 72,000 | |
| 12 | 600 | 20 | 303.7 | 34 | 1.2997 | 72,800 | |
| 13 | 325 | 20 | 44.2 | 7 | 2.7821 | 41,200 | |
| 14 | 325 | 20 | 44.2 | 7 | 2.5503 | 105,400 | |
| 15 | 325 | 20 | 159.3 | 22 | 2.2075 | 171,200 | |
| 16 | 325 | 20 | 159.3 | 22 | 2.3184 | 86,400 | |
| 17 | 325 | 20 | 244.6 | 22 | 2.3083 | 43,300 | |
| 18 | 325 | 20 | 244.6 | 22 | 2.0664 | 119,900 | |
| 19 | 325 | 20 | 267.5 | 32 | 2.1067 | 97,700 | |
| 20 | 325 | 20 | 267.5 | 32 | 1.7338 | 95,400 | |
| 21 | 325 | 20 | 139.1 | 11 | 1.9959 | 91,000 | |
| 22 | 325 | 20 | 139.1 | 11 | 1.9051 | 128,000 | |
| NO. | Cylinder Diameter | Cylinder Thickness | Nozzle Diameter | Nozzle Thickness | Testing Pressure | Testing Cycle Life | |
|---|---|---|---|---|---|---|---|
| Do/mm | T/mm | do/mm | t/mm | Pmax/MPa | Pmin/MPa | n | |
| 23 | 342.90 | 19.050 | 50.700 | 9.525 | 25.389 | 0 | 51,000 |
| 24 | 25.389 | 51,300 | |||||
| 25 | 22.712 | 87,500 | |||||
| 26 | 22.712 | 103,000 | |||||
| 27 | 46.884 | 9990 | |||||
| 28 | 46.884 | 10,900 | |||||
| 29 | 39.341 | 18,800 | |||||
| 30 | 34.149 | 46,900 | |||||
| 31 | 34.149 | 53,500 | |||||
| 32 | 34.474 | 49,100 | |||||
| NO. | Cylinder Diameter | Cylinder Thickness | Nozzle Diameter | Nozzle Thickness | Testing Pressure | Testing Cycle Life | |
|---|---|---|---|---|---|---|---|
| Do/mm | T/mm | do/mm | t/mm | Pmax/MPa | Pmin/MPa | n | |
| 33 | 321.4 | 13 | 70.9 | 13 | 37.296 | 0 | 6500 |
| 34 | 35.317 | 7600 | |||||
| 35 | 33.339 | 9800 | |||||
| 36 | 29.441 | 15,600 | |||||
| 37 | 321.4 | 13 | 94.8 | 13 | 39.216 | 8600 | |
| 38 | 35.317 | 14,800 | |||||
| 39 | 29.441 | 20,500 | |||||
| 40 | 334 | 20 | 110.1 | 20.8 | 49.010 | 3460 | |
| 41 | 43.125 | 6400 | |||||
| 42 | 39.261 | 14,300 | |||||
| 43 | 33.376 | 20,900 | |||||
| Model | Structure | Material | Allowable Stress S/MPa | Yield Strength Sy/MPa | Tensile Strength Su/MPa | Elastic Modulus E/×103 MPa | Poisson’s Ratio | |
|---|---|---|---|---|---|---|---|---|
| Table 3 | 1–22 | Cylinder | Carbon Steel | 180 | 283 | 434 | 201 | 0.3 |
| Nozzle | 174 | 262 | 446 | |||||
| Table 4 | 23–26 | Cylinder Nozzle | A201A | 162 | 244 | 388 | ||
| 27–32 | A302B | 275 | 533 | 660 | ||||
| Table 5 | 33–36 40–43 | Cylinder | FTW60 | 285 | 617 | 686 | ||
| Nozzle | JISSF60 | 235 | 353 | 597 | ||||
| 37–39 | Cylinder | FTW60 | 285 | 617 | 686 | |||
| Nozzle | 302B | 269 | 496 | 647 | ||||
| Number of Grid Nodes | Number of Elements | Maximum Stress/MPa | Deviation |
|---|---|---|---|
| 135,117 | 27,856 | 518.724 | 5.41% |
| 267,338 | 58,412 | 492.097 | datum |
| 398,546 | 88,660 | 499.350 | 1.47% |
| Material | εoffset | Kcss/MPa | ncss | σyield/MPa |
|---|---|---|---|---|
| Carbon Steel | 2.0 × 10⁻⁵ | 757 | 0.128 | 189.508 |
| Carbon Steel-Welded | 2.0 × 10⁻⁵ | 695 | 0.110 | 211.397 |
| NO. | Carbon Steel | Carbon Steel-Welded | ||
|---|---|---|---|---|
| Stress Range/MPa | Plastic Strain Range | Stress Range/MPa | Plastic Strain Range | |
| 1 | 379.0161 | 0 | 422.7933 | 0 |
| 2 | 400 | 0.000020938 | 450 | 0.000030515 |
| 3 | 450 | 0.00011294 | 500 | 0.00014376 |
| 4 | 500 | 0.00030834 | 550 | 0.00039708 |
| 5 | 550 | 0.00069347 | 600 | 0.00092403 |
| 6 | 600 | 0.0014 | 650 | 0.0020 |
| 7 | 650 | 0.0027 | 700 | 0.0039 |
| 8 | 700 | 0.0048 | 750 | 0.0073 |
| 9 | 750 | 0.0082 | 800 | 0.0131 |
| 10 | 800 | 0.0137 | 850 | 0.0228 |
| Stress Evaluation Area | Pm/MPa | (Pm + Pb) /MPa | Sm/MPa | Stress Evaluation | Results |
| 1 | 160.64 | 193.99 | 180 | qualified | |
| Stress Evaluation Area | PL/MPa | (PL + Pb) /MPa | Sm/MPa | Stress Evaluation | Results |
| 2 | 84.719 | 144.38 | 174 | qualified | |
| 3 | 249.63 | 464.58 | 174 | qualified | |
| 4 | 206.19 | 281.57 | 180 | qualified |
| Model NO. | Fatigue Evaluation Result | Model NO. | Fatigue Evaluation Result | ||||||
|---|---|---|---|---|---|---|---|---|---|
| Method 1 | Method 2 | Method 3 | Method 4 | Method 1 | Method 2 | Method 3 | Method 4 | ||
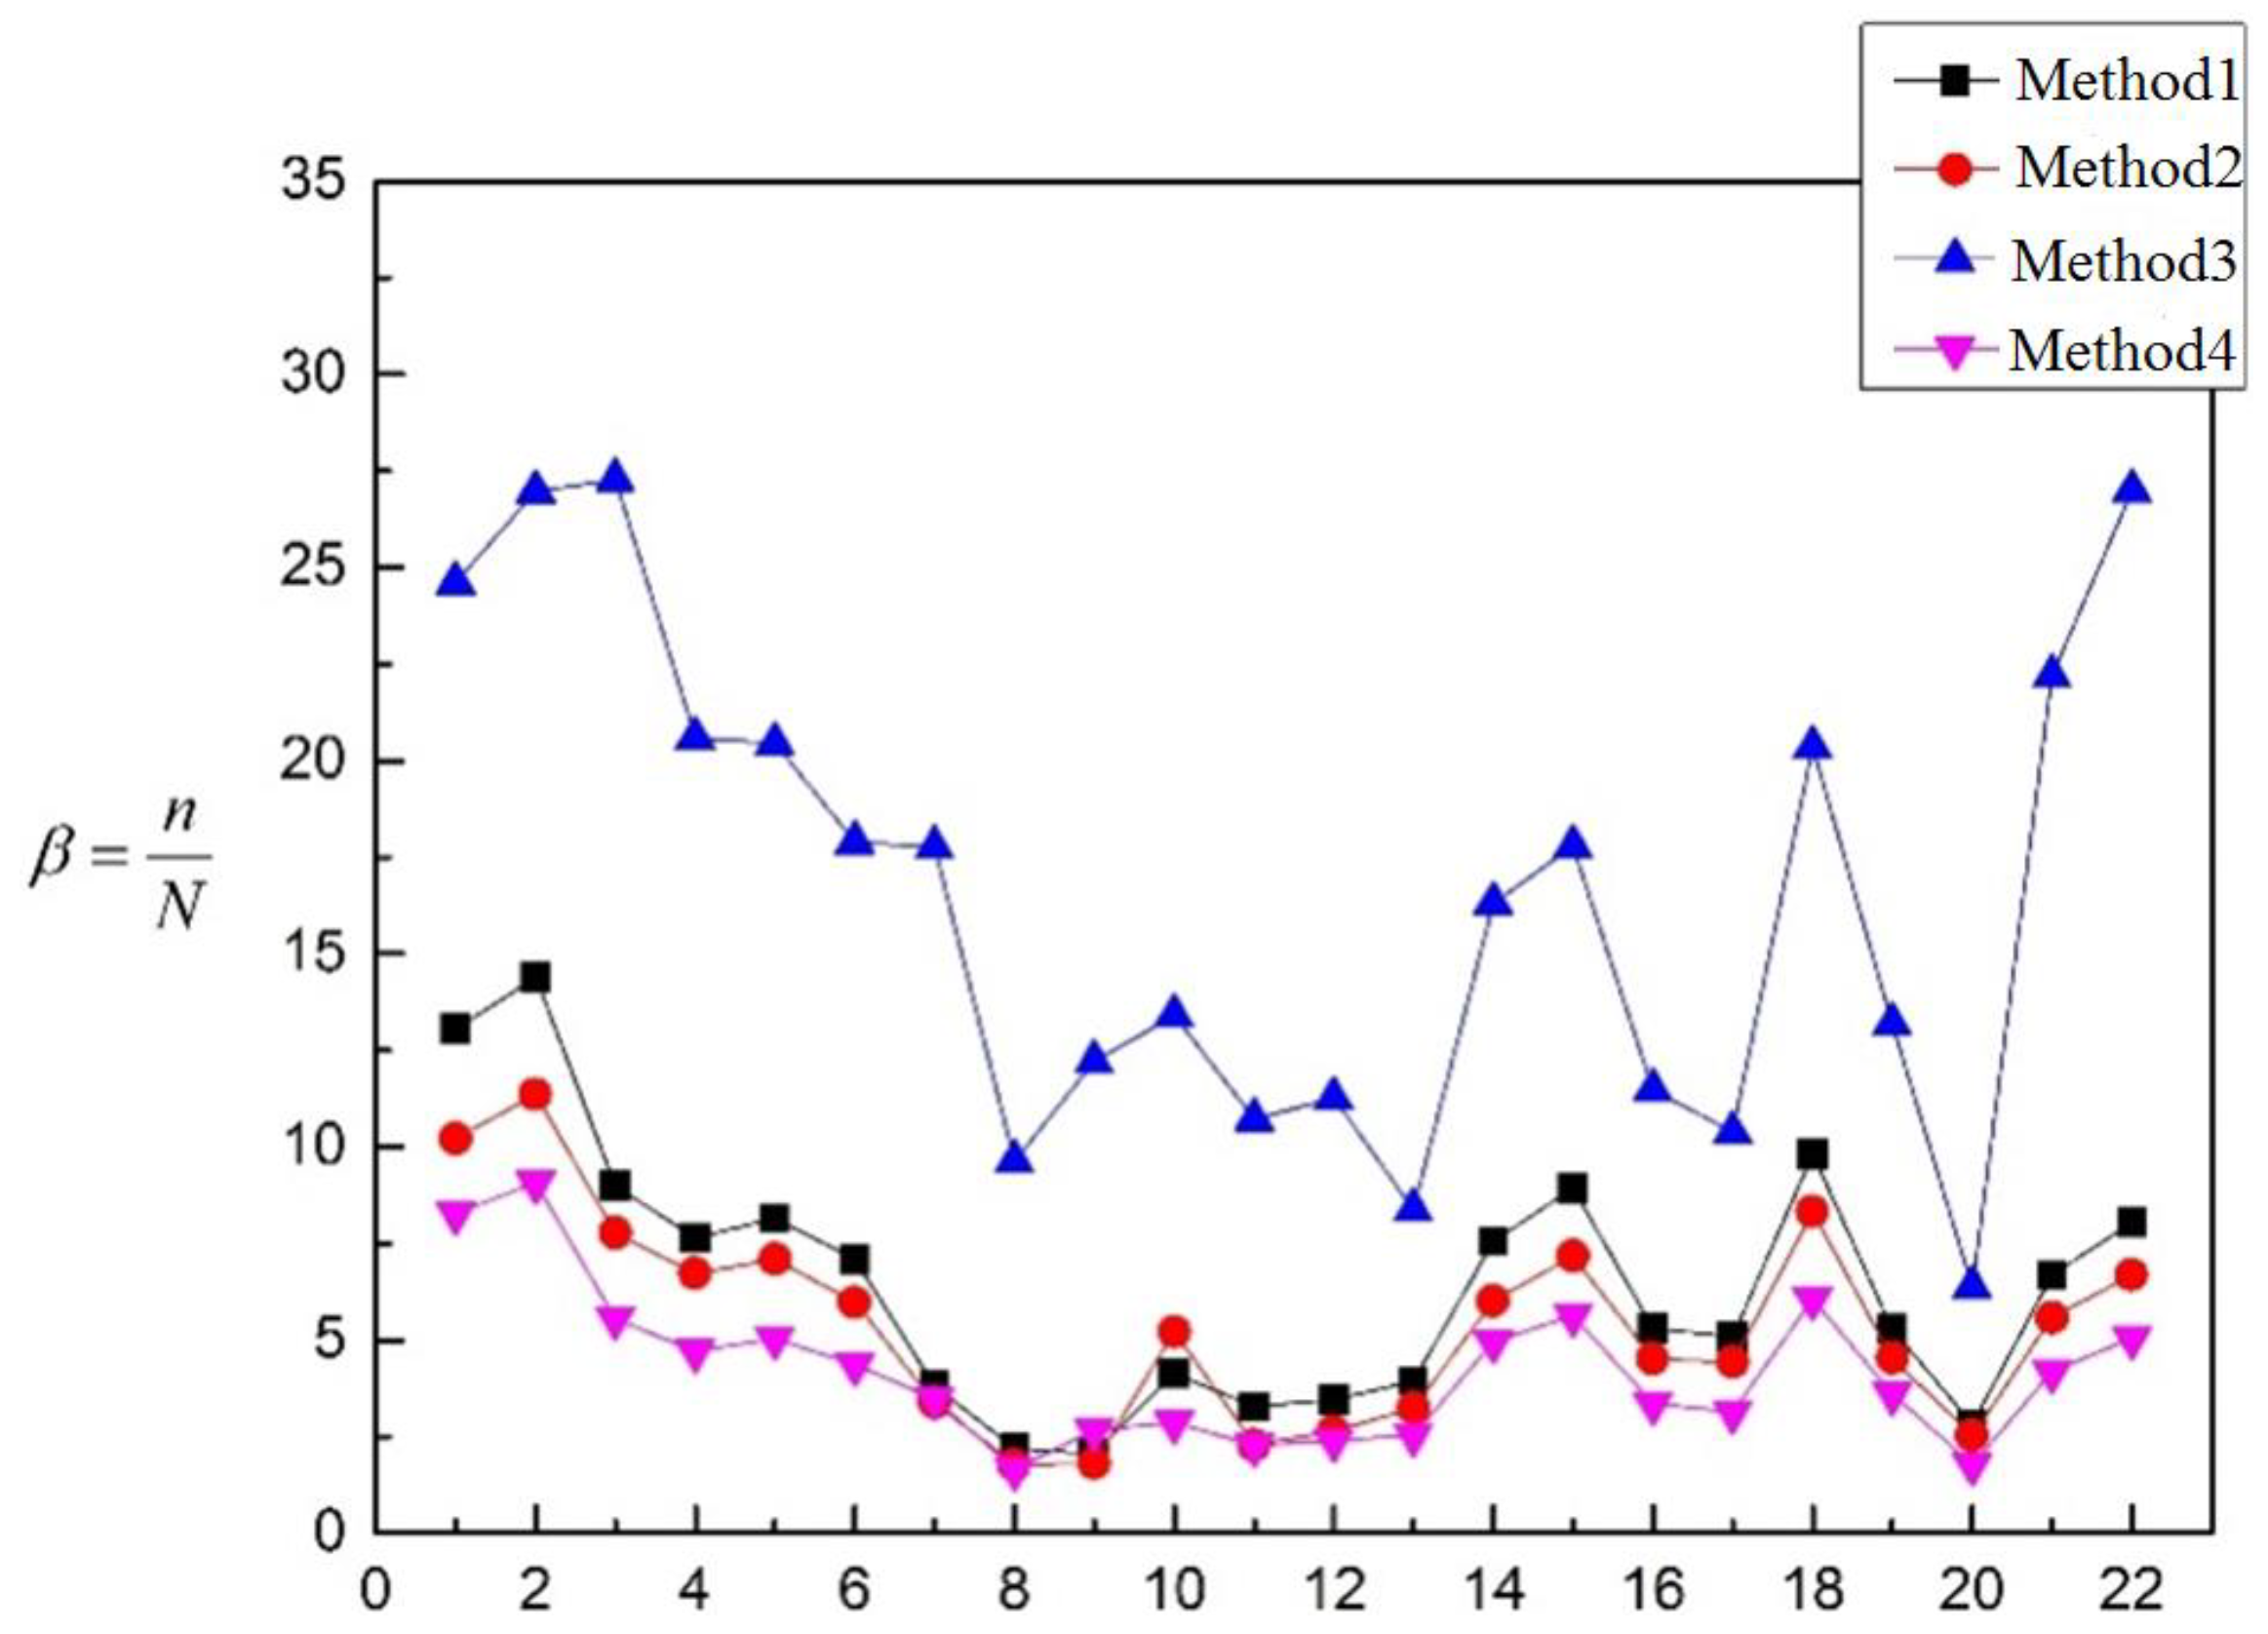
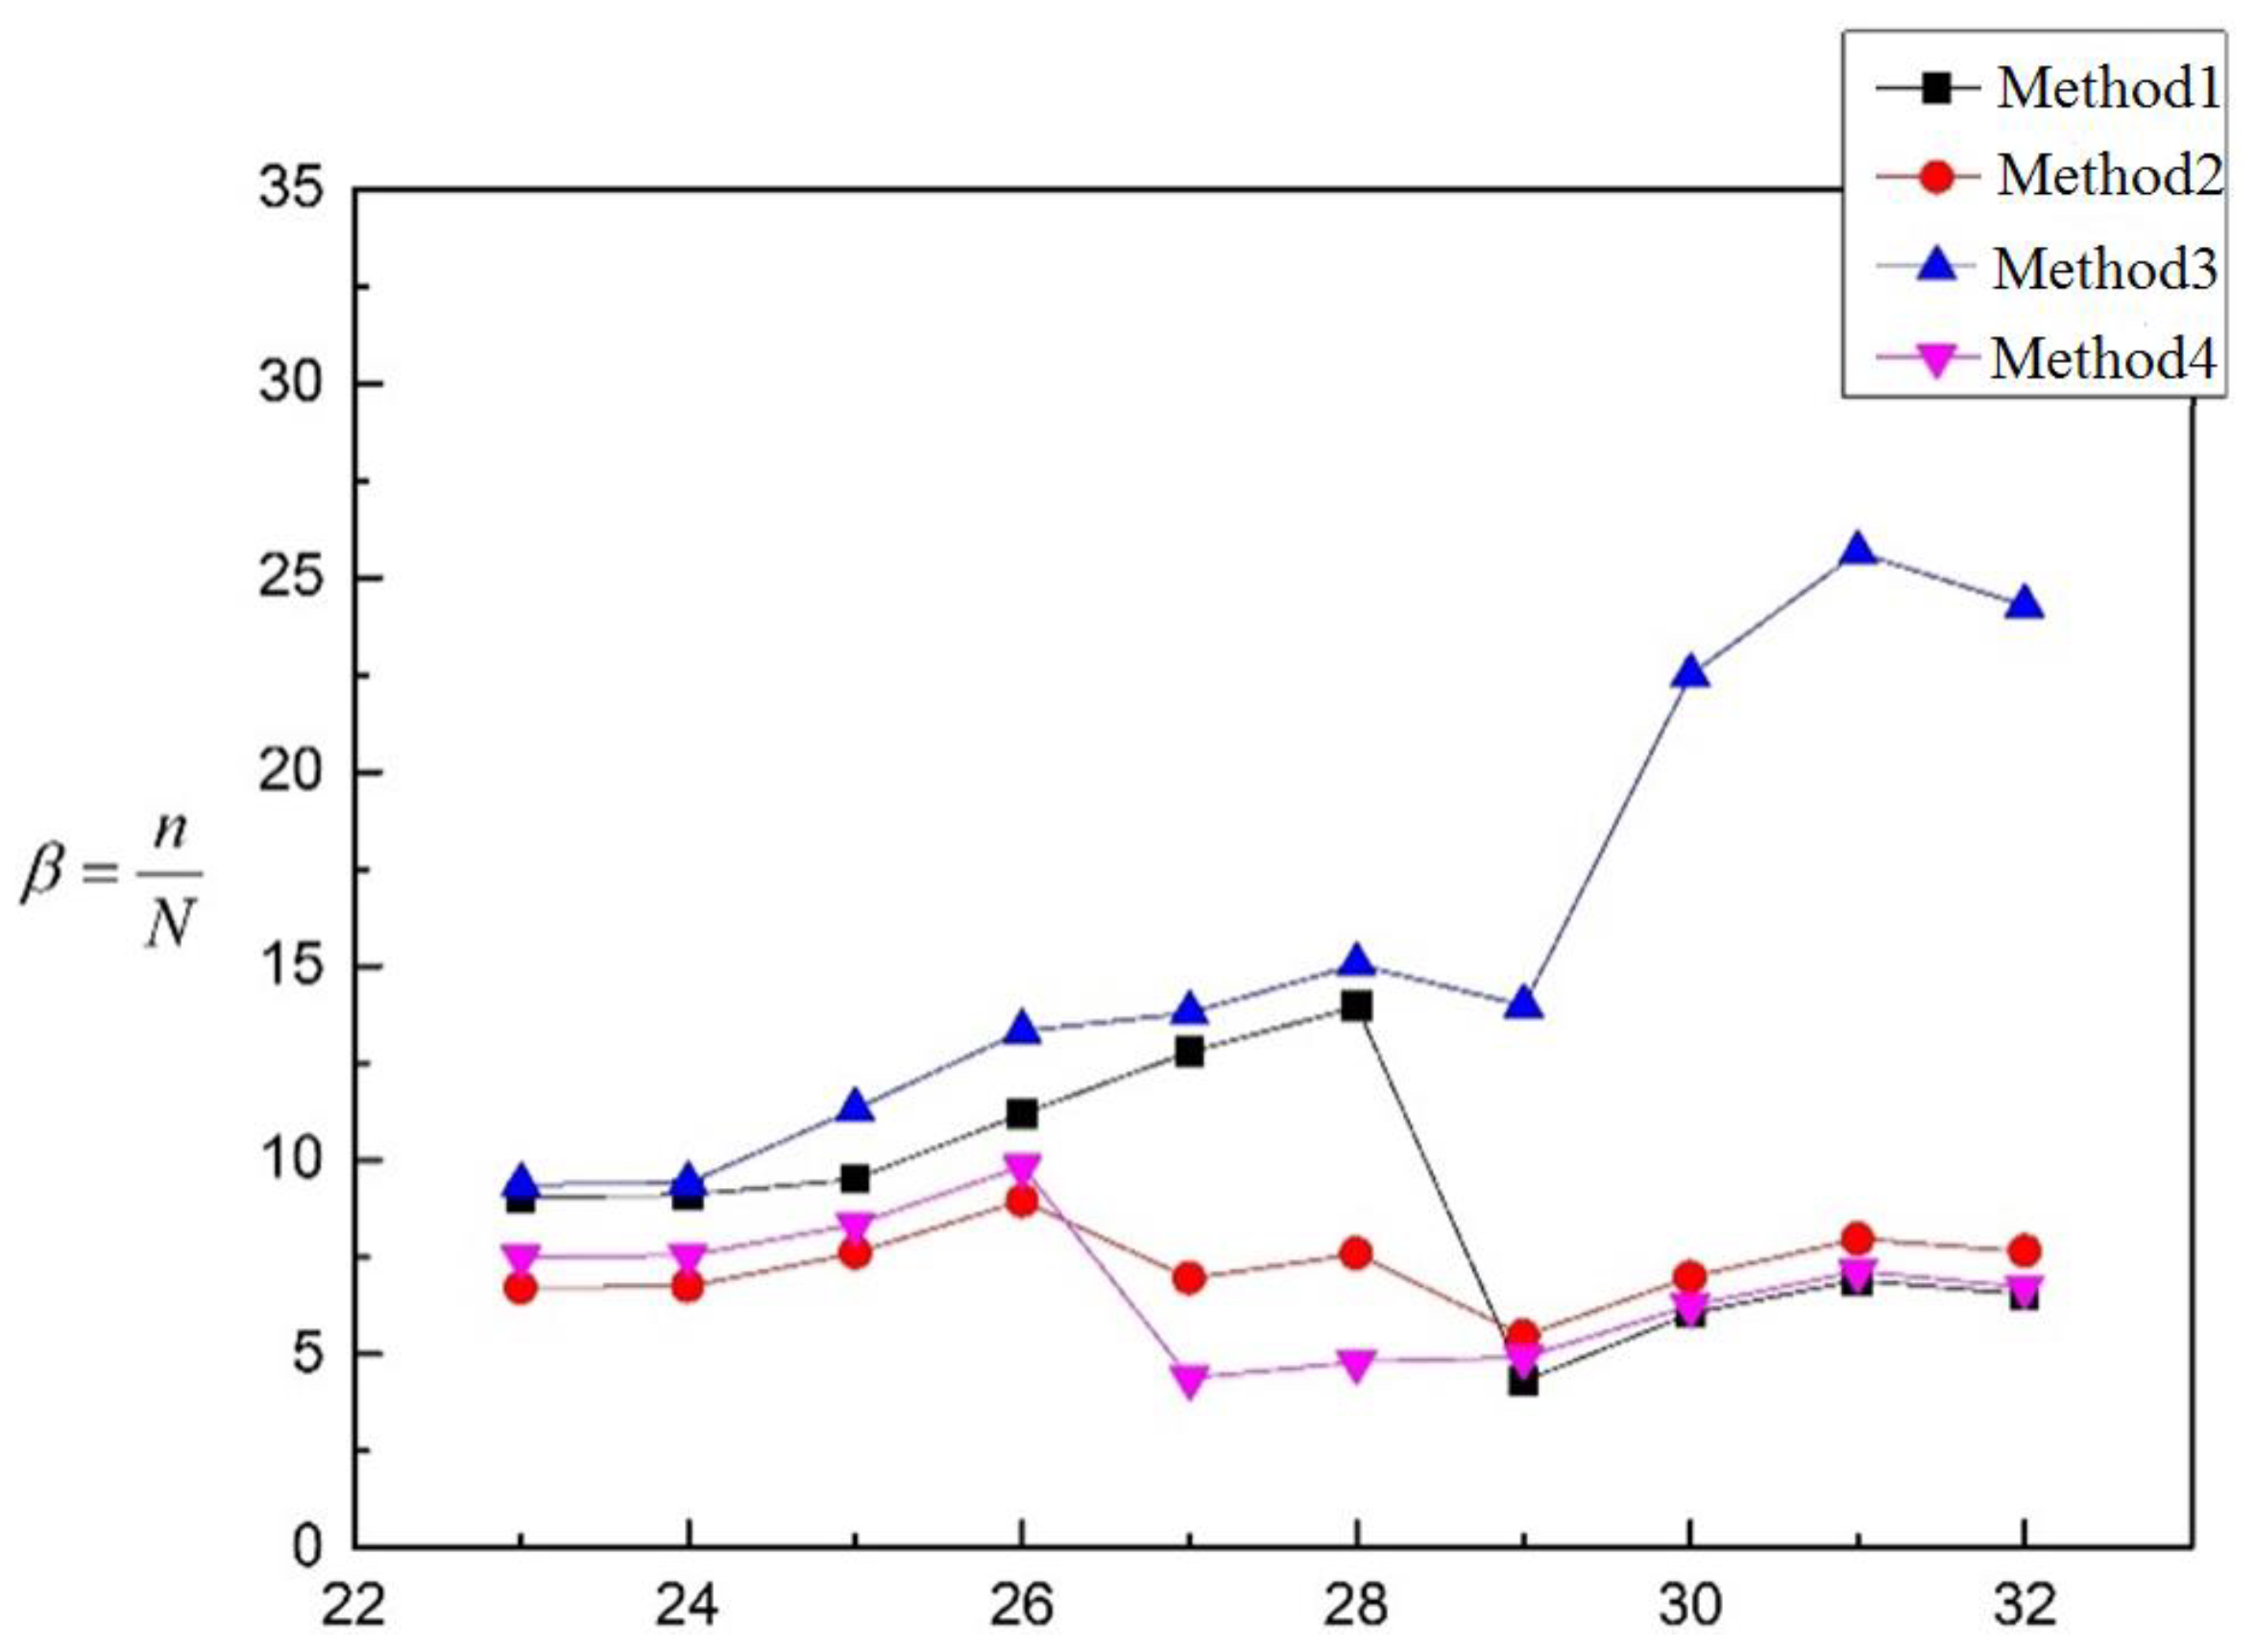
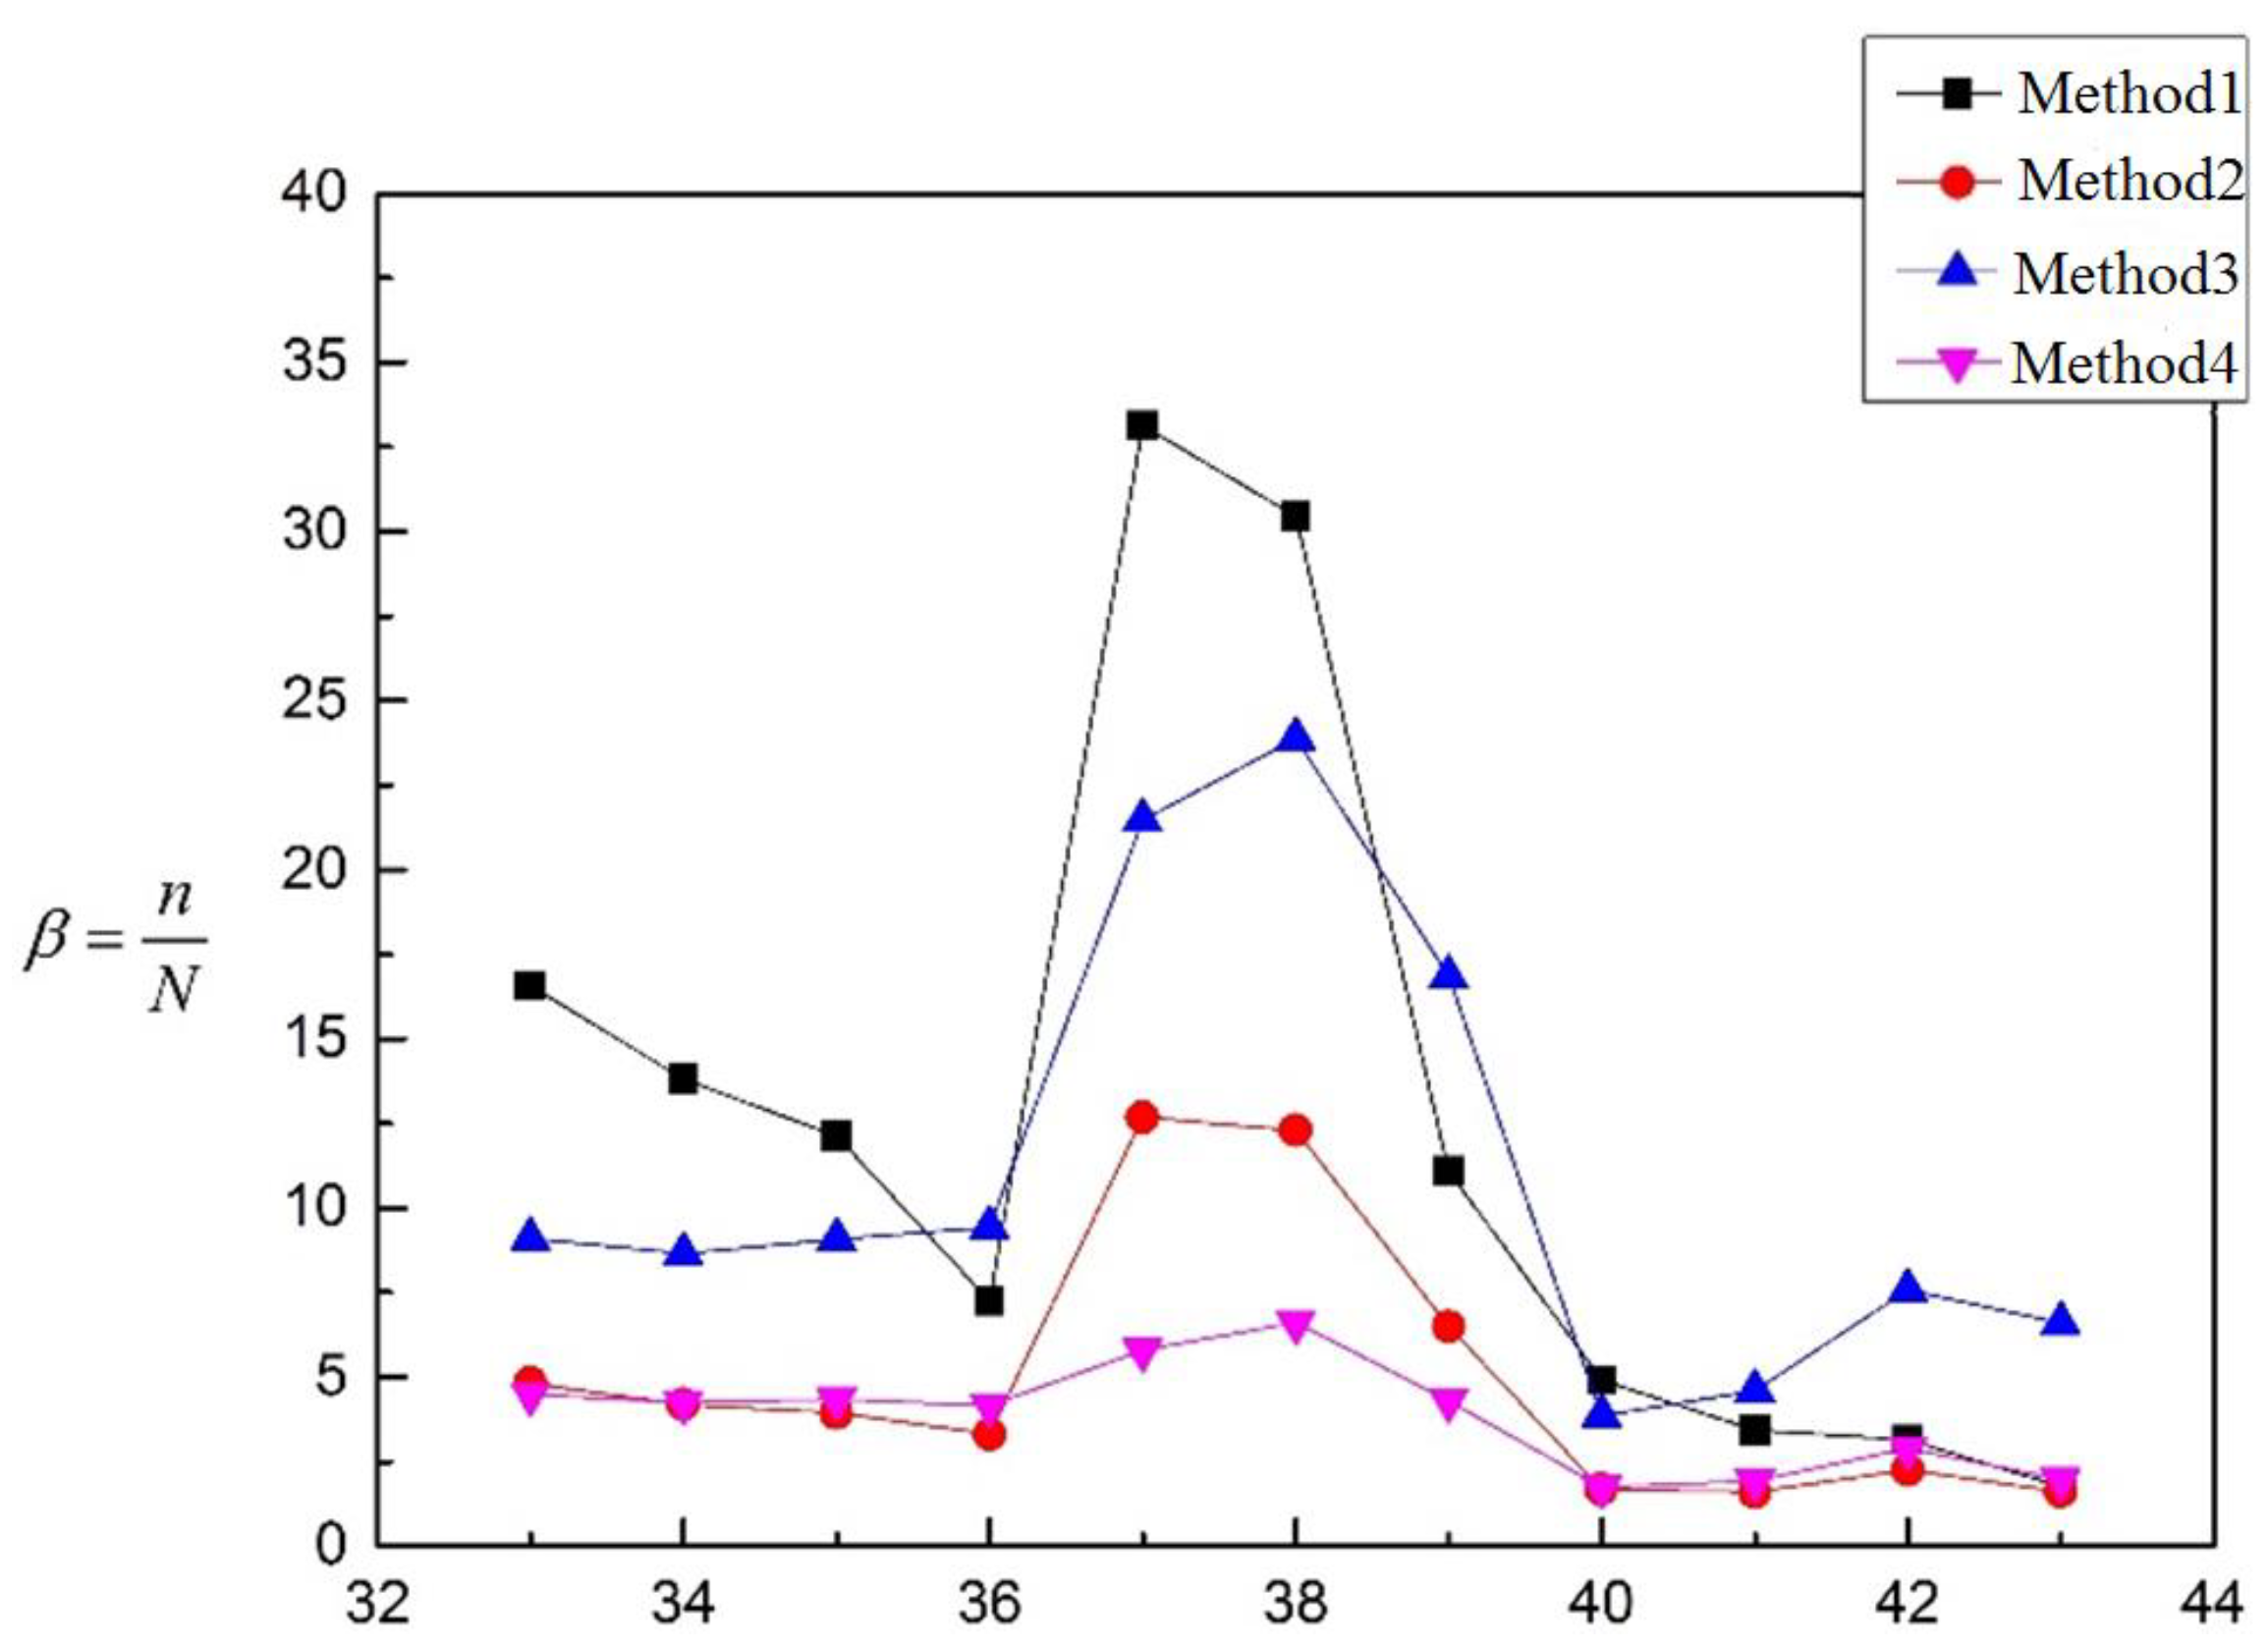
| 1 | 13.047 | 10.210 | 24.600 | 8.270 | 23 | 9.032 | 6.705 | 9.351 | 7.492 |
| 2 | 14.367 | 11.354 | 26.973 | 9.072 | 24 | 9.085 | 6.744 | 9.406 | 7.536 |
| 3 | 8.979 | 7.764 | 27.279 | 5.550 | 25 | 9.499 | 7.600 | 11.312 | 8.342 |
| 4 | 7.642 | 6.718 | 20.588 | 4.699 | 26 | 11.182 | 8.946 | 13.316 | 9.820 |
| 5 | 8.147 | 7.085 | 20.444 | 5.0374 | 27 | 12.784 | 6.945 | 13.790 | 4.380 |
| 6 | 7.081 | 5.969 | 17.887 | 4.367 | 28 | 13.948 | 7.578 | 15.046 | 4.779 |
| 7 | 3.805 | 3.384 | 17.775 | 3.483 | 29 | 4.290 | 5.455 | 13.972 | 4.910 |
| 8 | 2.188 | 1.776 | 9.625 | 1.658 | 30 | 6.041 | 6.974 | 22.492 | 6.241 |
| 9 | 2.038 | 1.799 | 12.213 | 2.662 | 31 | 6.891 | 7.956 | 25.657 | 7.119 |
| 10 | 4.132 | 5.212 | 13.391 | 2.856 | 32 | 6.533 | 7.639 | 24.284 | 6.705 |
| 11 | 3.272 | 2.281 | 10.716 | 2.268 | 33 | 16.575 | 4.820 | 9.1058 | 4.499 |
| 12 | 3.448 | 2.635 | 11.255 | 2.388 | 34 | 13.805 | 4.195 | 8.662 | 4.251 |
| 13 | 3.924 | 3.237 | 8.369 | 2.534 | 35 | 12.129 | 3.940 | 9.070 | 4.358 |
| 14 | 7.544 | 6.015 | 16.308 | 4.957 | 36 | 7.257 | 3.309 | 9.441 | 4.157 |
| 15 | 8.923 | 7.174 | 17.788 | 5.631 | 37 | 33.133 | 12.675 | 21.466 | 5.796 |
| 16 | 5.305 | 4.504 | 11.461 | 3.347 | 38 | 30.434 | 12.295 | 23.892 | 6.613 |
| 17 | 5.075 | 4.421 | 10.389 | 3.122 | 39 | 11.086 | 6.497 | 16.861 | 4.306 |
| 18 | 9.803 | 8.320 | 20.345 | 6.049 | 40 | 4.921 | 1.680 | 3.867 | 1.758 |
| 19 | 5.287 | 4.523 | 13.189 | 3.606 | 41 | 3.446 | 1.602 | 4.609 | 1.933 |
| 20 | 2.817 | 2.517 | 6.369 | 1.785 | 42 | 3.150 | 2.2617 | 7.578 | 2.891 |
| 21 | 6.678 | 5.581 | 22.197 | 4.176 | 43 | 1.785 | 1.611 | 6.600 | 1.994 |
| 22 | 8.050 | 6.676 | 26.985 | 5.055 | |||||
| Method 1 | Method 2 | Method 3 | Method 4 | |
|---|---|---|---|---|
| ω | 3.25 | 2.57 | 6.27 | 1.89 |
| 6.43 | 5.42 | 16.64 | 4.21 | |
| CV/% | 51.63 | 48.66 | 38.55 | 46.06 |
| Method 4 and Method 1 | Method 4 and Method 2 | Method 4 and Method 3 | |
|---|---|---|---|
| MAPE/% | 51.57 | 30.32 | 312.58 |
| Method 1 | Method 2 | Method 3 | Method 4 | |
|---|---|---|---|---|
| ω | 2.92 | 0.88 | 5.75 | 1.63 |
| 8.93 | 7.25 | 15.86 | 6.73 | |
| CV/% | 32.70 | 12.10 | 36.25 | 24.14 |
| Method 2 and Method 1 | Method 2 and Method 3 | Method 2 and Method 4 | |
|---|---|---|---|
| MAPE/% | 35.01 | 119.28 | 16.01 |
| Method 1 | Method 2 | Method 3 | Method 4 | |
|---|---|---|---|---|
| ω | 10.17 | 3.82 | 6.38 | 1.51 |
| 12.52 | 4.99 | 11.01 | 3.87 | |
| CV/% | 81.20 | 76.57 | 57.95 | 38.95 |
| Method 4 and Method 1 | Method 4 and Method 2 | Method 4 and Method 3 | |
|---|---|---|---|
| MAPE/% | 183.00 | 32.41 | 174.19 |
Disclaimer/Publisher’s Note: The statements, opinions and data contained in all publications are solely those of the individual author(s) and contributor(s) and not of MDPI and/or the editor(s). MDPI and/or the editor(s) disclaim responsibility for any injury to people or property resulting from any ideas, methods, instructions or products referred to in the content. |
© 2022 by the authors. Licensee MDPI, Basel, Switzerland. This article is an open access article distributed under the terms and conditions of the Creative Commons Attribution (CC BY) license (https://creativecommons.org/licenses/by/4.0/).
Share and Cite
Su, W.; Cao, Q.; Cui, G.; Chen, Z. Investigations on Fatigue Life of Tube Connections Based on International Codes of Pressure Vessel. Materials 2023, 16, 231. https://doi.org/10.3390/ma16010231
Su W, Cao Q, Cui G, Chen Z. Investigations on Fatigue Life of Tube Connections Based on International Codes of Pressure Vessel. Materials. 2023; 16(1):231. https://doi.org/10.3390/ma16010231
Chicago/Turabian StyleSu, Wenxian, Qinqin Cao, Gaoyu Cui, and Zhiwei Chen. 2023. "Investigations on Fatigue Life of Tube Connections Based on International Codes of Pressure Vessel" Materials 16, no. 1: 231. https://doi.org/10.3390/ma16010231
APA StyleSu, W., Cao, Q., Cui, G., & Chen, Z. (2023). Investigations on Fatigue Life of Tube Connections Based on International Codes of Pressure Vessel. Materials, 16(1), 231. https://doi.org/10.3390/ma16010231