
Influence of Low- to Medium-Kaolinite Clay on the Durability of Limestone Calcined Clay Cement (LC3) Concrete


Abstract
:1. Introduction
2. Materials and Methods
2.1. Materials
2.2. Test Methods
2.2.1. Reactivity Test
2.2.2. Concrete Preparation and Compressive Strength
2.2.3. Chloride Ingress Resistance
2.2.4. Electrical Conductivity/Surface Resistivity
2.2.5. Sorptivity
2.2.6. Pore Structure Distribution
3. Results
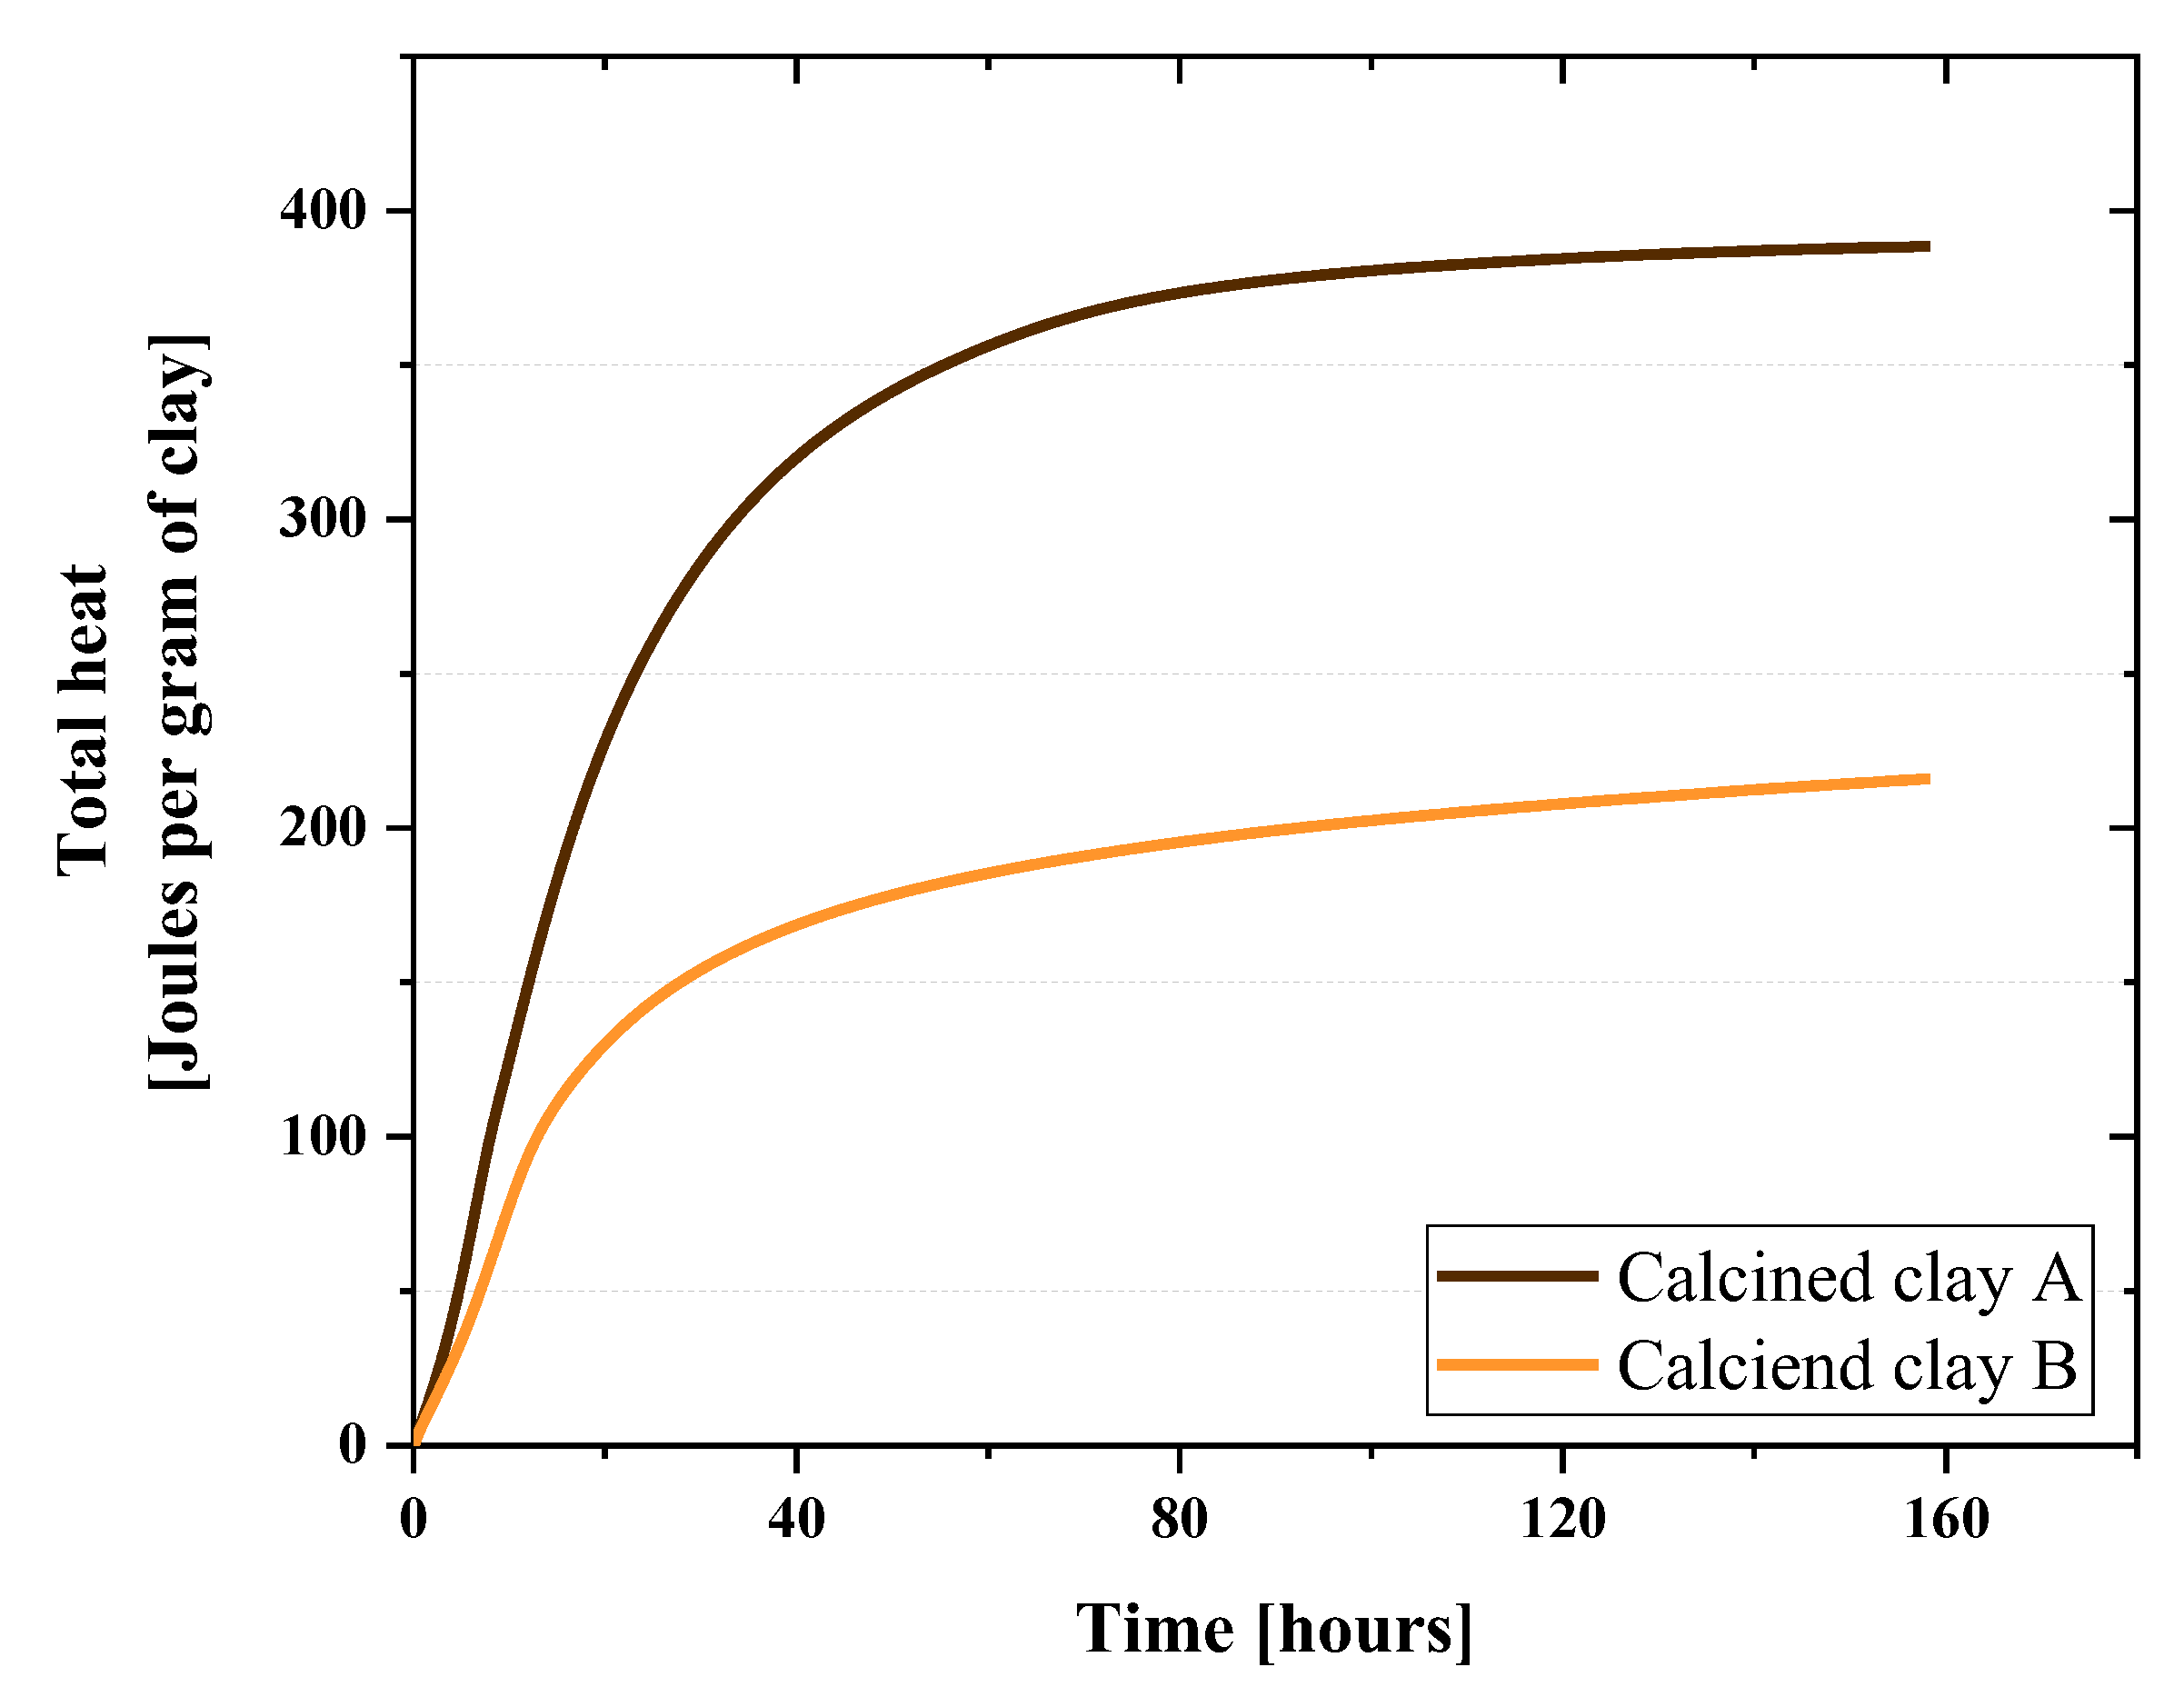
3.1. Reactivity
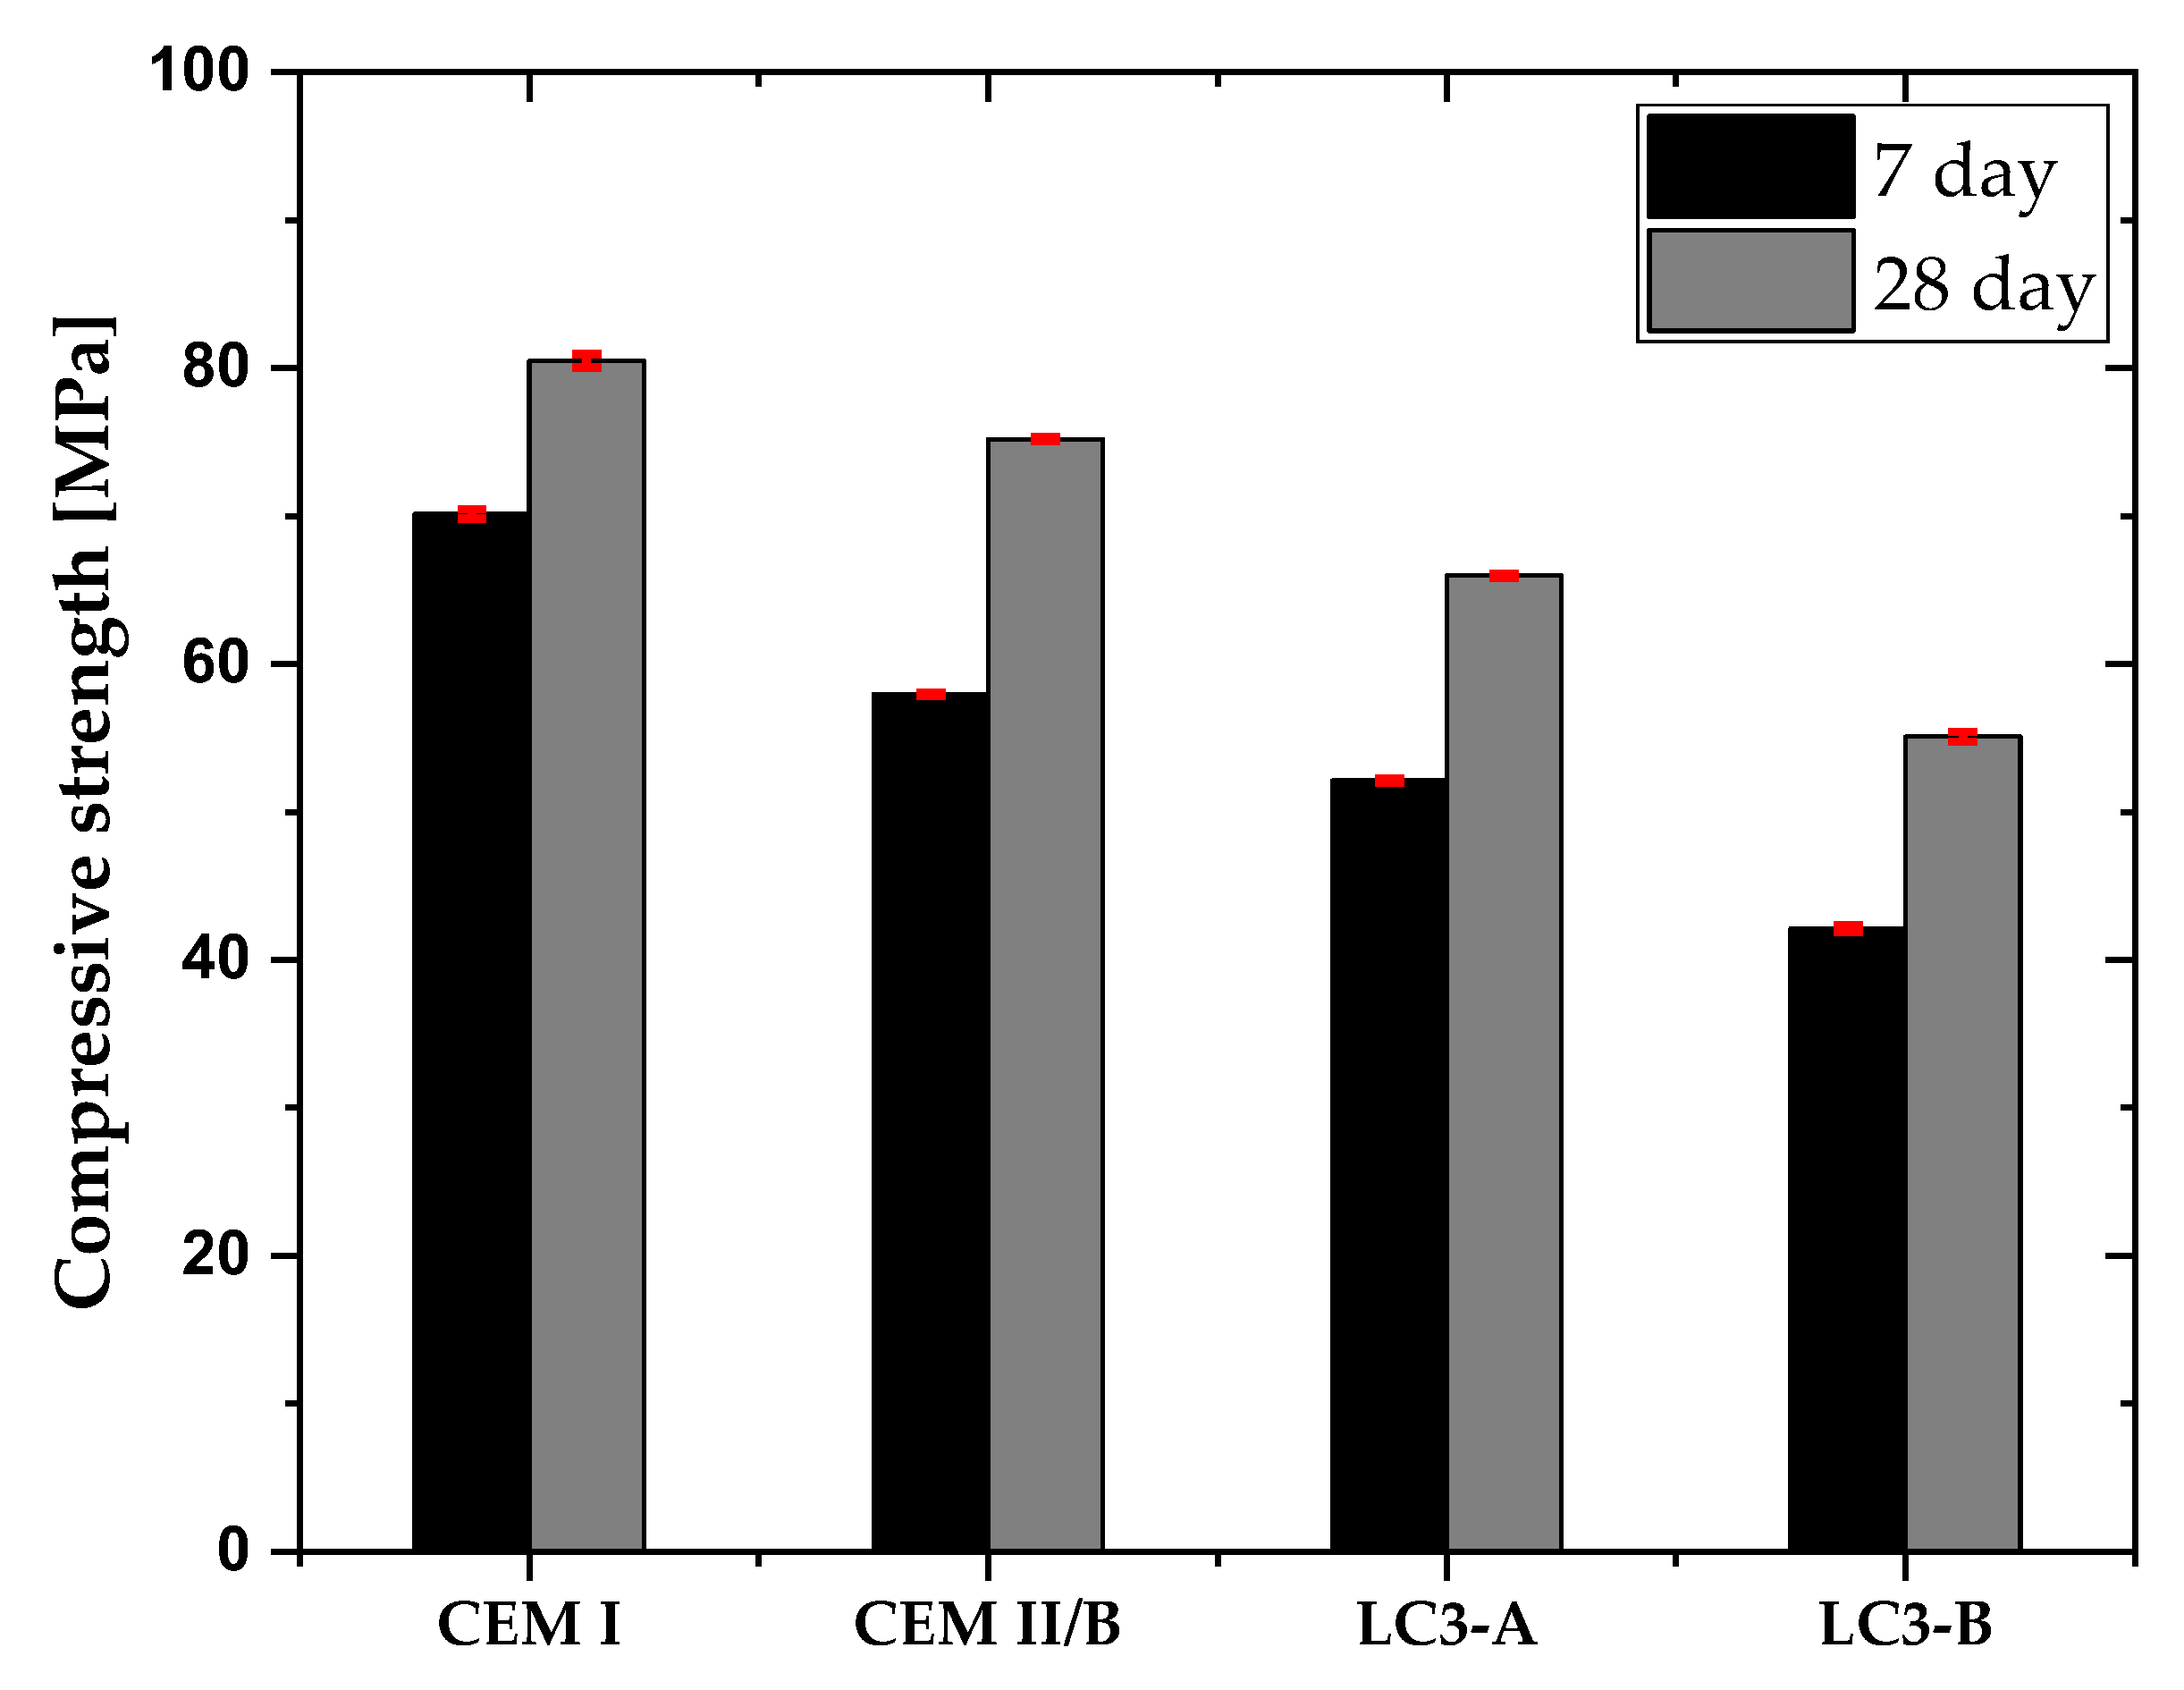
3.2. Fresh Properteis and Compressive Strength
3.3. Water Sorptivity Index
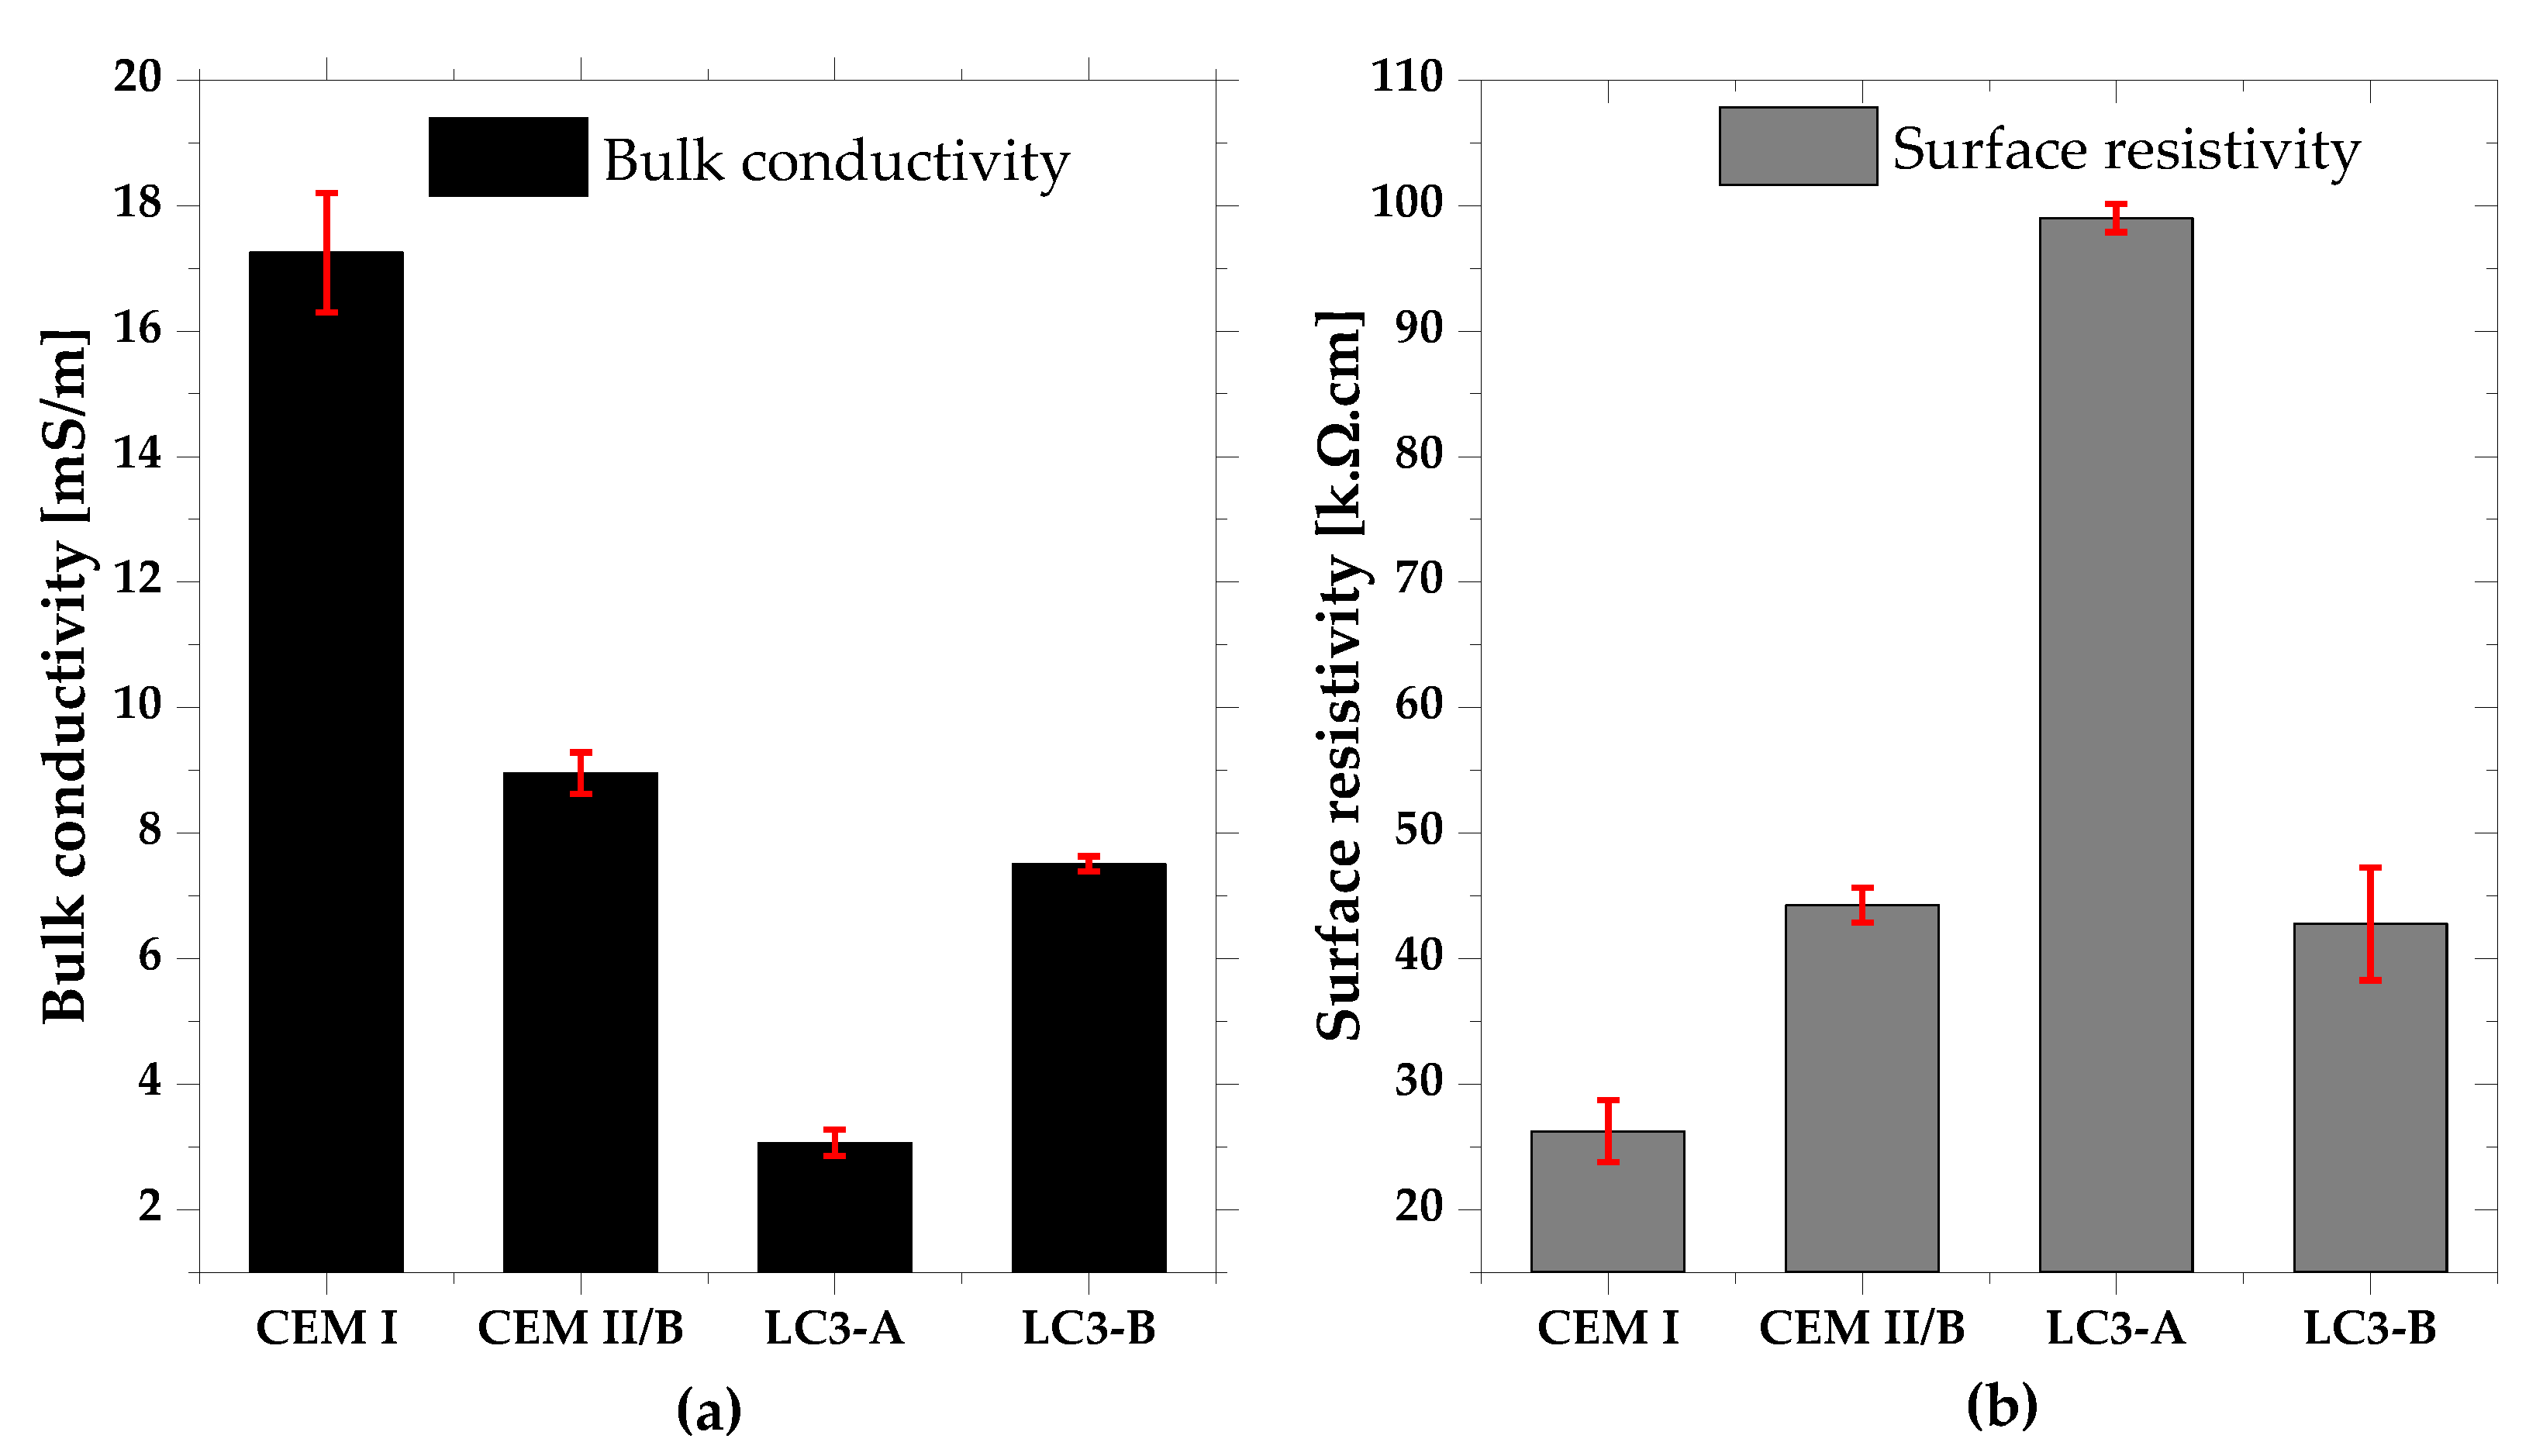
3.4. Bulk Conductivity and Surface Resistivity
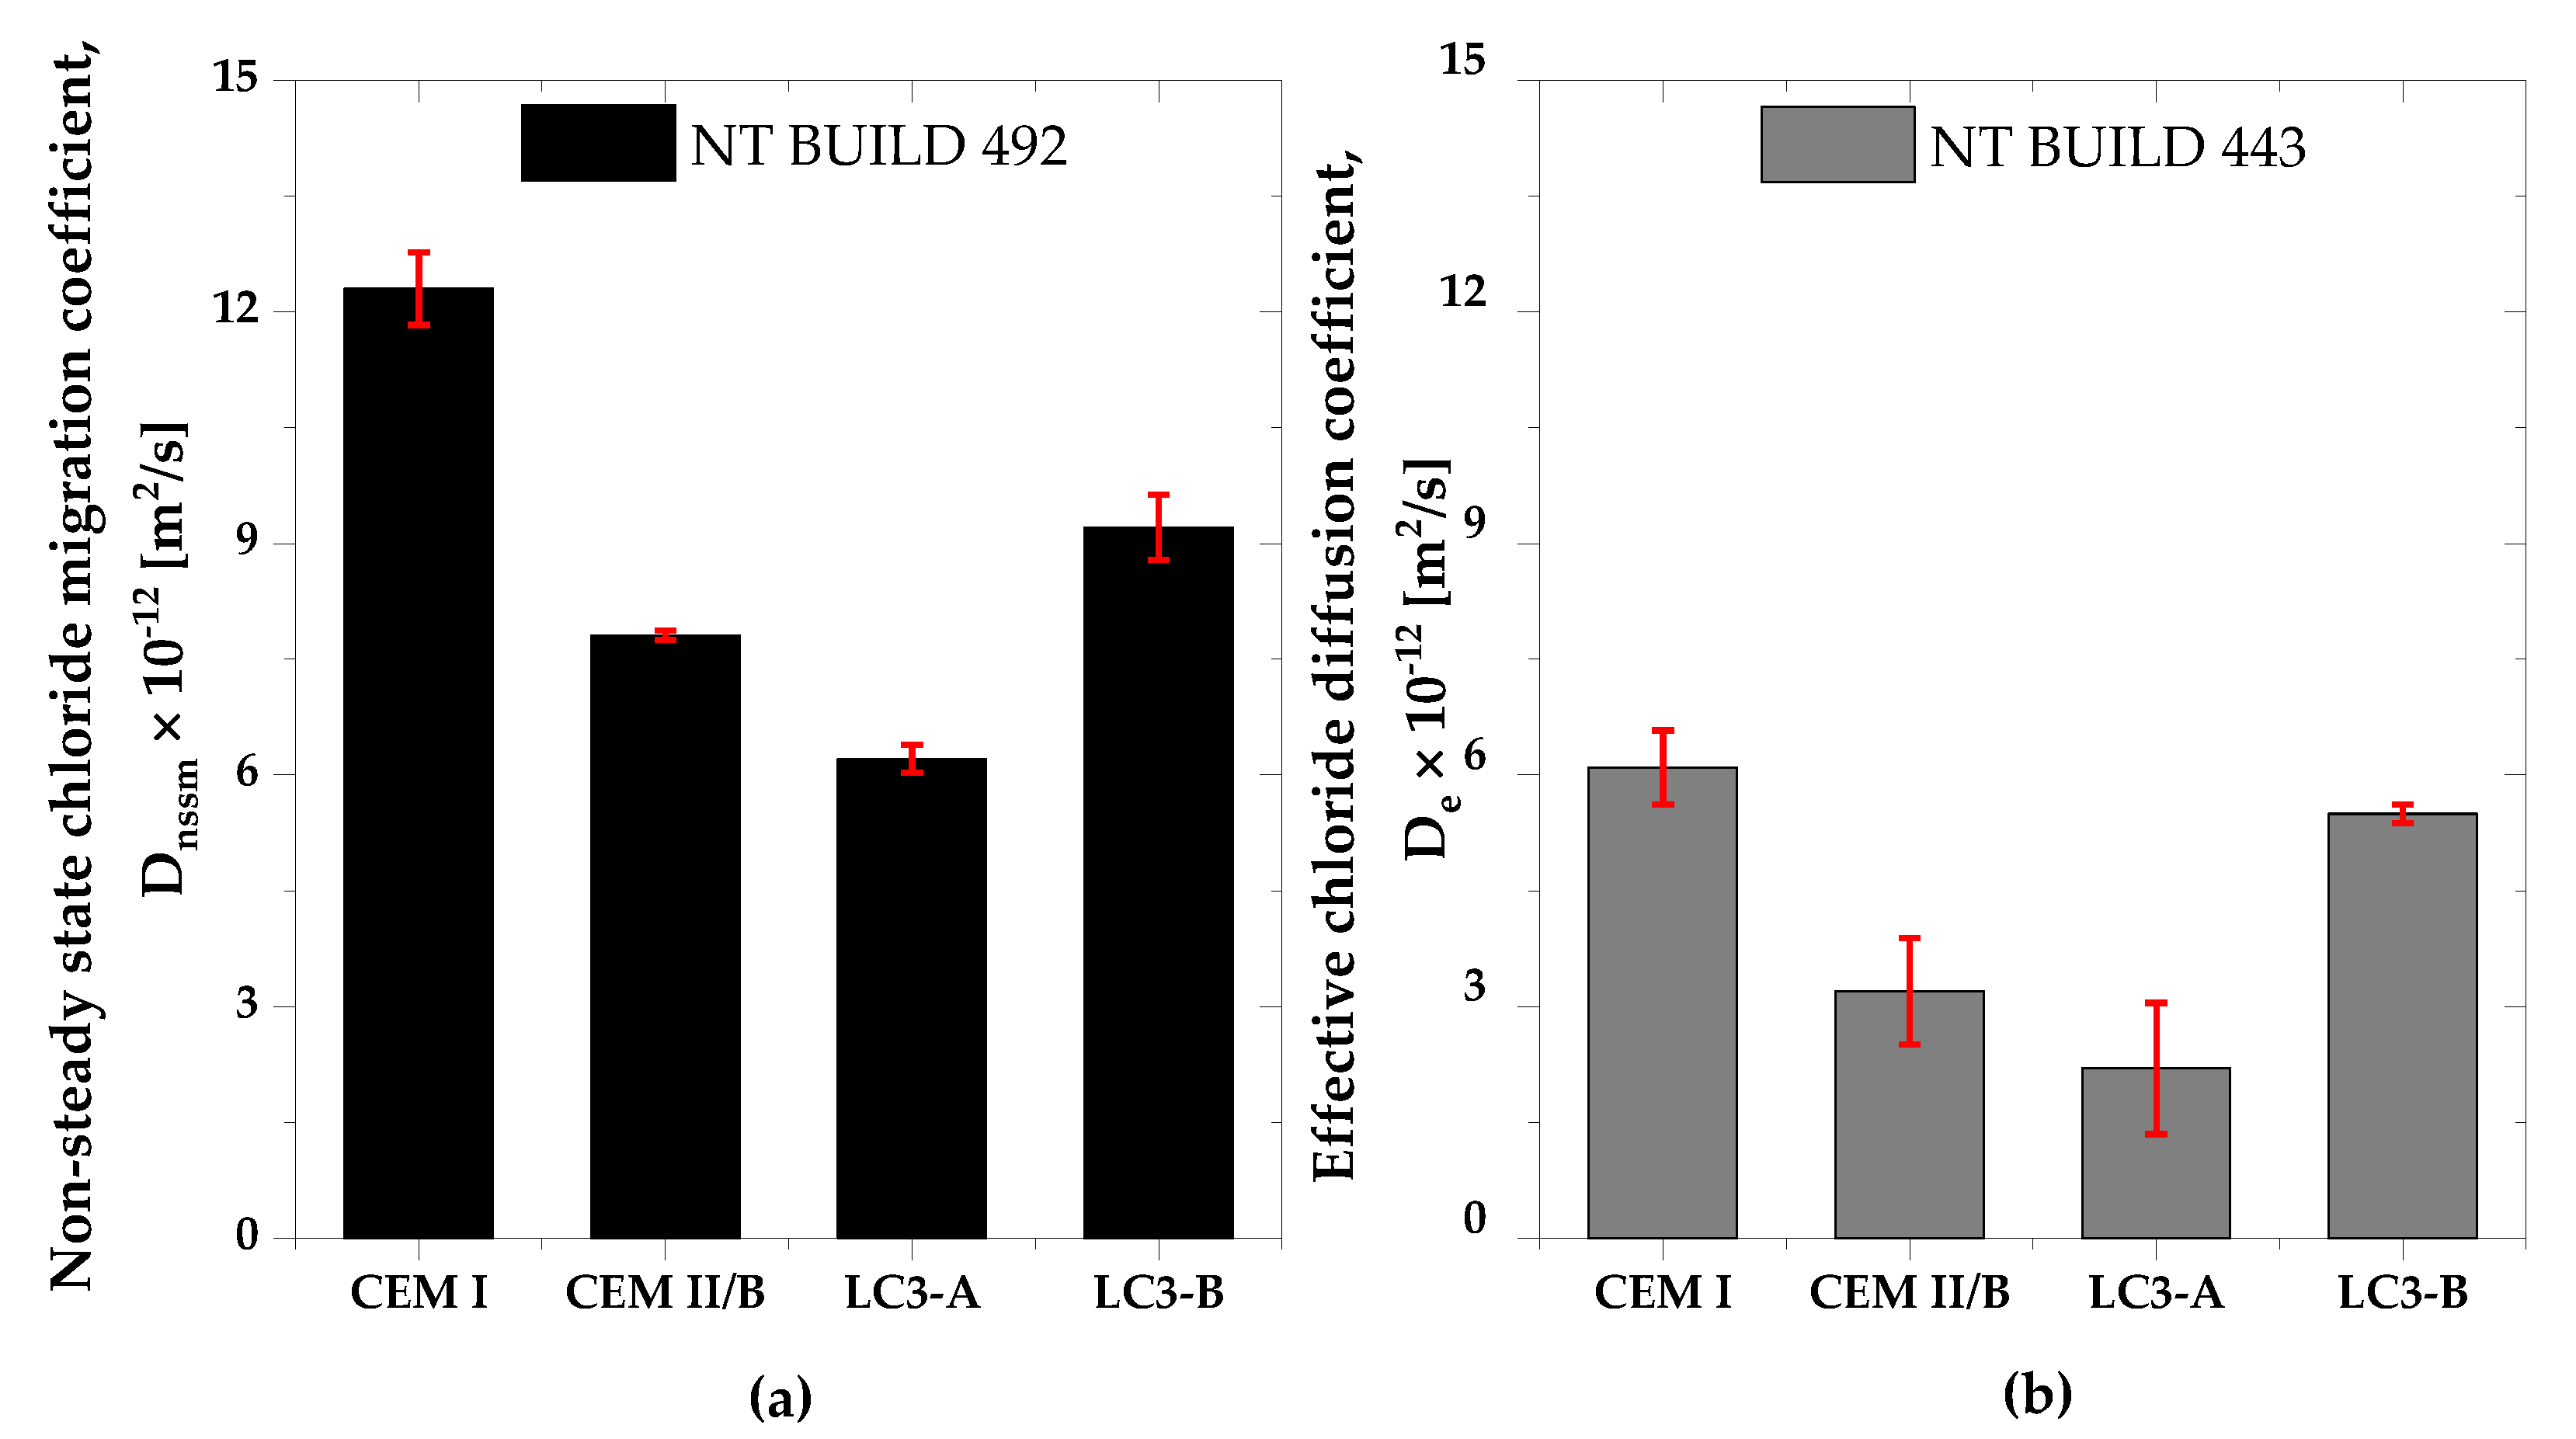
3.5. Chloride Migration and Chloride Diffusion
3.6. Pore Size Distribution
4. Discussion
5. Conclusions
- The compressive strength was found to be satisfactory even with low kaolin clay, even though higher kaolinitic clay was needed to attain comparable strength to that of CEM I and blended cement. Concrete with the higher kaolinitic clay was able to achieve around 85% of compressive strength compared to CEM I after 28 days.
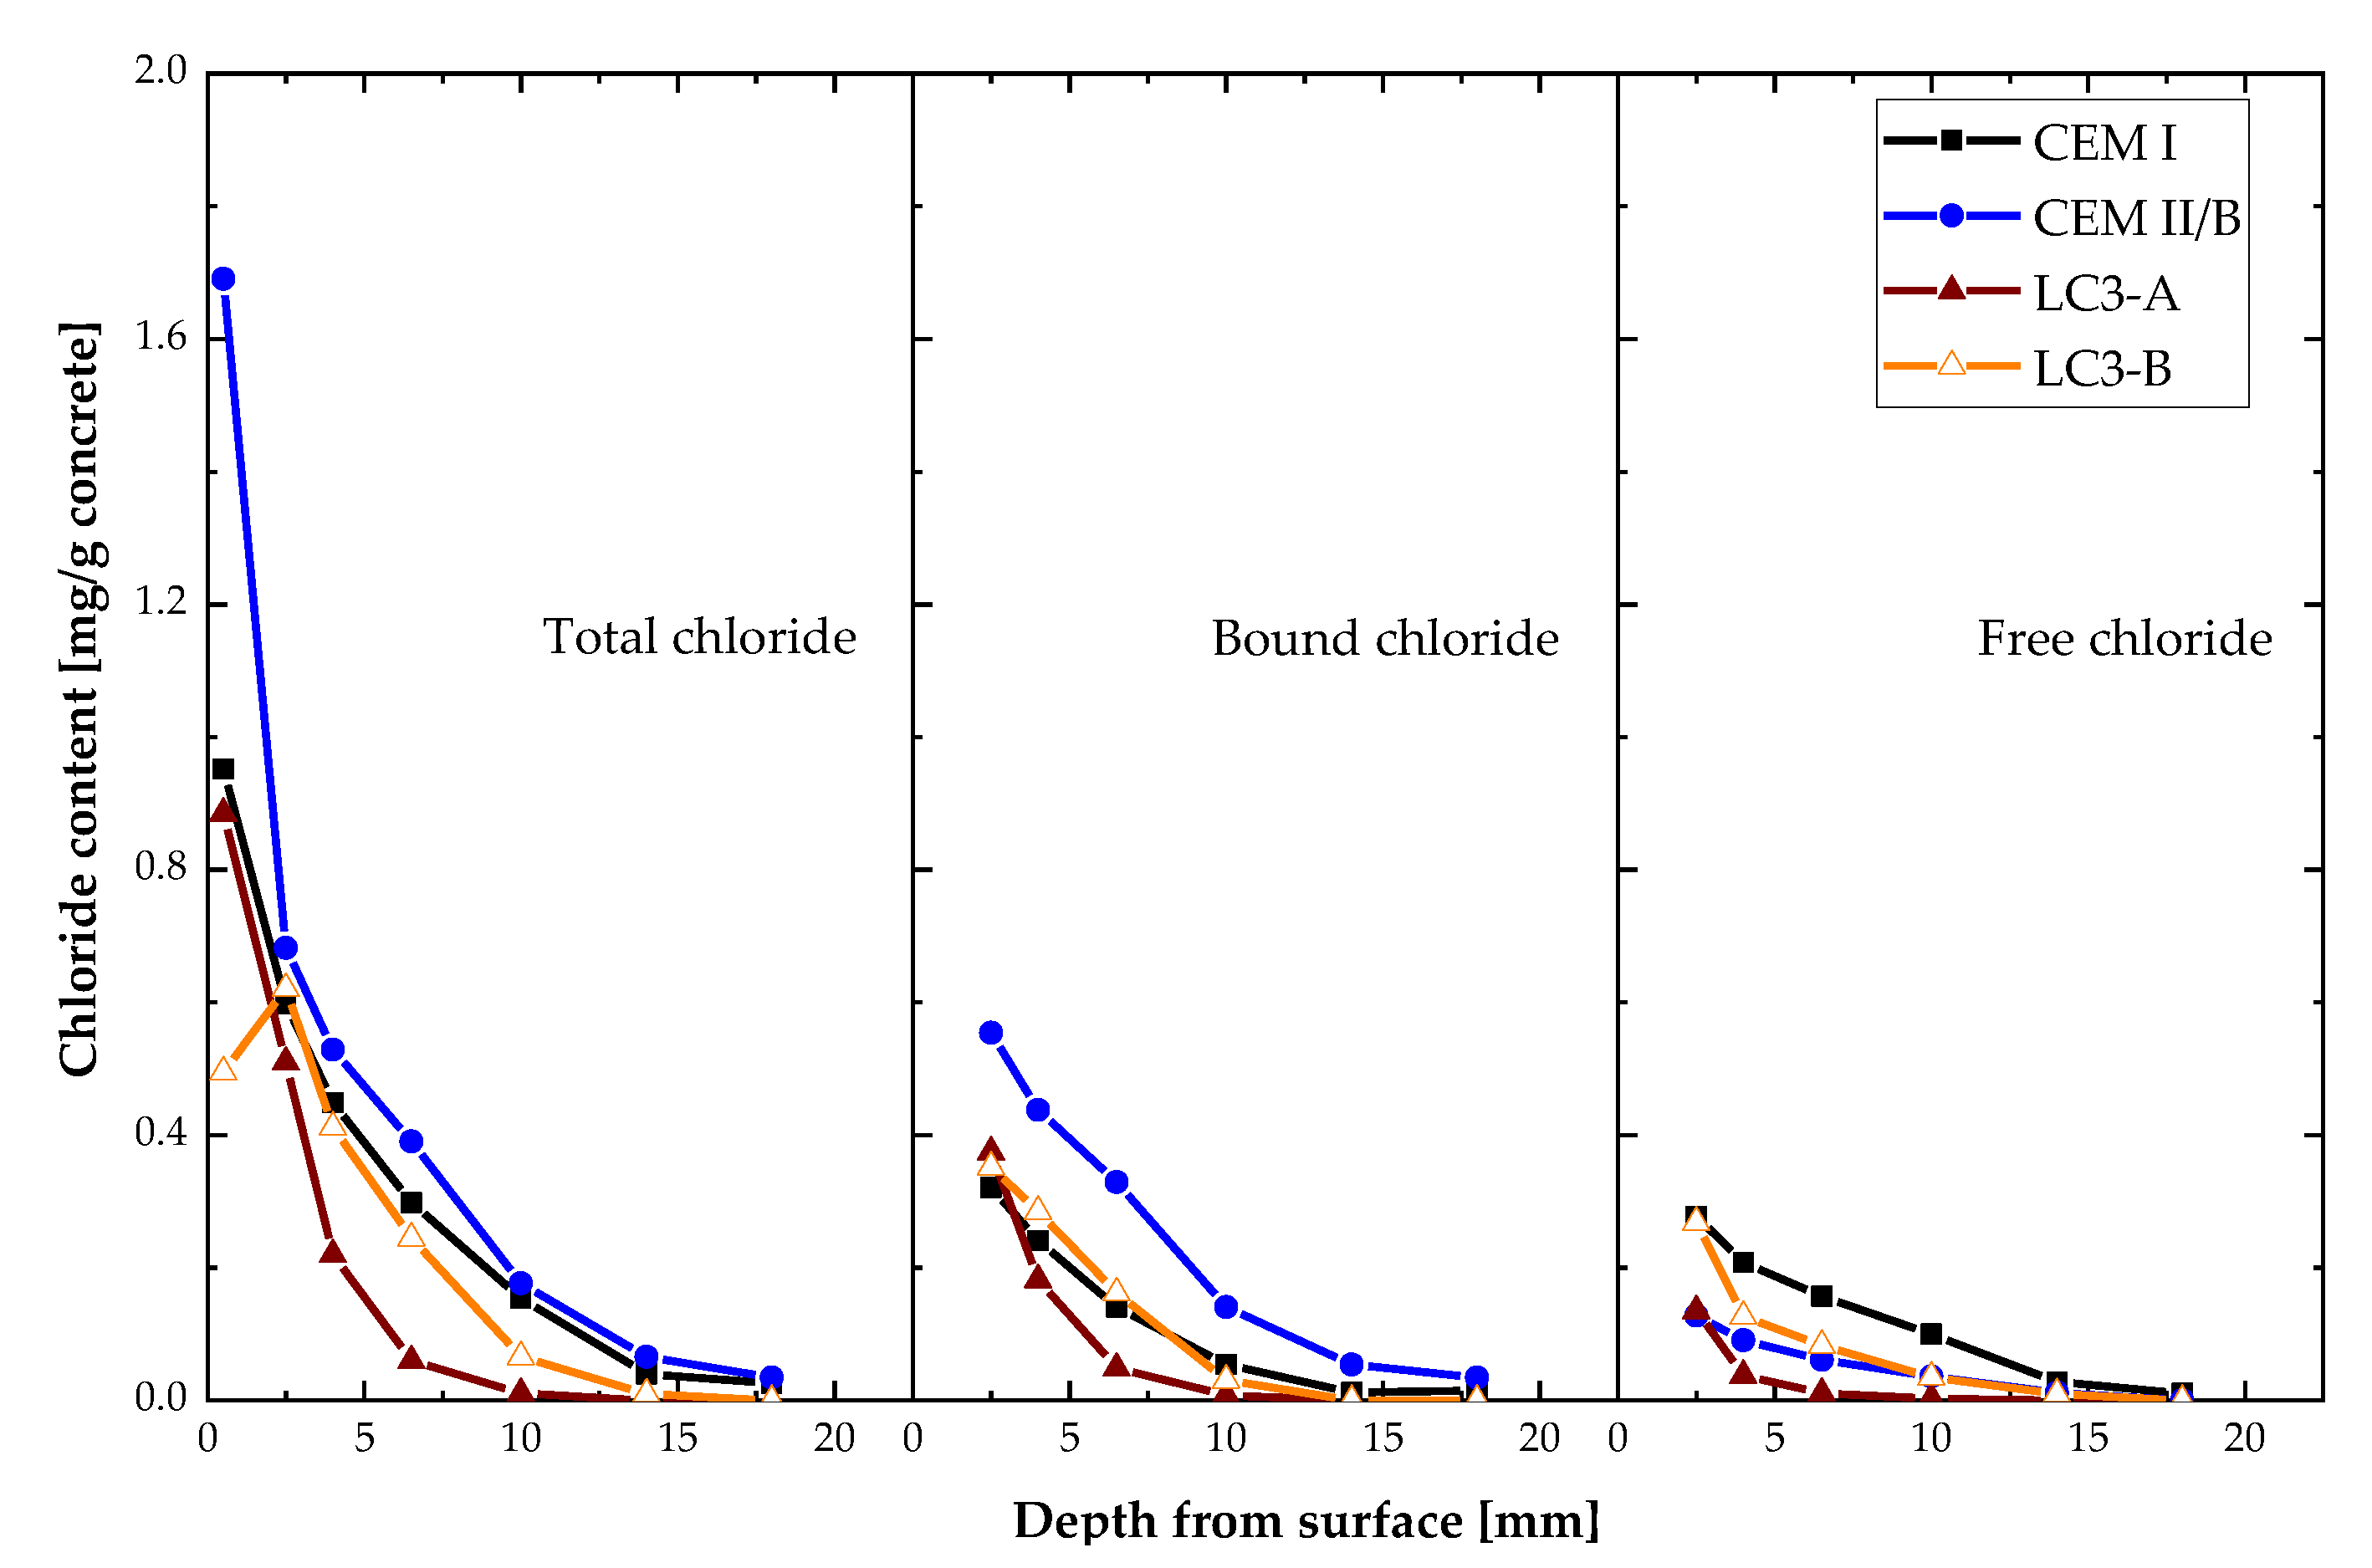
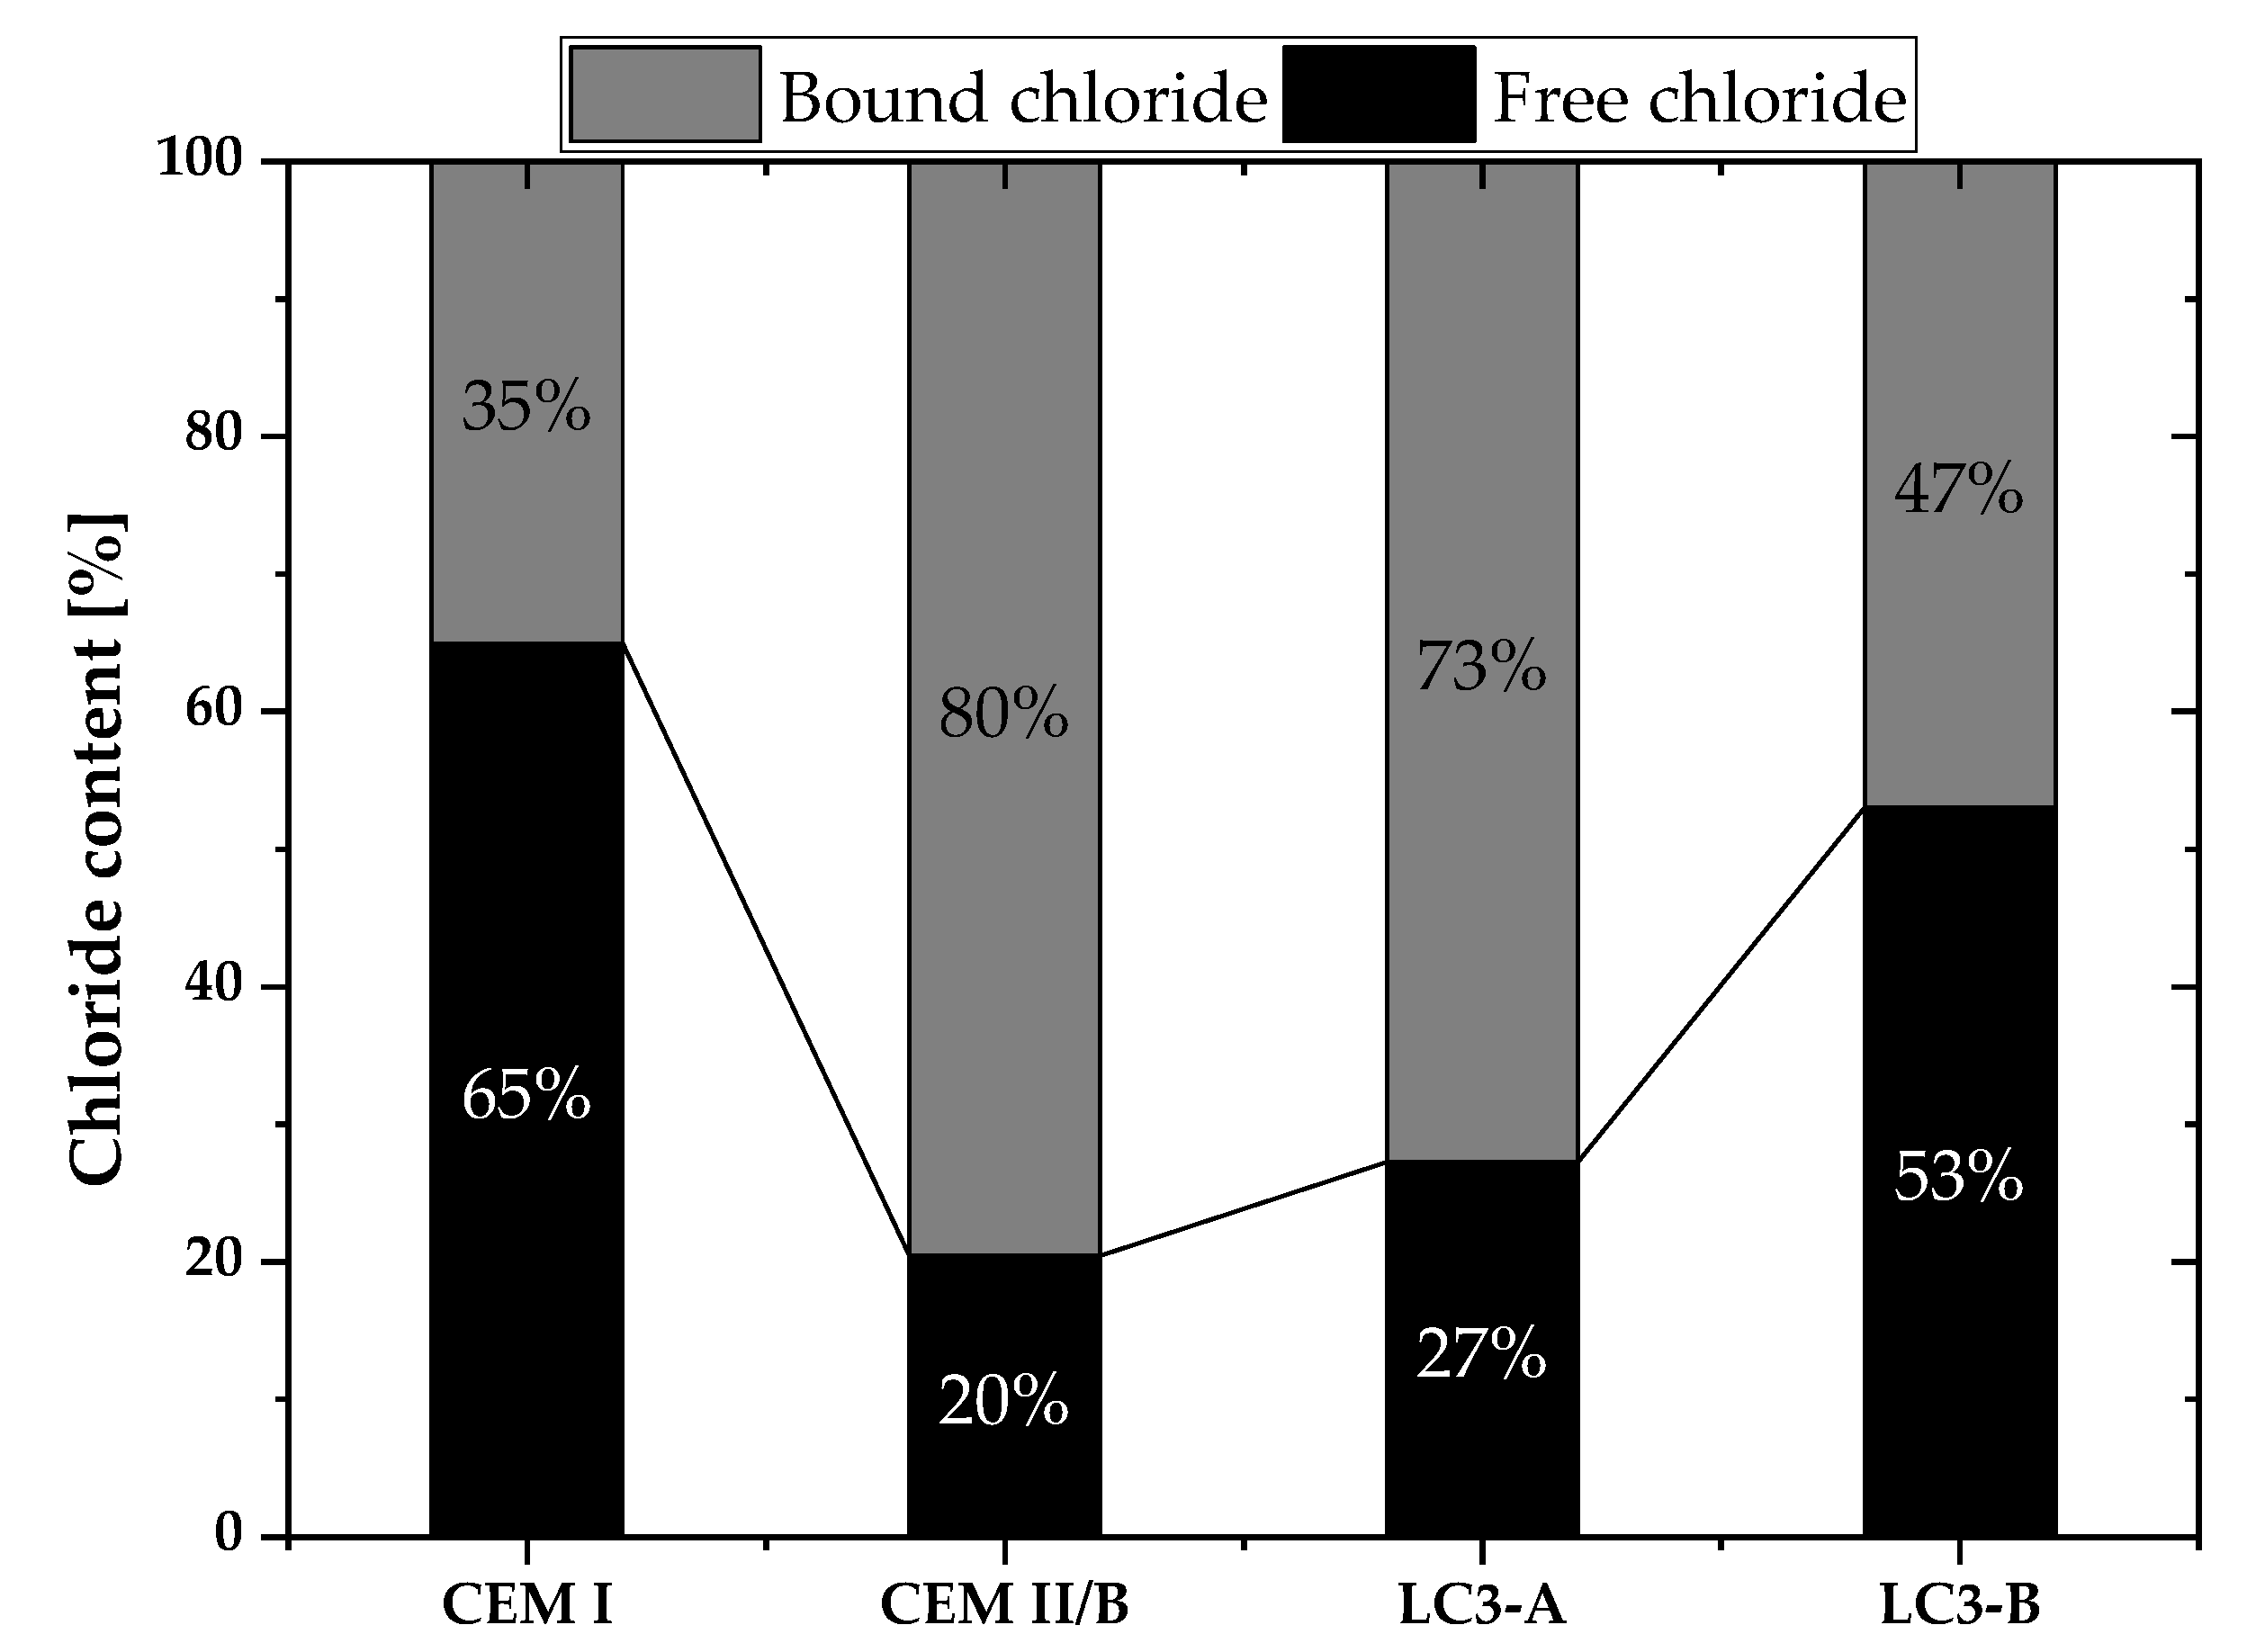
- Chloride penetration, electrical activity, and sorptivity of the concrete improved significantly with higher kaolinite content. Chloride diffusion and migration resistance improved by at least 50% compared to Portland cement system with higher kaolinitic clay. Among clays, the chloride penetration resistance differs by 30% and the sorptivity indices value differs by 41%. The kaolinite content was found to be very important in durability performances of LC3 concrete.
- Electric resistivity of the LC3-based concrete dominantly influenced the chloride penetration over the chloride binding and pore structure.
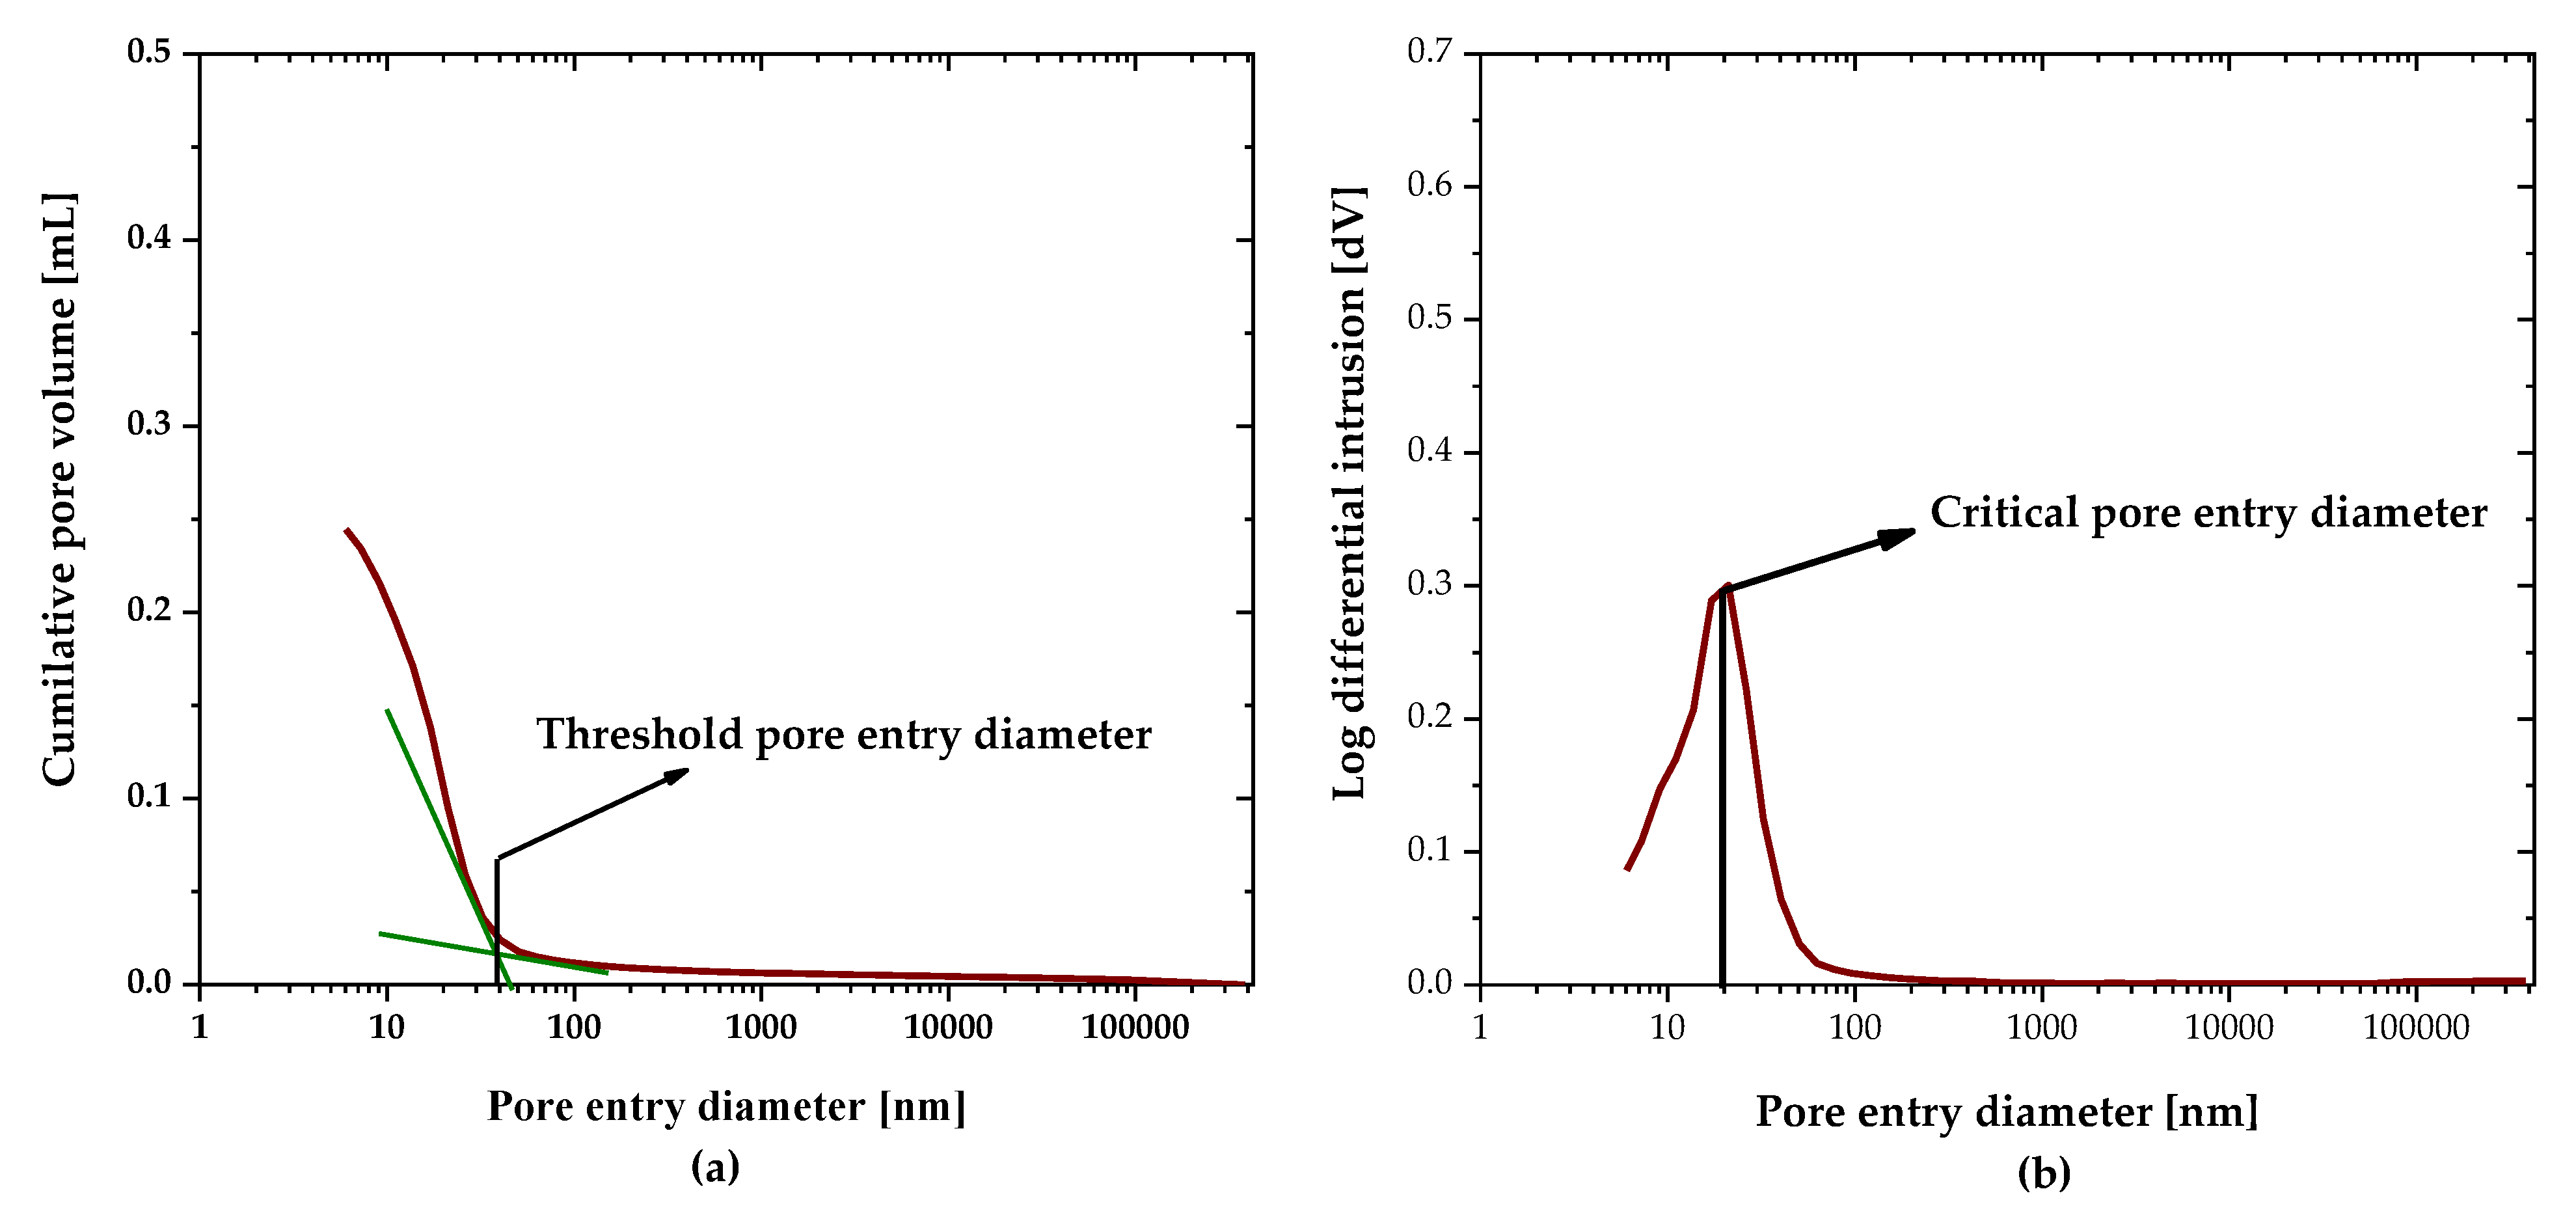
- In the pore structure parameters, the pore refinement (in terms of the critical pore entry diameter) controlled the chloride penetration, while the capillary pore volume was not identified as an important factor in the chloride penetration in the LC3 system in this study.
- Low-kaolinite clay (18% in this study) could be a potential material to make concrete for mild exposure conditions, while higher grade kaolin clay (42% in this study) would be needed for aggressive exposure conditions.
Author Contributions
Funding
Institutional Review Board Statement
Informed Consent Statement
Data Availability Statement
Acknowledgments
Conflicts of Interest
References
- WRI New Climate CA, State of Climate Action 2022 (in Preparation). 2022. Available online: https://gccassociation.org/concretefuture/getting-to-net-zero/ (accessed on 27 October 2022).
- Özbay, E.; Erdemir, M.; Durmuş, H.I. Utilization and efficiency of ground granulated blast furnace slag on concrete properties—A review. Constr. Build. Mater. 2016, 105, 423–434. [Google Scholar] [CrossRef]
- Wang, D.; Shi, C.; Farzadnia, N.; Shi, Z.; Jia, H. A review on effects of limestone powder on the properties of concrete. Constr. Build. Mater. 2018, 192, 153–166. [Google Scholar] [CrossRef]
- Sharma, M.; Bishnoi, S.; Martirena, F.; Scrivener, K. Limestone calcined clay cement and concrete: A state-of-the-art review. Cem. Concr. Res. 2021, 149, 106564. [Google Scholar] [CrossRef]
- Hemalatha, T.; Ramaswamy, A. A review on fly ash characteristics—Towards promoting high volume utilization in developing sustainable concrete. J. Clean. Prod. 2017, 147, 546–559. [Google Scholar] [CrossRef]
- Remaining EU Coal Power Polluters. Available online: https://ember-climate.org/insights/research/remaining-eu-coal-power-polluters/ (accessed on 27 October 2022).
- Scrivener, K.; Martirena, F.; Bishnoi, S.; Maity, S. Calcined clay limestone cements (LC3). Cem. Concr. Res. 2018, 114, 49–56. [Google Scholar] [CrossRef]
- Dhandapani, Y.; Sakthivel, T.; Santhanam, M.; Gettu, R.; Pillai, R.G. Mechanical properties and durability performance of concretes with Limestone Calcined Clay Cement (LC3). Cem. Concr. Res. 2018, 107, 136–151. [Google Scholar] [CrossRef]
- Dhandapani, Y.; Santhanam, M. Assessment of pore structure evolution in the limestone calcined clay cementitious system and its implications for performance. Cem. Concr. Compos. 2017, 84, 36–47. [Google Scholar] [CrossRef]
- Pillai, R.G.; Gettu, R.; Santhanam, M.; Rengaraju, S.; Dhandapani, Y.; Rathnarajan, S.; Basavaraj, A.S. Service life and life cycle assessment of reinforced concrete systems with limestone calcined clay cement (LC3). Cem. Concr. Res. 2019, 118, 111–119. [Google Scholar] [CrossRef]
- Dhandapani, Y.; Santhanam, M. Investigation on the microstructure-related characteristics to elucidate performance of composite cement with limestone-calcined clay combination. Cem. Concr. Res. 2019, 129, 105959. [Google Scholar] [CrossRef]
- Ram, K.; Serdar, M.; Londono-Zuluaga, D.; Scrivener, K. The effect of pore microstructure on strength and chloride ingress in blended cement based on low kaolin clay. Case Stud. Constr. Mater. 2022, 17, e01242. [Google Scholar] [CrossRef]
- Silva, A.S.; Gameiro, A.; Grilo, J.; Veiga, R.; Velosa, A. Long-term behavior of lime-metakaolin pastes at ambient temperature and humid curing condition. Appl. Clay Sci. 2014, 88–89, 49–55. [Google Scholar] [CrossRef] [Green Version]
- Tironi, A.; Trezza, M.A.; Scian, A.N.; Irassar, E.F. Assessment of pozzolanic activity of different calcined clays. Cem. Concr. Compos. 2013, 37, 319–327. [Google Scholar] [CrossRef]
- Fernandez, R.; Martirena, F.; Scrivener, K.L. The origin of the pozzolanic activity of calcined clay minerals: A comparison between kaolinite, illite and montmorillonite. Cem. Concr. Res. 2011, 41, 113–122. [Google Scholar] [CrossRef]
- Avet, F.; Scrivener, K. Investigation of the calcined kaolinite content on the hydration of Limestone Calcined Clay Cement (LC3). Cem. Concr. Res. 2018, 107, 124–135. [Google Scholar] [CrossRef]
- Yu, J.; Mishra, D.K.; Hu, C.; Leung, C.K.Y.; Shah, S.P. Mechanical, environmental and economic performance of sustainable Grade 45 concrete with ultrahigh-volume Limestone-Calcined Clay (LCC). Resour. Conserv. Recycl. 2021, 175, 105846. [Google Scholar] [CrossRef]
- Shoukry, H.; Perumal, P.; Abadel, A.; Alghamdi, H.; Alamri, M.; Abdel-Gawwad, H.A. Performance of limestone-calcined clay cement mortar incorporating high volume ferrochrome waste slag aggregate. Constr. Build. Mater. 2022, 350, 128928. [Google Scholar] [CrossRef]
- Flegar, M.; Serdar, M.; Londono-Zuluaga, D.; Scrivener, K. Regional waste streams as potential raw materials for immediate implementation in cement production. Materials 2020, 13, 5456. [Google Scholar] [CrossRef]
- Dixit, A.; Du, H.; Pang, S.D. Performance of mortar incorporating calcined marine clays with varying kaolinite content. J. Clean. Prod. 2021, 282, 124513. [Google Scholar] [CrossRef]
- Alujas, A.; Fernández, R.; Quintana, R.; Scrivener, K.L.; Martirena, F. Pozzolanic reactivity of low grade kaolinitic clays: Influence of calcination temperature and impact of calcination products on OPC hydration. Appl. Clay Sci. 2015, 108, 94–101. [Google Scholar] [CrossRef]
- Du, H.; Pang, S.D. Value-added utilization of marine clay as cement replacement for sustainable concrete production. J. Clean. Prod. 2018, 198, 867–873. [Google Scholar] [CrossRef]
- Snellings, R.; Cizer, Ö.; Horckmans, L.; Durdziński, P.T.; Dierckx, P.; Nielsen, P.; Van Balen, K.; Vandewalle, L. Properties and pozzolanic reactivity of flash calcined dredging sediments. Appl. Clay Sci. 2016, 129, 35–39. [Google Scholar] [CrossRef]
- Zunino, F.; Scrivener, K. Microstructural developments of limestone calcined clay cement (LC3) pastes after long-term (3 years) hydration. Cem. Concr. Res. 2022, 153, 106693. [Google Scholar] [CrossRef]
- Zunino, F.; Scrivener, K. Factors influencing the sulfate balance in pure phase C3S/C3A systems. Cem. Concr. Res. 2020, 133, 106085. [Google Scholar] [CrossRef]
- Avet, F.; Snellings, R.; Diaz, A.A.; Ben Haha, M.; Scrivener, K. Development of a new rapid, relevant and reliable (R3) test method to evaluate the pozzolanic reactivity of calcined kaolinitic clays. Cem. Concr. Res. 2016, 85, 1–11. [Google Scholar] [CrossRef]
- ASTM C1897-20; Standard Test Methods for Measuring the Reactivity of Supplementary Cementitious Materials by Isothermal Calorimetry and Bound Water Measurements. ASTM International: West Conshohocken, PA, USA, 2020.
- NT BUILD 492; Concrete, Mortar and Cement-Based Repair Materials: Chloride Migration Coefficient from Non-Steady State Migration Experiments. Nordtest Method: Espoo, Finland, 1999.
- NT BUILD 443; Concrete, Hardened: Accelerated Chloride Penetration. Nordtest Method: Espoo, Finland, 1995.
- HRN EN 14629:2007; Products and Systems for the Protection and Repair of Concrete Structures—Test methods—Determination of Chloride Content in Hardened Concrete (EN 14629:2007). Croatian Standards Institute: Zagreb, Croatia, 2007.
- ASTM International (American Society for Testing and Materials). ASTM C1760-12; Standard Test Method for Bulk Electrical Conductivity of Hardened Concrete. ASTM International: West Conshohocken, PA, USA, 2012.
- FDOT, FM 5-578; Florida Method of Test for Concrete Resistivity as an Electrical Indicator of Its Permeability. Florida Department of Transportation: Tallahassee, FL, USA, 2004.
- Alexander, M.; Ballim, Y.; Mackechnie, J.M. Durability Index Testing Procedure Manual; University of the Witwatersrand: Johannesburg, South Africa, 2018. [Google Scholar]
- Scrivener, K.; Snellings, R.; Lothenbach, B. A Practical Guide to Microstructural Analysis of Cementitious Materials; CRC Press Boca: Raton, FL, USA, 2016; Volume 540. [Google Scholar]
- Washburn, E.W. Note on a method of determining the distribution of pore sizes in a porous material. Proc. Natl. Acad. Sci. USA 1921, 7, 115–116. [Google Scholar] [CrossRef] [PubMed] [Green Version]
- ACI 222R-19; Guide to Protection of Reinforcing Steel in Concrete Against Corrosion. American Concrete Institute: Farmington Hills, MI, USA, 2019.
- Kumar, R.; Bhattacharjee, B. Porosity, pore size distribution and in situ strength of concrete. Cem. Concr. Res. 2003, 33, 155–164. [Google Scholar] [CrossRef]
- Cardinaud, G.; Rozière, E.; Martinage, O.; Loukili, A.; Barnes-Davin, L.; Paris, M.; Deneele, D. Calcined clay—Limestone cements: Hydration processes with high and low-grade kaolinite clays. Constr. Build. Mater. 2021, 277, 122271. [Google Scholar] [CrossRef]
- Krishnan, S.; Rao, D.G.; Bishnoi, S. Why Low-Grade Calcined Clays Are the Ideal for the Production of Limestone Calcined Clay Cement (LC 3). In Calcined Clays for Sustainable Concrete; Springer: Singapore, 2020; pp. 125–130. [Google Scholar]
- Hammat, S.; Menadi, B.; Kenai, S.; Thomas, C.; Kirgiz, M.S.; Galdino, A.G.D.S. The effect of content and fineness of natural pozzolana on the rheological, mechanical, and durability properties of self-compacting mortar. J. Build. Eng. 2021, 44, 103276. [Google Scholar] [CrossRef]
- Scrivener, K.; Avet, F.; Maraghechi, H.; Zunino, F.; Ston, J.; Hanpongpun, W.; Favier, A. Impacting factors and properties of limestone calcined clay cements (LC3). Green Mater. 2018, 7, 3–14. [Google Scholar] [CrossRef] [Green Version]
- Joshaghani, A.; Moeini, M.A.; Balapour, M.; Moazenian, A. Effects of supplementary cementitious materials on mechanical and durability properties of high-performance non-shrinking grout (HPNSG). J. Sustain. Cem. Mater. 2018, 7, 38–56. [Google Scholar] [CrossRef]
- Dhandapani, Y.; Vignesh, K.; Raja, T.; Santhanam, M. Development of the Microstructure in LC3 Systems, Calcined Clays Sustain. Construction 2018, 16, 131–140. [Google Scholar]
- Rengaraju, S.; Pillai, R.G. An accelerated chloride threshold test for uncoated steel in highly resistive cementitious systems (hr-ACT test). Constr. Build. Mater. 2021, 305, 124797. [Google Scholar] [CrossRef]
- Sui, S.; Georget, F.; Maraghechi, H.; Sun, W.; Scrivener, K. Towards a generic approach to durability: Factors affecting chloride transport in binary and ternary cementitious materials. Cem. Concr. Res. 2019, 124, 105783. [Google Scholar] [CrossRef]
- Dhanya, B.S.; Santhanam, M. Performance evaluation of rapid chloride permeability test in concretes with supplementary cementitious materials. Mater. Struct. 2017, 50, 1–9. [Google Scholar] [CrossRef]
- Zolfagharnasab, A.; Ramezanianpour, A.A.; Bahman-Zadeh, F. Investigating the potential of low-grade calcined clays to produce durable LC3 binders against chloride ions attack. Constr. Build. Mater. 2021, 303, 124541. [Google Scholar] [CrossRef]
- Maraghechi, H.; Avet, F.; Wong, H.; Kamyab, H.; Scrivener, K. Performance of Limestone Calcined Clay Cement (LC3) with various kaolinite contents with respect to chloride transport. Mater. Struct. 2018, 51, 125. [Google Scholar] [CrossRef] [Green Version]
- Wilson, W.; Georget, F.; Scrivener, K. Unravelling chloride transport/microstructure relationships for blended-cement pastes with the mini-migration method. Cem. Concr. Res. 2021, 140, 106264. [Google Scholar] [CrossRef]
- Song, H.W.; Lee, C.H.; Ann, K.Y. Factors influencing chloride transport in concrete structures exposed to marine environments. Cem. Concr. Compos. 2008, 30, 113–121. [Google Scholar] [CrossRef]
- Li, C.; Jiang, L.; Li, S. Effect of limestone powder addition on threshold chloride concentration for steel corrosion in reinforced concrete. Cem. Concr. Res. 2020, 131, 106018. [Google Scholar] [CrossRef]


| Chemical Oxides | CEM I 42.5R | CEM II/B | Clays | Limestone Powder | |
|---|---|---|---|---|---|
| A | B | ||||
| CaO | 63.19 | 46.94 | 2.17 | 2.39 | 71.59 |
| SiO2 | 19.51 | 33.65 | 62.41 | 61.77 | 20.21 |
| Al2O3 | 4.21 | 7.55 | 21.35 | 28.72 | 4.32 |
| Fe2O3 | 2.85 | 2.94 | 7.26 | 3.03 | 1.43 |
| MgO | 0.85 | 3.39 | 1.78 | 0.68 | 1.69 |
| Na2O | 0.20 | 0.78 | 1.05 | <0.01 | 0 |
| K2O | 0.48 | 0.74 | 2.50 | 2.3 | 0.15 |
| TiO2 | 0.12 | 0.22 | 0.94 | 0.87 | 0.52 |
| P2O5 | 0.45 | <0.01 | 0.36 | <0.01 | 0.42 |
| SO3 | 2.3 | 4.02 | 0.07 | 0.22 | 1.48 |
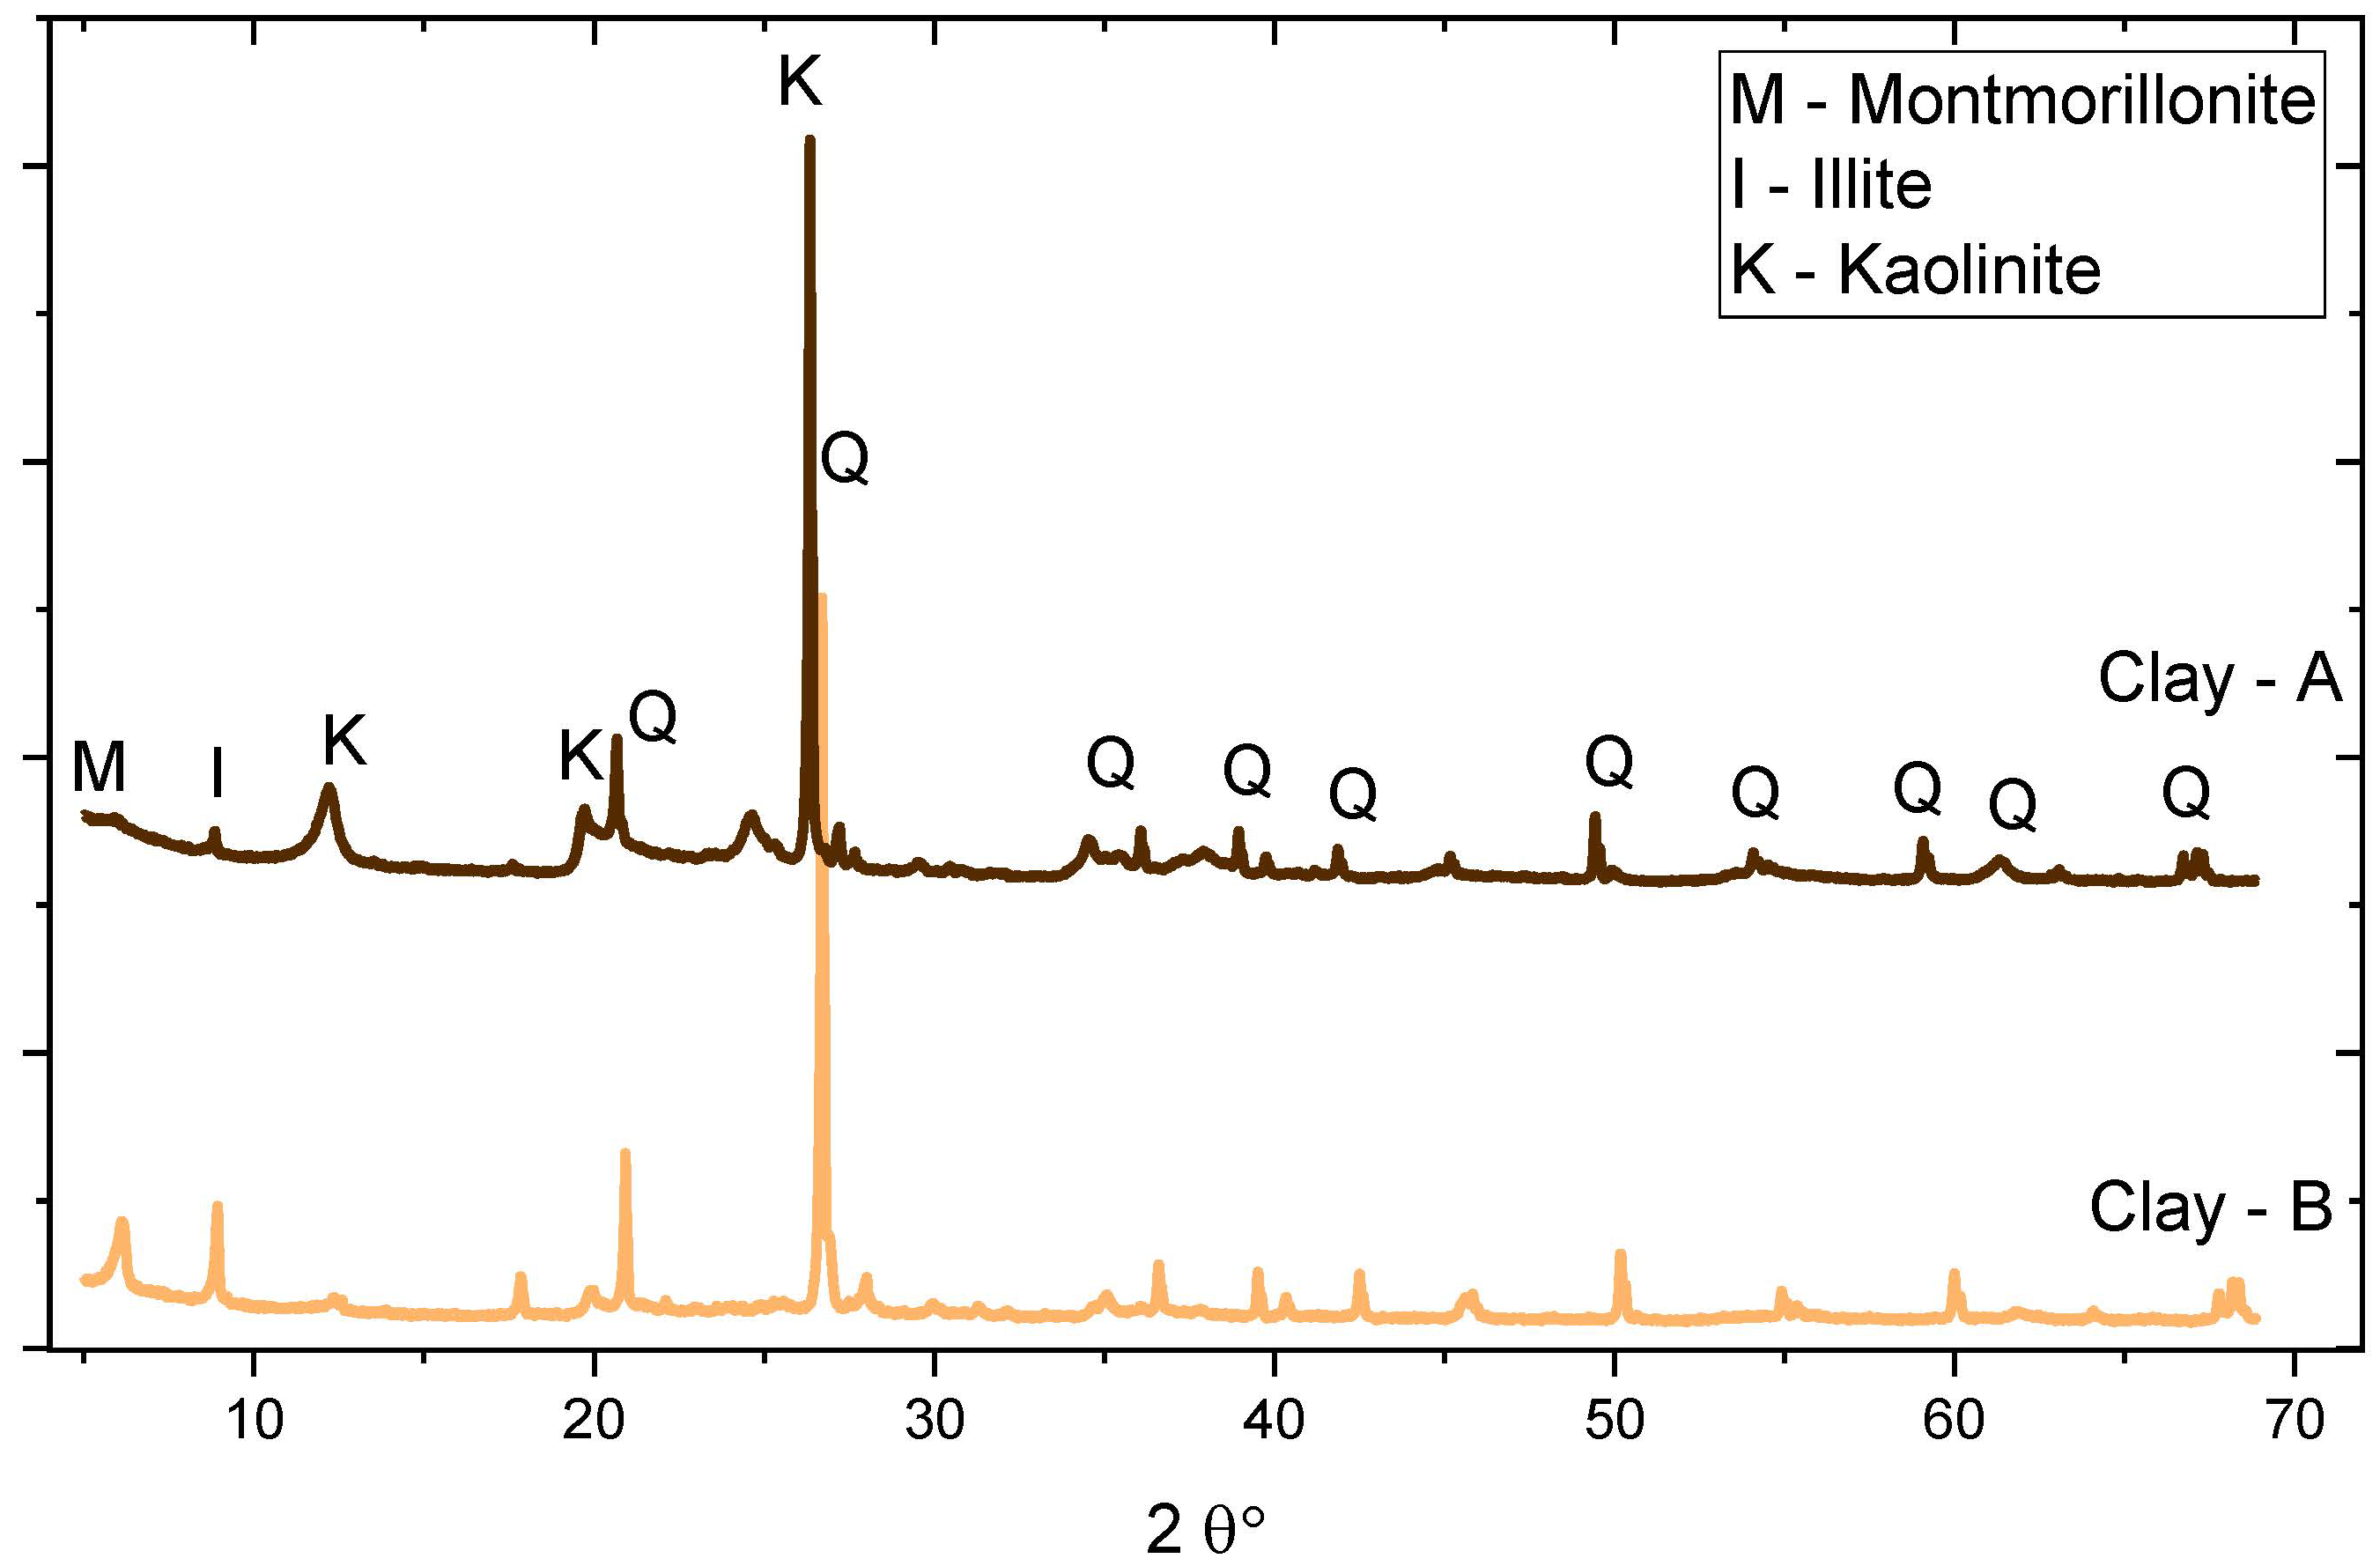
| Kaolinite content (%) | -- | 41.6 | 18 | -- | |
| Component | Clinker | Component | Clay-A | Clay-B |
|---|---|---|---|---|
| C3S | 56.4 (1) | Quartz | 23.2 (4) | 21.7 (1) |
| C2S | 5.4 (1) | Muscovite | 14.6 (1) | 27.3 (1) |
| C3A | 5.6 (1) | Rutile | 0.9 (2) | - |
| C4AF | 6.2 (1) | Kaolinite | 41.6 (1) | 18 |
| Property | Fine Aggregate (0/4) | Coarse Aggregate (4/8) | Coarse Aggregate (8/16) |
|---|---|---|---|
| Maximum particle size (mm) | 4 | 8 | 16 |
| Water absorption (%) | 1.3 | 0.6 | 0.3 |
| Specific gravity at SSD * | 2.79 | 2.81 | 2.82 |
| Mixture | Binder kg/m3 | w/b | Water, kg/m3 | Cement, kg/m3 | Calcined Clay, kg/m3 | LS kg/m3 | SP * | Aggregate, kg/m3 | ||
|---|---|---|---|---|---|---|---|---|---|---|
| % | 8–16 | 4–8 | 0–4 | |||||||
| CEM I | 340 | 0.40 | 136 | 340 | - | - | 0.7 | 510 | 512 | 1014 |
| CEM II | 132 | 340 | - | - | 1.2 | 518 | 520 | 1029 | ||
| LC3-A | 136 | 187 | 102 | 51 | 1.8 | 513 | 514 | 1018 | ||
| LC3-B | 136 | 340 | 102 | 51 | 1.1 | 536 | 538 | 1064 | ||
| Mixture | Paste Volume, L/m3 | Slump, mm | Temperature, °C | Wet Density, kg/m3 | Air Content, % |
|---|---|---|---|---|---|
| CEM I | 246.03 | 90 | 24.3 | 2512.1 | 3.5 |
| CEM II/B | 242.4 | 105 | 24.1 | 2539.9 | 3.1 |
| LC3-A | 261.01 | 100 | 23.5 | 2491.12 | 3.9 |
| LC3-B | 243.65 | 95 | 22.3 | 2395.3 | 2.8 |
Disclaimer/Publisher’s Note: The statements, opinions and data contained in all publications are solely those of the individual author(s) and contributor(s) and not of MDPI and/or the editor(s). MDPI and/or the editor(s) disclaim responsibility for any injury to people or property resulting from any ideas, methods, instructions or products referred to in the content. |
© 2022 by the authors. Licensee MDPI, Basel, Switzerland. This article is an open access article distributed under the terms and conditions of the Creative Commons Attribution (CC BY) license (https://creativecommons.org/licenses/by/4.0/).
Share and Cite
Ram, K.; Flegar, M.; Serdar, M.; Scrivener, K. Influence of Low- to Medium-Kaolinite Clay on the Durability of Limestone Calcined Clay Cement (LC3) Concrete. Materials 2023, 16, 374. https://doi.org/10.3390/ma16010374
Ram K, Flegar M, Serdar M, Scrivener K. Influence of Low- to Medium-Kaolinite Clay on the Durability of Limestone Calcined Clay Cement (LC3) Concrete. Materials. 2023; 16(1):374. https://doi.org/10.3390/ma16010374
Chicago/Turabian StyleRam, Kiran, Matea Flegar, Marijana Serdar, and Karen Scrivener. 2023. "Influence of Low- to Medium-Kaolinite Clay on the Durability of Limestone Calcined Clay Cement (LC3) Concrete" Materials 16, no. 1: 374. https://doi.org/10.3390/ma16010374
APA StyleRam, K., Flegar, M., Serdar, M., & Scrivener, K. (2023). Influence of Low- to Medium-Kaolinite Clay on the Durability of Limestone Calcined Clay Cement (LC3) Concrete. Materials, 16(1), 374. https://doi.org/10.3390/ma16010374