4.1. Theoretical Analyses
Inspired by the work of Wierzbicki on the multi-cell square [
58,
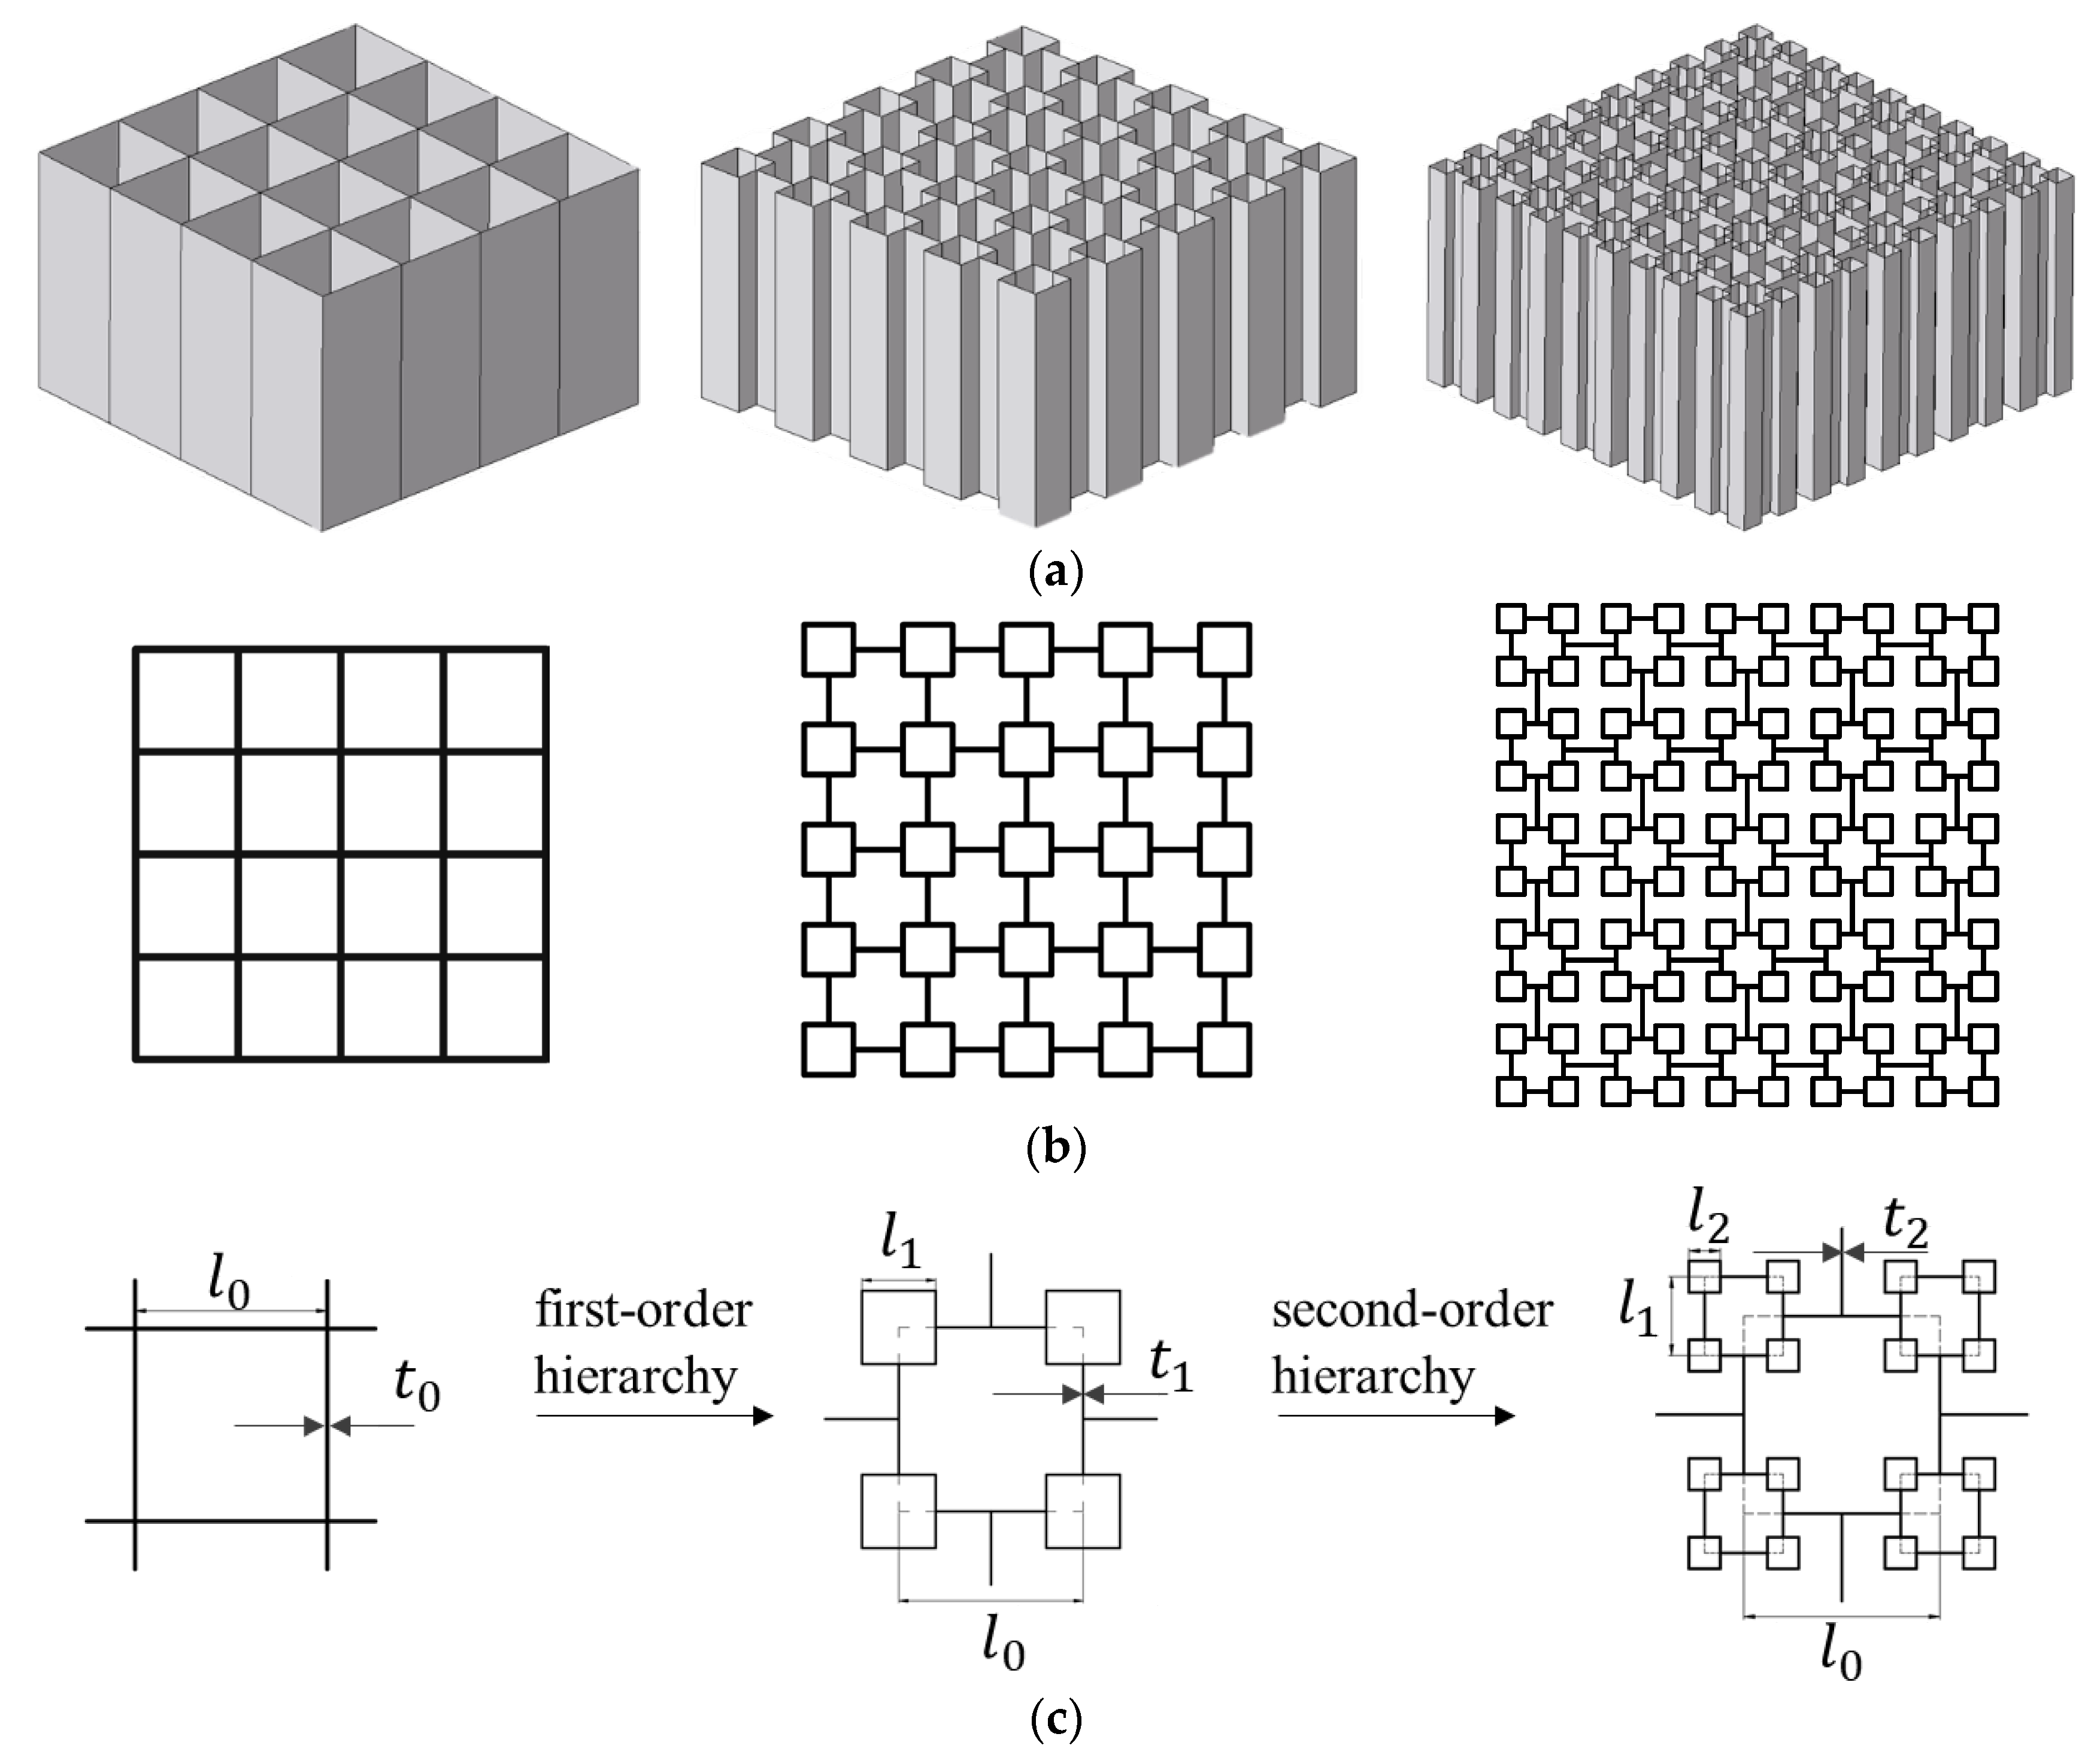
59], C-shape and T-shape as the basic elements for energy dissipation discretization of VHS were adopted. The previous structure added two new types of C-shape and T-shape elements after each order evolution, as demonstrated in
Figure 15. The vertices of the VHS were denoted by C-shape and T-shape, respectively, while the previous C-shape disappears (i.e., the C-shape element of VHS will only exist near the four vertices of the previous order). Hence, the total energy dissipation of the
n-order VHS in one wavelength can be expressed as
where
,
are the number of C-shapes and T-shapes, respectively, and
,
is the energy dissipation of the corresponding C-shape and T-shape, respectively.
is the row vector where the first
n−1 elements are all 0, and
is the column vector where the first
n−1 elements are all 0.
The Super-Folding Element method [
32,
58,
59] is used to analyze the crashworthiness of materials, as shown in
Figure 16. The energy dissipation can be composed of three regions:
,
and
, where
H is the half-wavelength and
b is the small radius of the toroidal shell, as illustrated in
Figure 16. It has been demonstrated in the literature that there is more complex deformation in the T-shape cell [
32]. The conical surface area may be further formed in the most core region Ⅰ, which leads to additional energy dissipation
[
32].
is the fully plastic bending moment calculated as
(
denotes the static yield stress of foil material and
c stands for the wall length of each fold) [
17].
However, experimental and simulated evidence suggests that this is currently rare. At the same time, the formation with or without conical surface zone Ⅳ is only a question of whether or not to add a coefficient related to
in the canonical calculation equation, which will be discussed in detail later. To be conservative, the energy dissipation analysis in this section considers only the deformation of zones Ⅰ, Ⅱ, Ⅲ. The composition of the energy dissipation of the C-shape and the T-shape [
32] is provided in
Table 6.
For the calculation of zone Ⅱ, it is necessary to obtain the length of the horizontal hinge line of each unit involved in this deformation, which is theoretically impossible to find out one by one. To facilitate the handling of this part of energy dissipation, assuming that each part of the material is fully involved in the deformation of zone Ⅱ. Hence, the total length of the material’s cross-section was the sum of all units’ horizontal hinge lines in the zone Ⅱ. Finally, we can obtain
From Equations (19)–(22), the energy dissipation of the VHS at a given wavelength can be derived as follows
Assuming that the parent structure of the VHS is the multi-cell square with
, the number of different energy dissipation elements of the
n-order VHS can be directly obtained, as illustrated in
Table 7.
Obviously,
in
Table 7 should be greater than 0. For the C-shape and T-shape elements,
, and
0.58,
1.11,
is derived as follows
Let
, where
is the total number of C-shape and T-shape, which can be calculated from
Table 7 as follows
From the conservation of dissipated energy, we can find
By substituting
into Equation (26), we can obtain
The half wavelength of folding can be determined by the stationary condition as
,
. Hence,
H,
b and
are derived as follows
Significantly, the three coefficients 0.58, 2, and 1.11 in Equation (30) can be interpreted as the contribution of the Super-Folding Element’s three typical deformation zones , , and Ⅲ to the VHS. Similarly, if the material develops a conical surface zone Ⅳ during crushing, only a relevant factor needs to be added to Equation (30). For a given initial structure, only the values of and determine the values of .
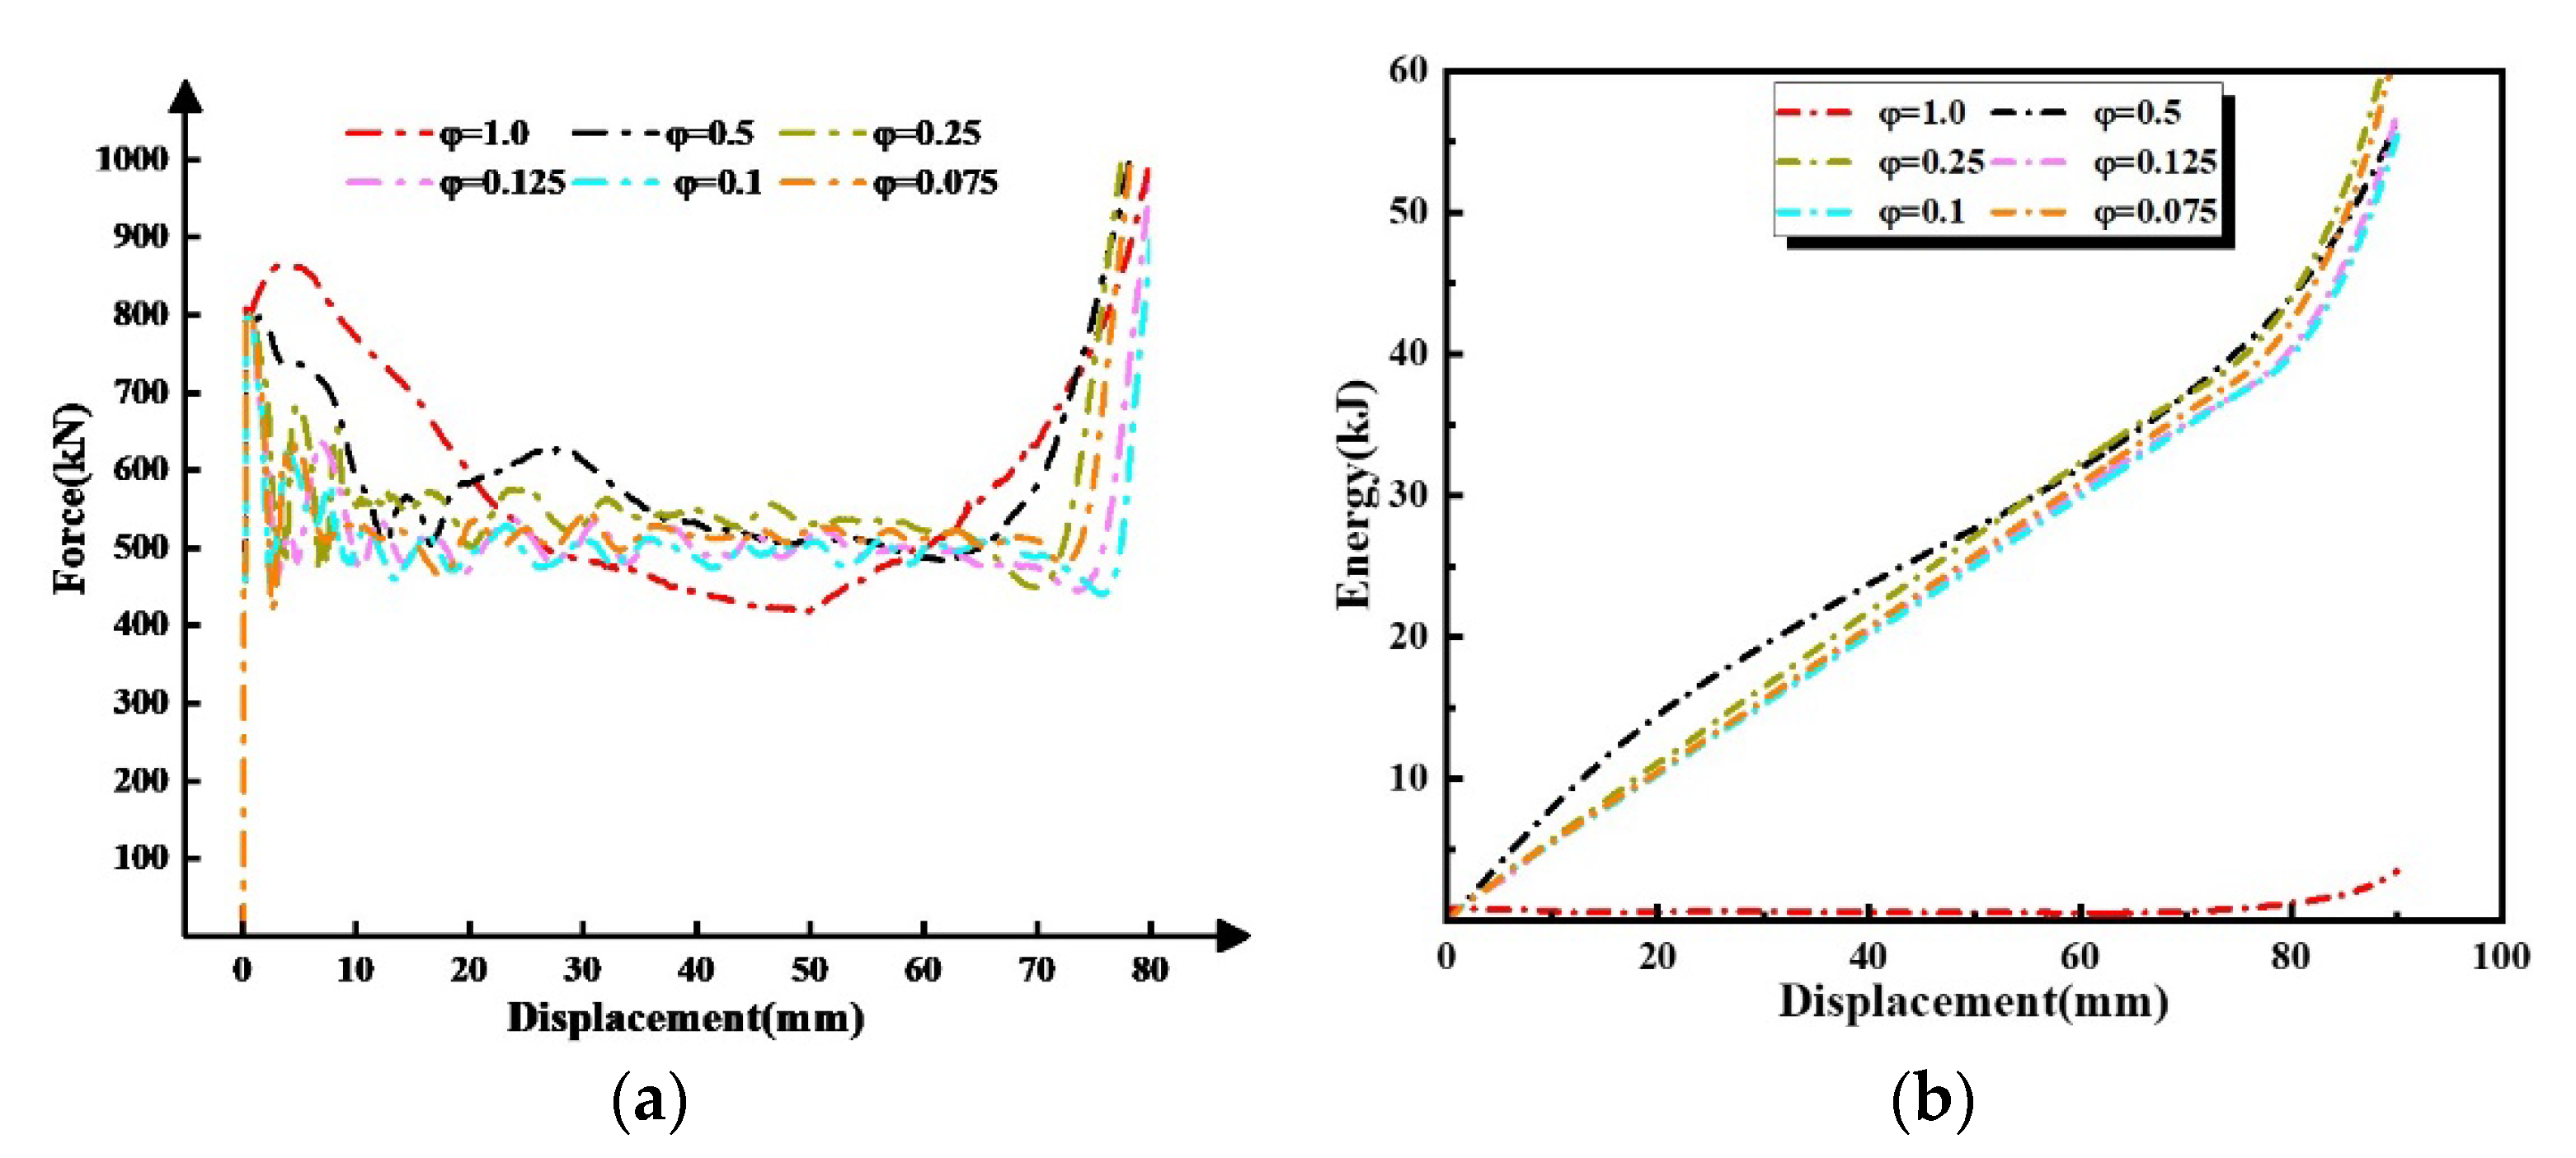
Figure 17 compares the theoretical and numerical results of the mean crushing force for the first-order VHS with different values of
. Since the theoretical derivation in this paper is conservative, this phenomenon is justified. The theoretical results were always smaller than the numerical ones, and only when
. The fluctuations of the curve of the theoretical and numerical results are in good agreement for the VHS with
. While for the VHS with
, only when
do the fluctuations of the curve of the theoretical and numerical results agree well. As can be observed from
Table 2, the thickness of the VHS decreases significantly as the values of
continue to increase. It is also clear from Equation (30) that the values of
and
remain unchanged for a given
i-th VHS. At this point, the only factor determining the values of
is the thickness, which can also be considered as
. Hence, the values of
decrease significantly as the values of
increase, which is consistent with the numerical results. This demonstrates that the thickness of the material has a profound effect on the out-of-plane deformation mechanism of the VHS.
4.2. Analysis of the VHS Out-of-Plane Deformation Mechanism
Figure 18 illustrates the deformation of the first-order VHS with
equal to 0.1, 0.25, and 0.5 for a compression ratio (
) of 0.5, respectively. All deformations started at the bottom, which was fixed and progressed toward the loaded end. The VHS with
has the greatest material thickness of the three and the greatest length-to-slenderness ratio of the tube in which its sub-structure is located. As can be observed from
Figure 18a, the deformation is a progressive folding of the entire material at a larger half-wavelength, guided by the rod-like buckling produced by the sub-structure. Its deformation is not consistent with the theoretical model based on the Super-Folding Element in
Section 4.1, which explains why its mean crushing force is much lower than the theoretical results according to
Figure 17. As can be observed from
Figure 18b, for a VHS with
, the deformation is divided into two processes. First, the sub-structure appears to fold progressively with the whole material at a smaller half-wavelength, a stage that can be explained by the Super-Folding Element. Then, when the material is compressed to a certain stage, part of the sub-structure demonstrates bending similar to that of the VHS with
, which then triggers a larger half-wavelength folding of the whole material. Compared to the other two VHS, the deformation of the VHS with
is the most consistent with the Super-Folding Element, which has the smallest half-wavelength of the fold, the densest folds, and the numerical results for mean crushing force agree well with the theoretical results.
Figure 19 demonstrates that both theoretical results accurately predict that the mean crushing force of the second-order VHS decreases rapidly with increasing values of
. Again, the theoretical results remain smaller than the numerical results. In contrast to the first-order VHS, the theoretical results of the second-order VHS with
are in better agreement with the simulation results. The numerical results of the second-order VHS with
and
demonstrate the greatest deviation from the theoretical results. Referring to
Table 1, by varying the values of
, the material thickness of the second-order VHS with
has the widest range of variation. This means that when it is subjected to out-of-plane loading, its local structure takes on more varied forms of buckling, which in turn leads to changes in the out-of-plane deformation regime of the material as a whole. As a result, the mean crushing force of the numerical results differs significantly from the theoretical results based on the Super-Folding Element.
4.3. Comparison of the VHS with the Conventional Honeycomb
As one of the most common crashworthiness structures, conventional honeycomb structures have excellent energy absorption and structural protection properties and are widely used in engineering applications. In this part, the conventional multi-cell square, first-order VHS, and second-order VHS are compared with the conventional honeycomb under out-of-plane loading. From
Section 3, the first-order VHS with
= 0.3 and the second-order VHS with
= 0.3,
= 0.1 were chosen, which have better performance than others. To achieve the same geometric configuration and weight as the VHS as far as possible, the honeycomb was chosen in the geometry of
Figure 20, with
H equal to 100 mm and
equal to 0.9 mm, while the material thickness of the red part in
Figure 20a is twice as thick as the other parts.
The
SEA and
for the same weight are plotted in
Figure 21 to visually compare the crashworthiness characteristics of these four structures. The crashworthiness of the conventional honeycomb is far superior to the conventional multi-cell square in every respect. Even compared to first-order VHS with
= 0.3,
SEA and
of the honeycomb are 6% and 3% higher, respectively, and the fluctuations of force in plateau stages are smaller. However, the second-order VHS with
= 0.3 and
= 0.1 has a 15% higher
SEA and 13% higher
than the conventional honeycomb, and a longer plateau stage. Overall, VHS has a greater potential for crashworthiness than conventional honeycombs. It deserves to be studied in depth.


