
Scaled Model Tests Investigating Deformation Characteristics of Geosynthetic Reinforced Soil (GRS) Abutments under Vertical Loads
 ,
,
Abstract
:1. Introduction
2. Model Test Geometry, Material, and Plan
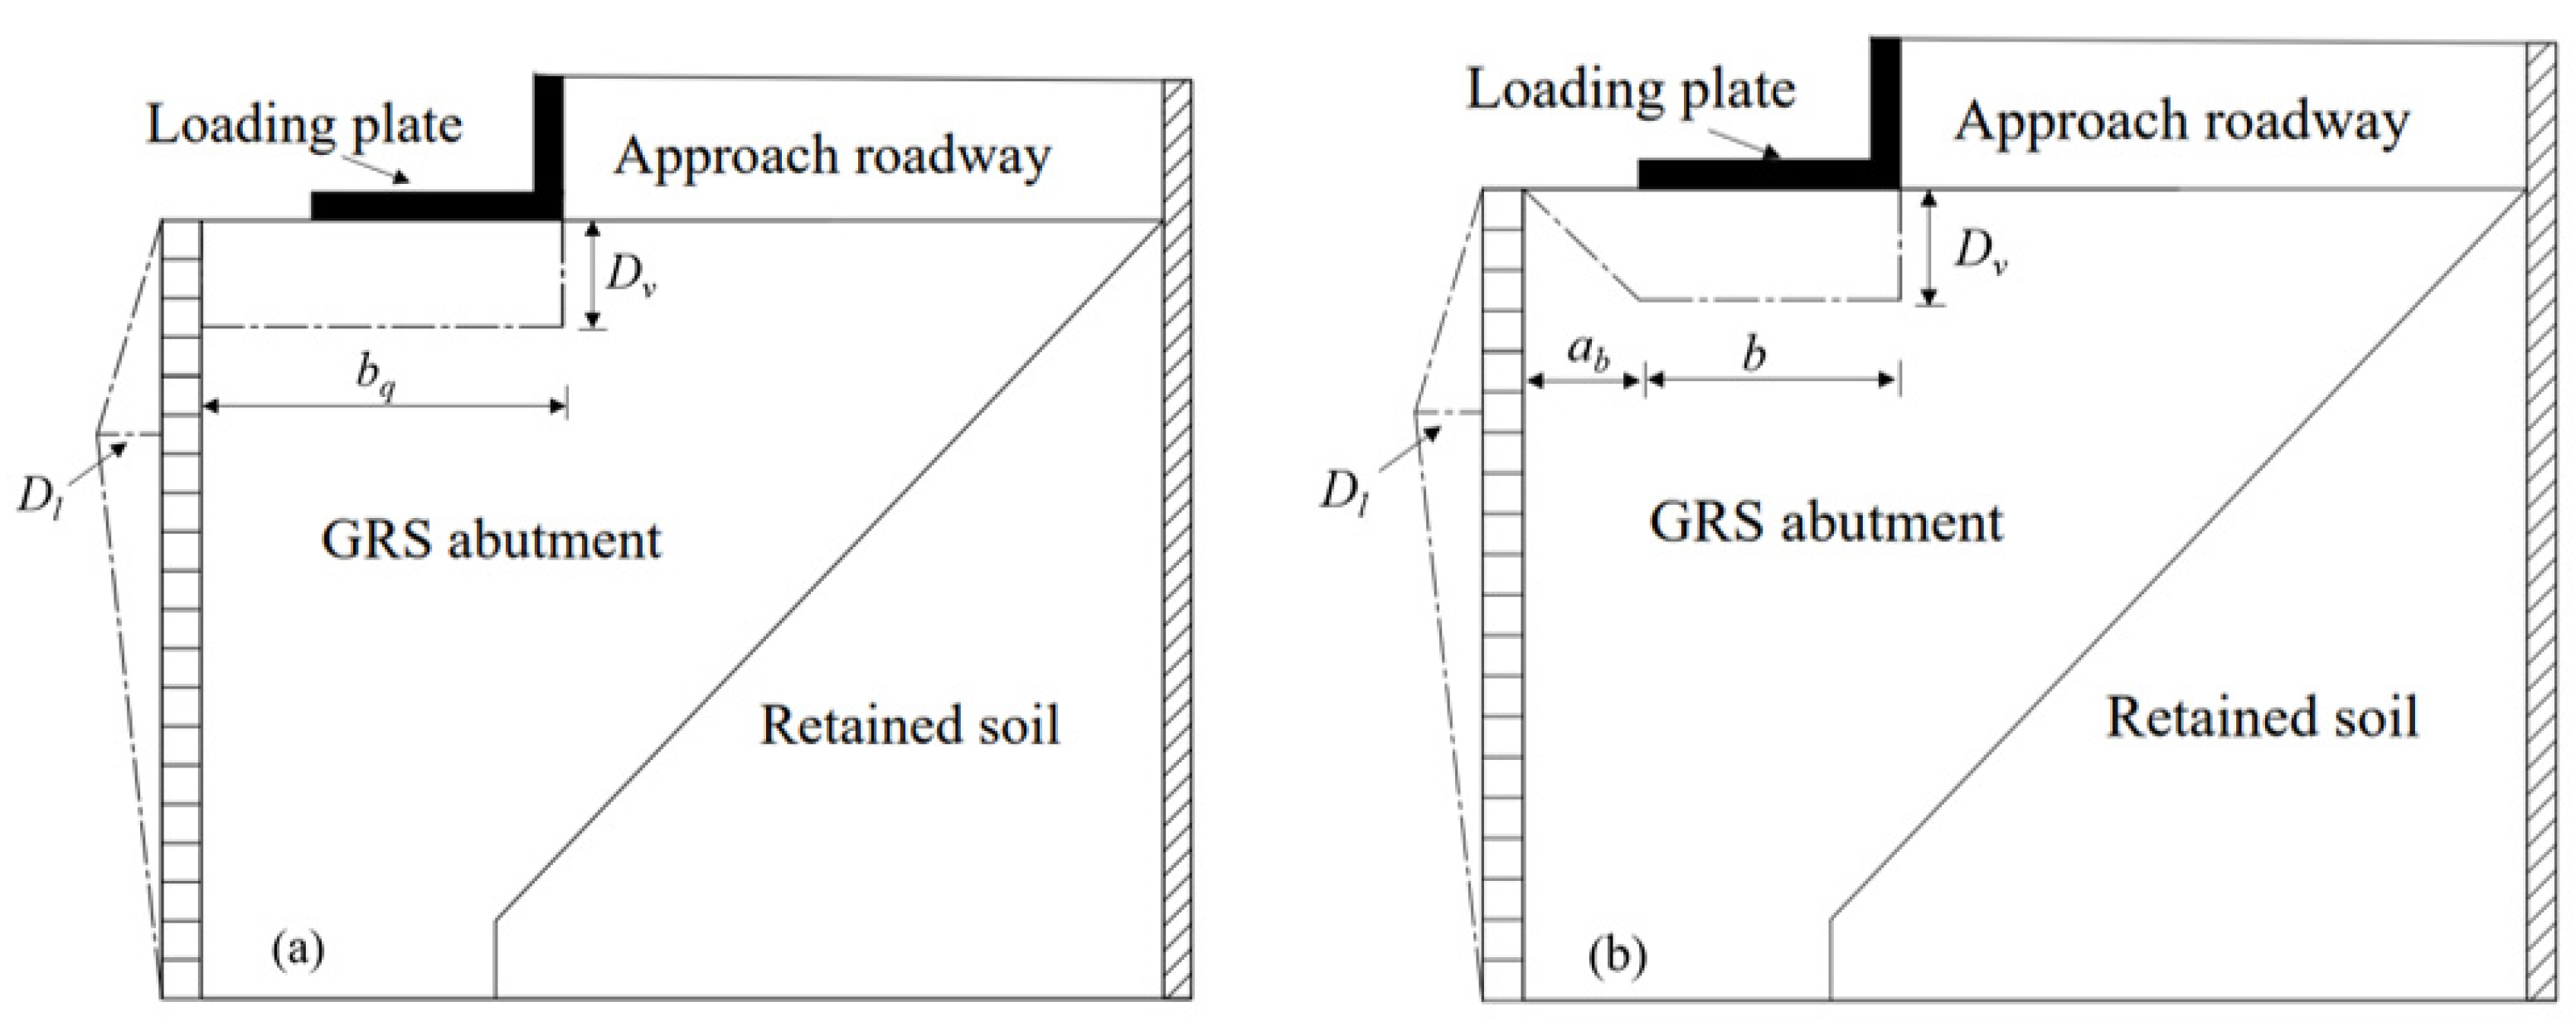
2.1. Model Geometry
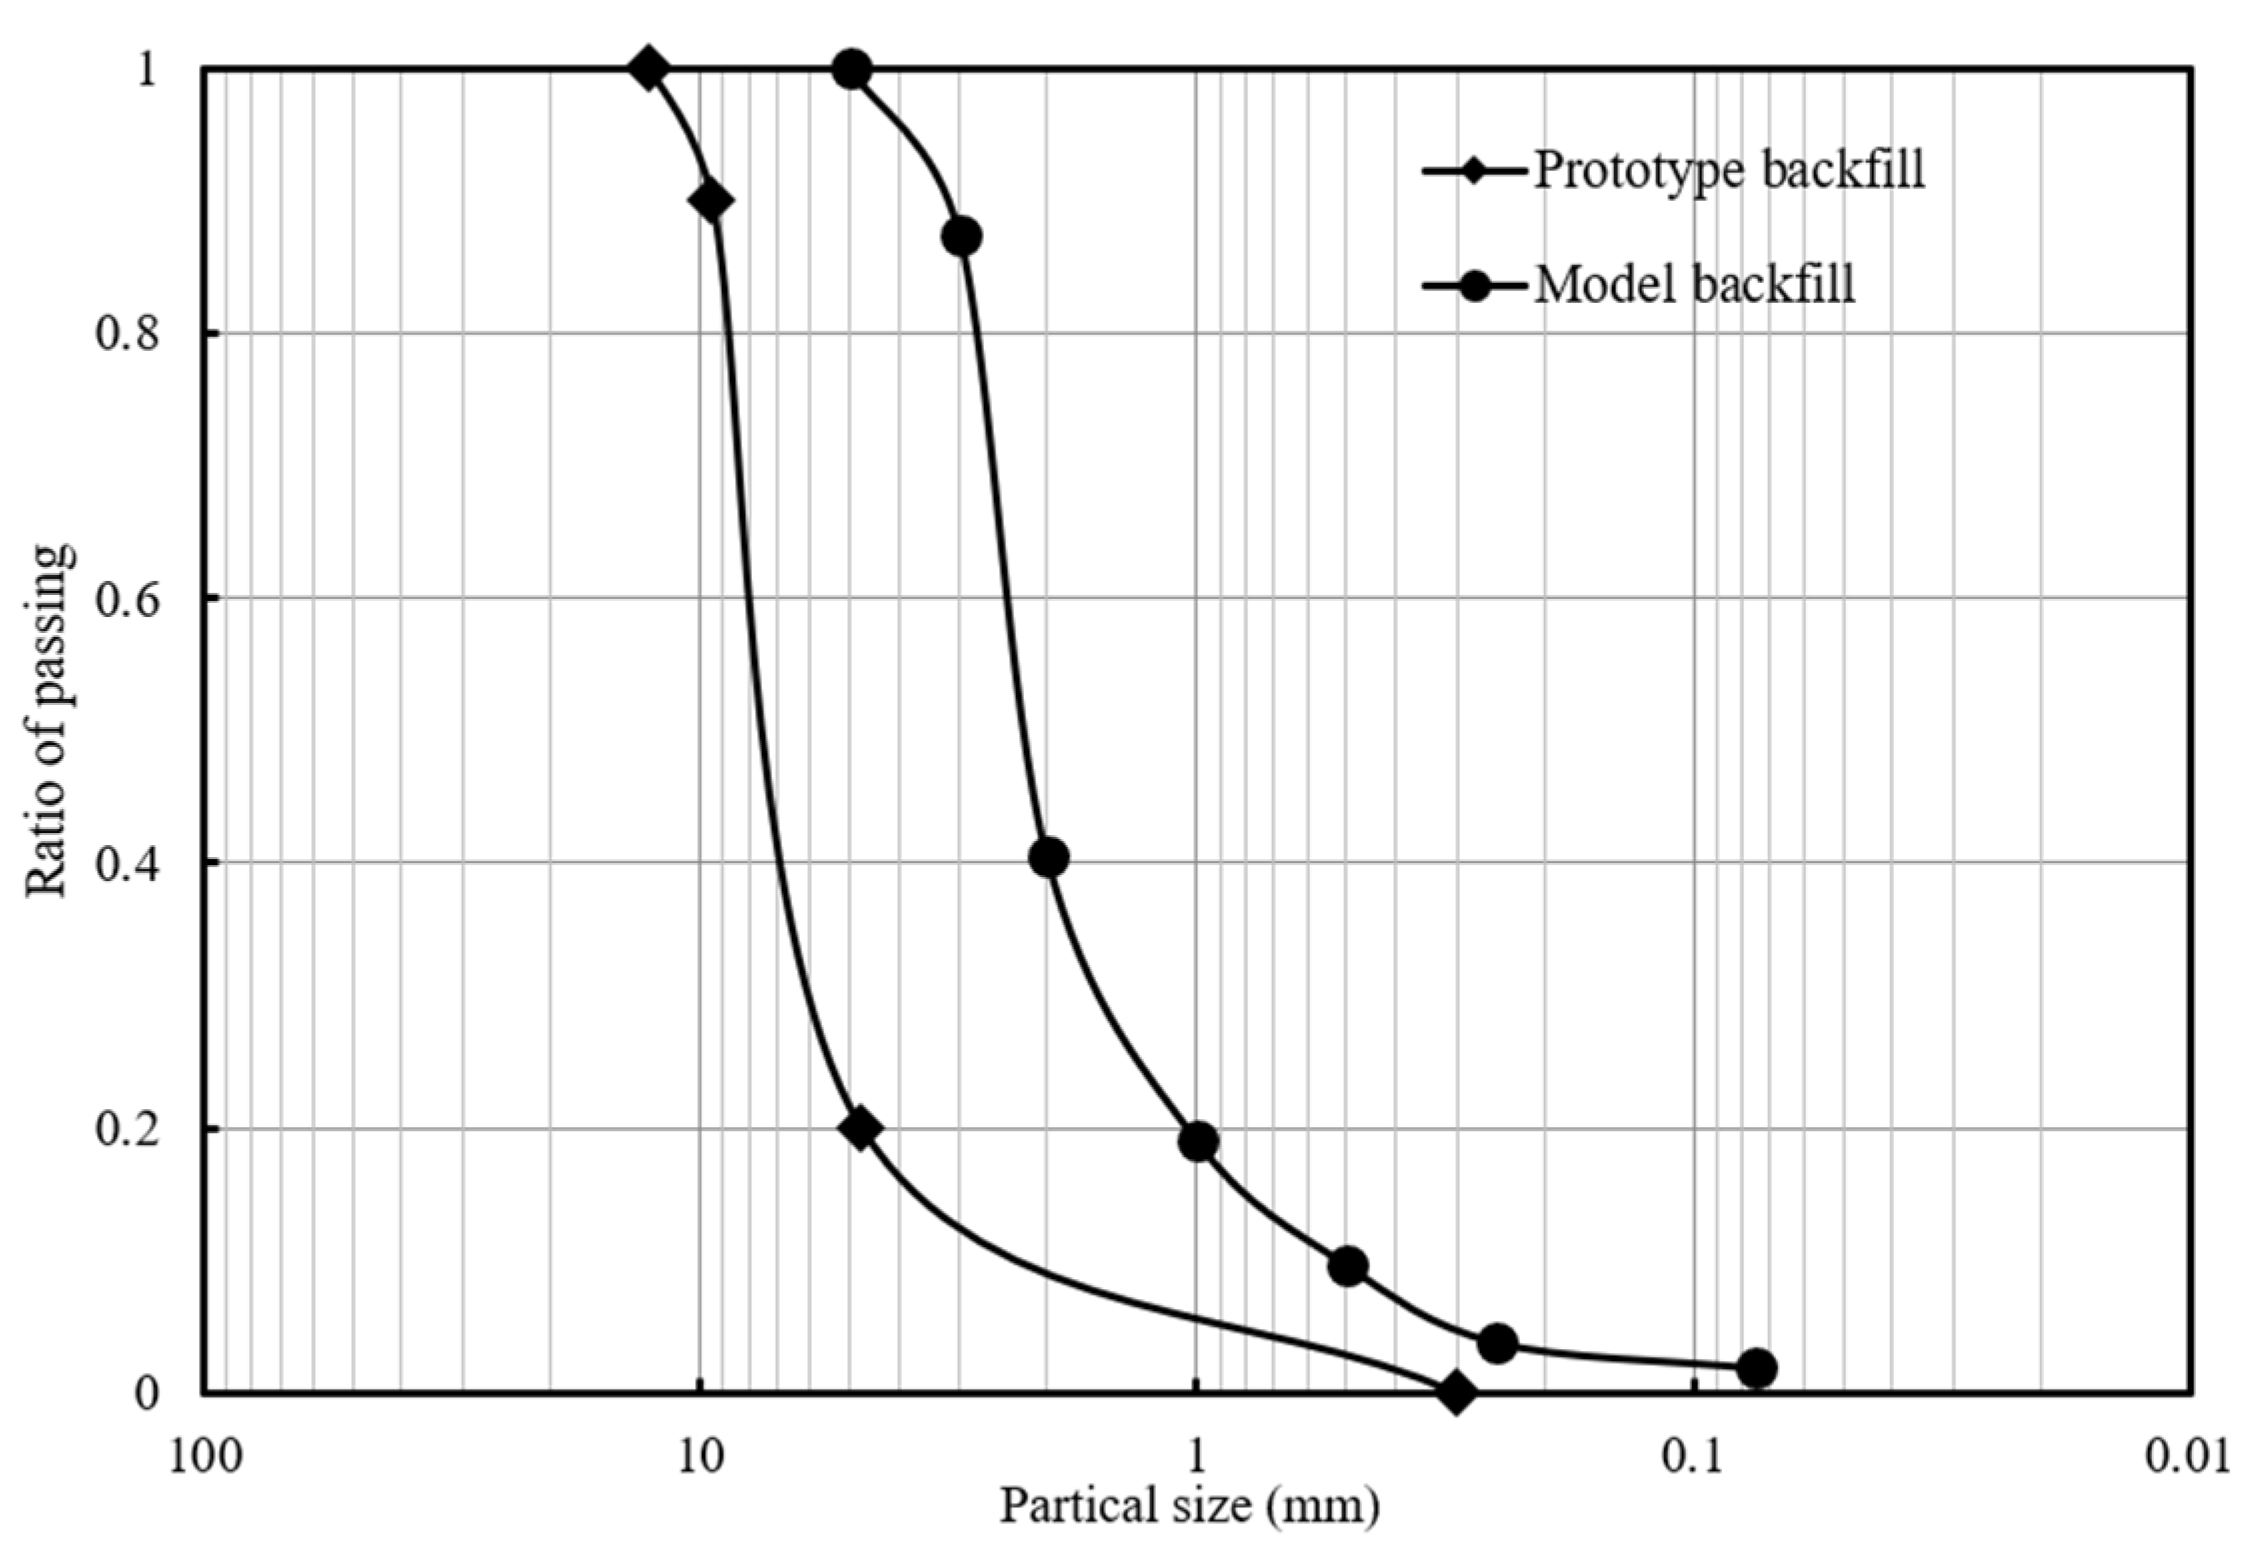
2.2. Test Material
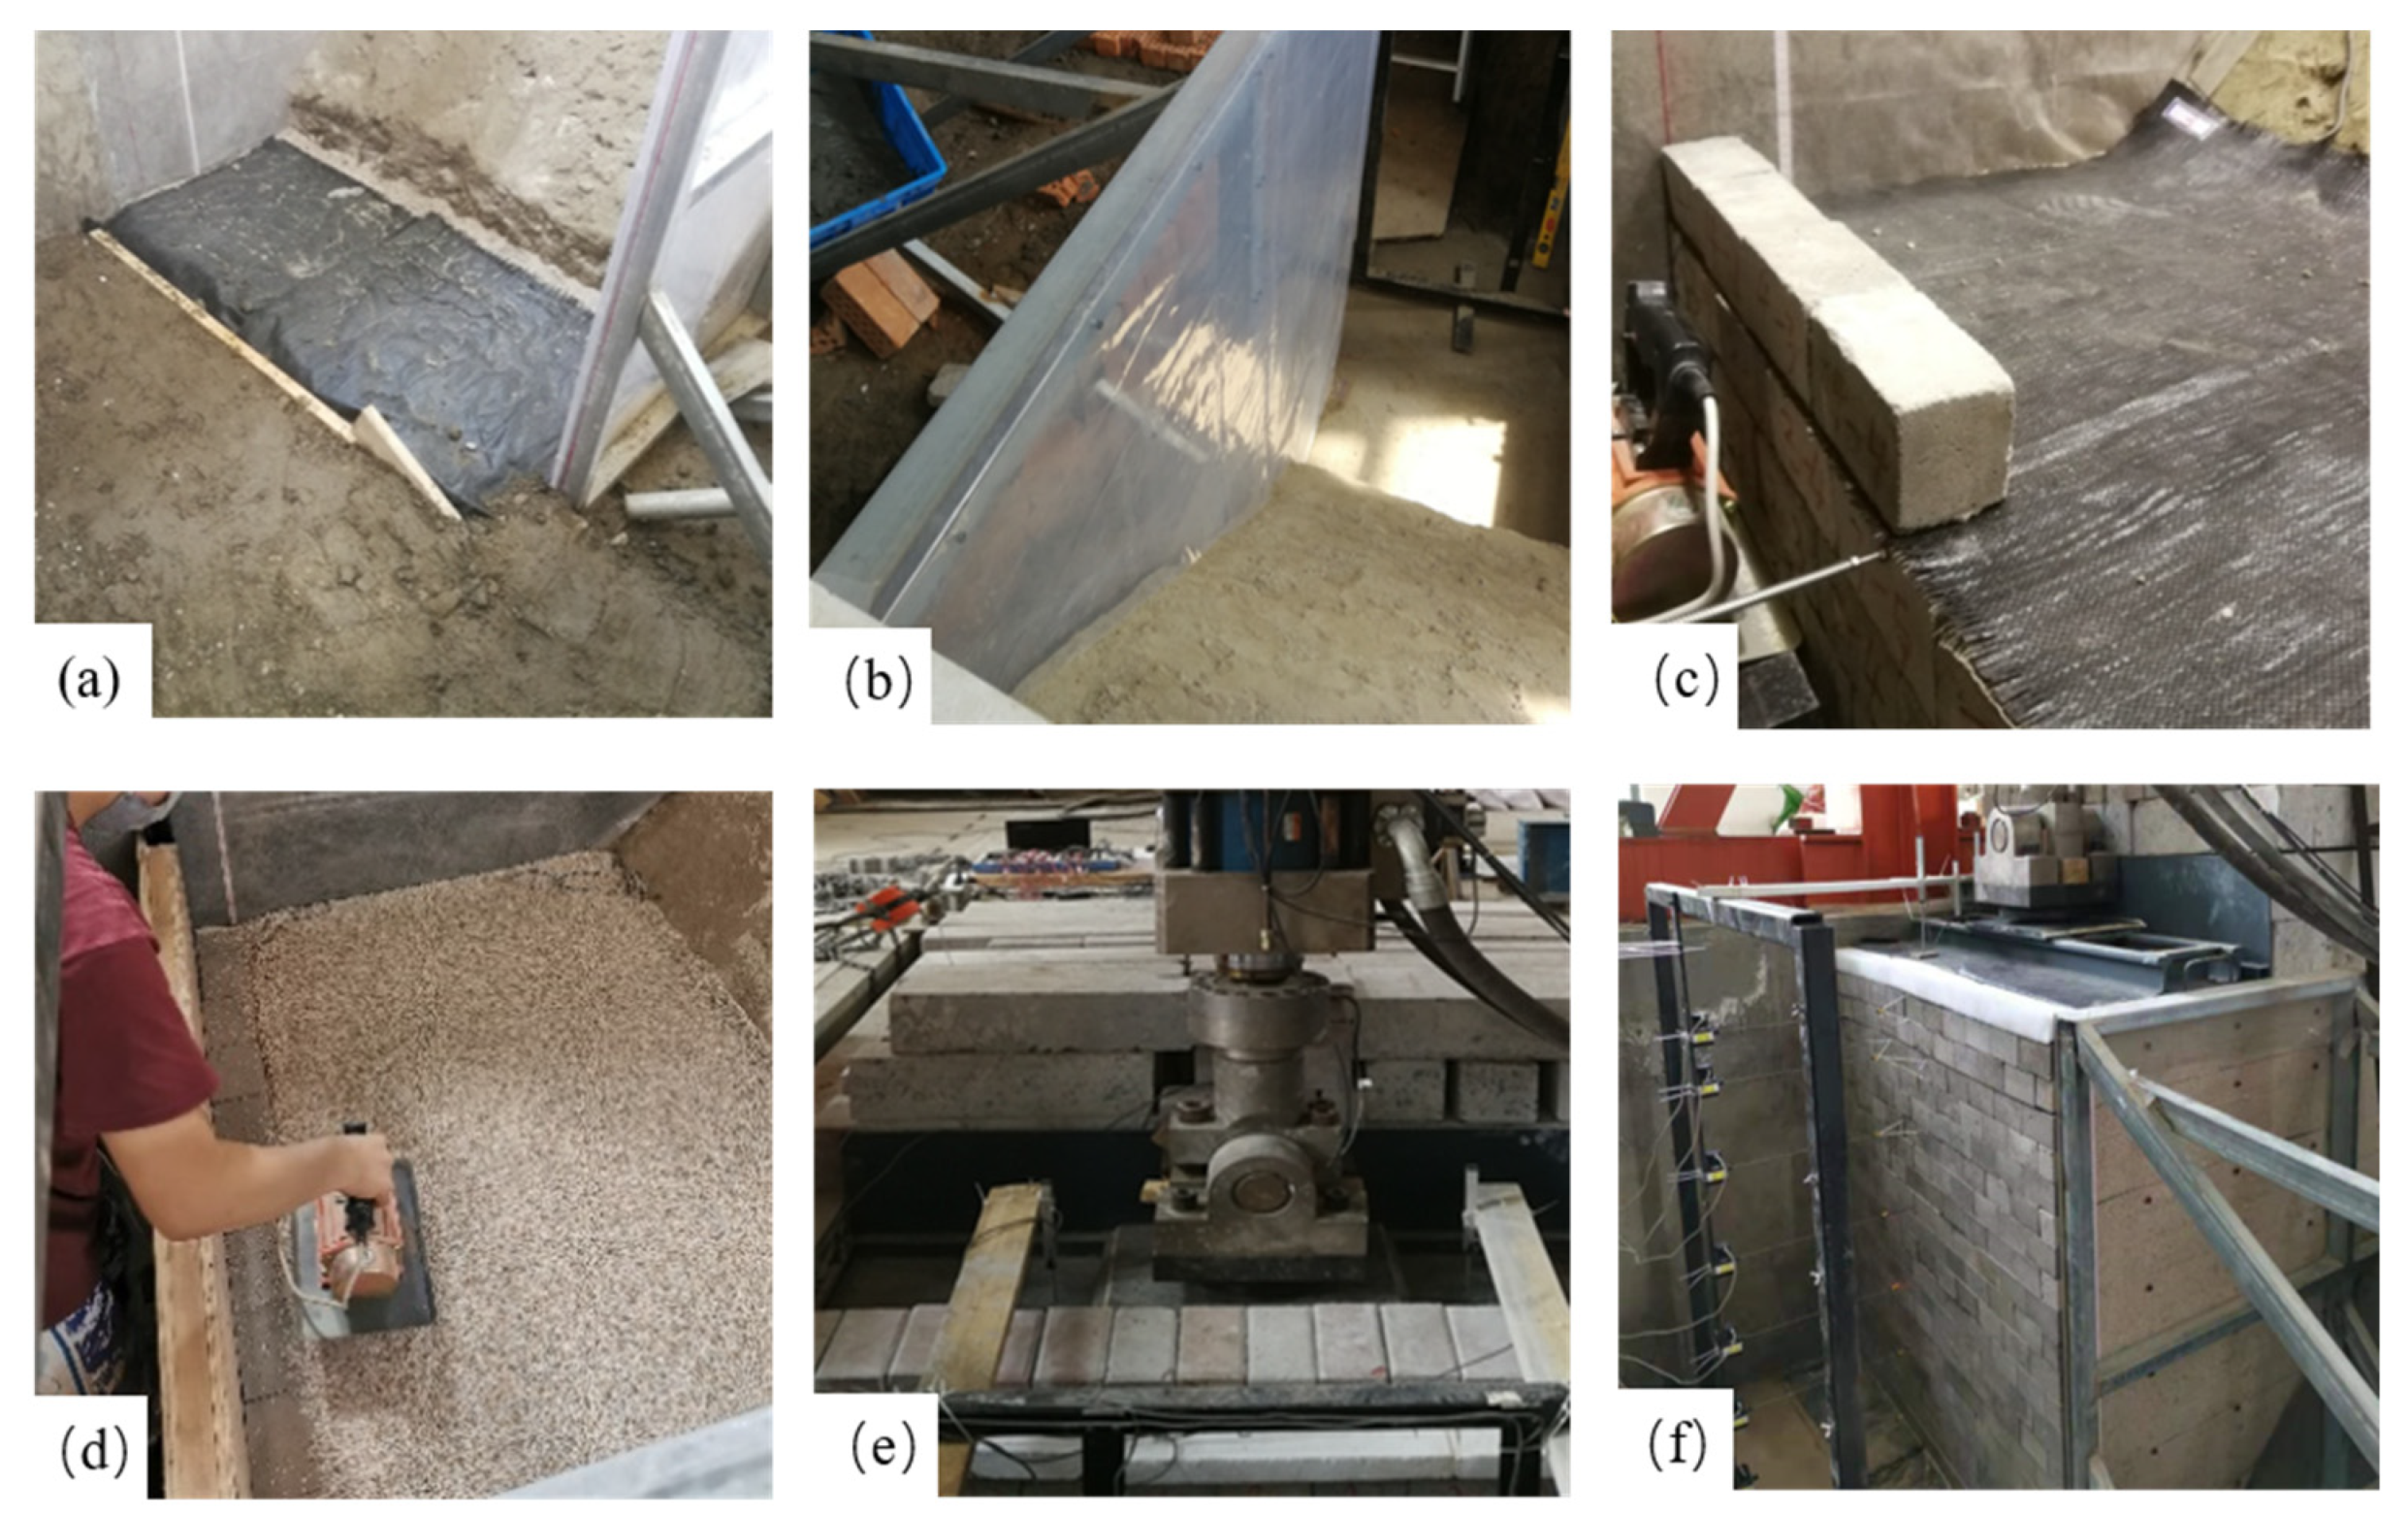
2.3. Construction
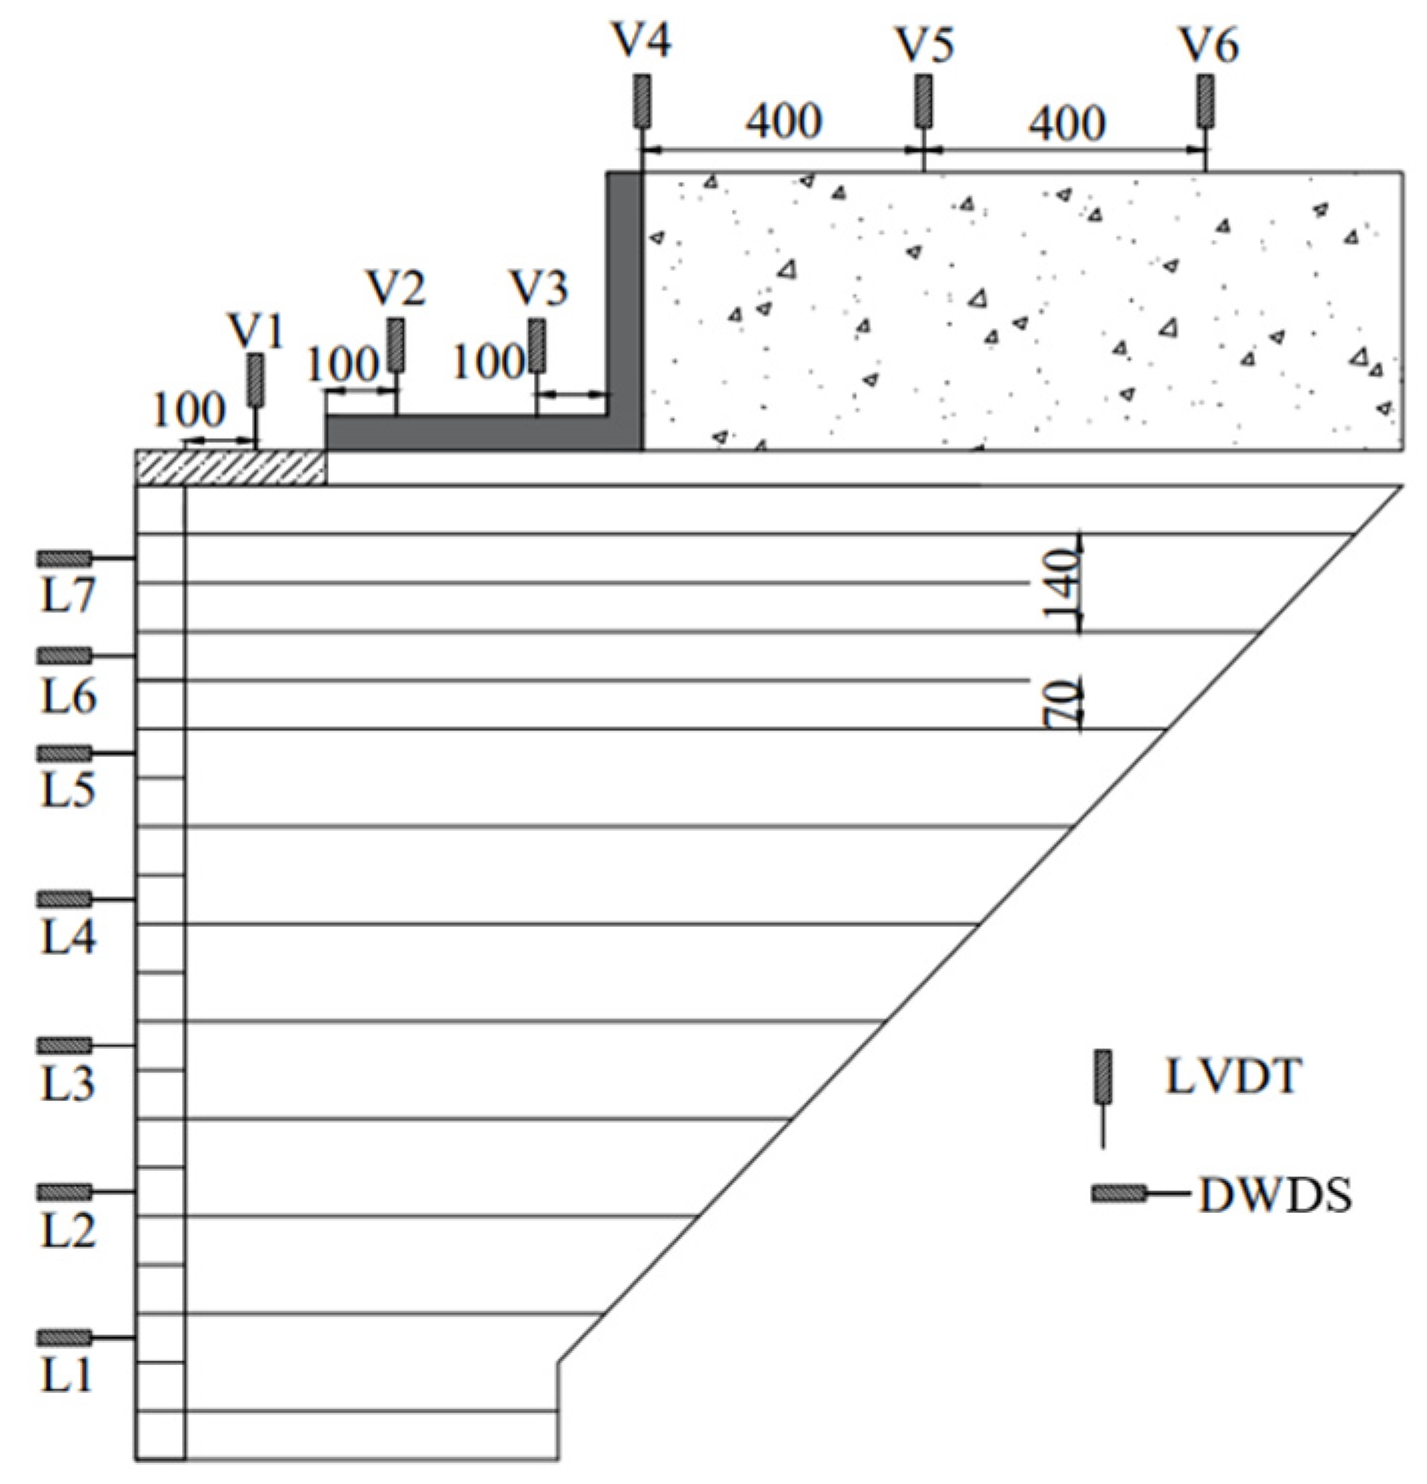
2.4. Test Plan and Instrumentation
3. Test Results
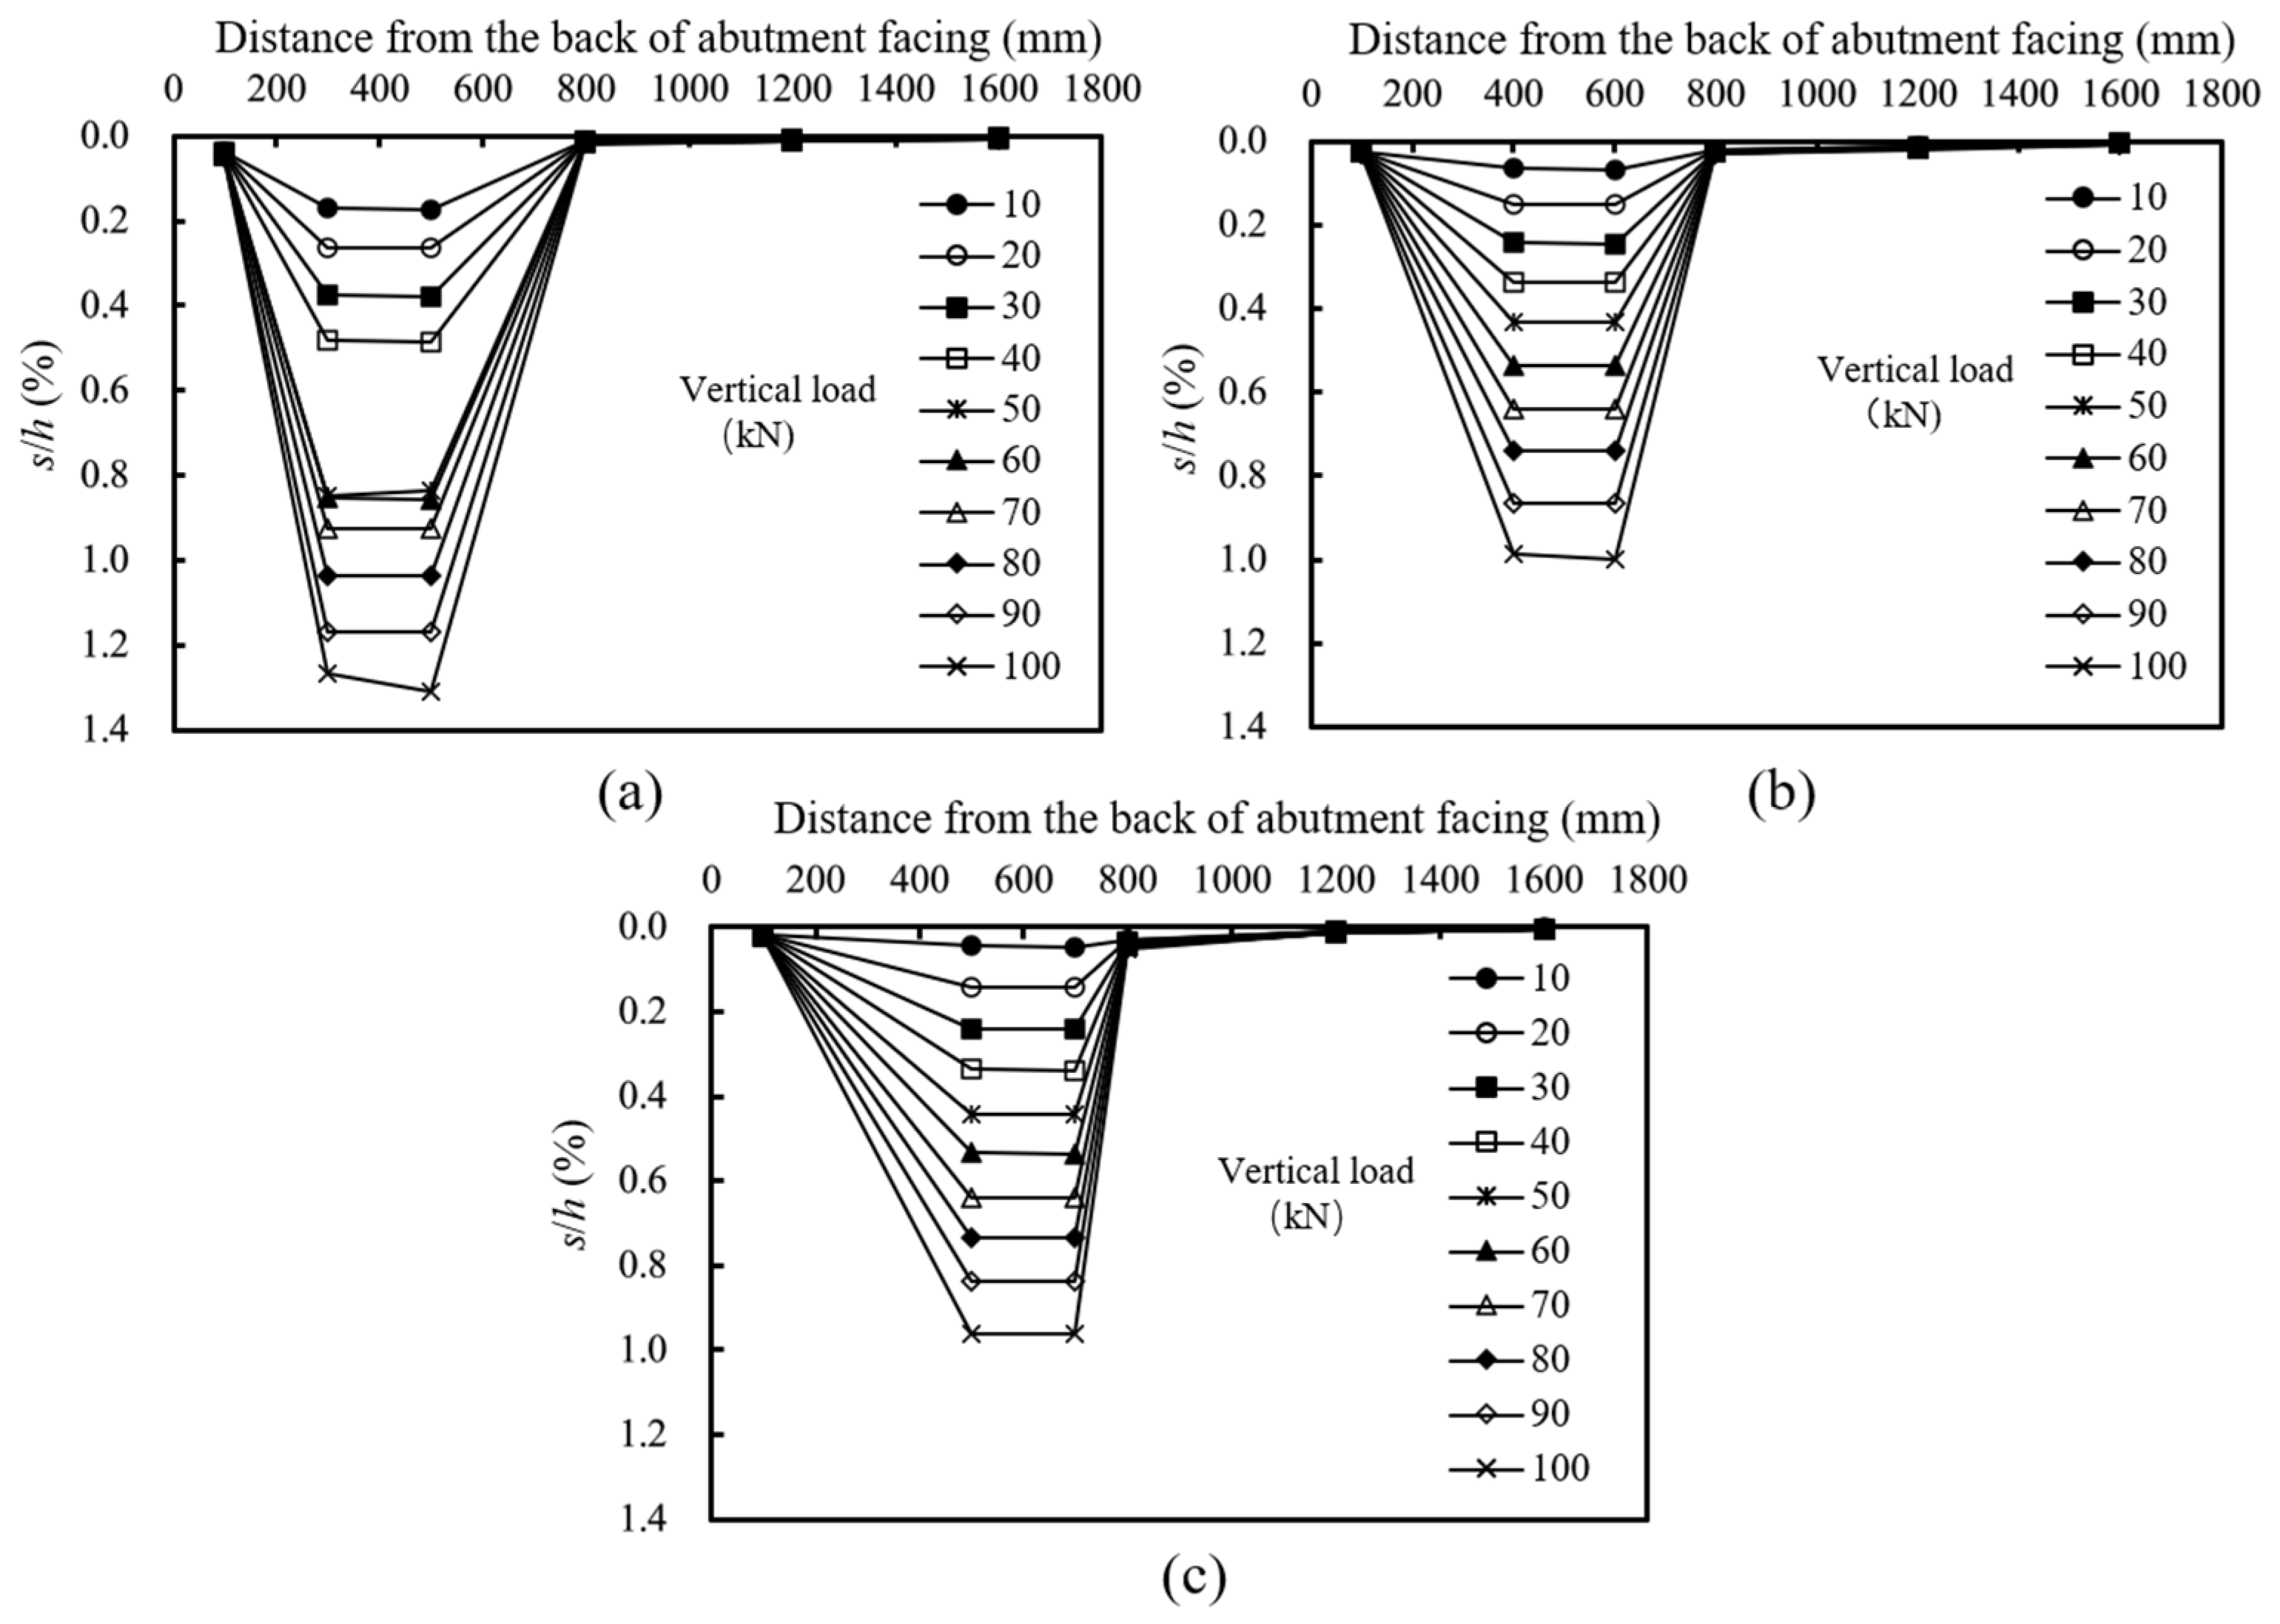
3.1. Settlement at the Top of the Abutment
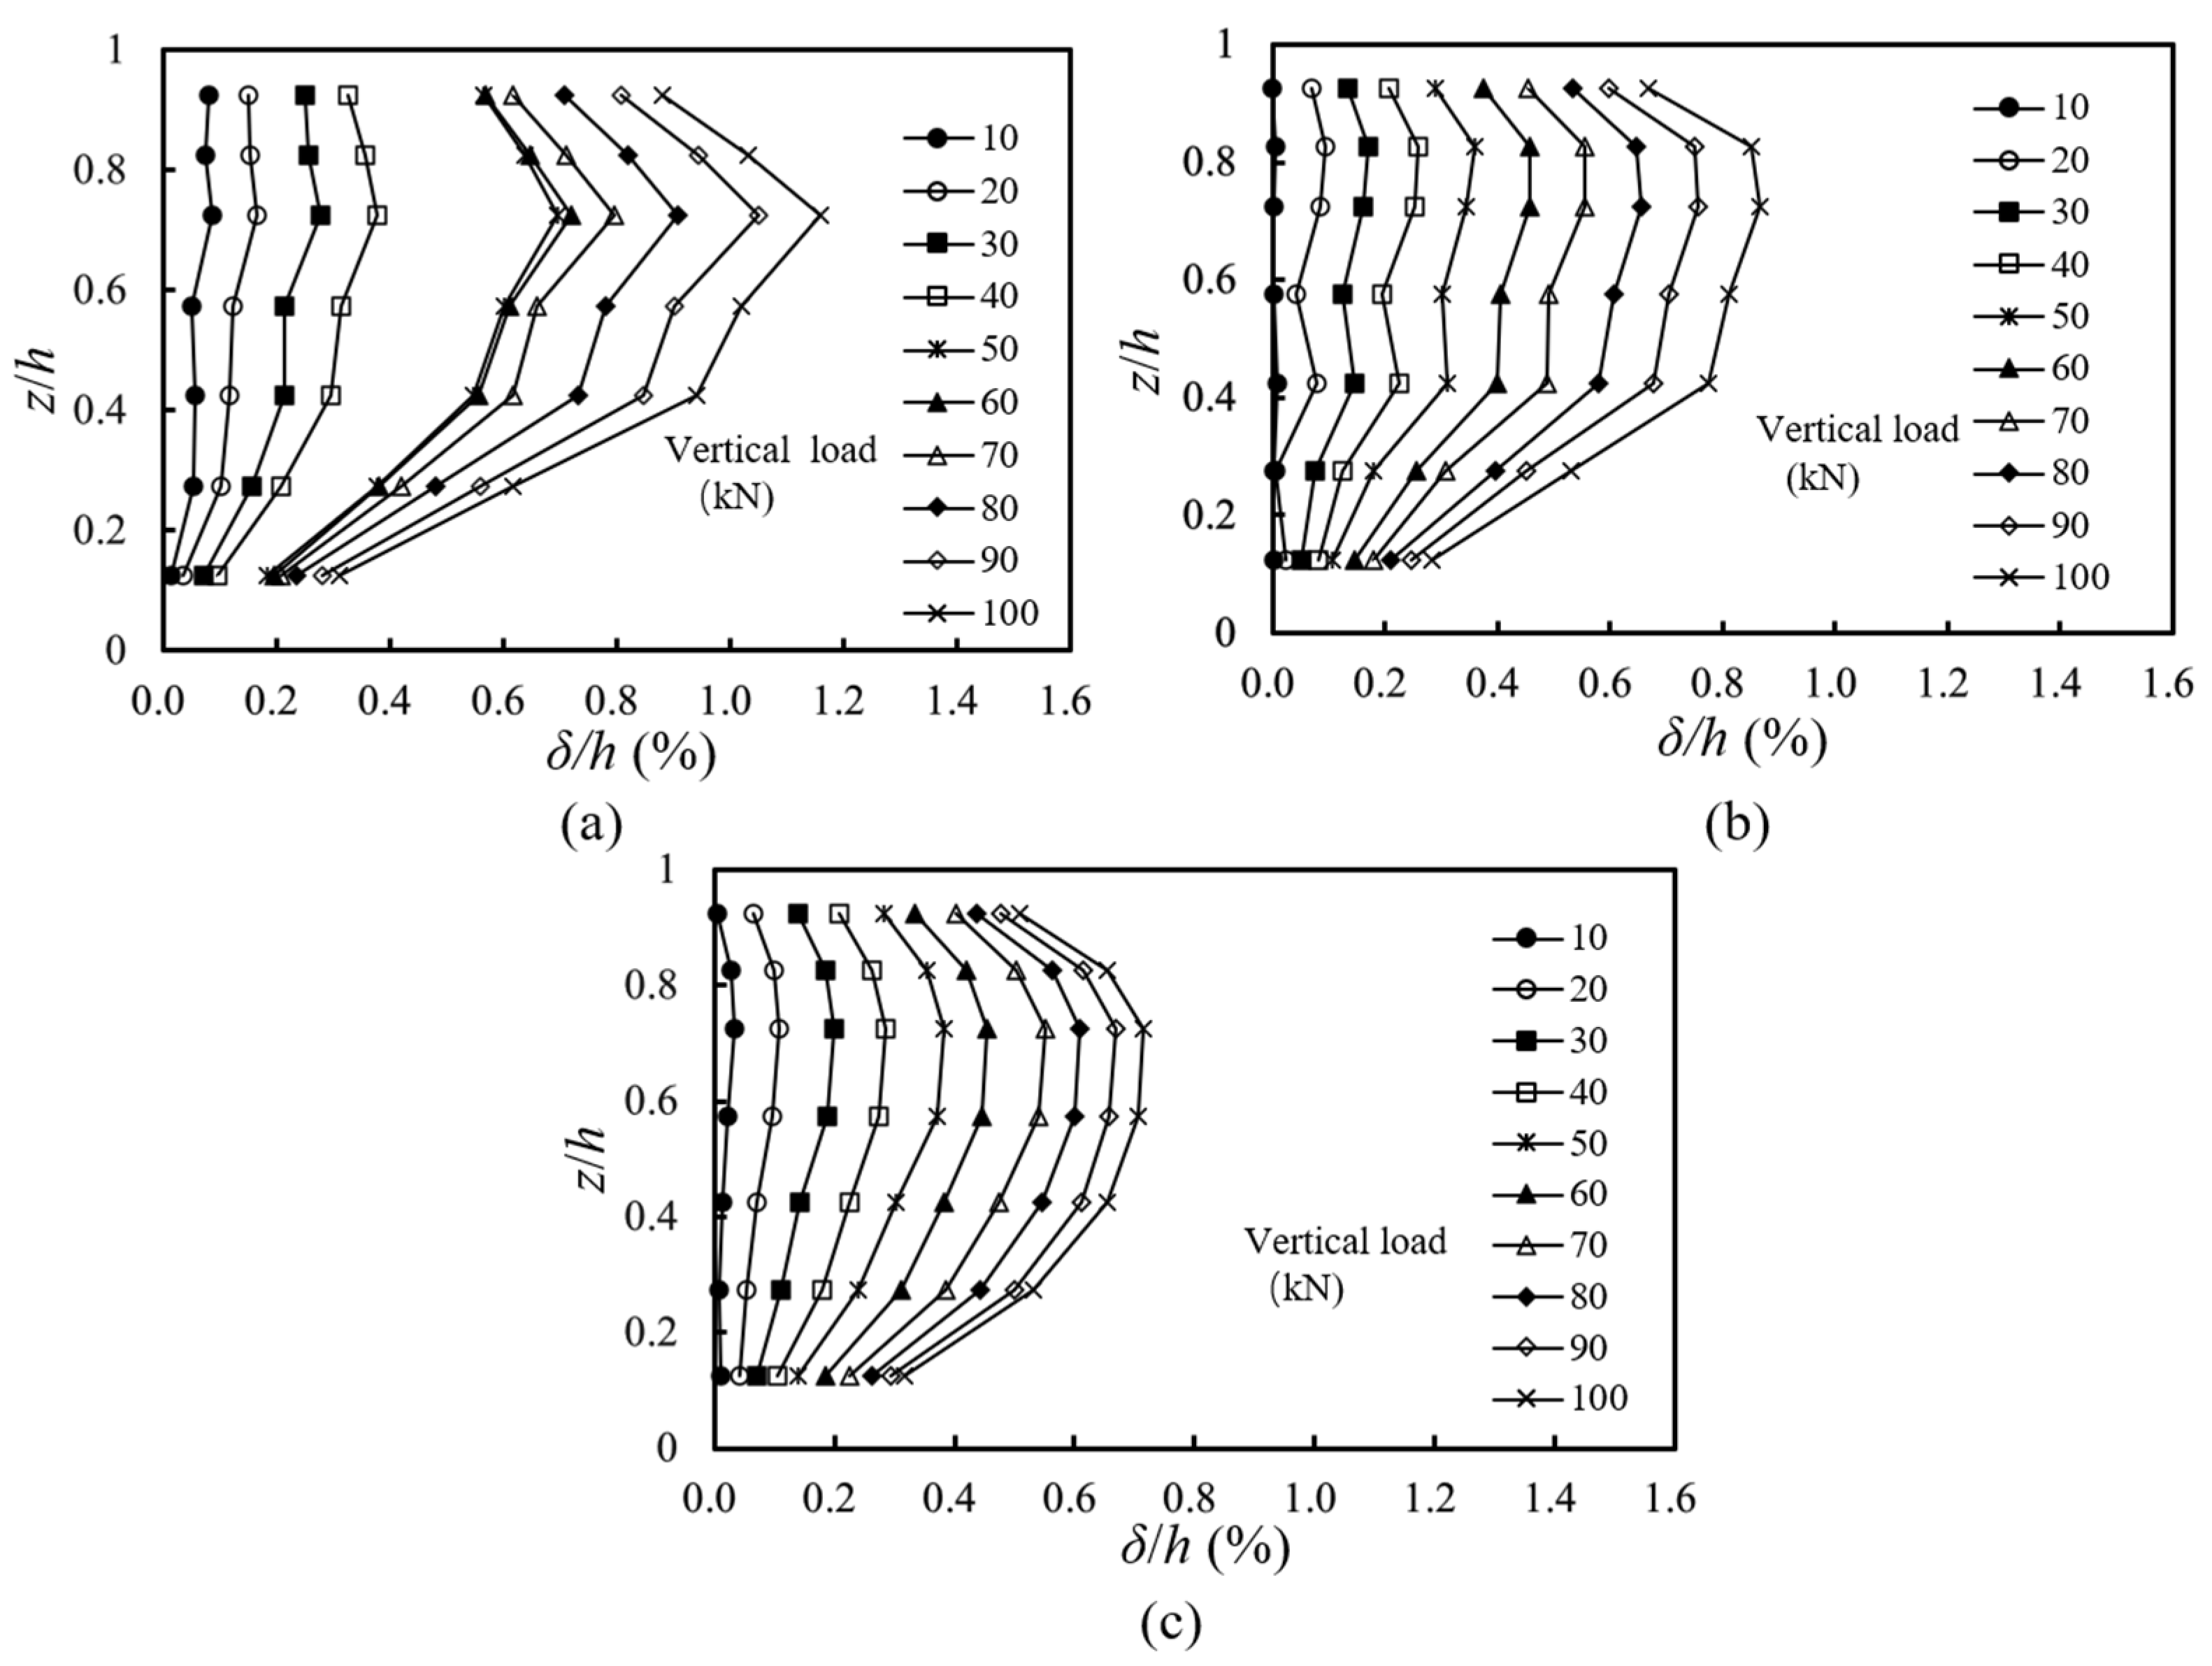
3.2. Lateral Facing Displacement
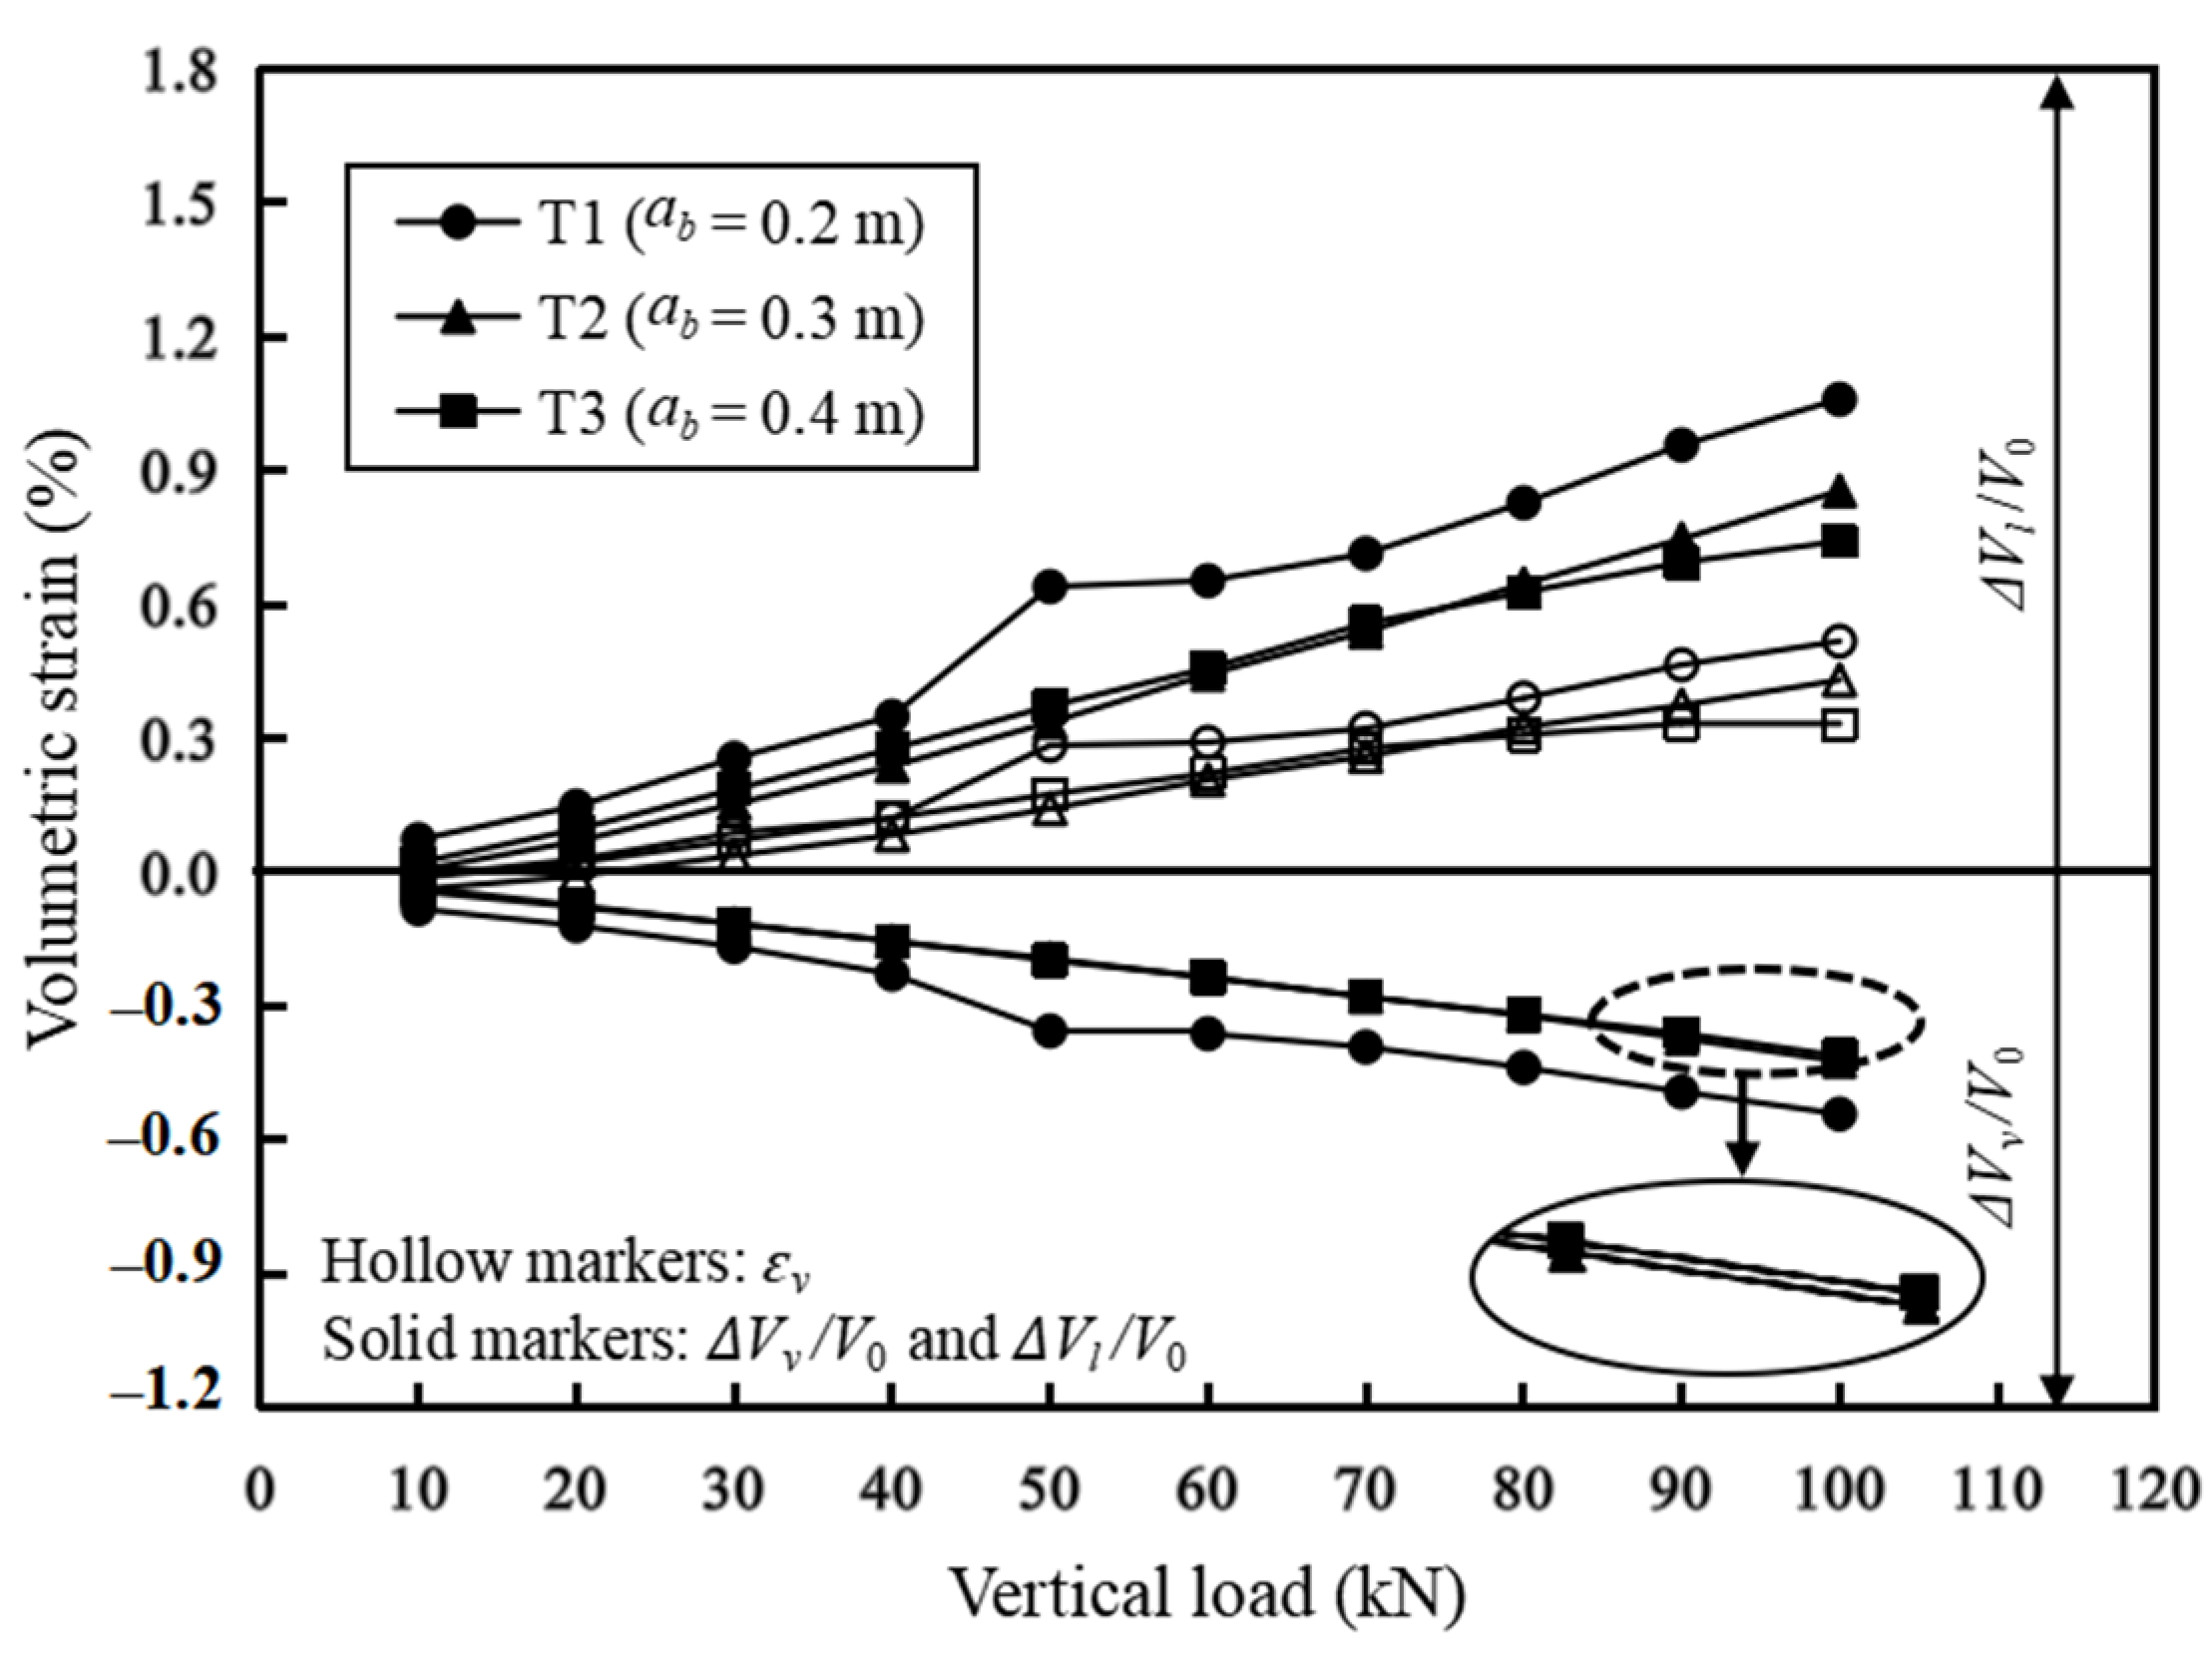
3.3. Volumetric Deformation
3.4. Comparison with FHWA Method
4. Limitations
5. Conclusions
- (1)
- Increasing the setback distance could effectively reduce the settlements at the top of the abutment, the lateral facing displacements, and the volumetric deformations of the GRS abutment. However, there existed an optimum setback distance (ab)opt and further increasing the setback distance beyond this optimum value did not have a significant effect on reducing the abutment deformations.
- (2)
- With the increase of the applied vertical loads, the vertical, lateral, and total volumetric deformations of the GRS abutment increased linearly. The lateral volumetric deformations of the GRS abutment were larger than its vertical volumetric deformations and therefore the total volumetric strains of the GRS abutment were not zero based on the test results. However, the theory of zero volume change may still be suitable for the deformation calculation of GRS abutments since the values of the volumetric strains were minimal.
- (3)
- A comparison between the measured maximum lateral facing displacements and the calculated values using the method proposed by the FHWA showed that the FHWA method overestimated the lateral facing displacements under vertical loads. It was speculated that the FHWA’s assumption of uniformly distributed settlements at the top of the GRS abutment could be the reason for overestimating the maximum lateral displacements.
- (4)
- An improved method was proposed in this study to calculate the maximum lateral facing displacements under vertical loads based on the theory of zero volume change and a revised distribution of the settlements at the top of the GRS abutment. Results showed that the improved method could better predict the maximum lateral facing displacements as compared to the FHWA method.
- (5)
- Results of this study could provide valuable insights into the influence of the setback distance on the deformation characteristics of the GRS abutment under working stress conditions and give important references for engineering applications of GRS abutments. A reasonable setback distance has the advantages of both reducing the bridge span and controlling the abutment deformations.
Author Contributions
Funding
Institutional Review Board Statement
Informed Consent Statement
Data Availability Statement
Conflicts of Interest
References
- Fu, R.H.; Briseghella, B.; Xue, J.Q.; Aloisio, A.; Lin, Y.B.; Nuti, C. Experimental and finite element analyses of laterally loaded RC piles with pre-hole filled by various filling materials in IABs. Eng. Struct. 2022, 272, 114991. [Google Scholar] [CrossRef]
- Ma, H.B.; Zhuo, W.D.; Lavorato, D.; Nuti, C.; Fiorentino, G.; Marano, G.C.; Briseghella, B. Probabilistic seismic response and uncertainty analysis of continuous bridges under near-fault ground motions. Front. Struct. Civ. Eng. 2019, 13, 1510–1519. [Google Scholar] [CrossRef]
- Adams, M.T.; Schlatter, W.; Stabile, T. Geosynthetic Reinforced Soil Integrated Abutments at the Bowman Road Bridge in Defiance County, Ohio. In Geotechnical Special Publication; ASCE: Reston, VA, USA, 2007. [Google Scholar]
- Han, J.; Jiang, Y.; Xu, C. Recent advances in geosynthetic-reinforced retaining walls for highway applications. Front. Struct. Civ. Eng. 2017, 12, 239–247. [Google Scholar] [CrossRef]
- Warren, K.A.; Whelan, M.J.; Hite, J.; Adams, M. Three-Year Evaluation of Thermally Induced Strain and Corresponding Lateral End Pressures for a GRS-IBS in Ohio. In Geo-Congress 2014 Technical Papers; ASCE: Reston, VA, USA, 2014; pp. 4238–4251. [Google Scholar]
- Saghebfar, M.; Abu-Farsakh, M.; Ardah, A.; Chen, Q.; Fernandez, B.A. Performance monitoring of Geosynthetic Reinforced Soil Integrated Bridge System (GRS-IBS) in Louisiana. Geotext. Geomembr. 2017, 45, 34–47. [Google Scholar] [CrossRef]
- Abu-Farsakh, M.; Saghebfar, M.; Ardah, A.; Chen, Q. A Case Study on Evaluating the Performance of a Geosynthetic Reinforced Soil Integrated Bridge System (GRS-IBS). Geotech. Front. Walls Slopes 2017, 278, 12–22. [Google Scholar]
- Hogan, R.J.; Pirando, R.; Anderson, J.B.; Montgomery, J. Construction and Monitoring of Alabama’s First Geosynthetic Reinforced Soil-Integrated Bridge System. In Geo-Congress 2019: Earth Retaining Structures and Geosynthetics; ASCE: Reston, VA, USA, 2019; pp. 222–235. [Google Scholar]
- Talebi, M.; Meehan, C.L.; Leshchinsky, D. Applied bearing pressure beneath a reinforced soil foundation used in a geosynthetic reinforced soil integrated bridge system. Geotext. Geomembr. 2017, 45, 580–591. [Google Scholar] [CrossRef]
- Jelušic, P.; Žlender, B. Experimental study of a geosynthetic-reinforced soil bridge abutment. Geosynth. Int. 2021, 28, 479–490. [Google Scholar] [CrossRef]
- Zhang, J.; Guo, W.; Ji, M.; Zhao, J.; Xu, C.; Zheng, Y. Field monitoring of vertical stress distribution in GRS-IBS with full-height rigid facings. Geosynth. Int. 2022, 29, 610–621. [Google Scholar] [CrossRef]
- Gebremariam, F.; Tanyu, B.F.; Christopher, B.; Leshchinsky, D.; Han, J.; Zornberg, J.G. Evaluation of vertical stress distribution in field monitored GRS-IBS structure. Geosynth. Int. 2020, 27, 414–431. [Google Scholar] [CrossRef]
- Zheng, Y.; Fox, P.J. Numerical investigation ofthe geosynthetic reinforced soil–integrated bridge system under static loading. J. Geotech. Geoenviron. Eng. 2017, 143, 04017008. [Google Scholar] [CrossRef]
- Zheng, Y.; Fox, P.J.; McCartney, J.S. Numerical simulation of deformation and failure behavior of geosynthetic reinforced soil bridge abutments. J. Geotech. Geoenviron. Eng. 2018, 144, 04018037. [Google Scholar] [CrossRef] [Green Version]
- Ardah, A.; Abu-Farsakh, M.; Voyiadjis, G. Numerical evaluation of the performance of a geosynthetic reinforced soil-integrated bridge system (GRS-IBS) under different loading conditions. Geotext. Geomembr. 2017, 45, 558–569. [Google Scholar] [CrossRef]
- Ardah, A.; Abu-Farsakh, M.Y.; Voyiadjis, G.Z. Numerical evaluation of the effect of differential settlement on the performance of GRS-IBS. Geosynth. Int. 2018, 25, 427–441. [Google Scholar] [CrossRef]
- Abu-Farsakh, M.; Ardah, A.; Voyiadjis, G. 3D finite element analysis of the Geosynthetic Reinforced Soil-Integrated Bridge System (GRS-IBS) under different loading conditions. Transp. Geotech. 2018, 15, 70–83. [Google Scholar] [CrossRef]
- Gebremariam, F.; Tanyu, B.F.; Güler, E.; Urgessa, G.S.; Shen, P. Numerical investigation of reinforced soil structures with GRS-IBS design features. Geosynth. Int. 2021, 28, 95–112. [Google Scholar] [CrossRef]
- Shen, P.; Han, J.; Zornberg, J.; Tanyu, B.F.; Christopher, B.R.; Leshchinsky, D. Responses of geosynthetic-reinforced soil (GRS) abutments under bridge slab loading: Numerical investigation. Comput. Geotech. 2020, 123, 103566. [Google Scholar] [CrossRef]
- Xu, C.; Liang, C.; Shen, P. Experimental and theoretical studies on the ultimate bearing capacity of geogrid-reinforced sand. Geotext. Geomembr. 2019, 47, 417–428. [Google Scholar] [CrossRef]
- Raja MN, A.; Jaffar ST, A.; Bardhan, A.; Shukla, S.K. Predicting and validating the load-settlement behavior of large-scale geosynthetic-reinforced soil abutments using hybrid intelligent modeling. J. Rock Mech. Geotech. Eng. 2023, 15, 773–788. [Google Scholar] [CrossRef]
- Adams, M.T.; Ketchart, K.; Wu, J.T.H. Mini Pier Experiments: Geosynthetic Reinforcement Spacing and Strength as Related to Performance. Geosynthetics in Reinforcement and Hydraulic Applications. In Geotechnical Special Publication; ASCE: Reston, VA, USA, 2007. [Google Scholar]
- Adams, M.T.; Ooi, P.S.K.; Nicks, J.E. Mini-Pier Testing to Estimate Performance of Full-Scale Geosynthetic Reinforcement Soil Bridge Abutments. J. Geotech. Test. 2014, 37, 884–894. [Google Scholar] [CrossRef]
- Nicks, J.; Esmaili, D.; Adams, M. Deformations of geosynthetic reinforced soil under bridge service loads. Geotext. Geomembr. 2016, 44, 641–653. [Google Scholar] [CrossRef]
- Wu, J.T.H.; Ketchart, K.; Adams, M.T. Two full-scale loading experiments of geosynthetic-reinforced soil (GRS) abutment wall. Int. J. Geotech. Eng. 2008, 2, 305–317. [Google Scholar] [CrossRef]
- Ahmadi, H.; Bezuijen, A. Full-scale mechanically stabilized earth (MSE) walls under strip footing load. Geotext. Geomembr. 2018, 46, 297–311. [Google Scholar] [CrossRef]
- Doger, R.; Hatami, K. Influence of facing on the performance of GRS bridge abutments. Int. J. Geosynth. Grou. Eng. 2020, 6, 42. [Google Scholar] [CrossRef]
- Hatami, K.; Doger, R. Load-bearing performance of model GRS bridge abutments with different facing and reinforcement spacing configurations. Geotext. Geomembr. 2021, 49, 1139–1148. [Google Scholar] [CrossRef]
- Zhang, J.; Jia, Y.; Guo, W.; Zhao, J.; Ling, J.; Zheng, Y. Experimental study on the load bearing behavior of geosynthetic reinforced soil bridge abutments with different facing conditions. Geotext. Geomembr. 2022, 50, 632–643. [Google Scholar] [CrossRef]
- Adams, M.; Nicks, J. Design and Construction Guidelines for Geosynthetic Reinforced Soil Abutments and Integrated Bridge Systems; FHWA-Hrt-17-080; U.S. Department of Transportation Federal Highway Administration: Washington, DC, USA, 2018. [Google Scholar]
- Adams, M.T.; Lillis, C.P.; Wu, J.T.H.; Ketchart, K. Vegas Mini Pier Experiment and Postulate of Zero Volume Change. In Proceedings of the Seventh International Conference on Geosynthetics, Nice, France, 22–27 September 2002. [Google Scholar]


| No. | Setback Distance ab (m) | Reinforcement Spacing Sv (m) |
|---|---|---|
| T1 | 0.2 | 0.14 |
| T2 | 0.3 | 0.14 |
| T3 | 0.4 | 0.14 |
Disclaimer/Publisher’s Note: The statements, opinions and data contained in all publications are solely those of the individual author(s) and contributor(s) and not of MDPI and/or the editor(s). MDPI and/or the editor(s) disclaim responsibility for any injury to people or property resulting from any ideas, methods, instructions or products referred to in the content. |
© 2023 by the authors. Licensee MDPI, Basel, Switzerland. This article is an open access article distributed under the terms and conditions of the Creative Commons Attribution (CC BY) license (https://creativecommons.org/licenses/by/4.0/).
Share and Cite
Xu, C.; Wang, Q.; Shen, P.; Li, G.; Wang, Q.; Zhang, X.; Zhao, C. Scaled Model Tests Investigating Deformation Characteristics of Geosynthetic Reinforced Soil (GRS) Abutments under Vertical Loads. Materials 2023, 16, 4601. https://doi.org/10.3390/ma16134601
Xu C, Wang Q, Shen P, Li G, Wang Q, Zhang X, Zhao C. Scaled Model Tests Investigating Deformation Characteristics of Geosynthetic Reinforced Soil (GRS) Abutments under Vertical Loads. Materials. 2023; 16(13):4601. https://doi.org/10.3390/ma16134601
Chicago/Turabian StyleXu, Chao, Qingming Wang, Panpan Shen, Geye Li, Qiushen Wang, Xiao Zhang, and Chongxi Zhao. 2023. "Scaled Model Tests Investigating Deformation Characteristics of Geosynthetic Reinforced Soil (GRS) Abutments under Vertical Loads" Materials 16, no. 13: 4601. https://doi.org/10.3390/ma16134601