
Improved Visible Emission from ZnO Nanoparticles Synthesized via the Co-Precipitation Method
 ,
, 
Abstract
:
1. Introduction
2. Materials and Methods
2.1. Preparation of ZnO Nanoparticles
2.2. Characterization of the ZnO Nanoparticles
3. Results and Discussion
3.1. Influence of the Solvent Used in the Co-Precipitation Method
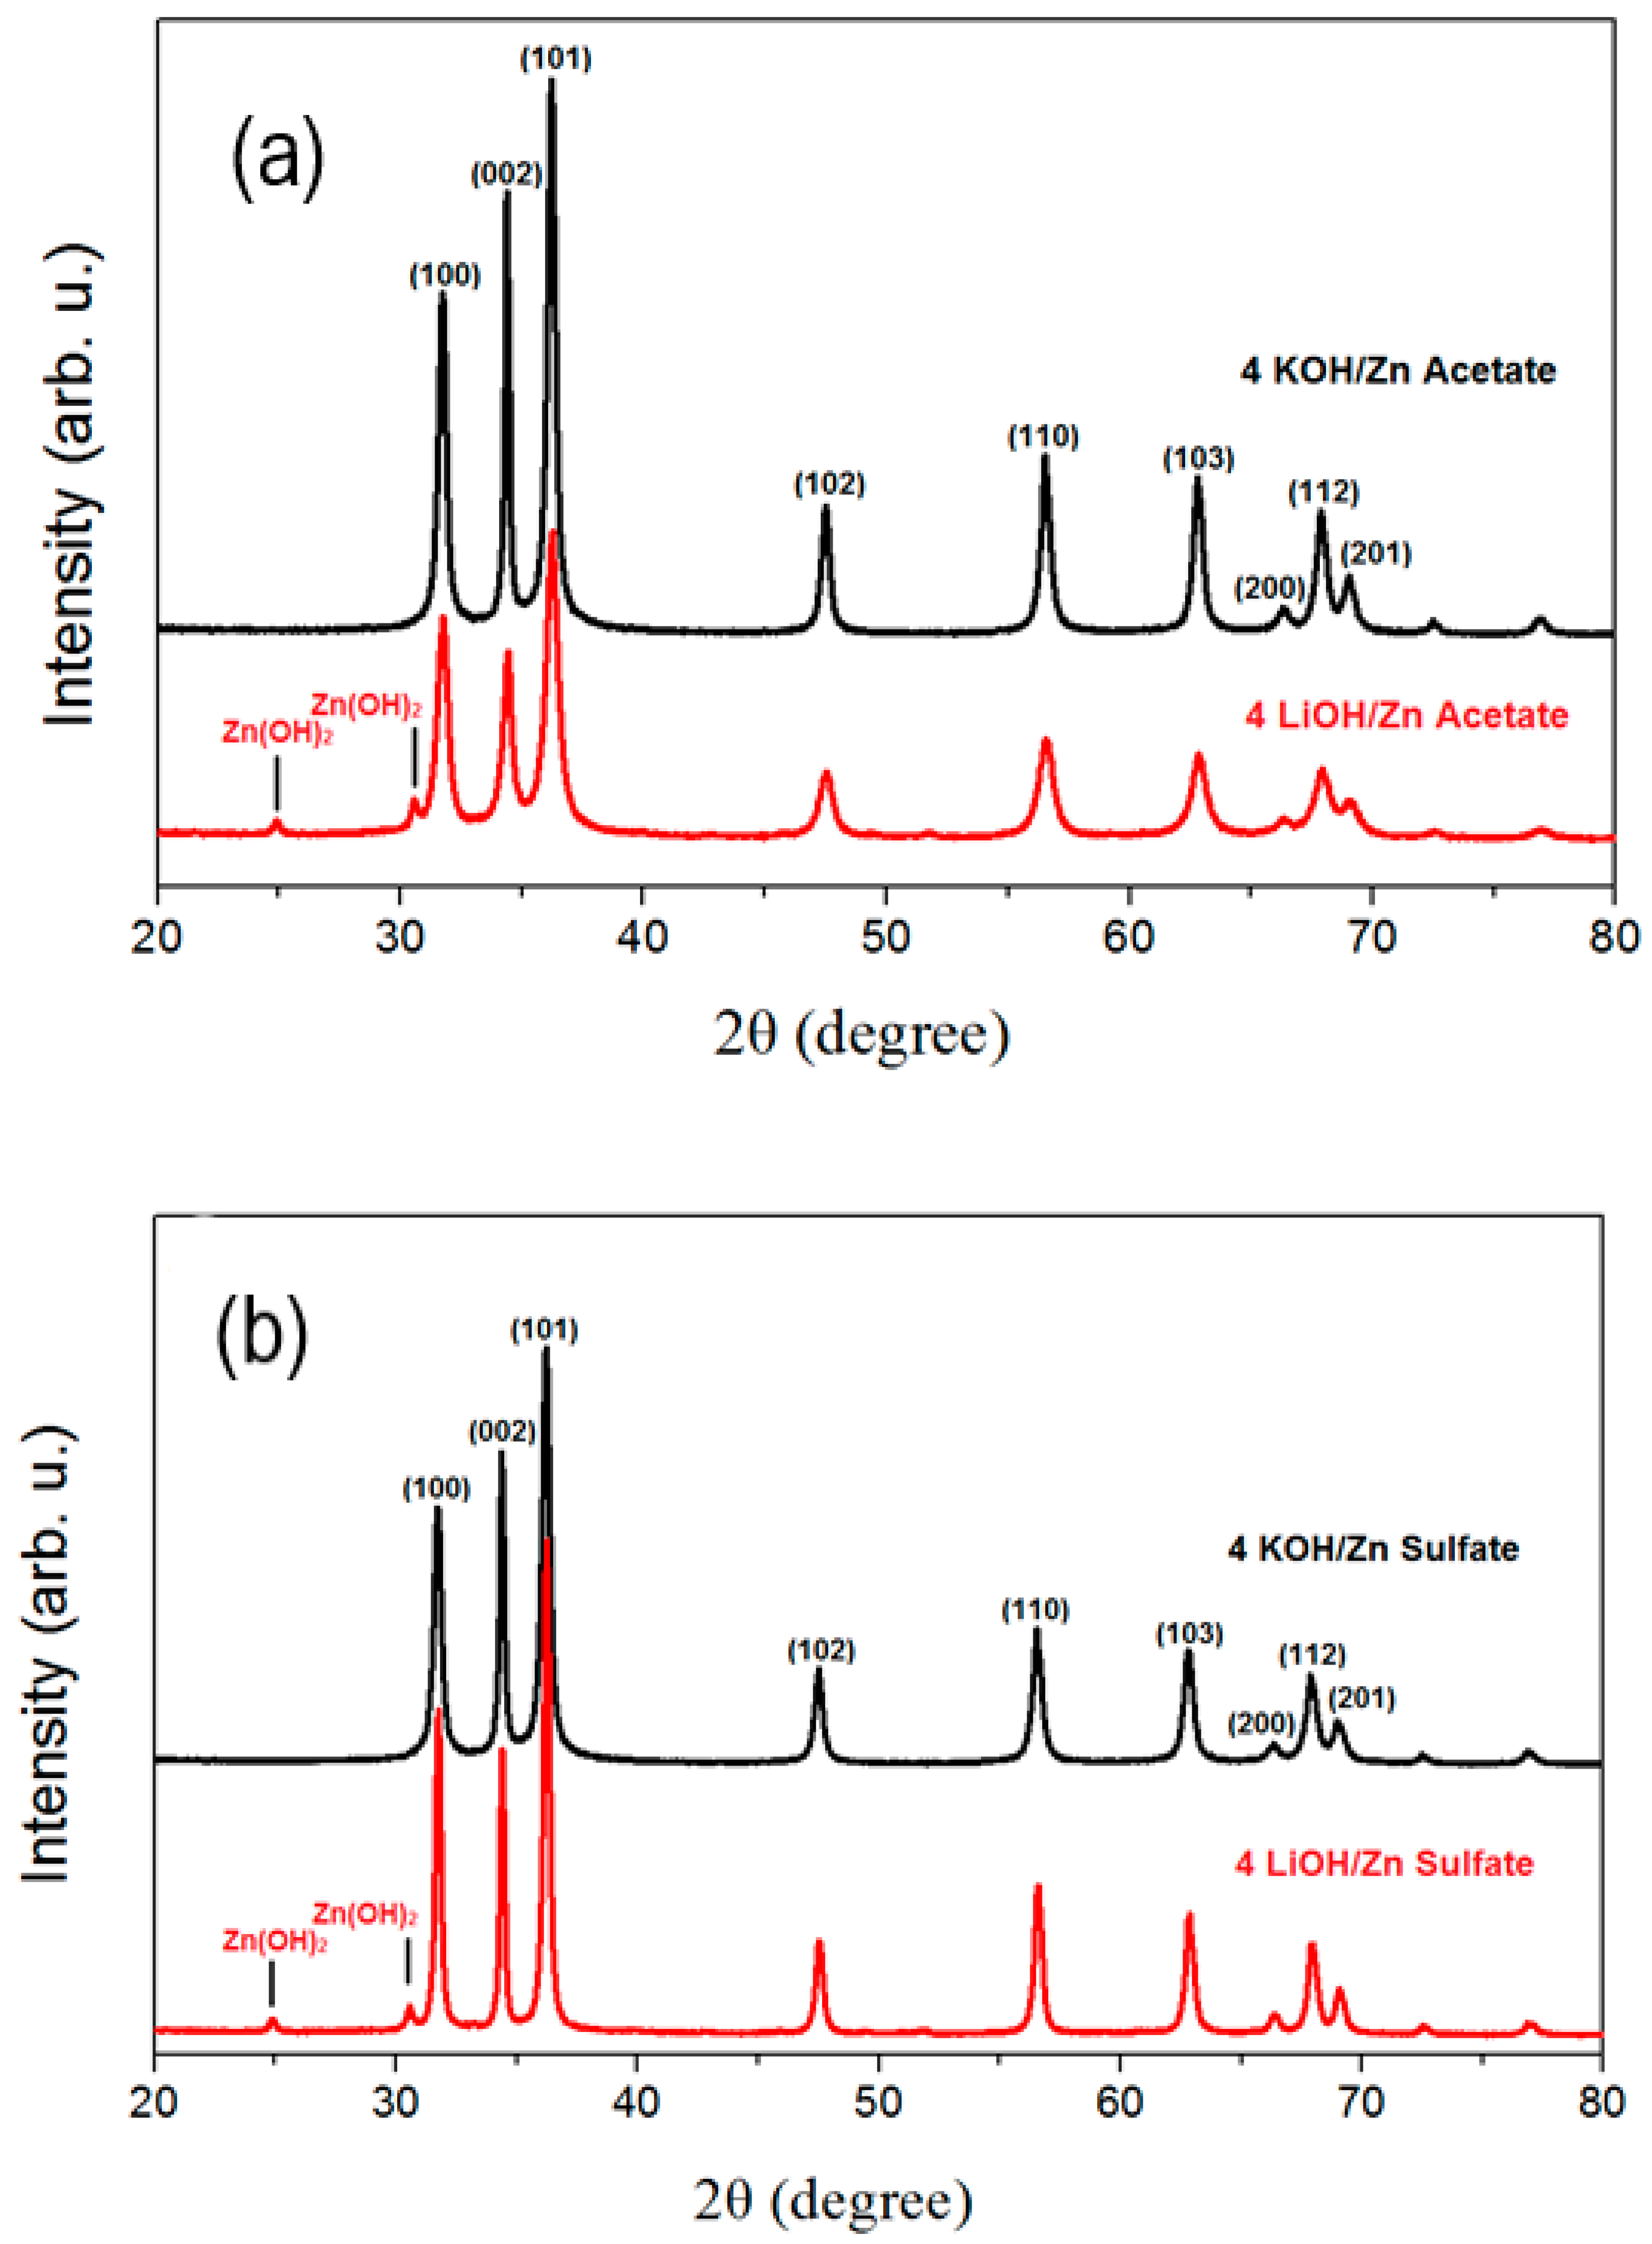
3.2. Crystalline Structure of ZnO Nanoparticles
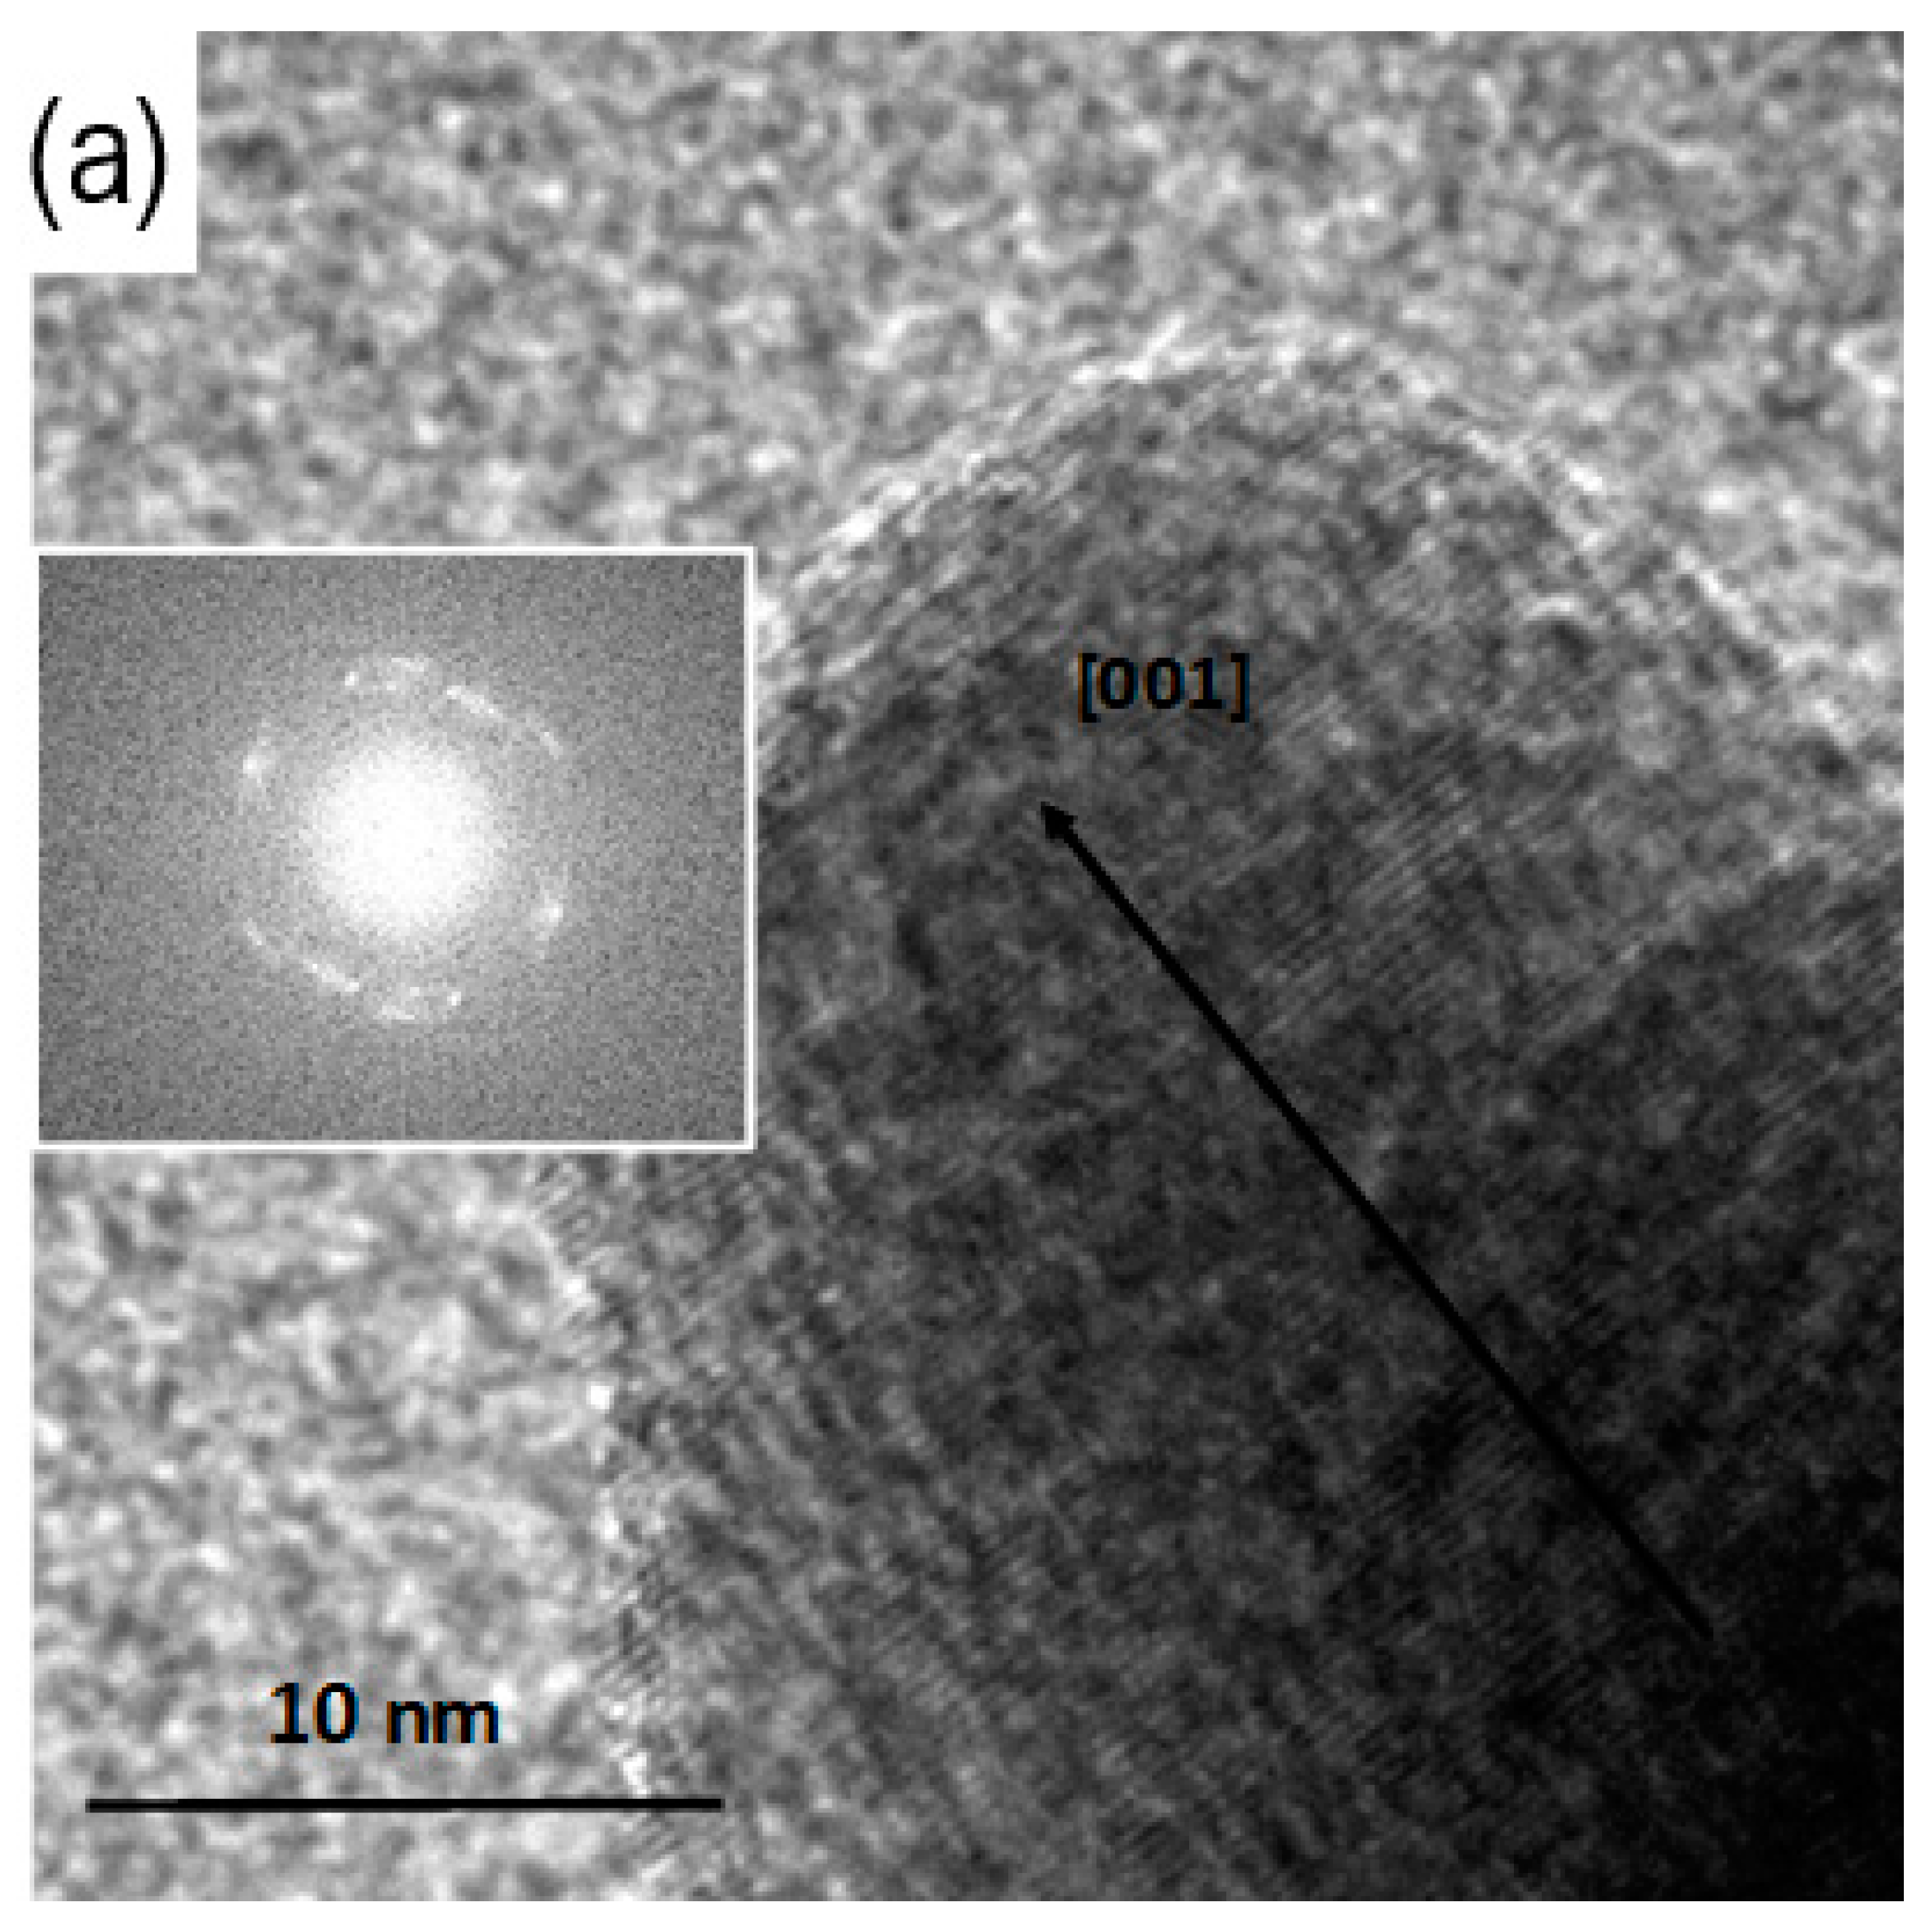
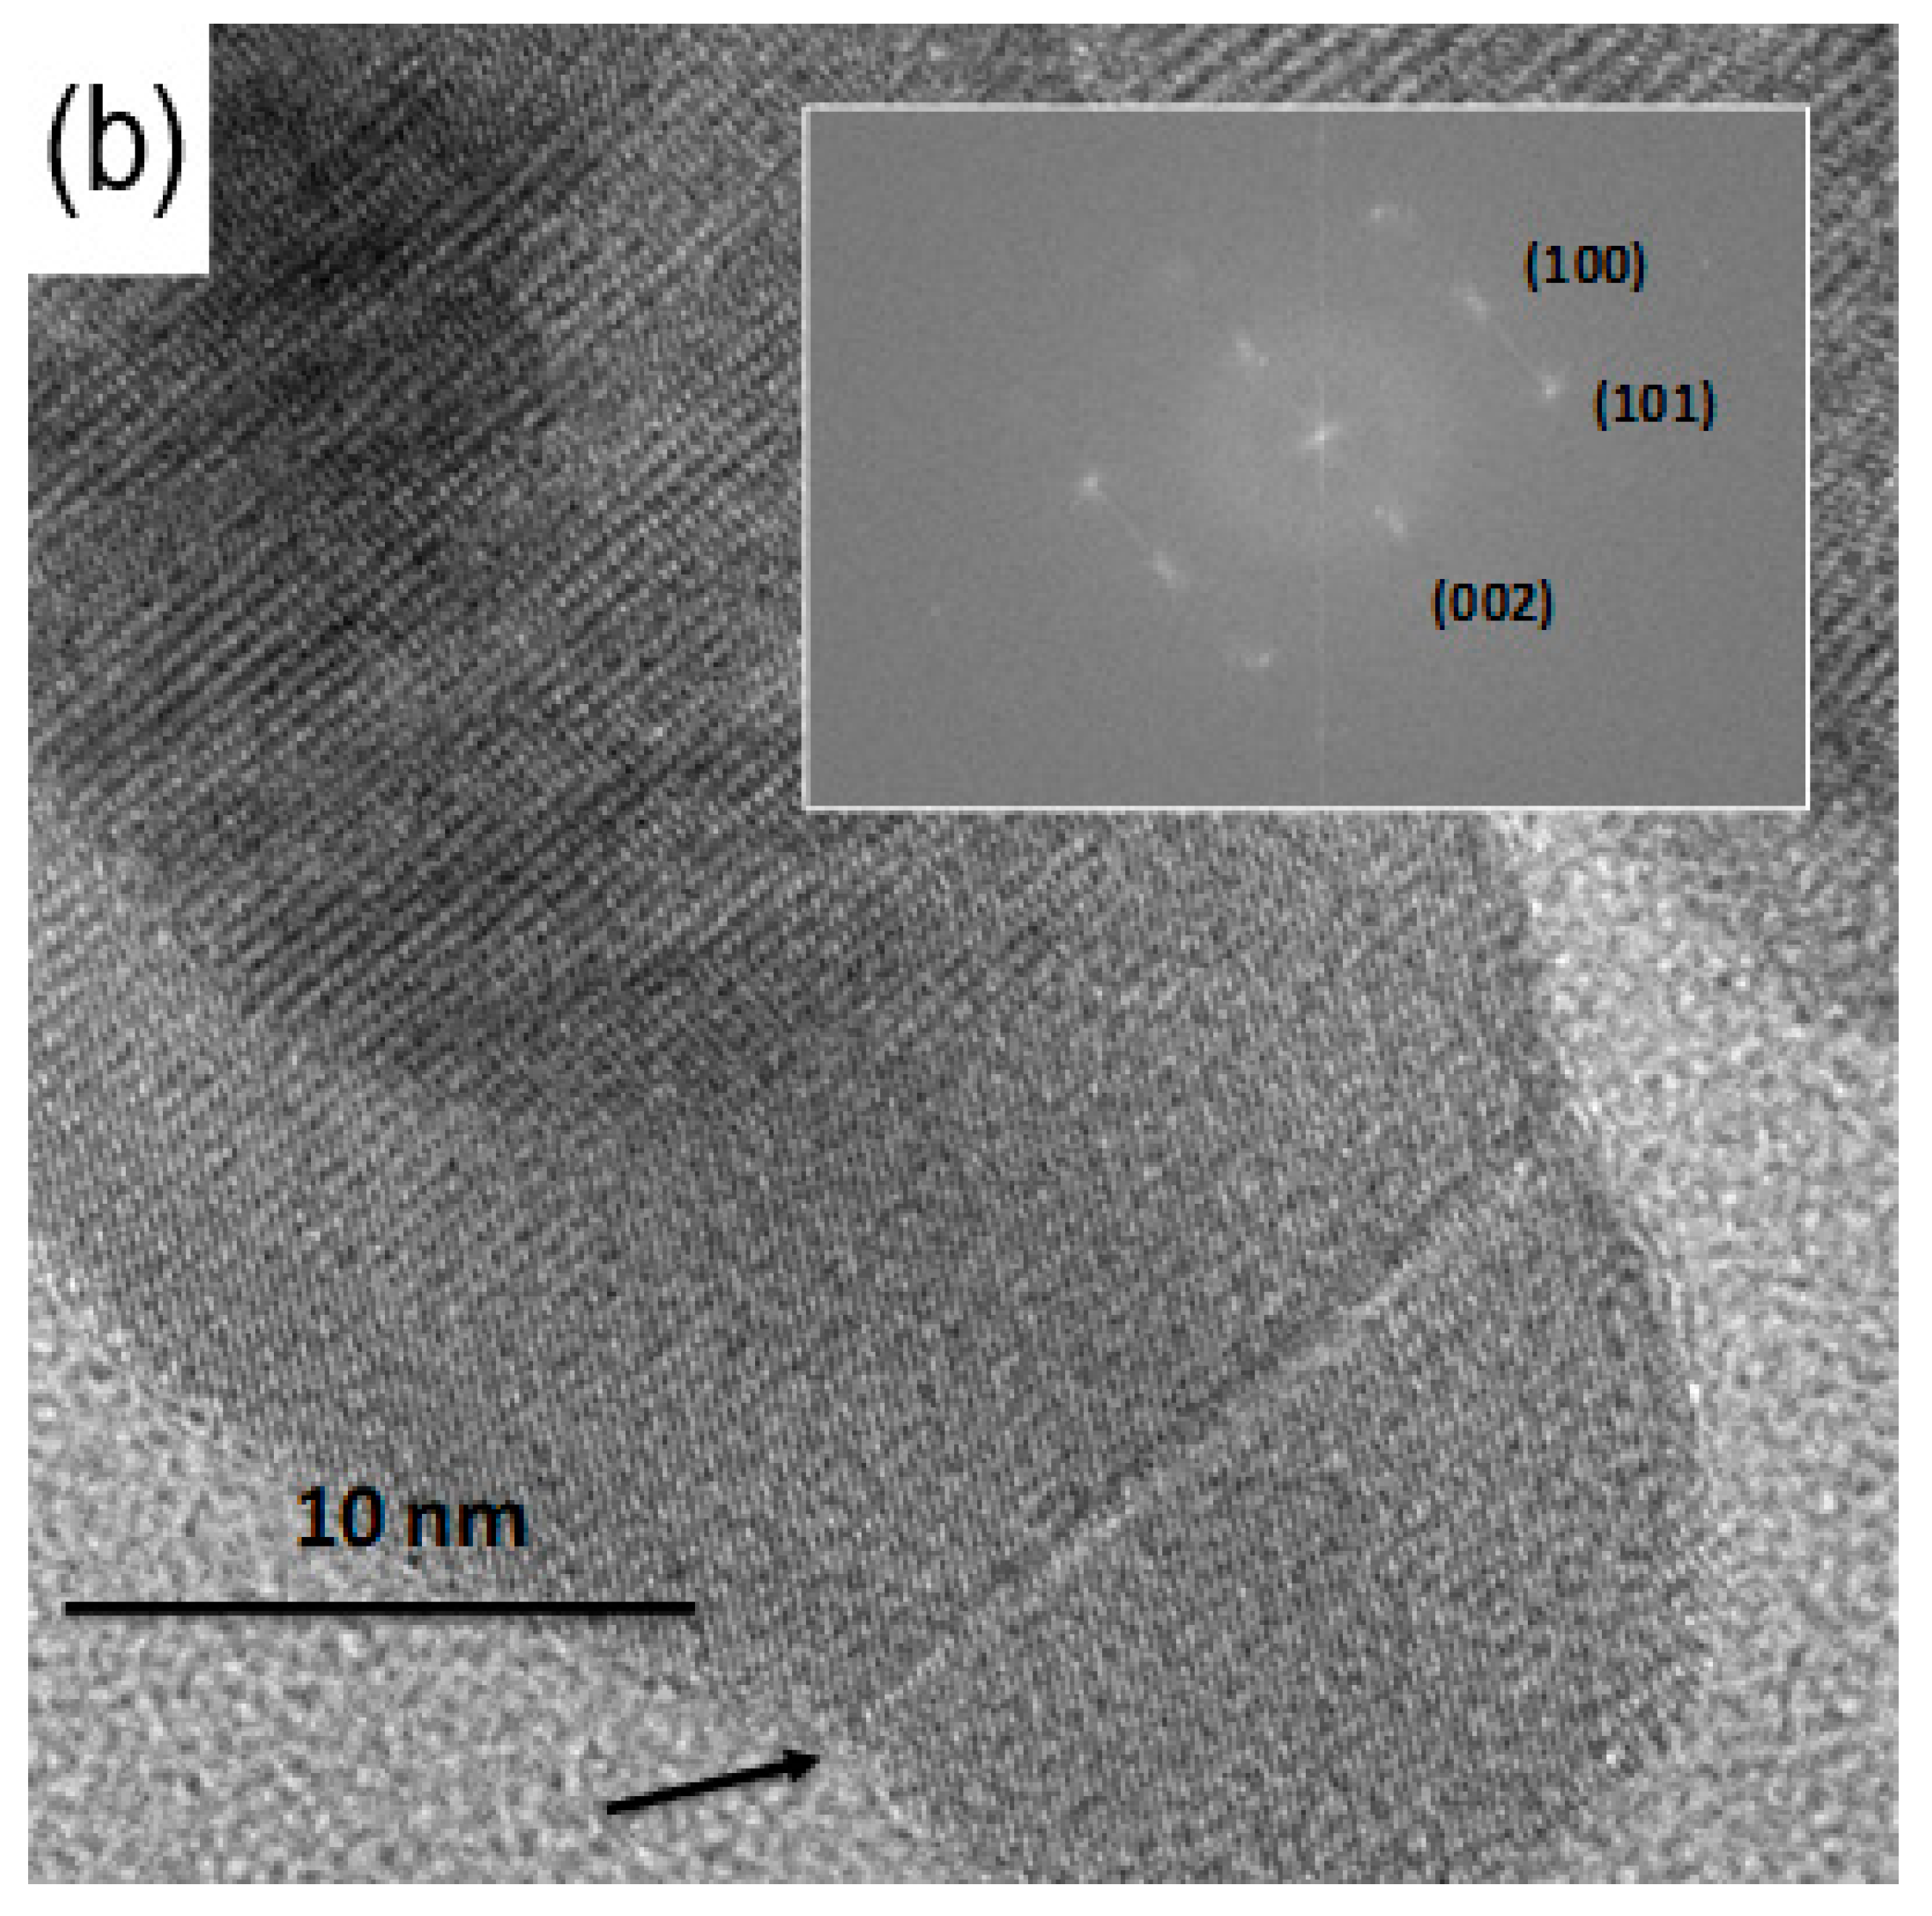
3.3. TEM Analysis
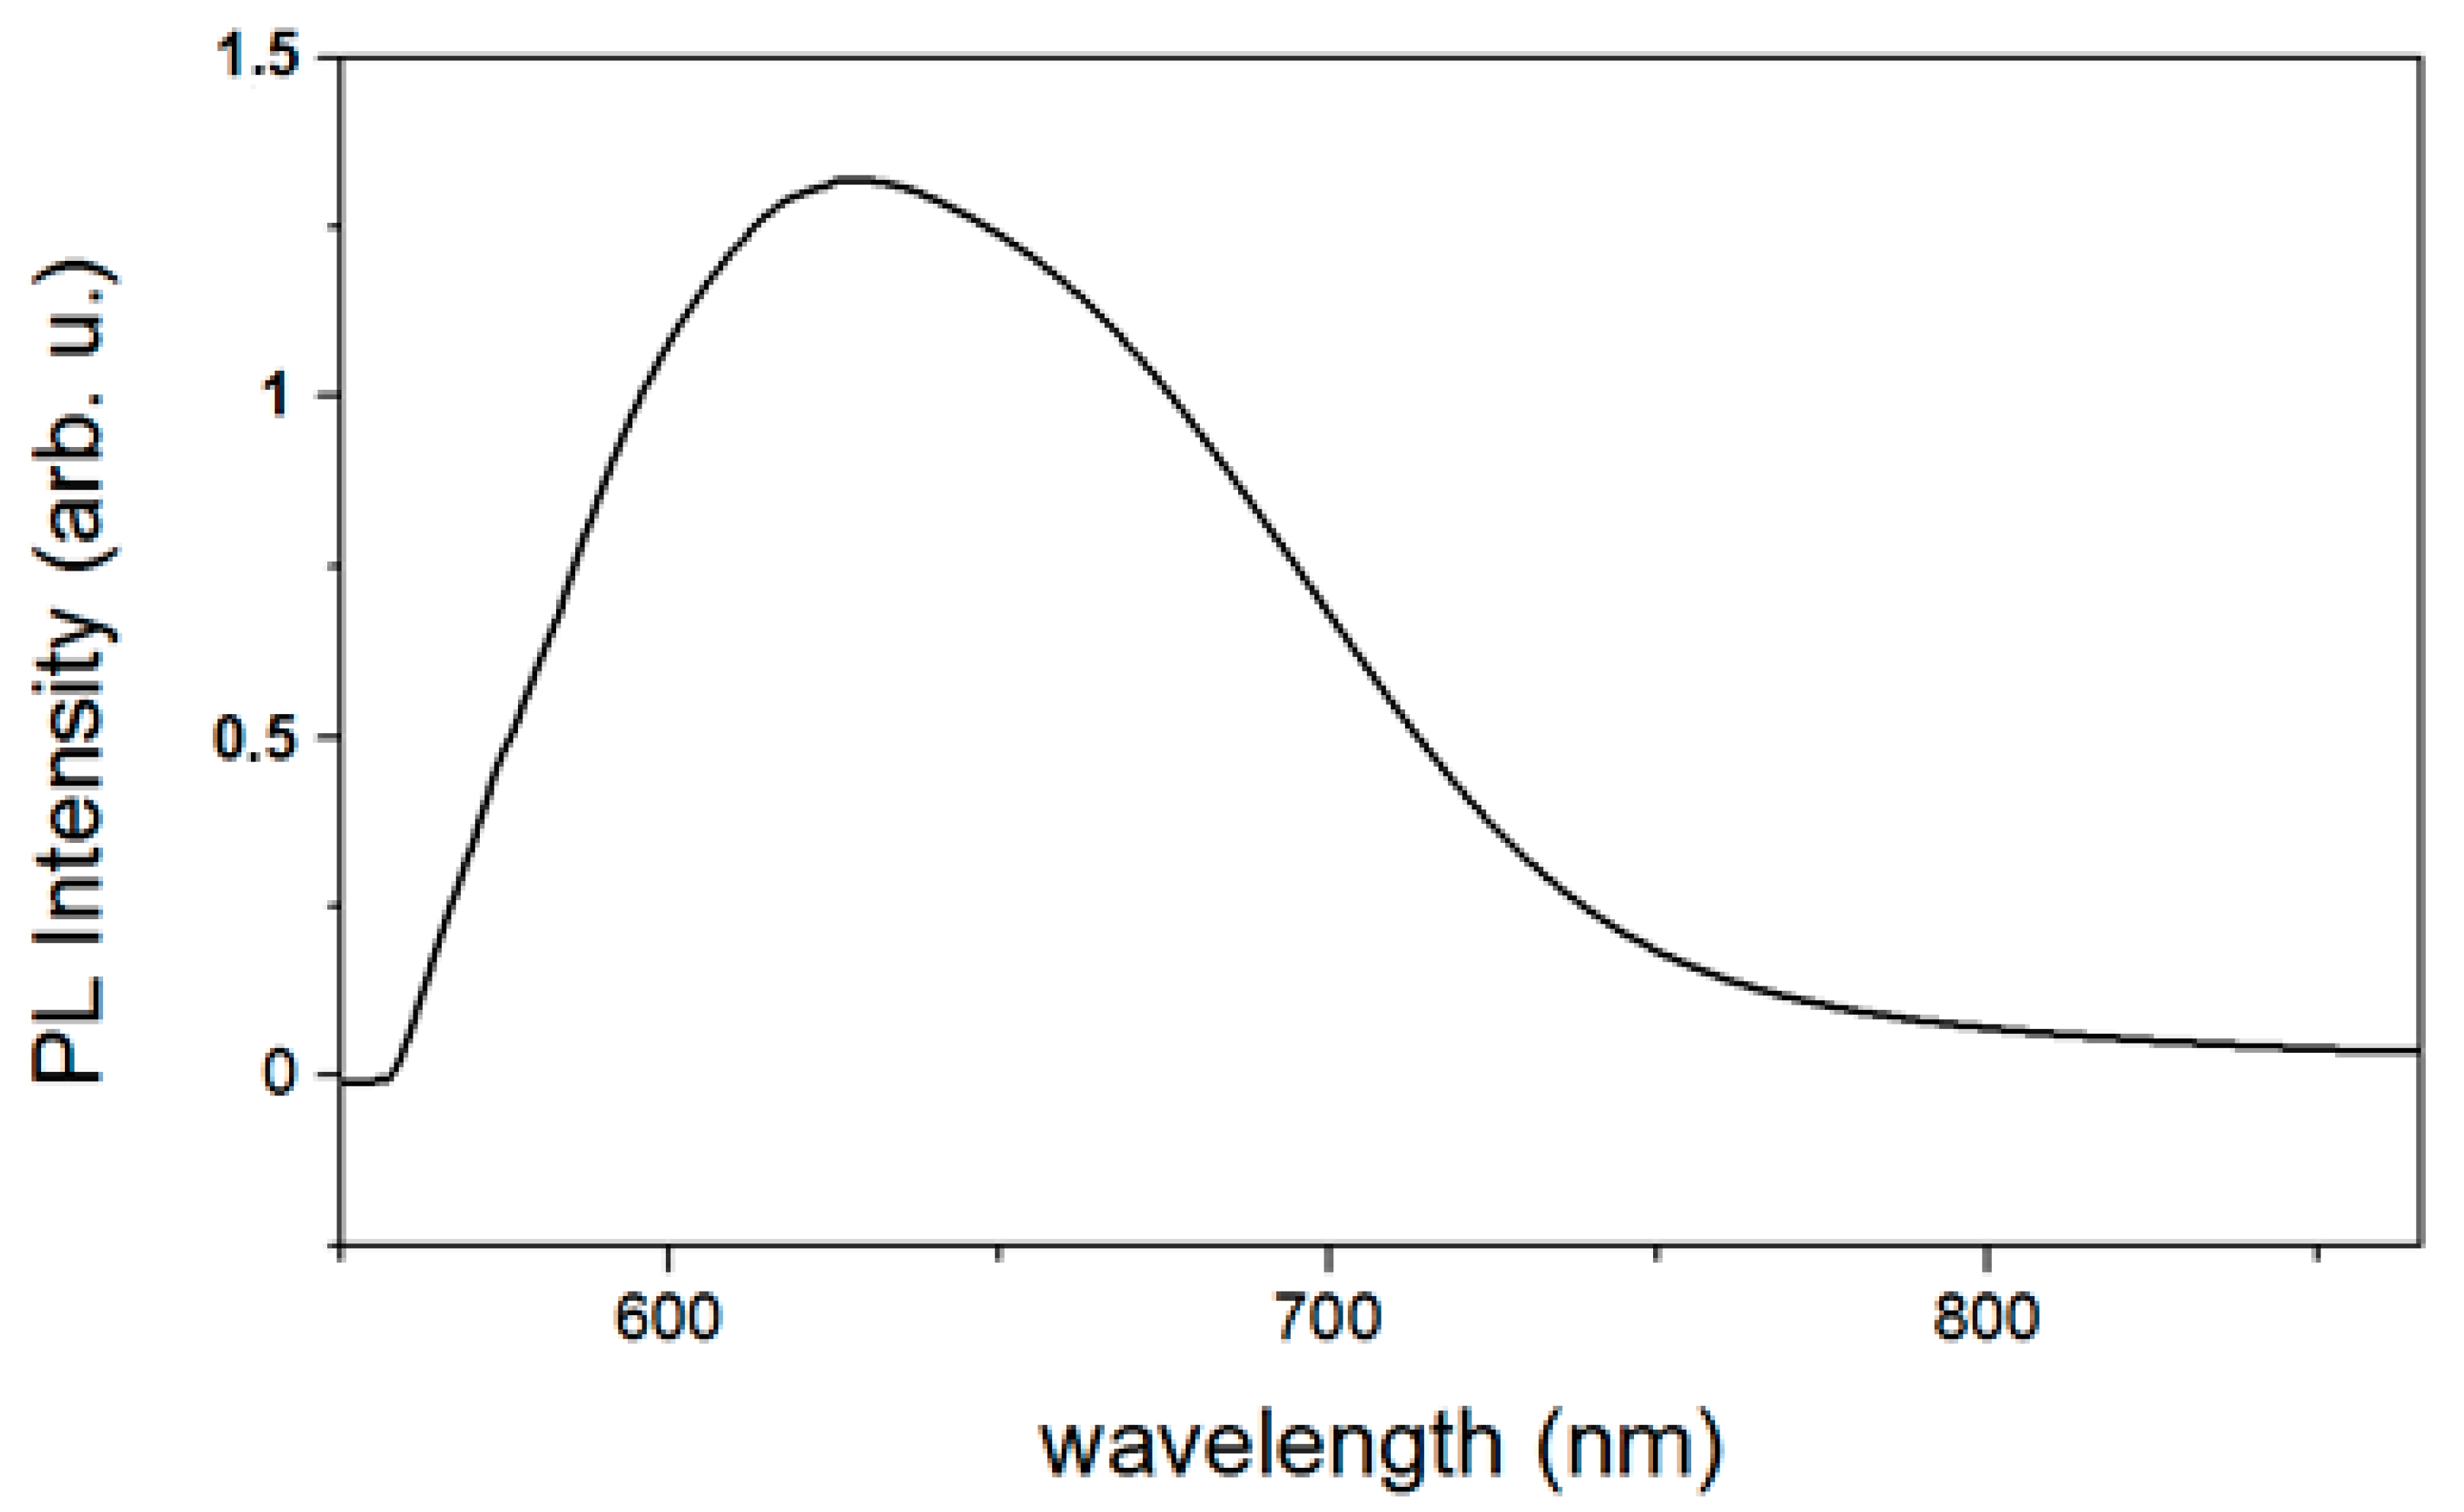
3.4. Optical Properties of ZnO Nanoparticles
4. Conclusions
Supplementary Materials
Author Contributions
Funding
Acknowledgments
Conflicts of Interest
References
- Özgür, Ü.; Alivov, Y.I.; Liu, C.; Teke, A.; Reshchikov, M.A.; Doğan, S.; Avrutin, V.; Cho, S.J.; Morkoç, H. A comprehensive review of ZnO materials and devices. J. Appl. Phys. 2005, 98, 1301. [Google Scholar] [CrossRef] [Green Version]
- Liu, K.; Sakurai, M.; Aono, M. ZnO-based ultraviolet photodetectors. Sensors 2010, 10, 8604–8634. [Google Scholar] [CrossRef] [PubMed] [Green Version]
- Dong, H.X.; Liu, Y.; Lu, J.; Chen, Z.H.; Wang, J.; Zhang, L. Single-crystalline tower-like ZnO microrod UV lasers. J. Mater. Chem. C 2013, 1, 202–206. [Google Scholar] [CrossRef]
- Vinod, R.; Sajan, P.; Achary, S.R.; Tomas, C.M.; Muñoz-Sanjosé, V.; Bushiri, M.J. Enhanced UV emission from ZnO nanoflowers synthesized by the hydrothermal process. J. Phys. D Appl. Phys. 2012, 45, 425103. [Google Scholar] [CrossRef]
- Richters, J.P.; Voss, T.; Wischmeier, L.; Ruckmann, I.; Gutowski, J. Near-band-edge photoluminescence spectroscopy of ZnO nanowires embedded in polymers. J. Korean Phys. Soc. 2008, 53, 2844–2846. [Google Scholar] [CrossRef]
- Samanta, P.K.; Patra, S.K.; Ghosh, A.; Chaudhuri, P.R. Visible emission from ZnO nanorods synthesized by a simple wet chemical method. Int. J. Nanosci. Nanotechnol. 2009, 1, 81–90. [Google Scholar]
- Lv, Y.; Xiao, W.; Li, W.; Xue, J.; Ding, J. Controllable synthesis of ZnO nanoparticles with high intensity visible photoemission and investigation of its mechanism. Nanotechnology 2013, 24, 175702. [Google Scholar] [CrossRef]
- Apostoluk, A.; Zhu, Y.; Masenelli, B.; Delaunay, J.-J.; Sibiński, M.; Znajdek, K.; Focsa, A.; Kaliszewska, I. Improvement of the solar cell efficiency by the ZnO nanoparticle layer via the downshifting effect. Microelectron. Eng. 2014, 127, 51–56. [Google Scholar] [CrossRef]
- Bano, N.; Zaman, S.; Zainelabdin, A.; Hussain, S.; Hussain, I.; Nur, O.; Willander, M. ZnO-organic hybrid white light emitting diodes grown on flexible plastic using low temperature aqueous chemical method. J. Appl. Phys. 2010, 108, 043103. [Google Scholar] [CrossRef] [Green Version]
- Baruah, S.; Sinha, S.S.; Ghosh, B.; Pal, S.K.; Raychaudhuri, A.K.; Dutta, J. Photoreactivity of ZnO nanoparticles in visible light: Effect of surface states on electron transfer reaction. J. Appl. Phys. 2009, 105, 074308. [Google Scholar] [CrossRef] [Green Version]
- Zhu, Y.; Apostoluk, A.; Liu, S.B.; Daniele, S.; Masenelli, B. ZnO nanoparticles as a luminescent downshifting layer for photosensitive devices. J. Semicond. 2013, 34, 053005. [Google Scholar] [CrossRef]
- Morales-Flores, N.; Galeazzi, R.; Rosendo, E.; Díaz, T.; Velumani, S.; Pal, U. Morphology control and optical properties of ZnO nanostructures grown by ultrasonic synthesis. Adv. Nano. Res. 2013, 1, 59–70. [Google Scholar] [CrossRef]
- Baruah, S.; Dutta, J. Hydrothermal growth of ZnO nanostructures. Sci. Technol. Adv. Mater. 2009, 10, 013001. [Google Scholar] [CrossRef] [PubMed]
- Rania, S.; Surib, P.; Shishodiac, P.K.; Mehra, R.M. Synthesis of nanocrystallineZnO powder via sol–gel route for dye-sensitized solar cells. Sol. Energ. Mat. Sol. Cells 2008, 92, 1639–1645. [Google Scholar] [CrossRef]
- Djurišić, A.B.; Leung, Y.H. Optical properties of ZnO nanostructures. Small 2006, 2, 944–961. [Google Scholar] [CrossRef]
- McCluskey, M.D.; Jokela, S.J. Defects in ZnO. J. Appl. Phys. 2009, 106, 071101. [Google Scholar] [CrossRef]
- Farahmandjou, M.; Jurablu, S. Co-precipitation Synthesis of zinc oxide (ZnO) nanoparticles by zinc nitrate precursor. Int. J. Bio-Inorg. Hybrid Nanomater. 2014, 3, 179–184. [Google Scholar]
- Manzoor, U.; Islam, M.; Tabassam, L.; Rahman, S.U. Quantum confinement effect in ZnO nanoparticles synthesized by co-precipitate method. Phys. E 2009, 41, 1669–1672. [Google Scholar] [CrossRef]
- Singh, J.; Mittu, B.; Chauhan, A.; Sharma, A.; Singla, M.L. Role of alkali metal hydroxide in controlling the size of ZnO nanoparticles in non-aqueous medium. Int. J. Fundam. Appl. Sci. 2012, 1, 91–93. [Google Scholar]
- Xiong, H.M.; Ma, R.Z.; Wang, S.F.; Xia, Y.Y. Photoluminescent ZnO nanoparticles synthesized at the interface between air and triethylene glycol. J. Mater. Chem. 2011, 21, 3178–3182. [Google Scholar] [CrossRef]
- Rocha, M.; Araujo, F.P.; Castro-Lopes, S.; de Lima, I.S.; Cavalcanti Silva-Filho, E.; Anteveli Osajima, J.; Oliveira, C.S.; Viana, B.C.; Almeida, L.C.; Guerra, Y.; et al. Synthesis of Fe–Pr co-doped ZnO nanoparticles: Structural, optical and antibacterial properties, Ceram. Int. 2023, 49, 2282–2295. [Google Scholar] [CrossRef]
- Akpomie, K.G.; Ghosh, S.; Gryzenhout, M.; Conradie, J. One-pot synthesis of zinc oxide nanoparticles via chemical precipitation for bromophenol blue adsorption and the antifungal activity against filamentous fungi. Sci. Rep. 2021, 11, 8305. [Google Scholar] [CrossRef]
- De Mello, J.C.; Wittmann, H.F.; Friend, R.H. An improved experimental determination of external photoluminescence quantum efficiency. Adv. Mater. 1997, 9, 230–232. [Google Scholar] [CrossRef]
- Damen, T.C.; Porto, S.P.S.; Tell, B. Raman effect in zinc oxide. Phys. Rev. 1966, 142, 570–574. [Google Scholar] [CrossRef]
- Spanhel, L. Colloidal ZnO nanostructures and functional coatings: A survey. J. Sol-Gel Sci. Technol. 2006, 39, 7–24. [Google Scholar] [CrossRef]
- Wang, M.; Zhou, Y.; Zhang, Y.; Kim, E.J.; Hahn, S.H.; Seong, S.G. Near-infrared photoluminescence from ZnO. Appl. Phys. Lett. 2012, 100, 101906. [Google Scholar] [CrossRef]
- Lin, W.W.; Chen, D.G.; Zhang, J.Y.; Lin, Z.; Huang, J.K.; Li, W.; Wang, Y.H.; Huang, F. Hydrothermal Growth of ZnO Single Crystals with High Carrier Mobility. Cryst. Growth Des. 2009, 9, 4378–4383. [Google Scholar] [CrossRef]
- Dem’yanets, L.N.; Kostomarov, D.V.; Kuz’mina, I.P. Chemistry and Kinetics of ZnO Growth from Alkaline Hydrothermal Solutions. Inorg. Mater. 2002, 38, 171–179. [Google Scholar]
- Pourrahimi, A.M.; Liu, D.; Pallon, L.K.H.; Andersson, R.L.; Abad, A.M.; Lagarón, J.M.; Hedenqvist, M.S.; Ström, V.; Gedde, U.W.; Olsson, R.T. Water-based synthesis and cleaning methods for high purity ZnO nanoparticles–comparing acetate; chloride; sulphate and nitrate zinc salt precursors. R. Soc. Chem. Adv. 2014, 4, 35568–35577. [Google Scholar] [CrossRef] [Green Version]
- Vempati, S.; Mitra, J.; Dawson, P. One-step synthesis of ZnO nanosheets: A blue-white fluorophore. Nanoscale Res. Lett. 2012, 7, 1–10. [Google Scholar] [CrossRef] [Green Version]
- Djurišić, A.B.; Leung, Y.H.; Tam, K.H.; Hsu, Y.F.; Ding, L.; Ge, W.K.; Zhong, Y.C.; Wong, K.S.; Chan, W.K.; Tam, H.L.; et al. Defect emissions in ZnO nanostructures. Nanotechnology 2007, 18, 95702. [Google Scholar] [CrossRef]
- Felbier, P.; Yang, J.; Theis, J.; Liptak, R.W.; Wagner, A.; Lorke, A.; Bacher, G.; Kortshagen, U. Highly Luminescent ZnO Quantum Dots Made in a Nonthermal Plasma. Adv. Funct. Mater. 2014, 24, 1988–1993. [Google Scholar] [CrossRef]
- Janotti, A.; Van de Walle, C.G. Native point defects in ZnO. Phys. Rev. B 2007, 76, 165202. [Google Scholar] [CrossRef]
- Morfa, A.J.; Gibson, B.C.; Karg, M.; Karle, T.J.; Greentree, A.D.; Mulvaney, P.; Tomljenovic-Hanic, S. Single-photon emission and quantum characterization of zinc oxide defects. Nano Lett. 2012, 12, 949–954. [Google Scholar] [CrossRef]
- Leung, Y.H.; Chen, X.Y.; Ng, A.M.C.; Guo, M.Y.; Liu, F.Z.; Djurišić, A.B.; Chan, W.K.; Shi, X.Q.; Van Hove, M.A. Green emission in ZnO nanostructures—Examination of the roles of oxygen and zinc vacancies. Appl. Surf. Sci. 2013, 271, 202–209. [Google Scholar] [CrossRef]
- Li, M.J.; Xing, G.C.; Xing, G.Z.; Wu, B.; Wu, T.; Zhang, X.H.; Sum, T.C. Origin of green emission and charge trapping dynamics in ZnO nanowires. Phys. Rev. B 2013, 87, 115309. [Google Scholar] [CrossRef]
- Li, D.; Leung, Y.H.; Djurišić, A.B.; Liu, Z.T.; Xie, M.H.; Shi, S.L.; Xu, S.J.; Chan, W.K. Different origins of visible luminescence in ZnO nanostructures fabricated by the chemical and evaporation methods. Appl. Phys. Lett. 2004, 85, 1601–1603. [Google Scholar] [CrossRef] [Green Version]
- An, W.; Wu, X.J.; Zeng, X.C. Adsorption of O2, H2, CO, NH3 and NO2 on ZnO nanotube: a density functional theory study. J. Phys. Chem. C 2008, 112, 5747–5755. [Google Scholar] [CrossRef]
- Awan, S.U.; Hasanain, S.K.; Hassnain, J.G.; Anjum, D.H.; Qurashi, U.S. Defects induced luminescence and tuning of bandgap energy narrowing in ZnO nanoparticles doped with Li ions. J. Appl. Phys. 2014, 116, 083510. [Google Scholar] [CrossRef]
- Sa’aedi, A.; Cheraghizade, M.; Aghaji, A.G.; Saedi, A. Effect of Li-Dope on Morphological and Optical Properties of ZnO Nanostructures. J. Basic Appl. Sci. Res. 2013, 3, 226–231. [Google Scholar]
- Ganesh, I.; Sekhar, P.S.C.; Padmanabham, G.G.; Sundararajan, G. Preparation and characterization of Li-doped ZnO nano-sized powders for photocatalytic applications. Mater. Sci. Forum 2013, 734, 90–116. [Google Scholar] [CrossRef]
- Nanda, S.; Chandni, D.; Patra, A.K.; Gupta, P.S.; Kumar, S. Lithium doping and photoluminescence properties of ZnO nanorods. AIP Adv. 2018, 8, 015306. [Google Scholar]
- Tanyawong, S.; Tang, I.-M.; Herng, T.S.; Thongmee, S. Enhancement of Virtual Magnetic Moment Formation in ZnO NPs by Li+ Ion Doping. J. Supercond. Nov. Magn. 2020, 33, 2851–2859. [Google Scholar] [CrossRef]
- Adama, R.E.; Pozinab, G.; Willandera, M.; Nura, O. Synthesis of ZnO nanoparticles by co-precipitation method for solar driven photodegradation of Congo red dye at different pH. Photonics Nanostruct.-Fundam. Appl. 2018, 32, 11–18. [Google Scholar] [CrossRef]


| Precursor | Hydroxide | ||
|---|---|---|---|
| KOH | LiOH | ||
| 4 eq. | 2 eq. | 4 eq. | |
| Zinc acetate | 20 nm | 21 nm | 13 nm |
| Zinc sulfate | 20 nm | 23 nm | 27 nm |
| Precursors | FWHM of (101) Peak and Resulting Crystalline Domain Size | FWHM of (002) Peak and Resulting Crystalline Domain Size |
|---|---|---|
| 4 LiOH/Zn acetate | 0.63° (13 nm) | 0.57° (15 nm) |
| 4 KOH/Zn acetate | 0.44° (20 nm) * | 0.36° (24 nm) |
| 4 LiOH/Zn sulfate | 0.32° (27 nm) | 0.31° (28 nm) |
| 4 KOH/Zn sulfate | 0.44° (20 nm) * | 0.33° (26 nm) |
| Surface Defects | Peak Range (nm) |
|---|---|
| VZn | 470–520 |
| VO | 520–570 |
| VO+ | 570–620 |
| VO++ | 620–670 |
| Oi | 670–720 |
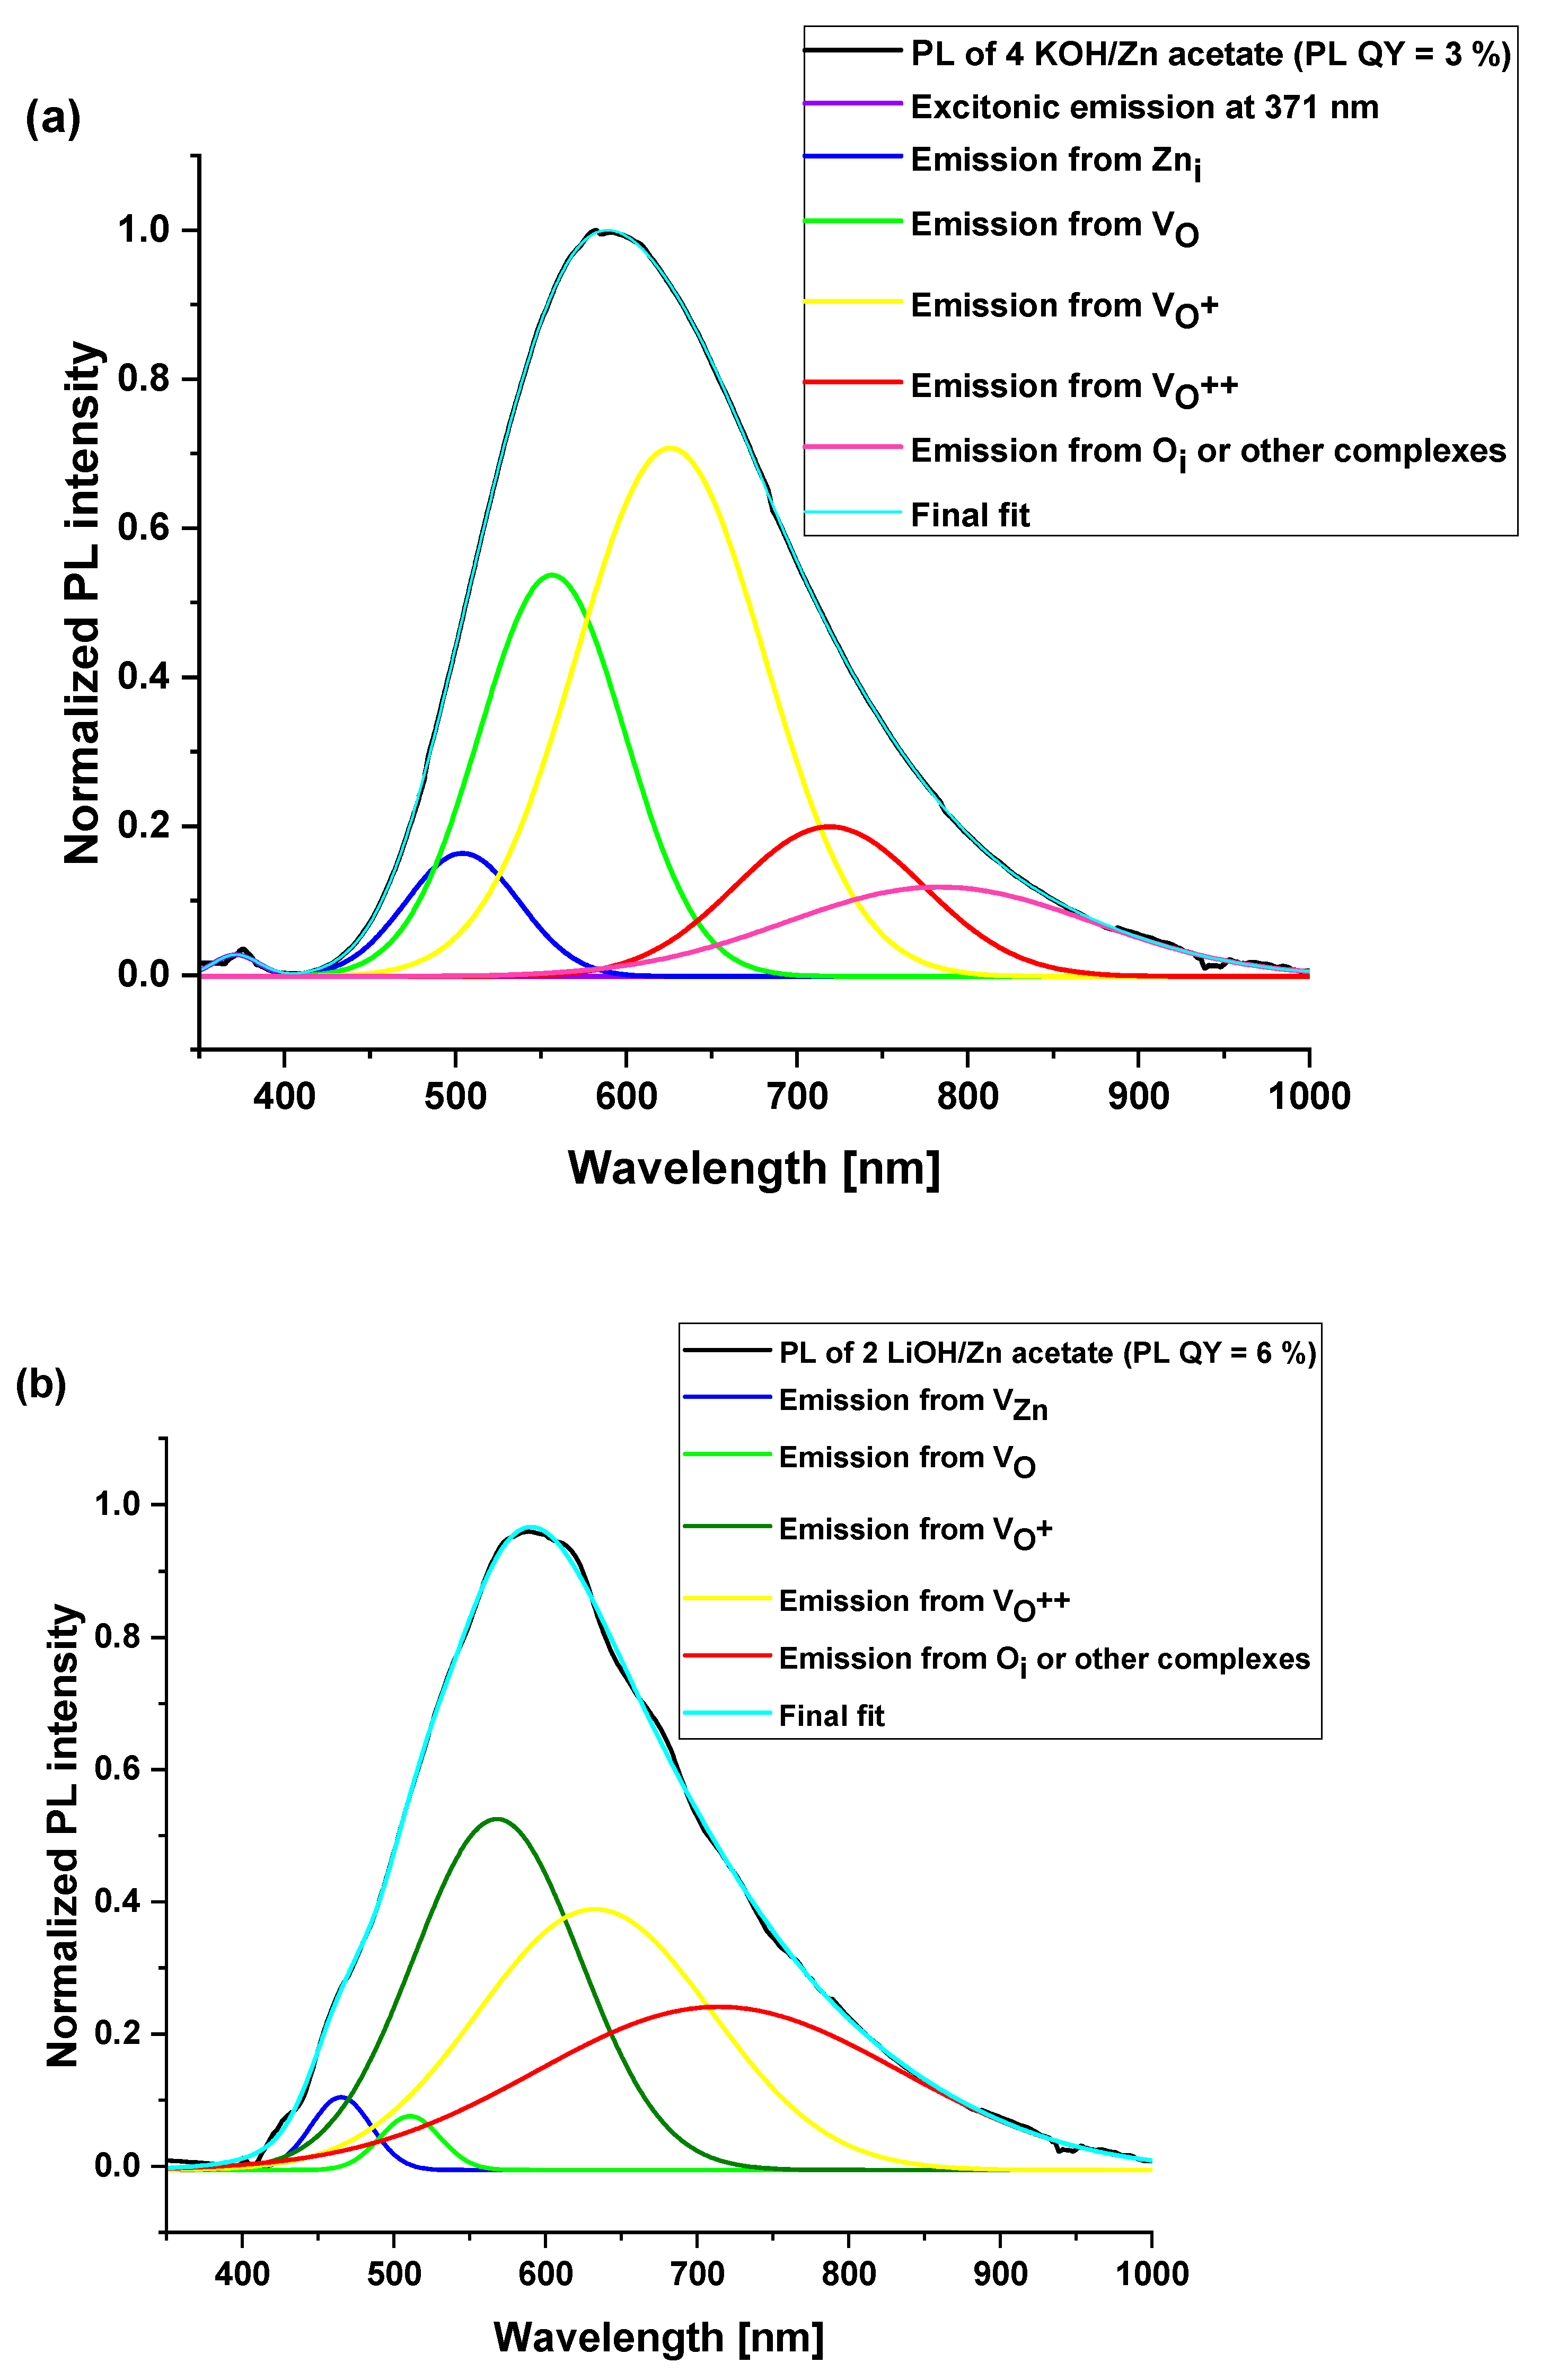
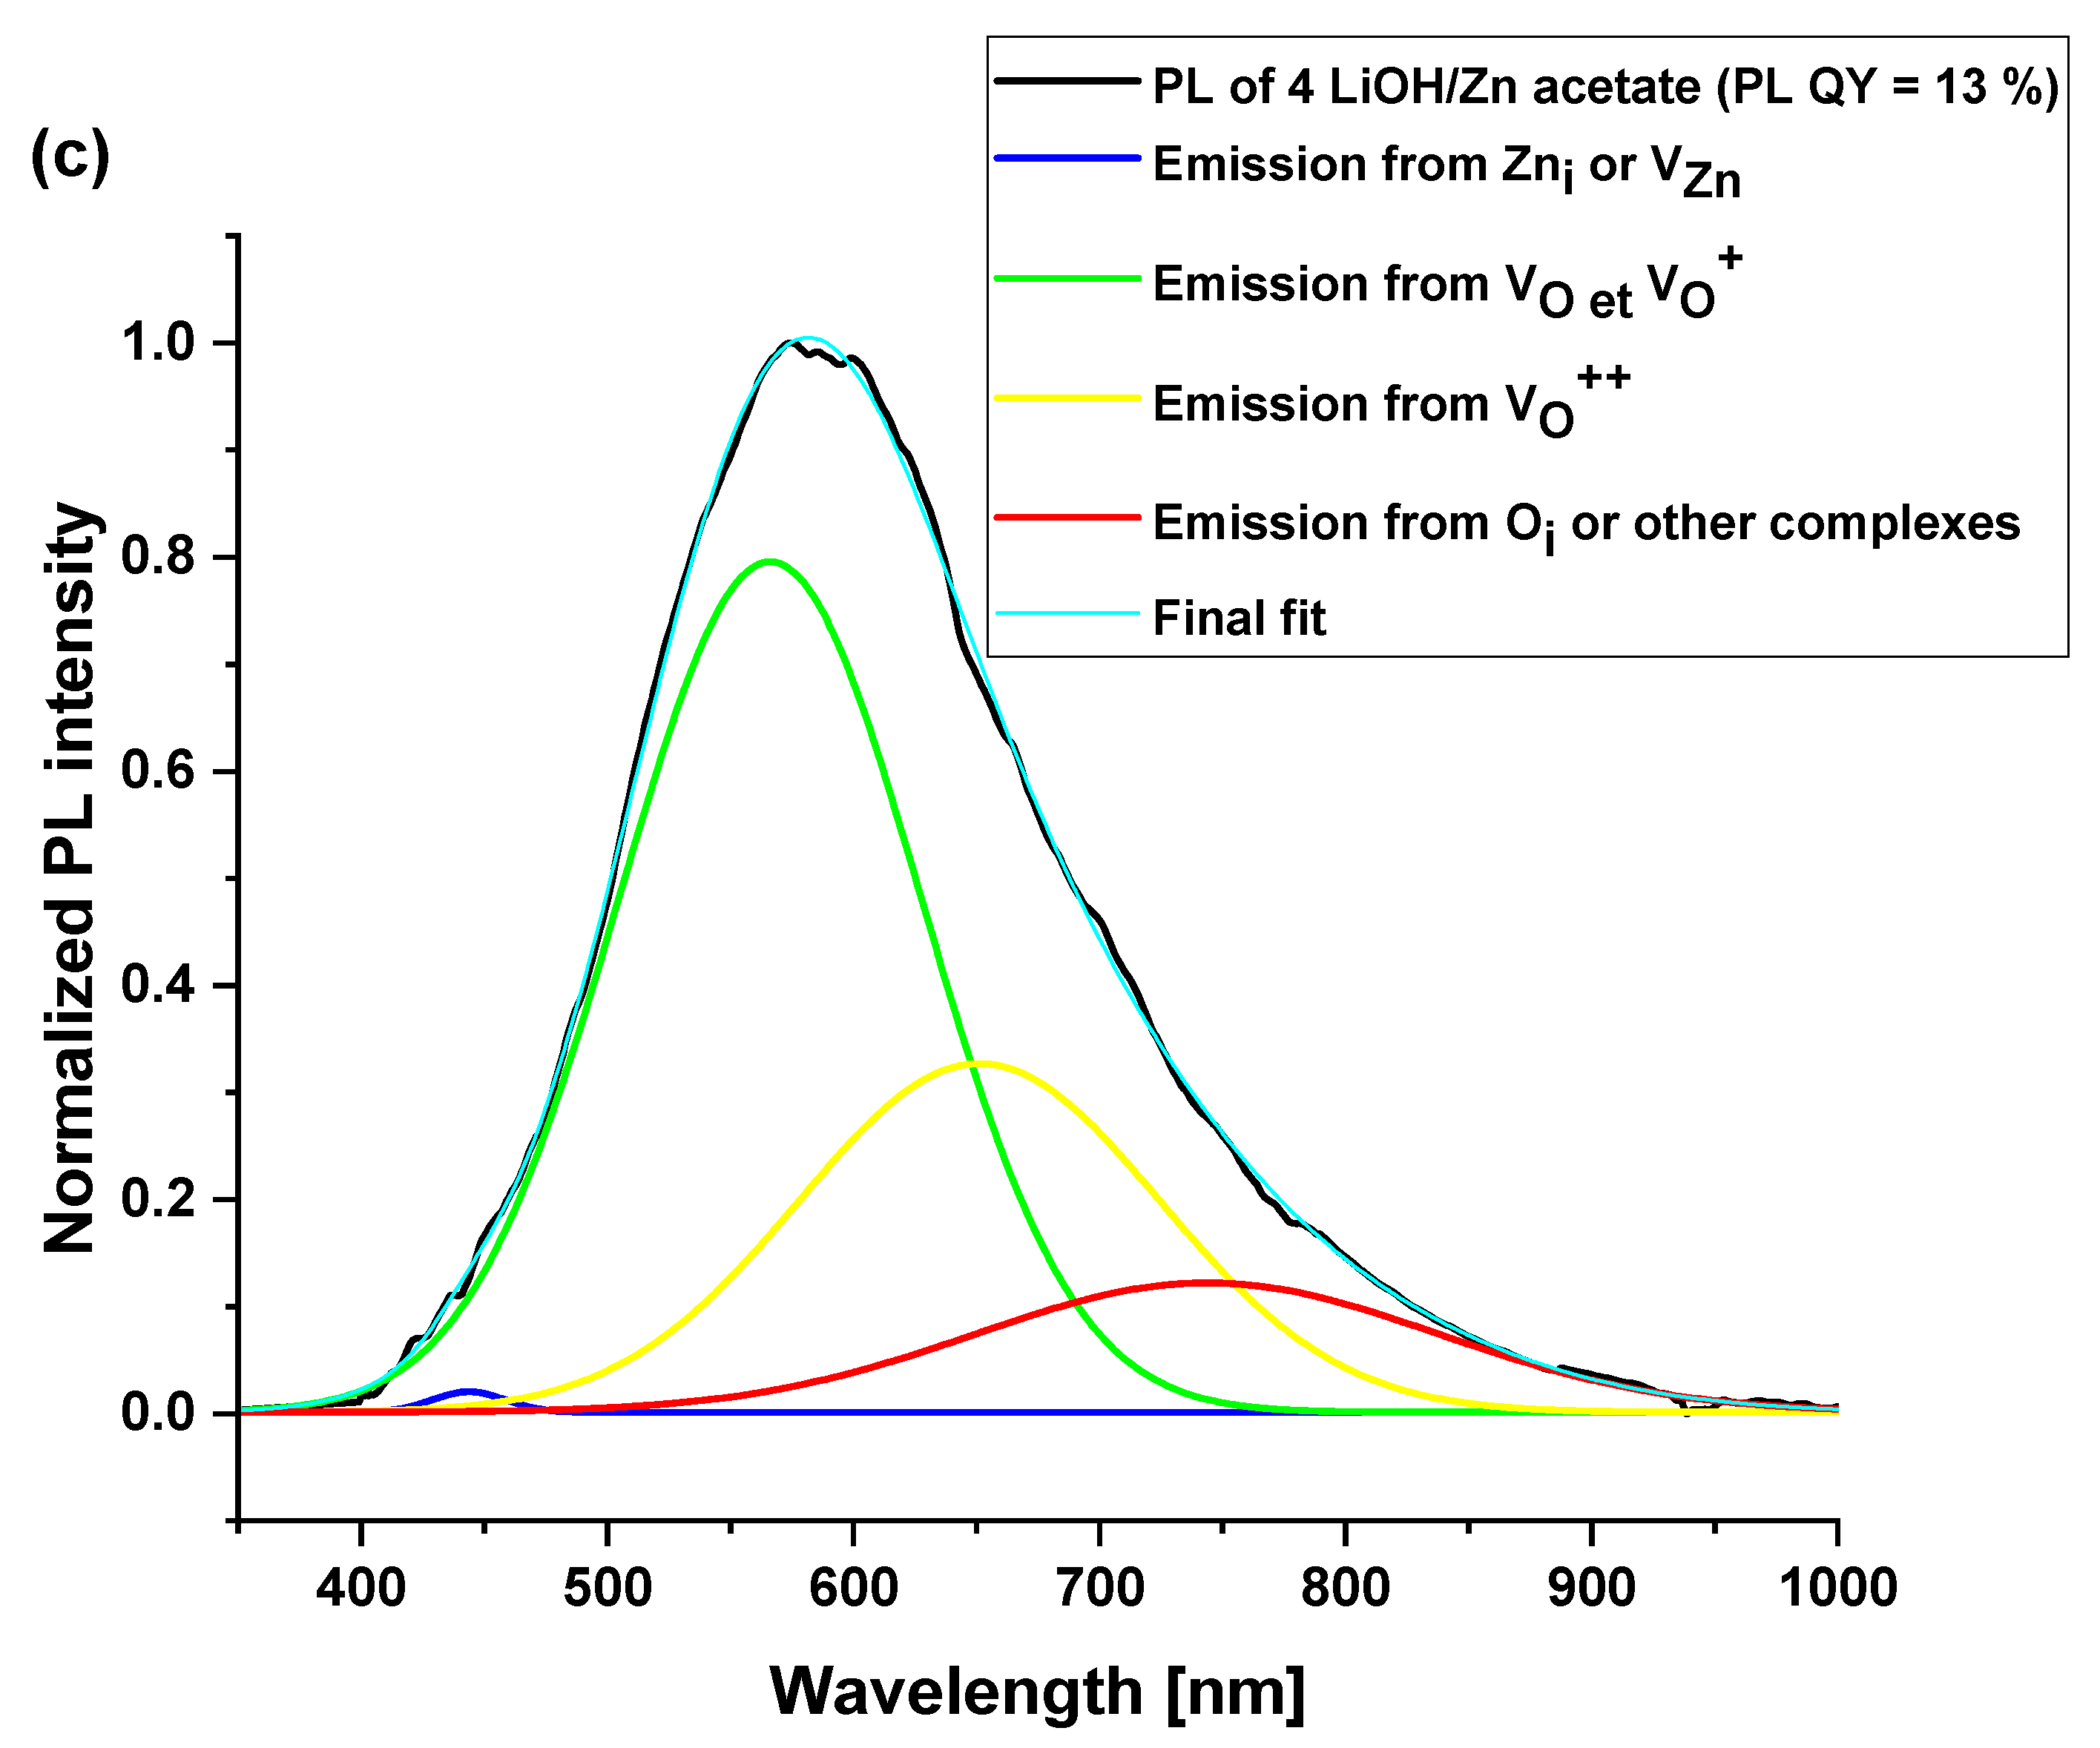
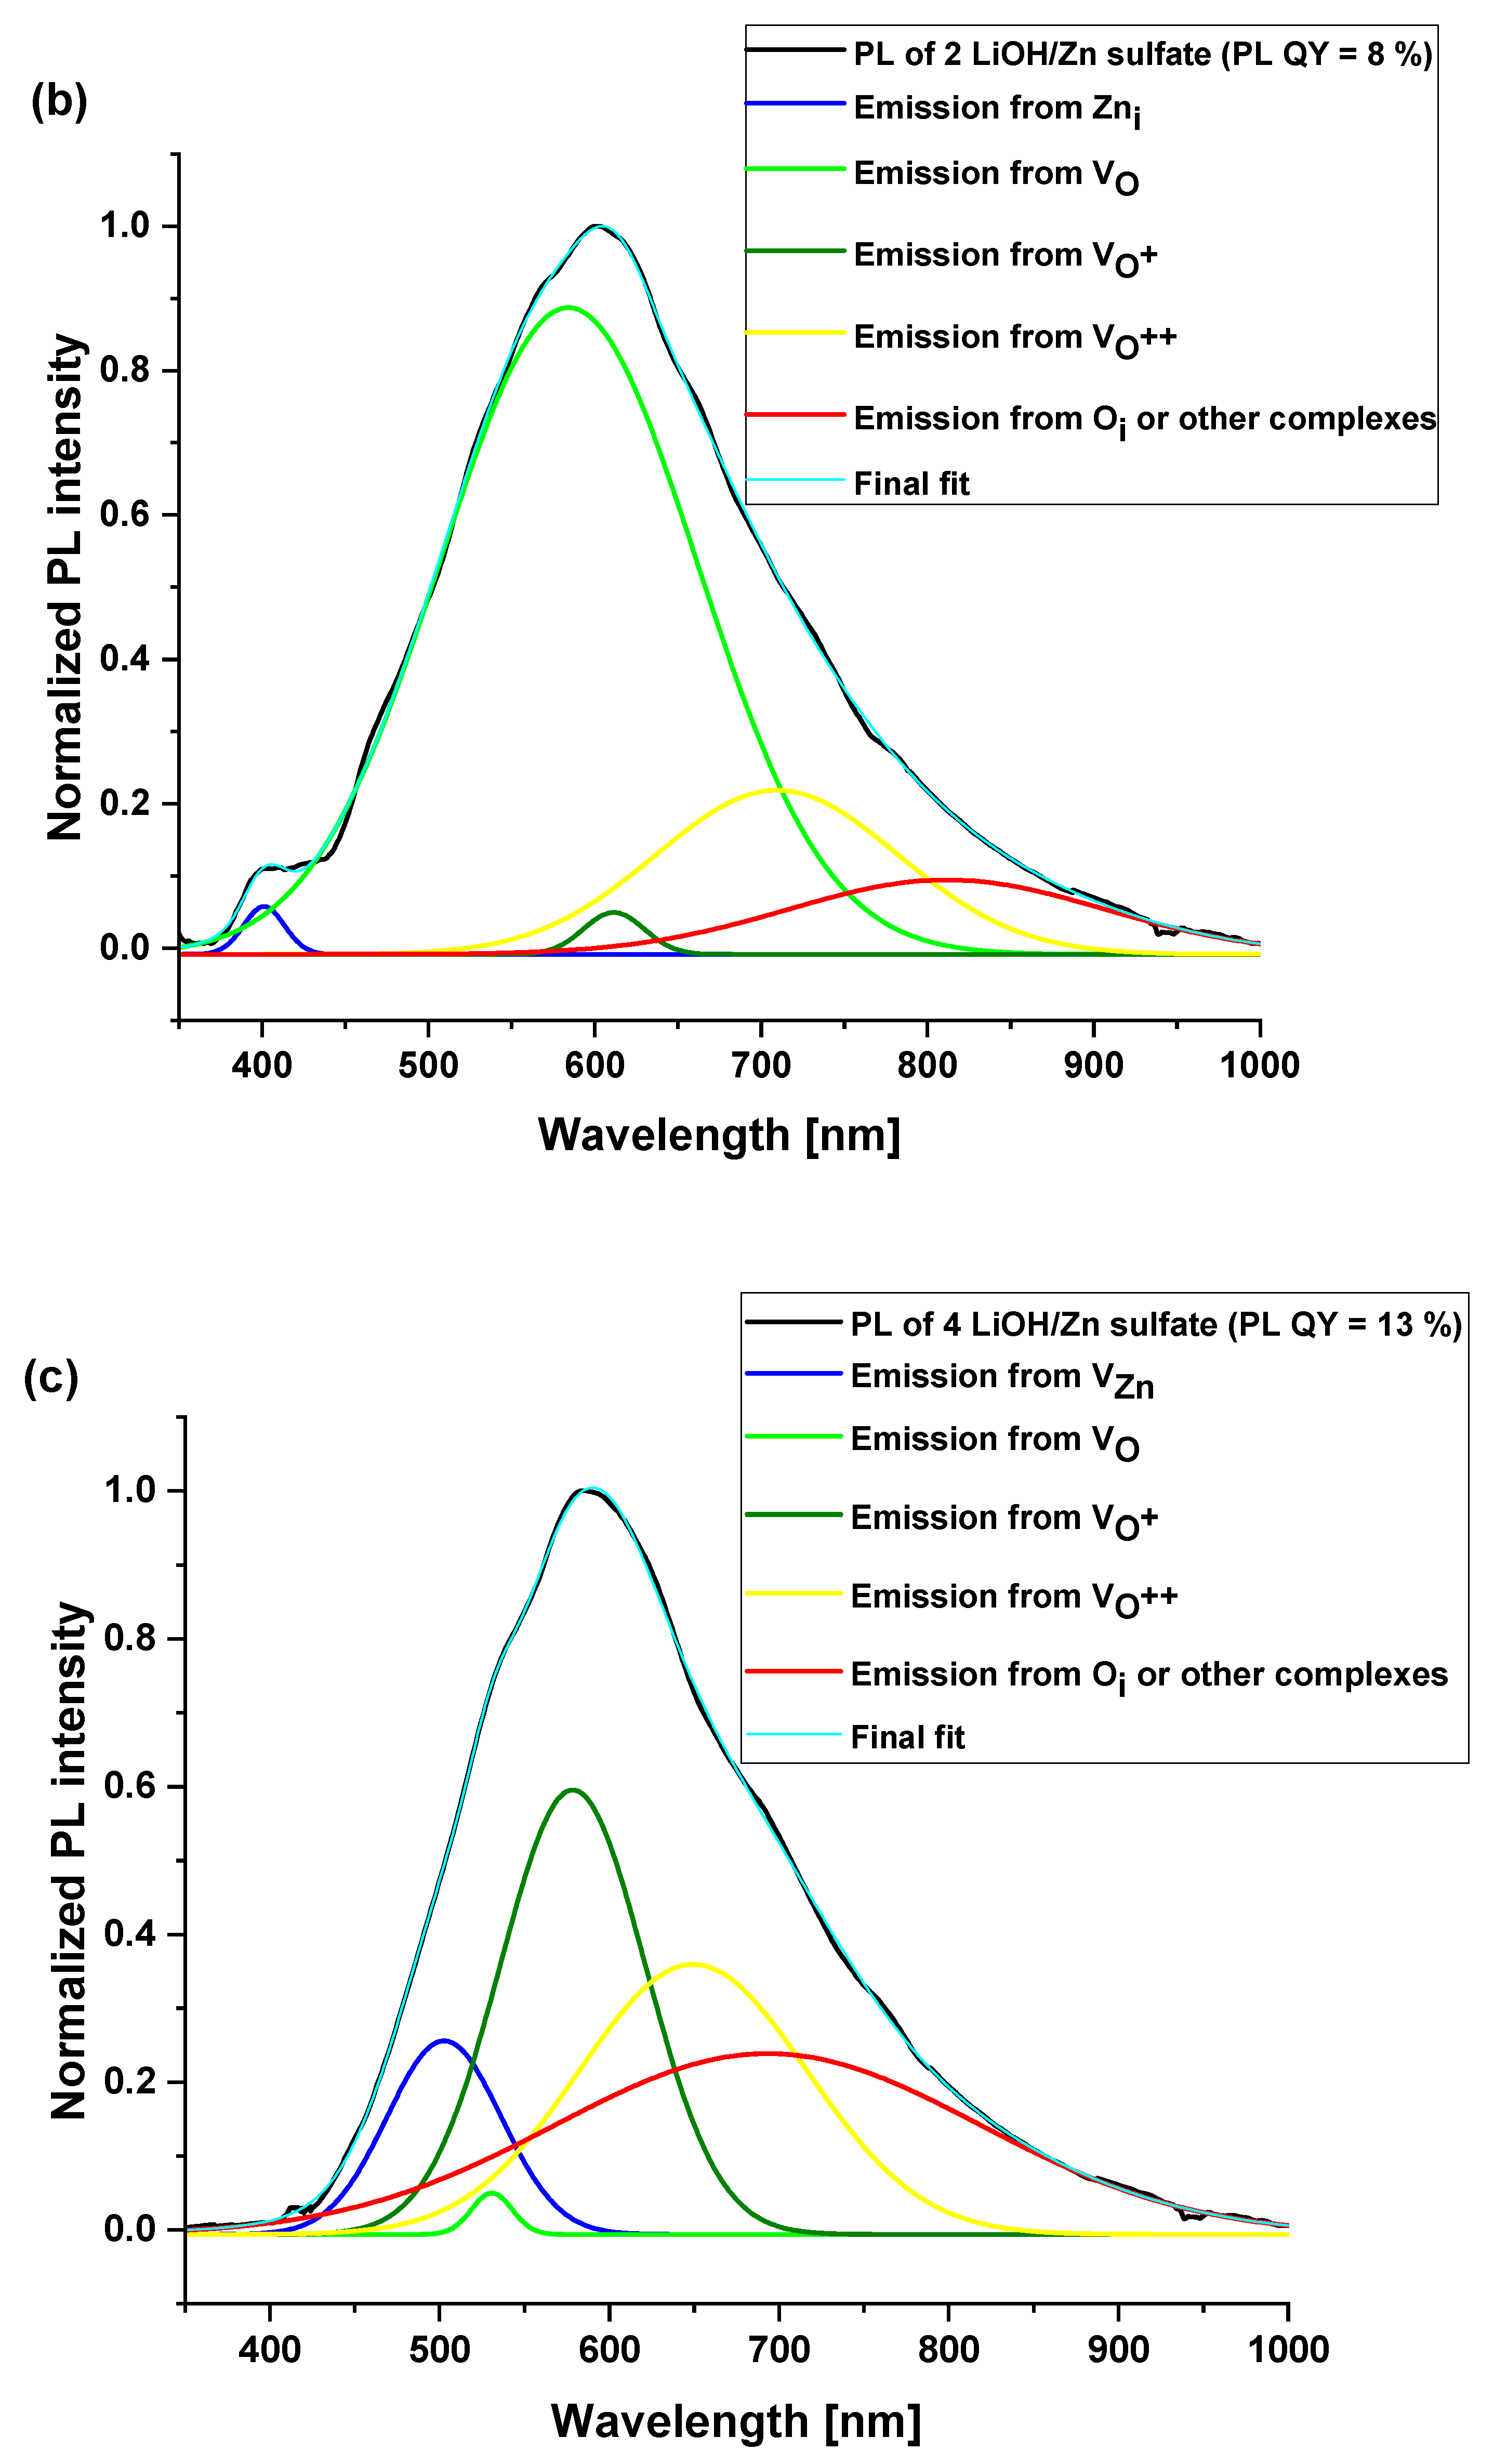
| Sample Synthesis Condition | I1 (nm) | I2 (nm) | I3 (nm) | I4 (nm) | I5 (nm) | PL QY |
|---|---|---|---|---|---|---|
| 4 KOH/ Zn acetate | 371 (0.4) (exciton) and 504 (6) | 556 (25.5) | 625 (43.9) | 719 (12.1) | 783 (12.1) | 3 ± 1% |
| 2 LiOH/ Zn acetate | 465 (2.3) | 510 (1.7) | 567 (31.1) | 632 (32.9) | 714 (32) | 6 ± 1% |
| 4 LiOH/ Zn acetate | 443 (0.4) | 566 (58) | 566 * | 651 (28.2) | 743 (13.4) | 13 ± 1% |
| 4 KOH/ Zn sulfate | 473 (6) | 556 (23.8) | 620 (11.8) | 661 (57.4) | 863 (1) | 6 ± 1% |
| 2 LiOH/ Zn sulfate | 401 (0.8) | 584 (71.4) | 611 (0.8) | 709 (17) | 811 (10) | 8 ± 1% |
| 4 LiOH/Zn sulfate | 502 (9.7) | 530 (1) | 578 (28.4) | 649 (27.2) | 693 (33.7) | 13 ± 1% |
Disclaimer/Publisher’s Note: The statements, opinions and data contained in all publications are solely those of the individual author(s) and contributor(s) and not of MDPI and/or the editor(s). MDPI and/or the editor(s) disclaim responsibility for any injury to people or property resulting from any ideas, methods, instructions or products referred to in the content. |
© 2023 by the authors. Licensee MDPI, Basel, Switzerland. This article is an open access article distributed under the terms and conditions of the Creative Commons Attribution (CC BY) license (https://creativecommons.org/licenses/by/4.0/).
Share and Cite
Apostoluk, A.; Zhu, Y.; Gautier, P.; Valette, A.; Bluet, J.-M.; Cornier, T.; Masenelli, B.; Daniele, S. Improved Visible Emission from ZnO Nanoparticles Synthesized via the Co-Precipitation Method. Materials 2023, 16, 5400. https://doi.org/10.3390/ma16155400
Apostoluk A, Zhu Y, Gautier P, Valette A, Bluet J-M, Cornier T, Masenelli B, Daniele S. Improved Visible Emission from ZnO Nanoparticles Synthesized via the Co-Precipitation Method. Materials. 2023; 16(15):5400. https://doi.org/10.3390/ma16155400
Chicago/Turabian StyleApostoluk, Alexandra, Yao Zhu, Pierrick Gautier, Audrey Valette, Jean-Marie Bluet, Thibaut Cornier, Bruno Masenelli, and Stephane Daniele. 2023. "Improved Visible Emission from ZnO Nanoparticles Synthesized via the Co-Precipitation Method" Materials 16, no. 15: 5400. https://doi.org/10.3390/ma16155400