
Corrosion-Fatigue Performance of 3D-Printed (L-PBF) AlSi10Mg


Abstract
:1. Introduction
2. Materials and Methods
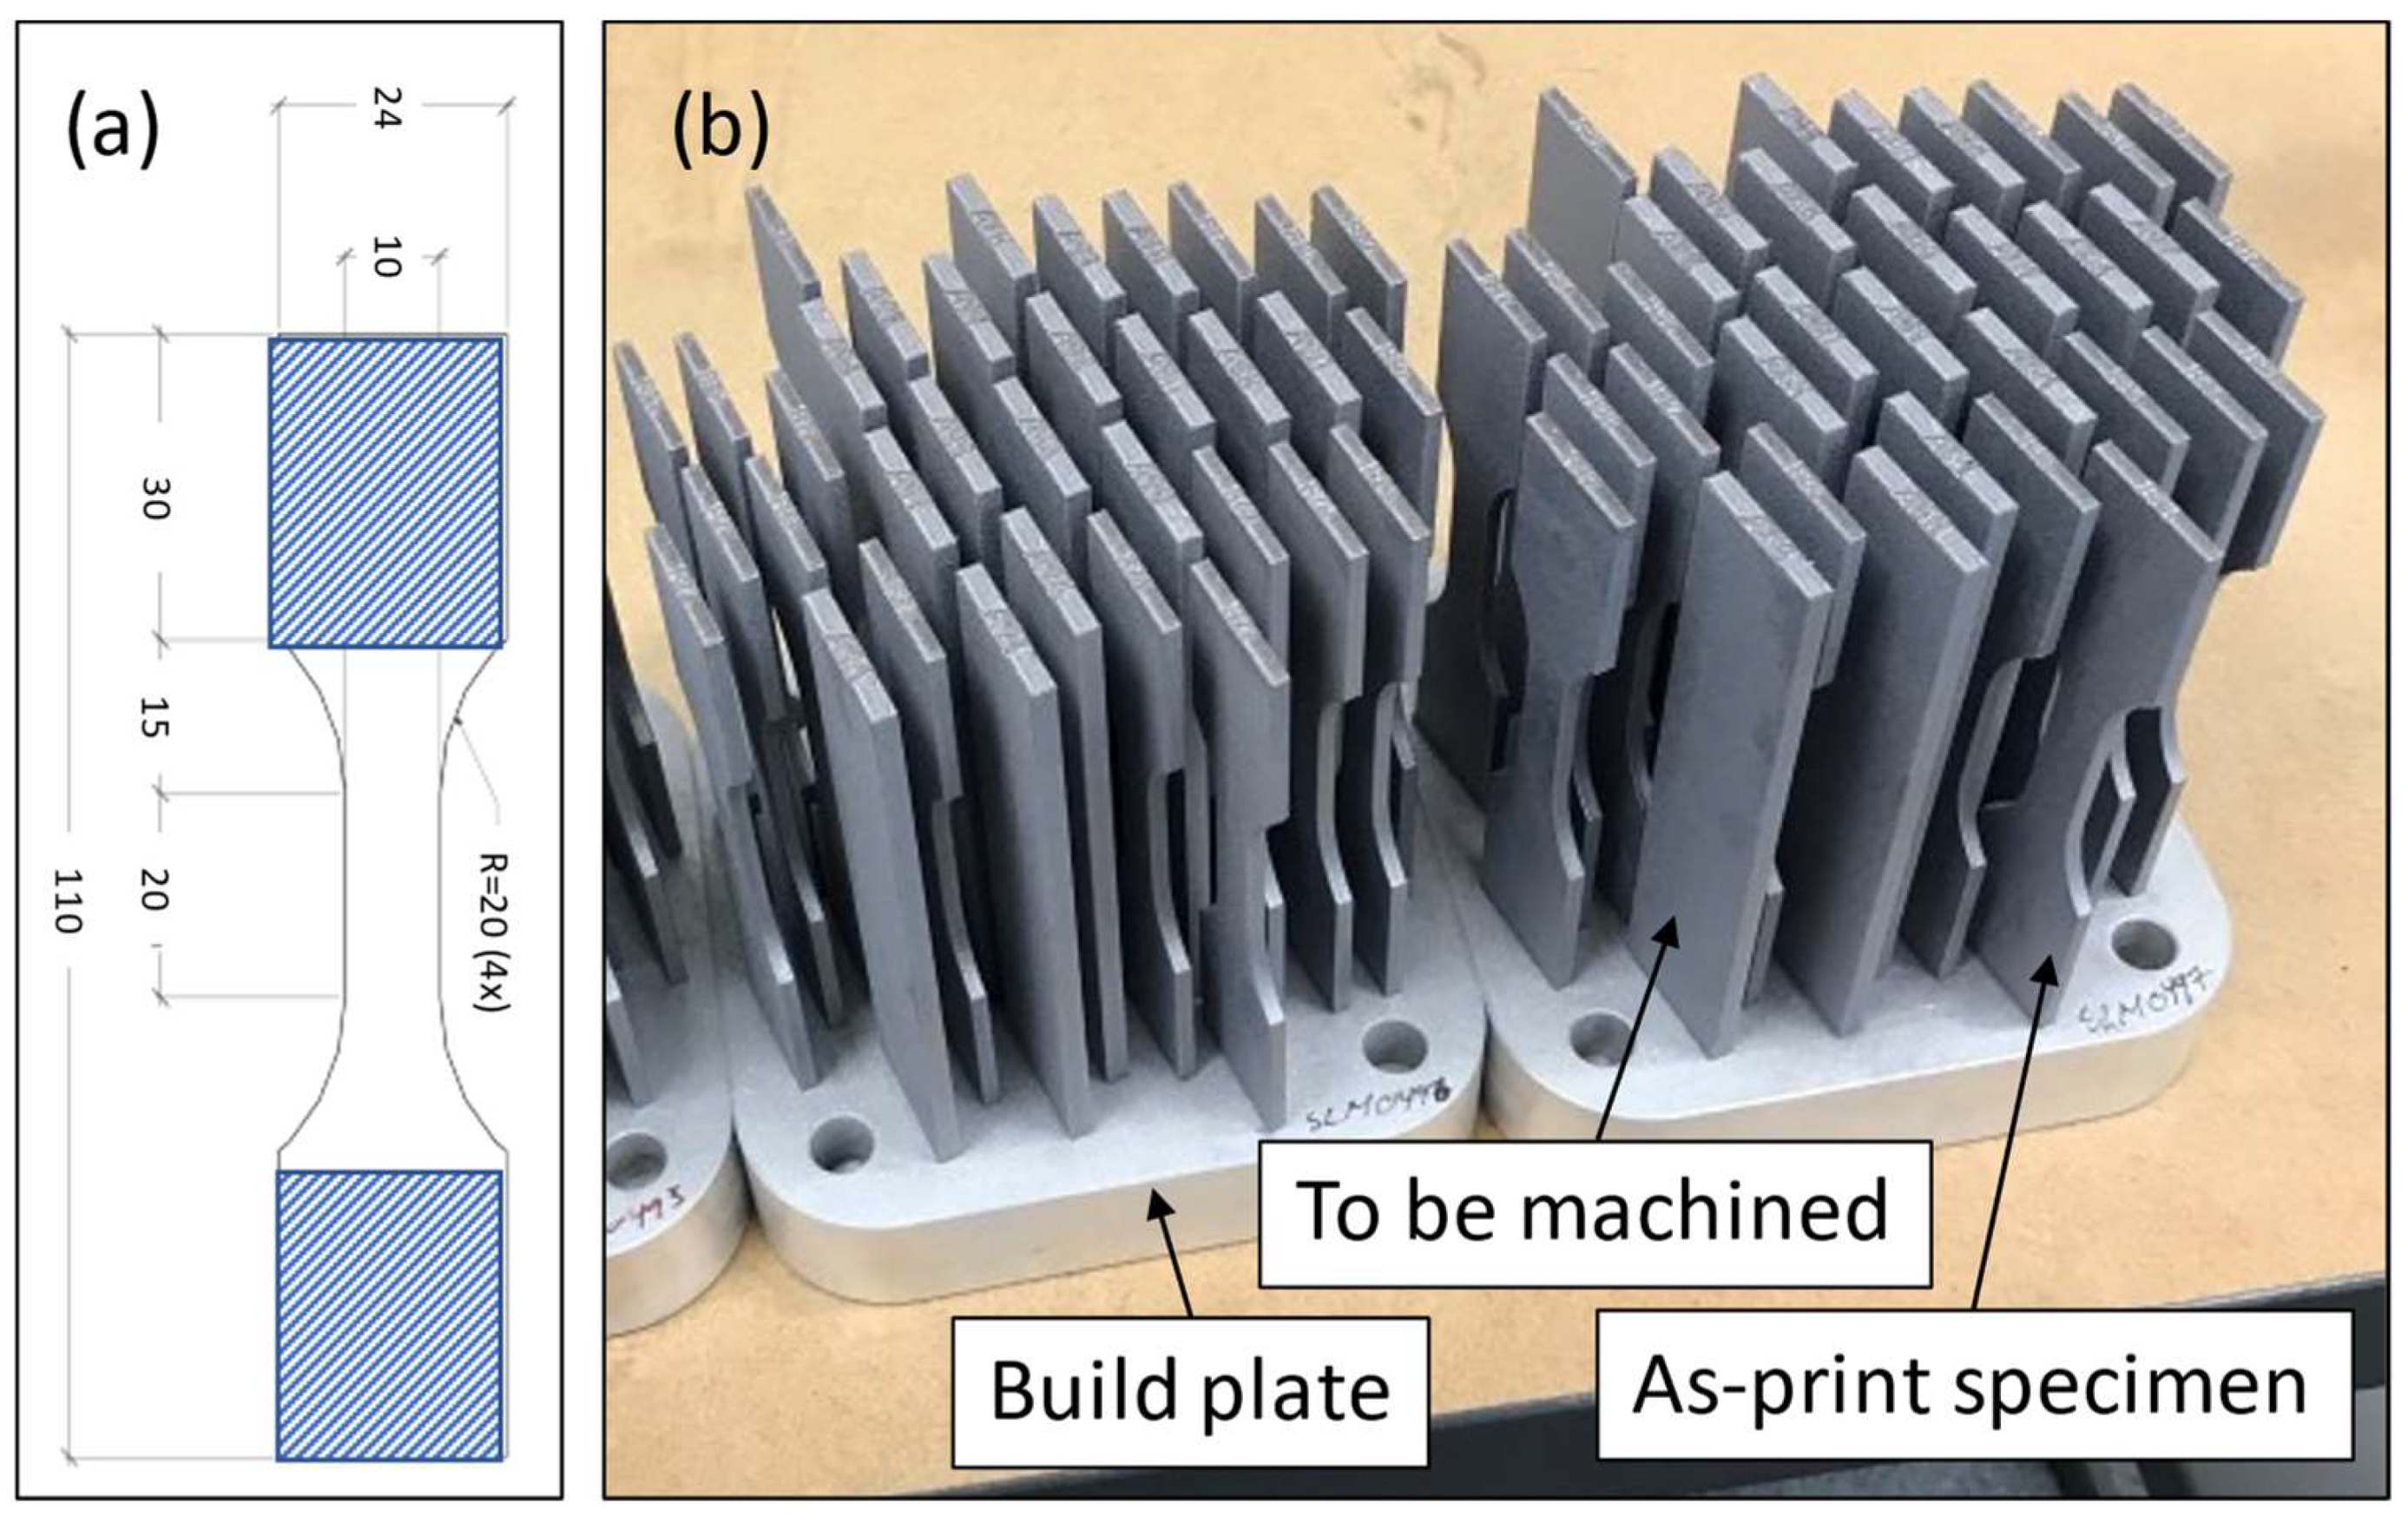
2.1. Printing Process
2.2. Material Characterisation
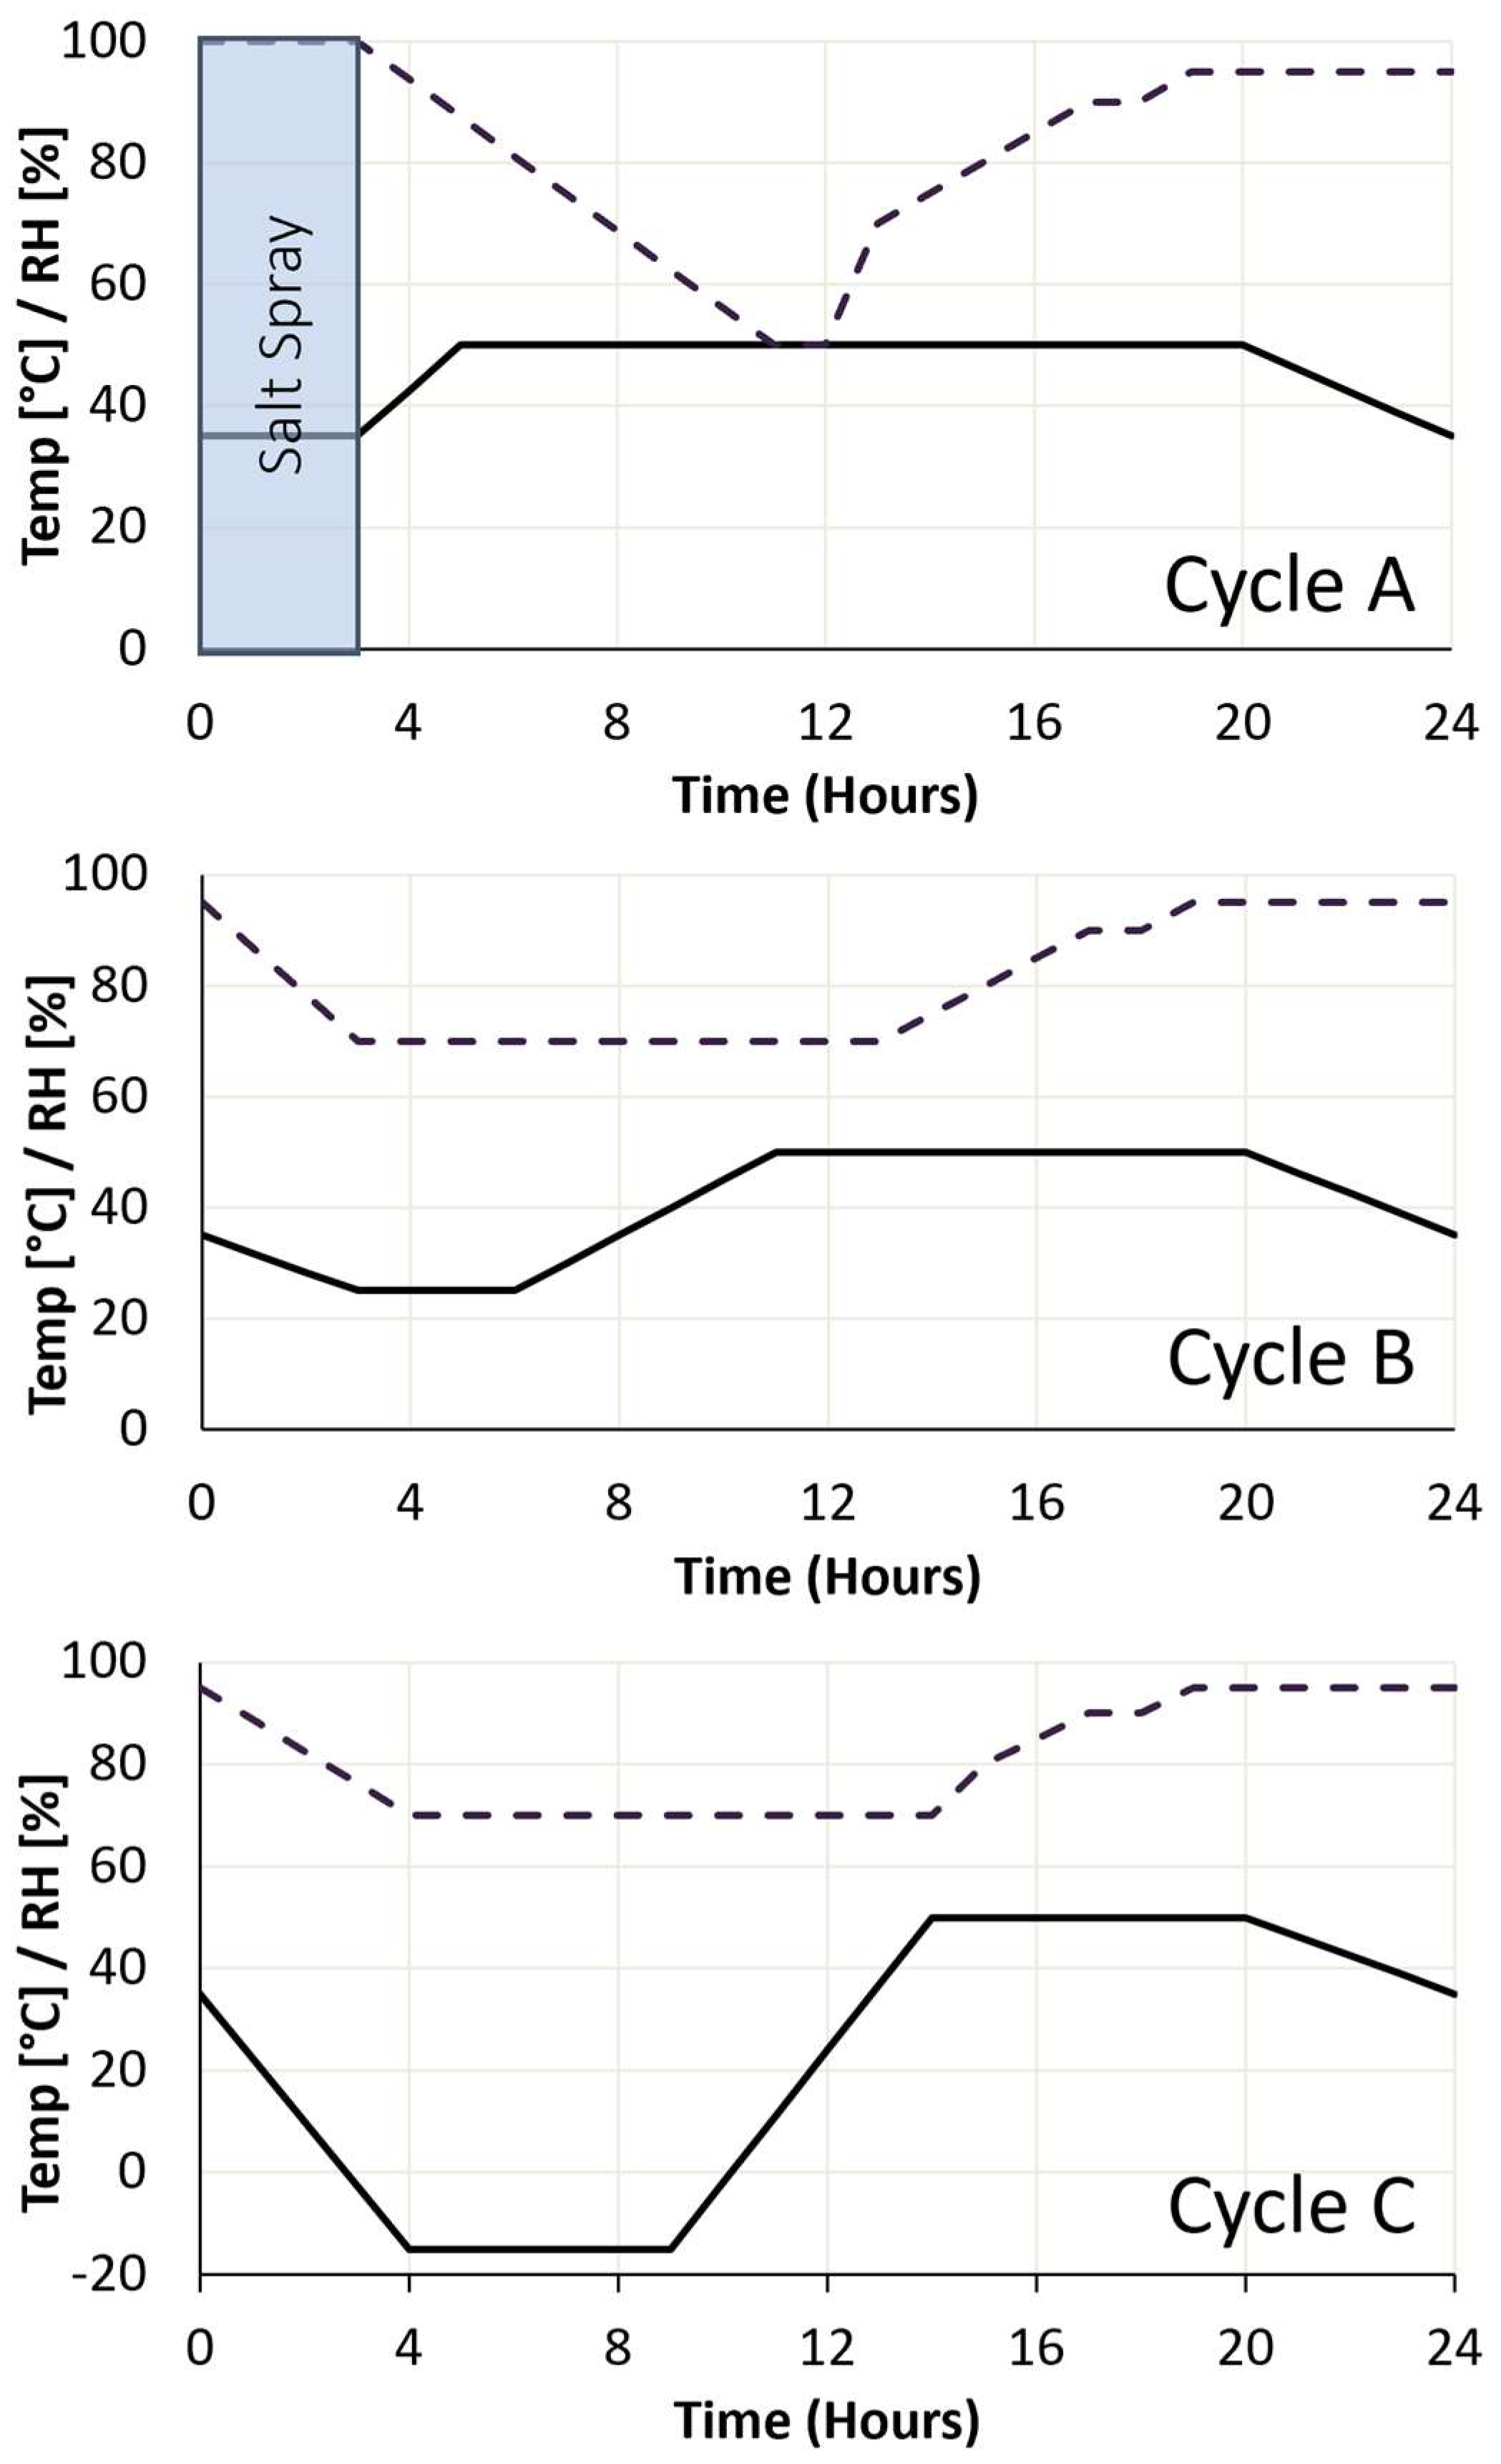
2.3. Atmospheric Corrosion Testing
2.4. Fatigue Testing
3. Results and Discussion
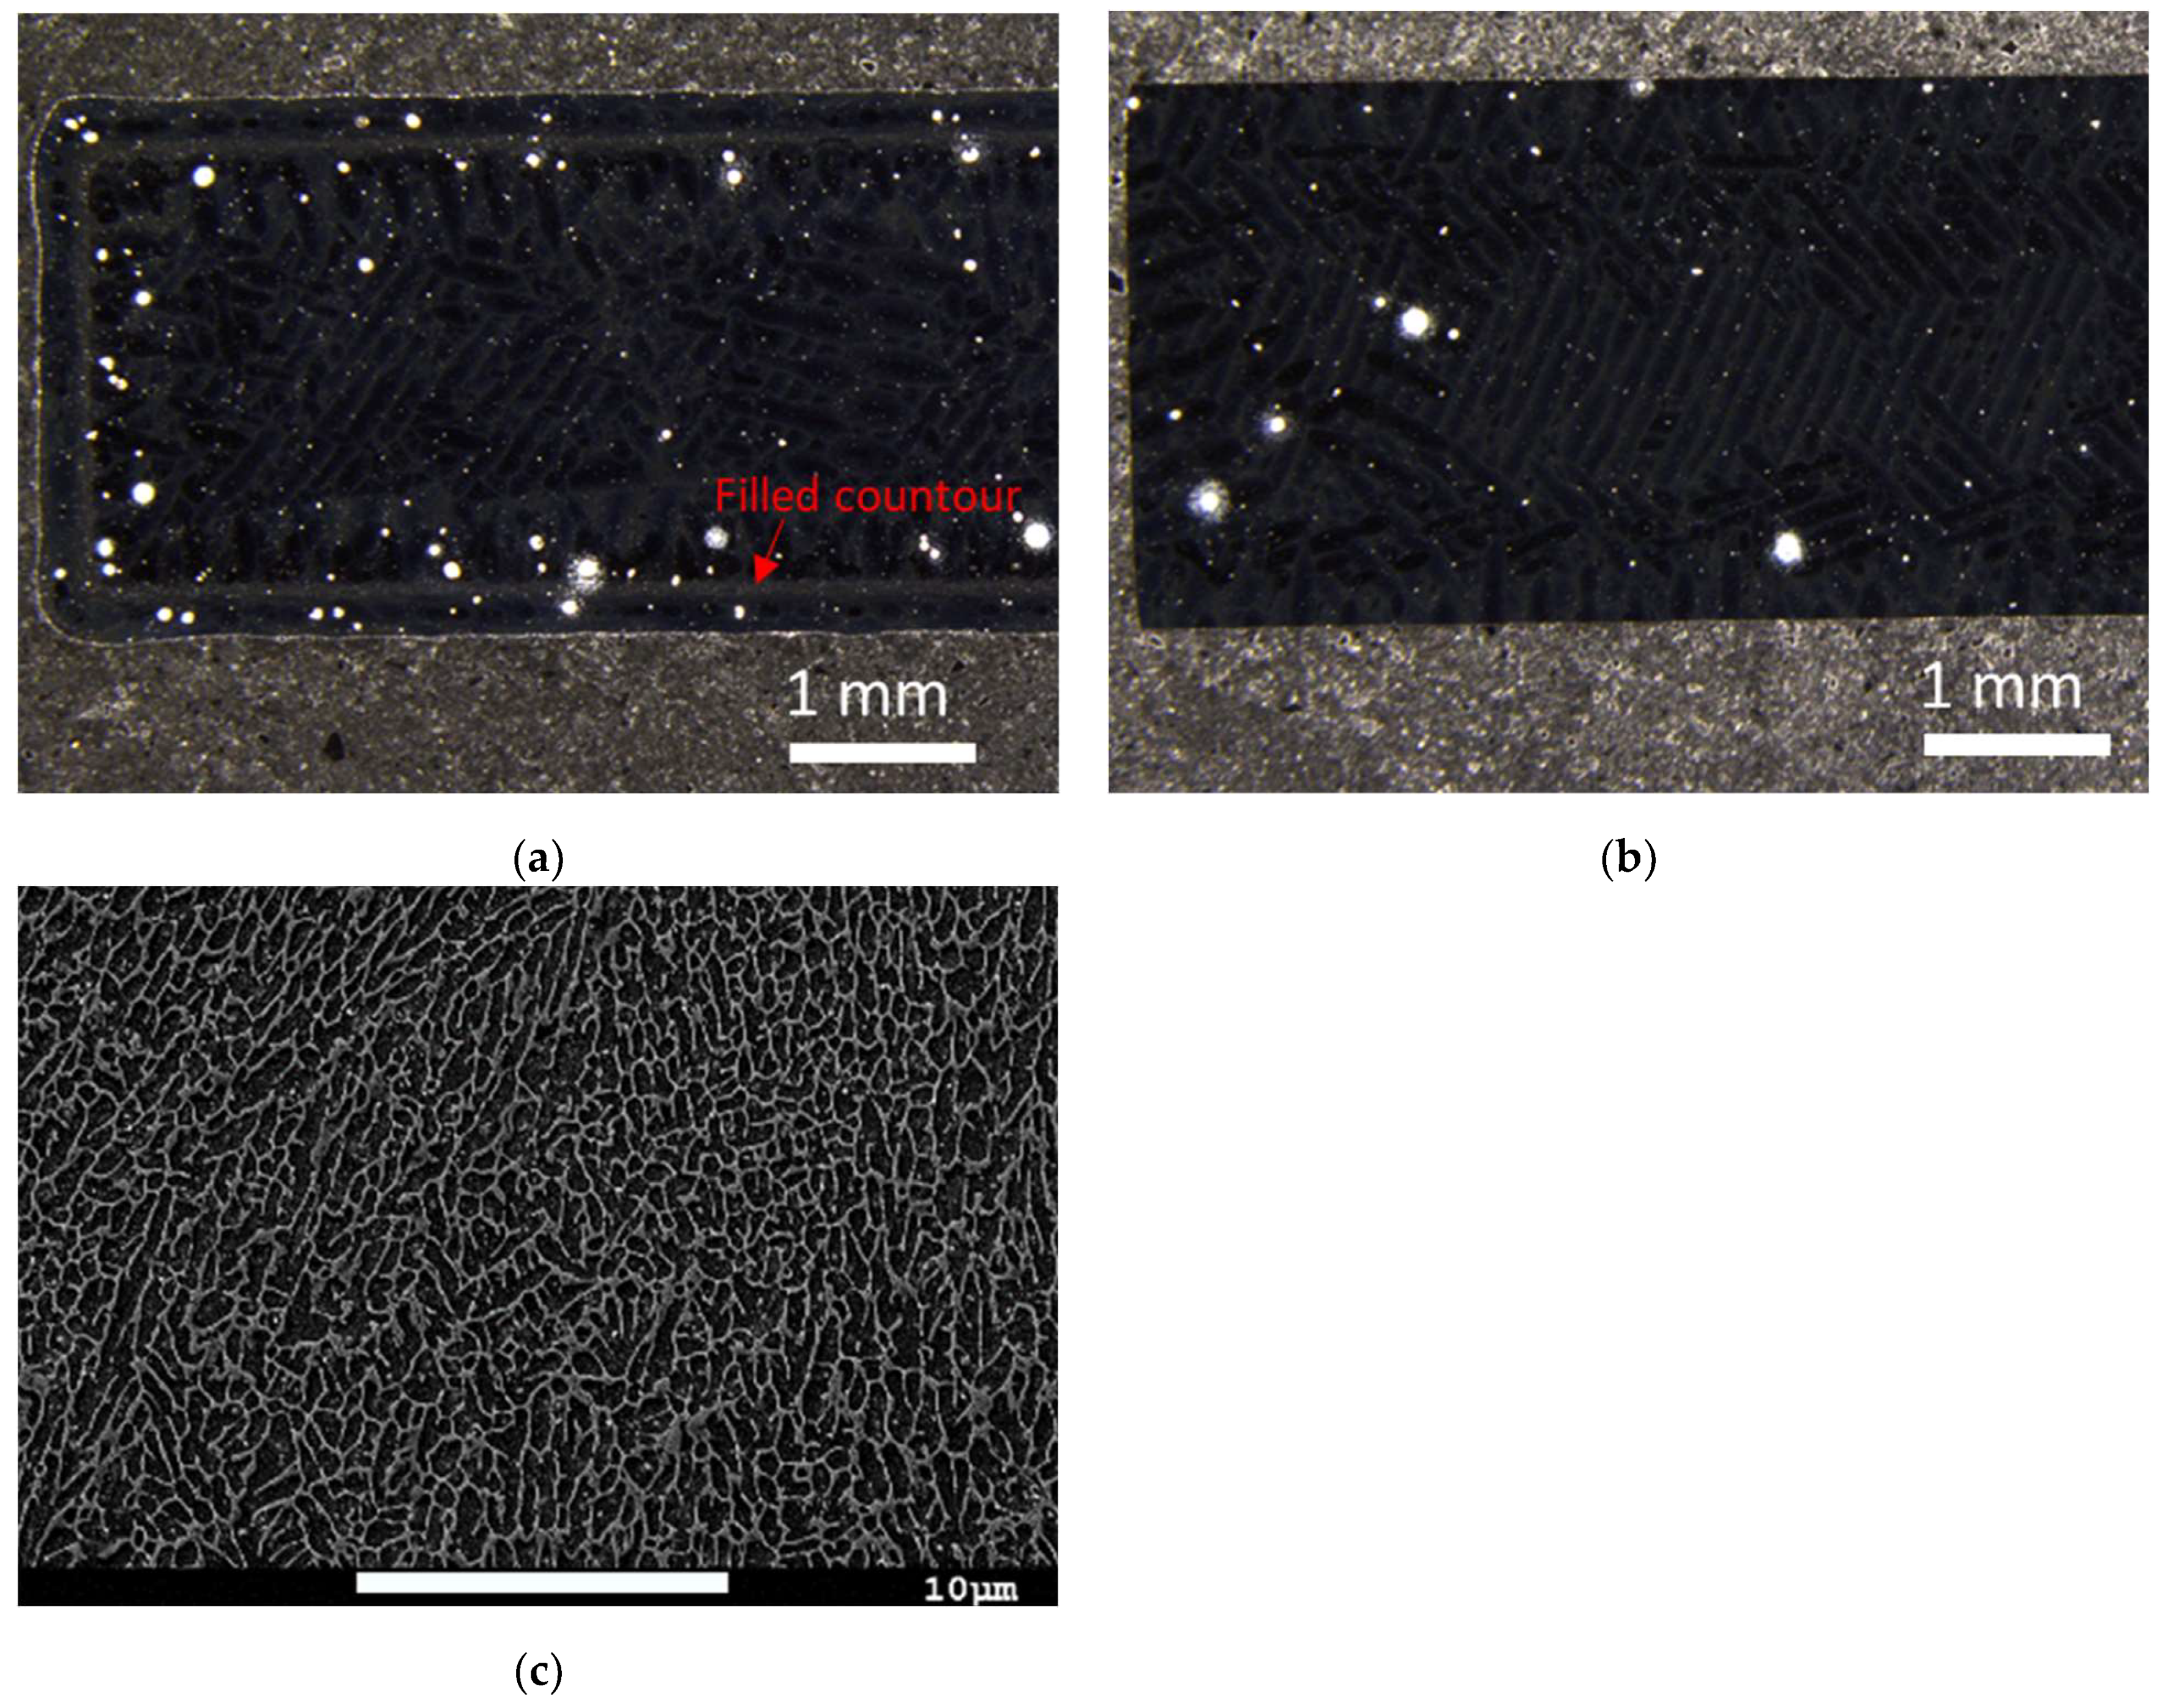
3.1. Material Characterisation
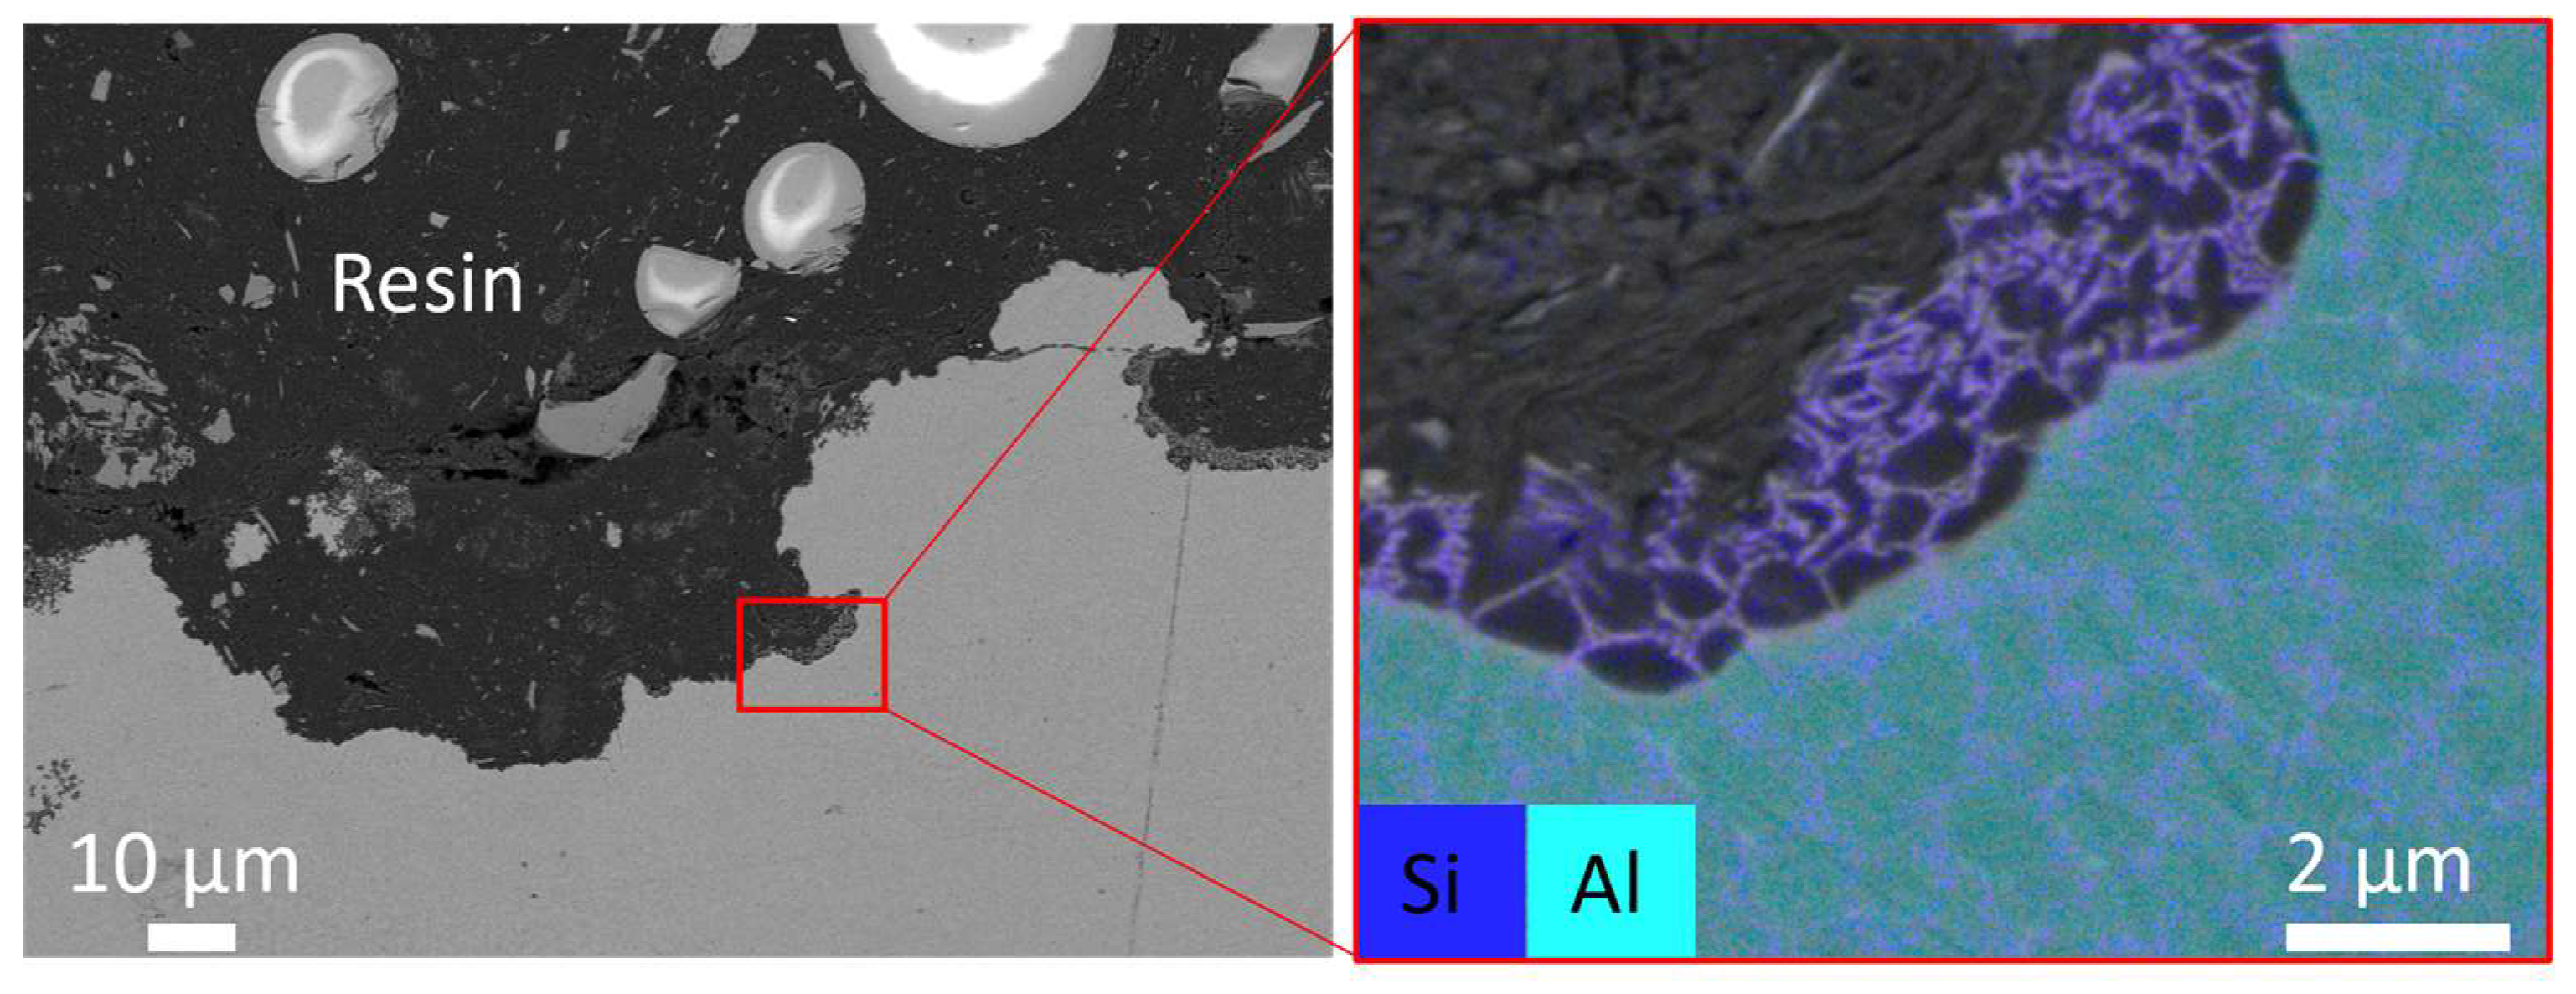
3.2. Corrosion Testing
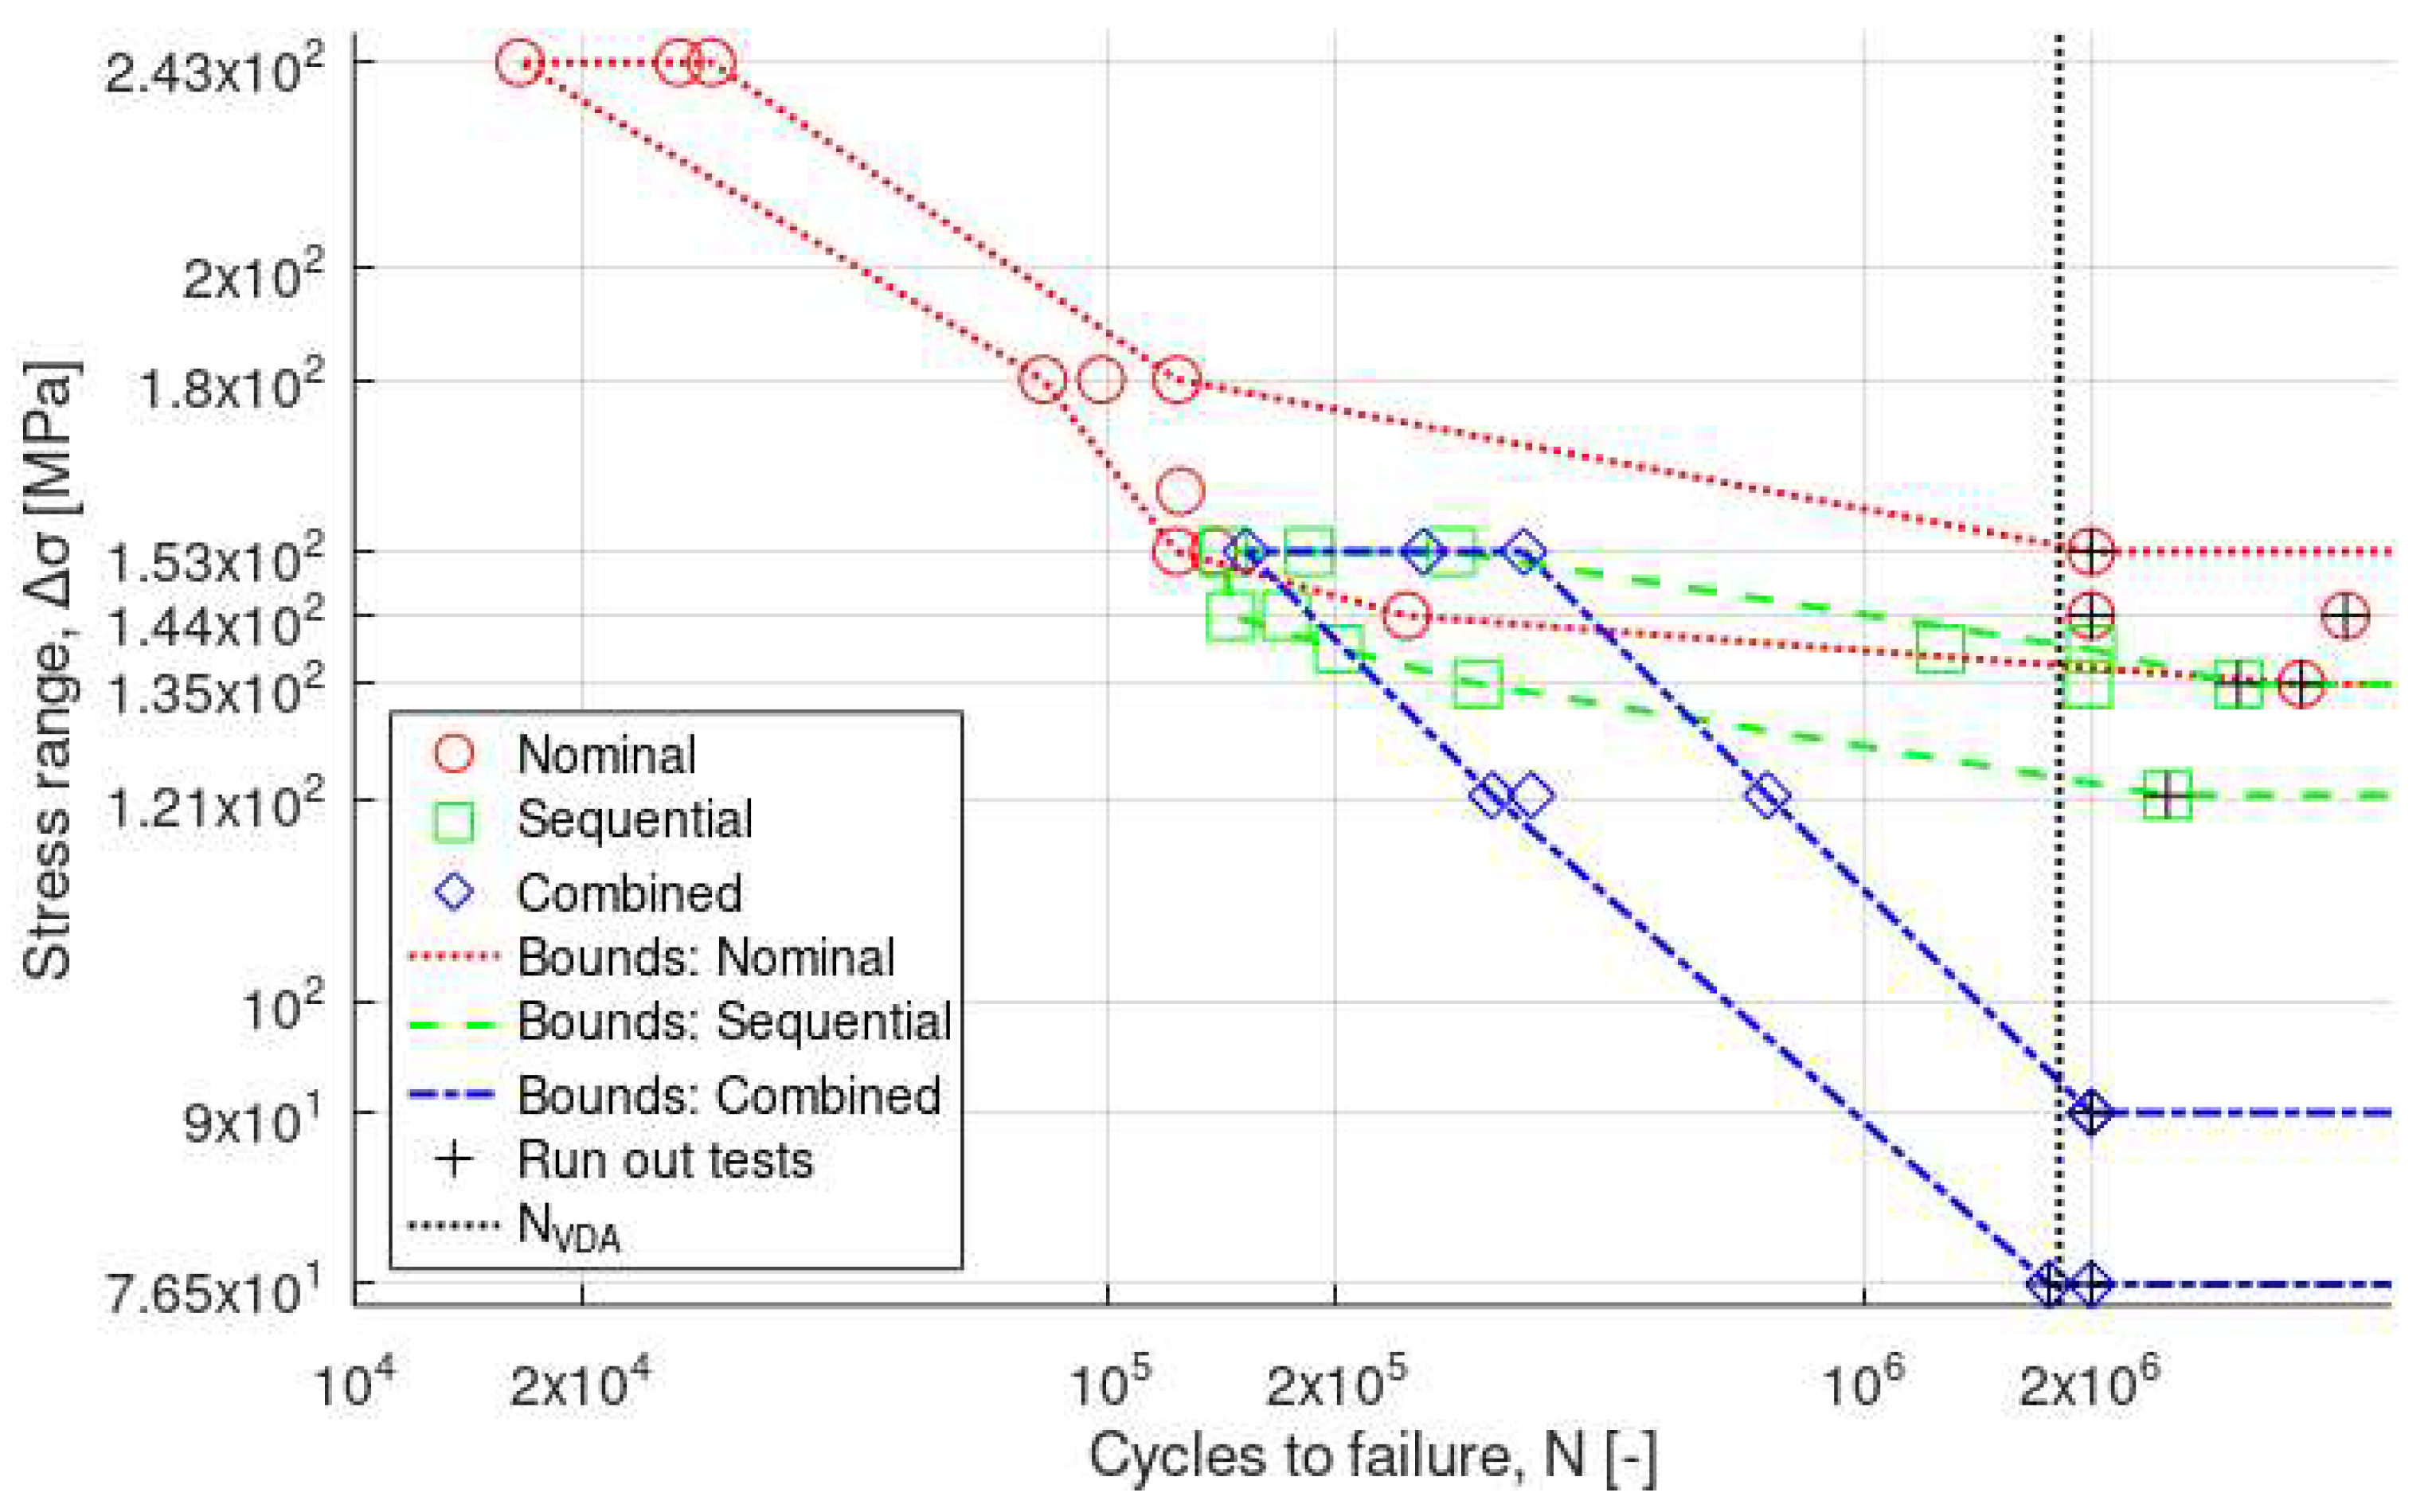
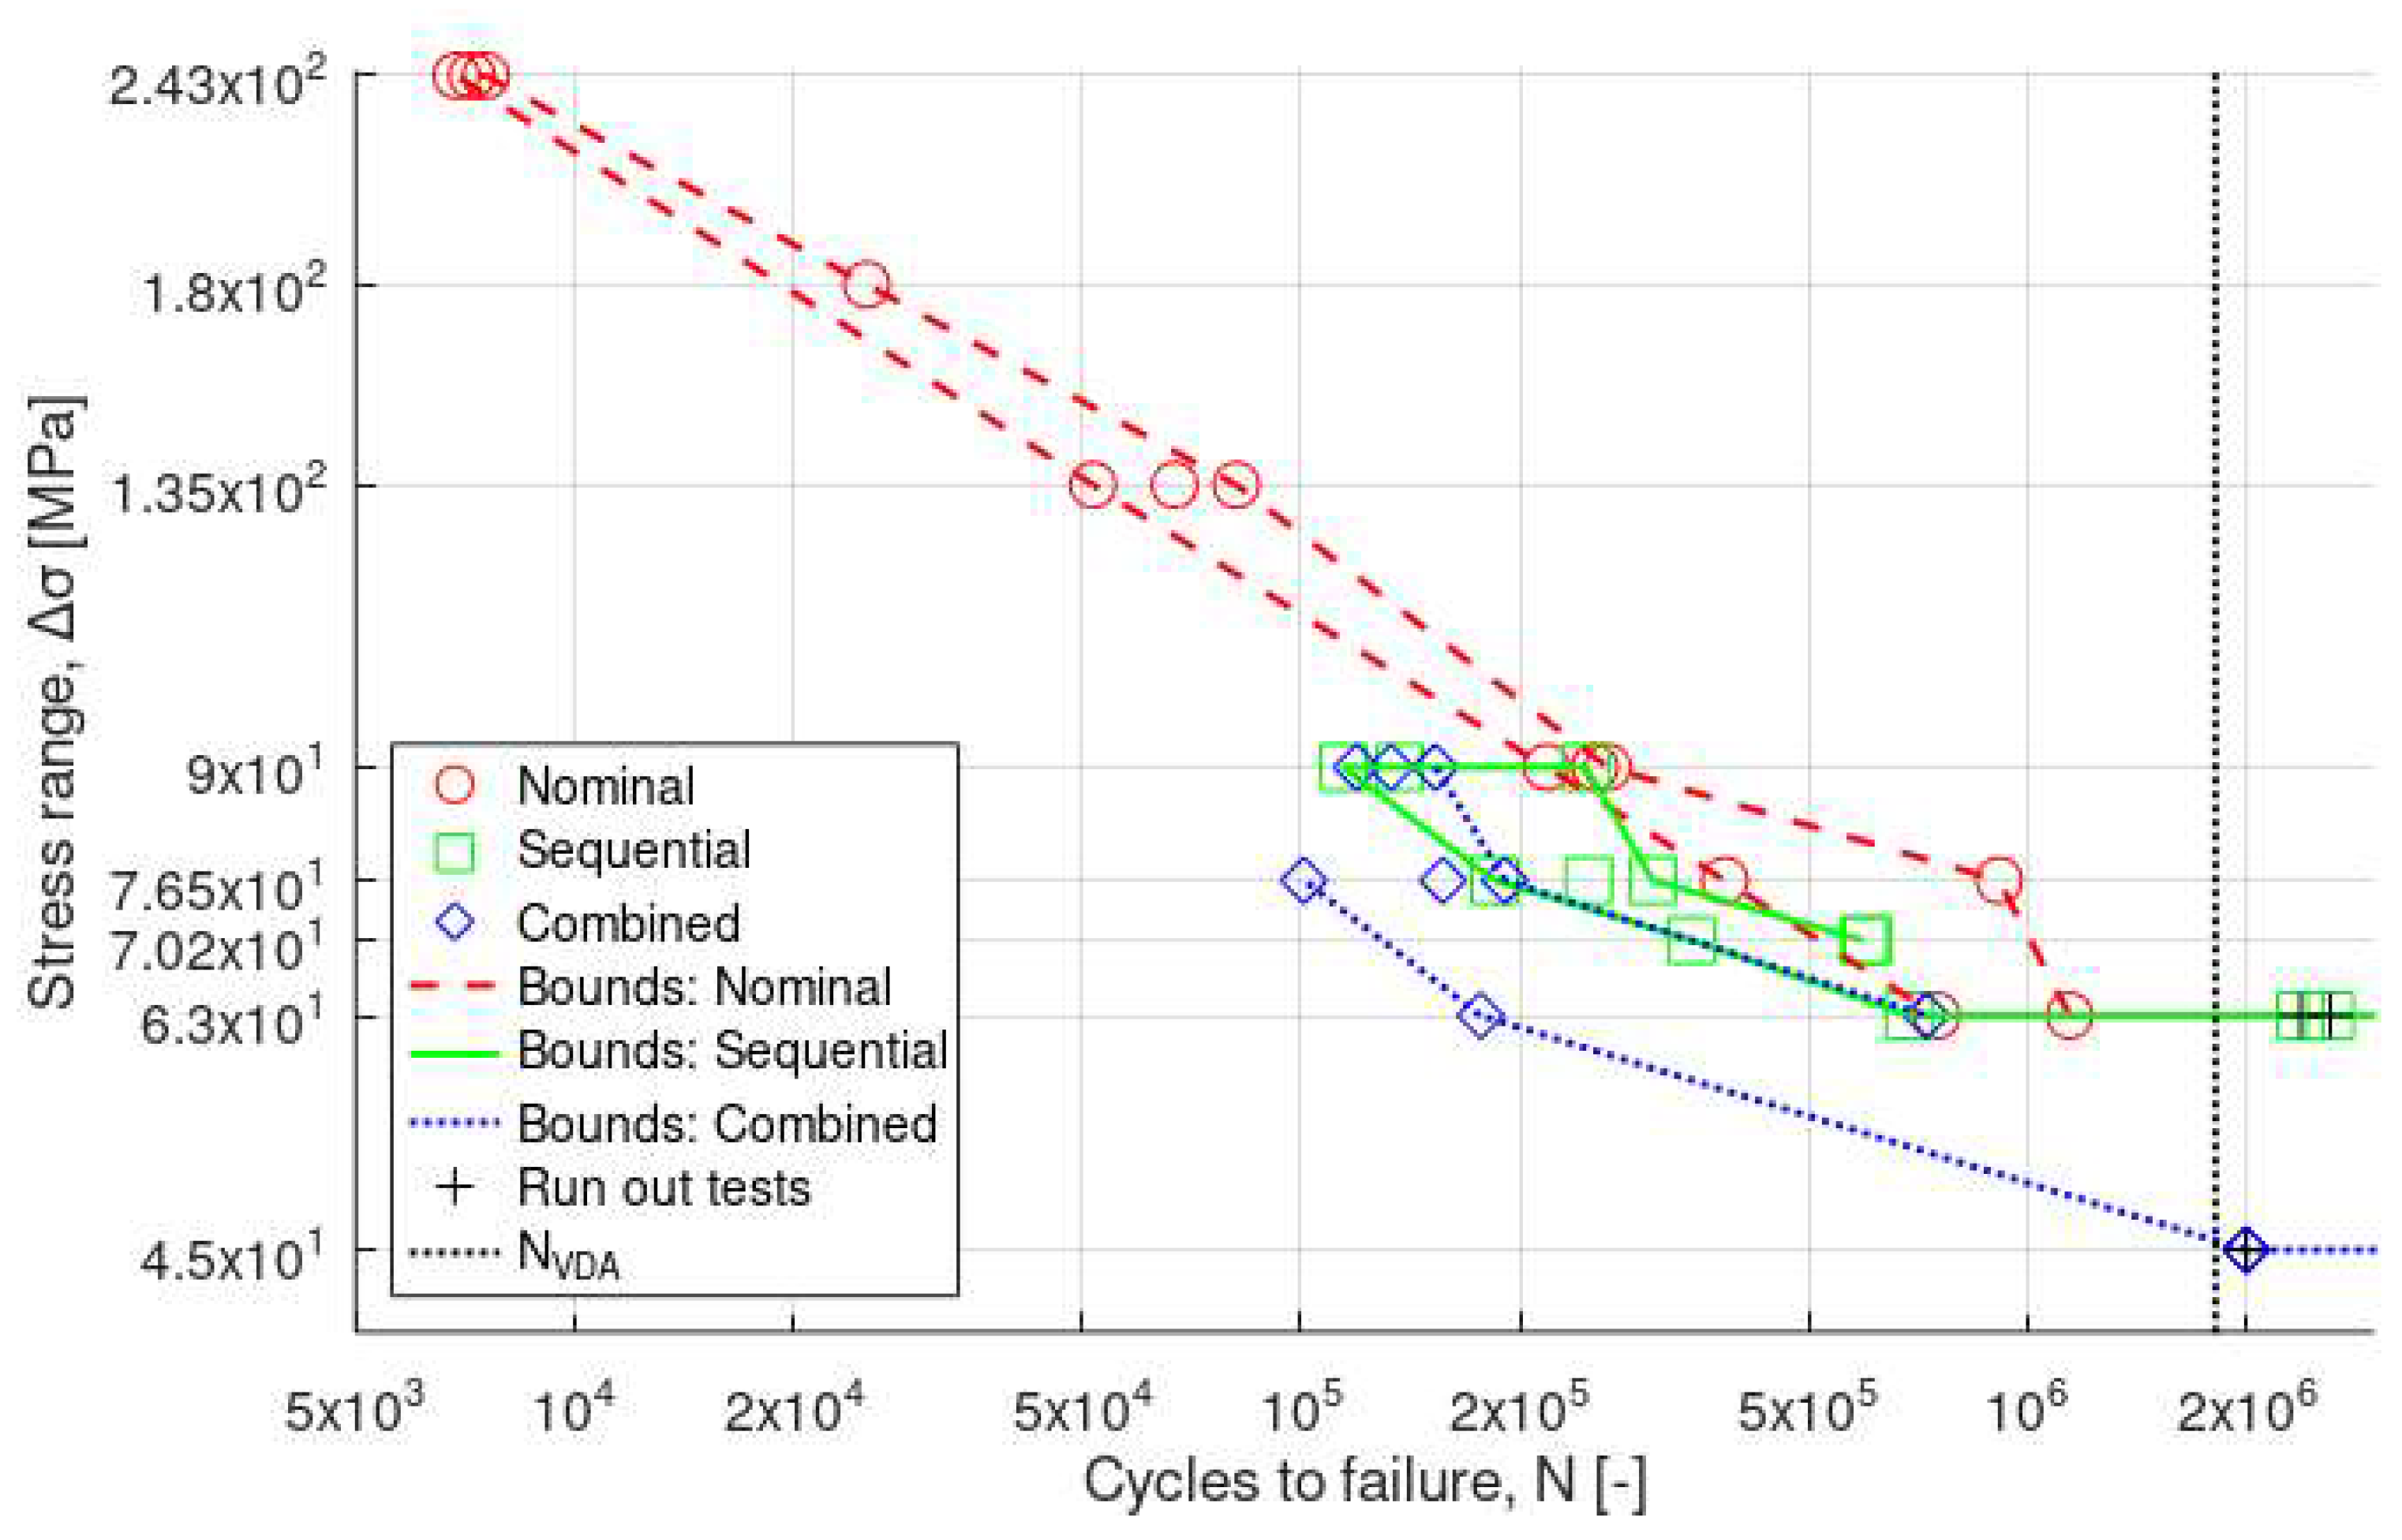
3.3. Fatigue
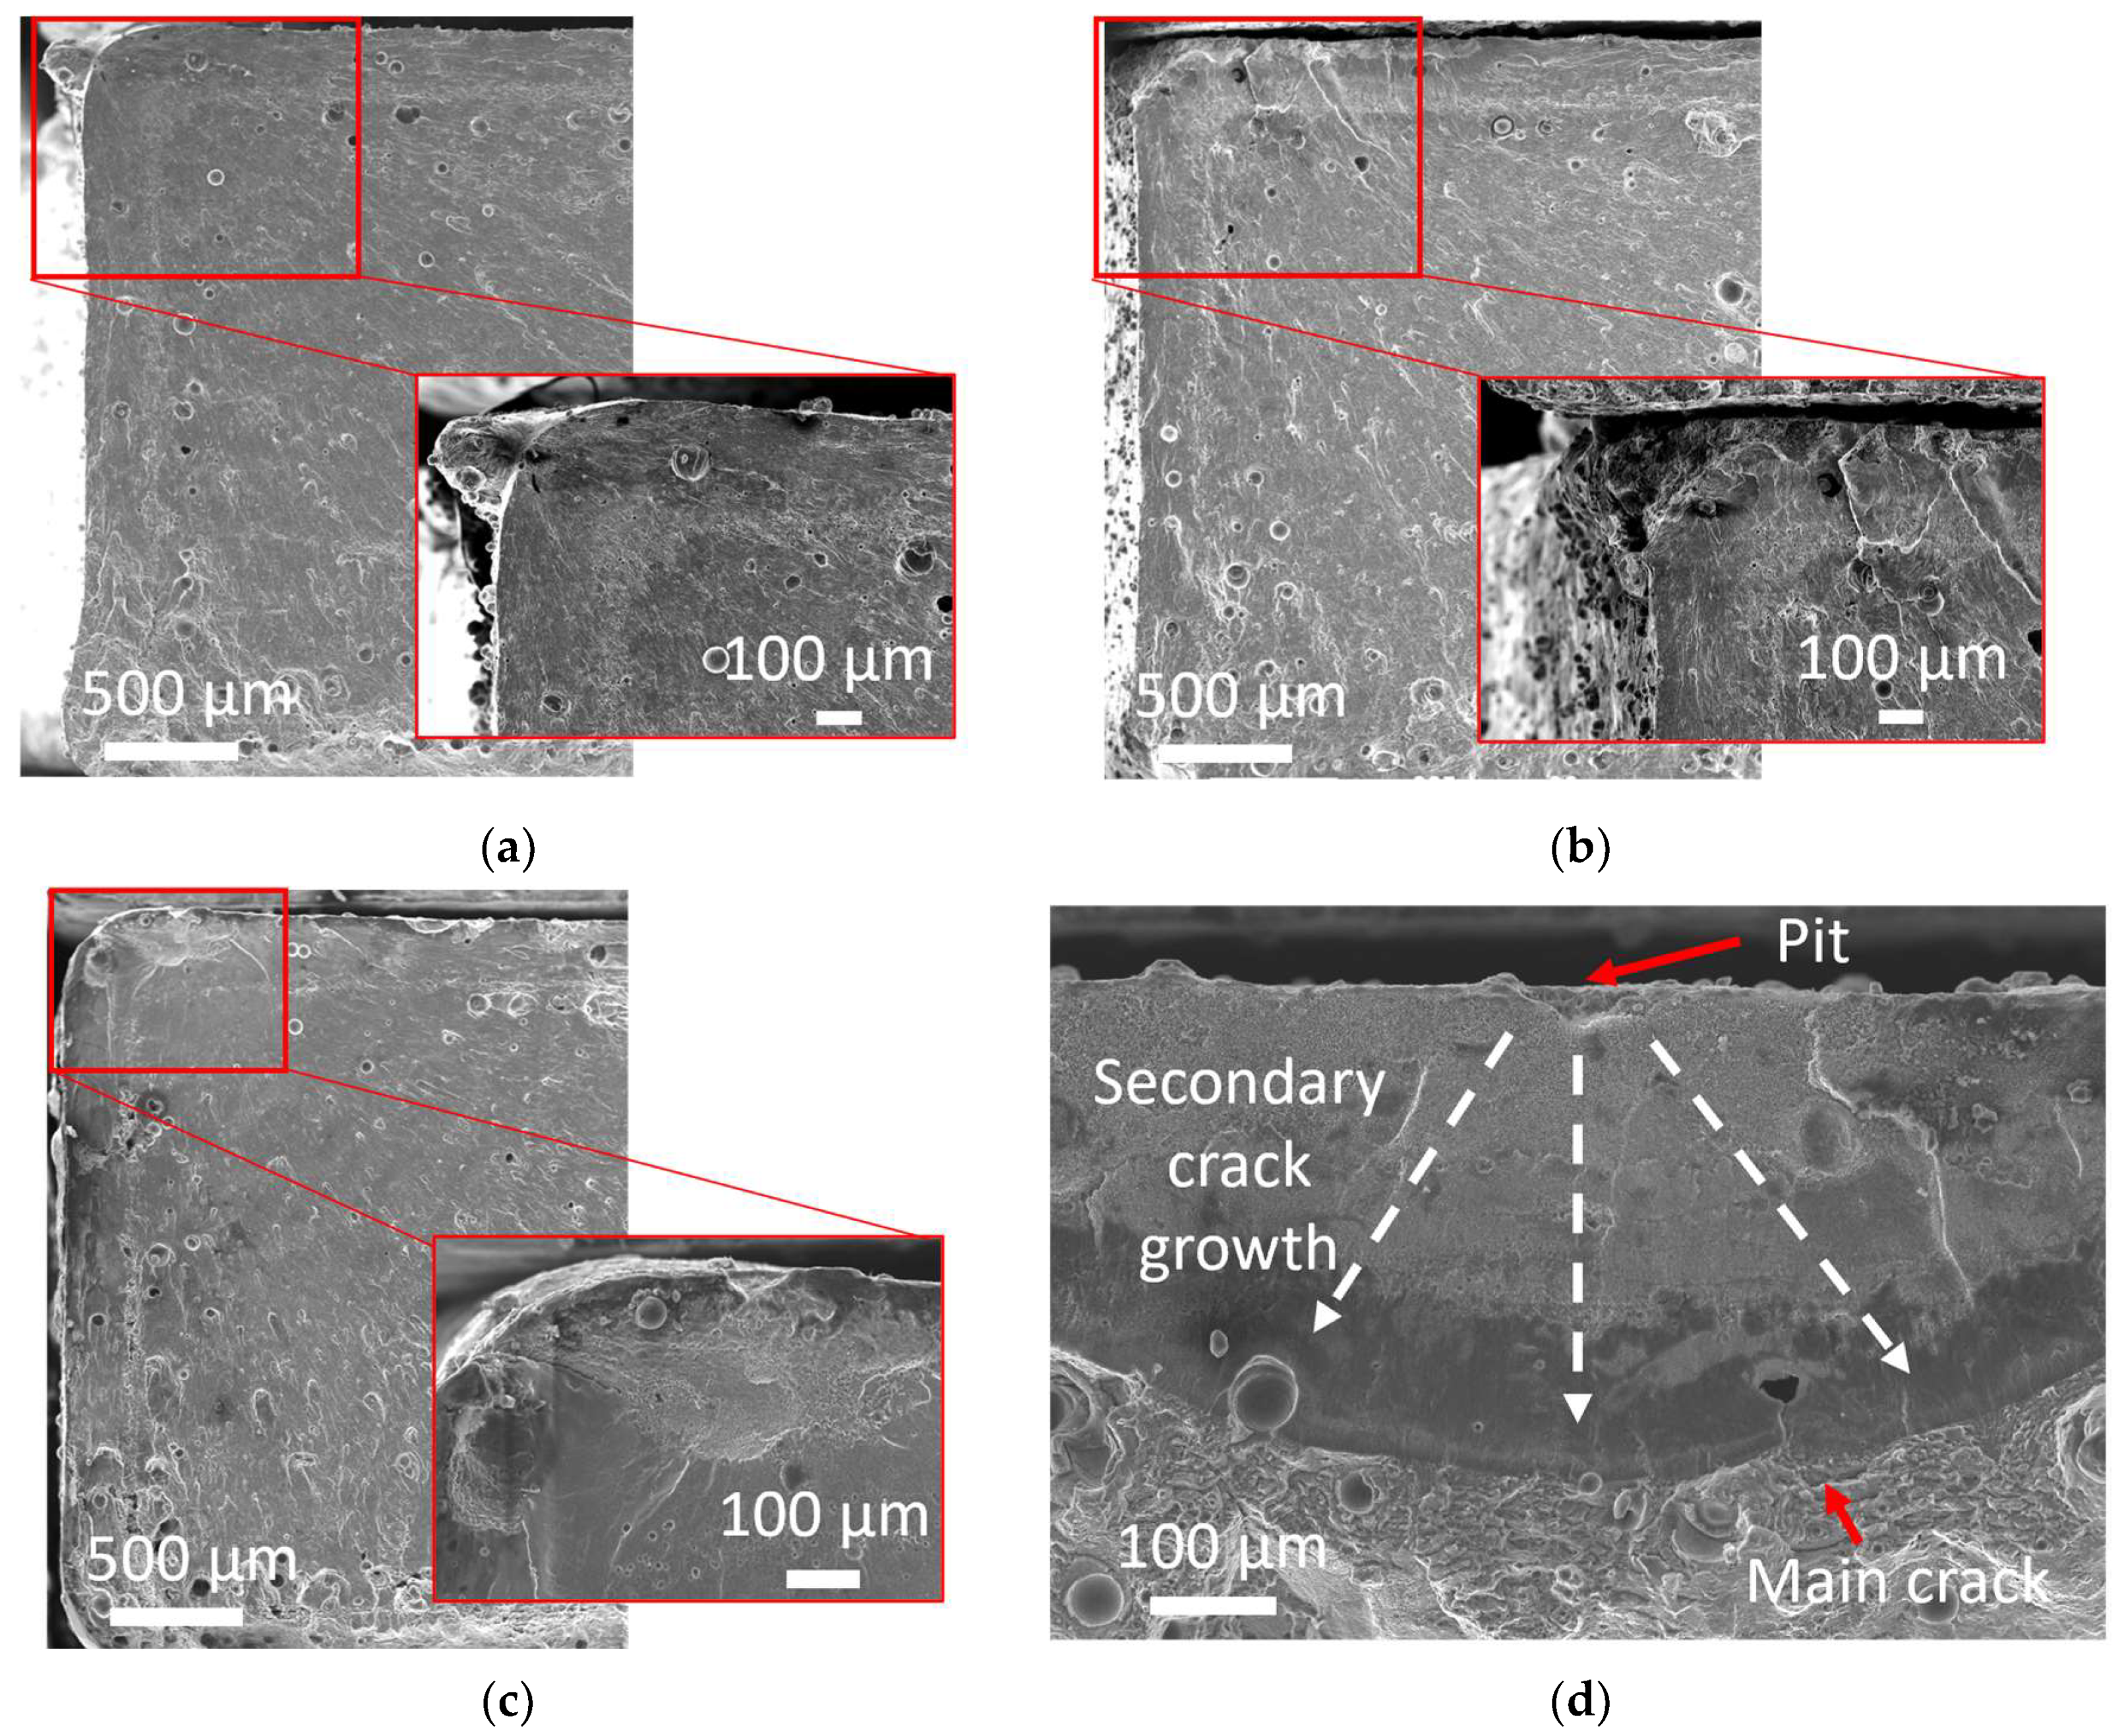
3.4. Fractography
4. Conclusions
- Machining specimens removed defect-rich layers such as porosity and partially melted powder and reduced the surface roughness. Machined specimens had considerably higher fatigue performance than as-printed specimens, regardless of loading sequence;
- The pit depth was lowest for machined specimens; thus, the effect of corrosion on fatigue was not as significant as for as-printed specimens;
- Differences between the loading sequences were evident, i.e., the fatigue performance was reduced when changing from nominal to sequential to combined sequence for both as-printed and machined specimens;
- All specimens had their main fatigue crack initiated at the corners of the specimens, where porosities and stress from AM process were concentrated;
- For sequential and combined testing, the crack was initiated in corrosion pits close to the corners of specimens;
- Evidence of a fatigue-corrosion mechanism was found for the as-printed specimens, even though the corrosion pits were narrow.
Author Contributions
Funding
Institutional Review Board Statement
Informed Consent Statement
Data Availability Statement
Acknowledgments
Conflicts of Interest
Appendix A
References
- Kawajiri, K.; Kobayashi, M.; Sakamoto, K. Lightweight Materials Equal Lightweight Greenhouse Gas Emissions?: A Historical Analysis of Greenhouse Gases of Vehicle Material Substitution. J. Clean. Prod. 2020, 253, 119805. [Google Scholar] [CrossRef]
- Herrmann, C.; Dewulf, W.; Hauschild, M.; Kaluza, A.; Kara, S.; Skerlos, S. Life Cycle Engineering of Lightweight Structures. CIRP Ann. 2018, 67, 651–672. [Google Scholar] [CrossRef]
- Kim, H.C.; Wallington, T.J. Life-Cycle Energy and Greenhouse Gas Emission Benefits of Lightweighting in Automobiles: Review and Harmonization. Environ. Sci. Technol. 2013, 47, 6089–6097. [Google Scholar] [CrossRef] [PubMed]
- Duckerfrontier. Aluminum Content in European Passsenger Cars; European Aluminium: Etterbeek, Belgium, 2019. [Google Scholar]
- Fathi, P.; Rafieazad, M.; Duan, X.; Mohammadi, M.; Nasiri, A.M. On Microstructure and Corrosion Behaviour of AlSi10Mg Alloy with Low Surface Roughness Fabricated by Direct Metal Laser Sintering. Corros. Sci. 2019, 157, 126–145. [Google Scholar] [CrossRef]
- Gorsse, S.; Hutchinson, C.; Gouné, M.; Banerjee, R. Additive Manufacturing of Metals: A Brief Review of the Characteristic Microstructures and Properties of Steels, Ti-6Al-4V and High-Entropy Alloys. Sci. Technol. Adv. Mater. 2017, 18, 584–610. [Google Scholar] [CrossRef] [PubMed]
- Shakil, S.I.; Hadadzadeh, A.; Shalchi Amirkhiz, B.; Pirgazi, H.; Mohammadi, M.; Haghshenas, M. Additive Manufactured versus Cast AlSi10Mg Alloy: Microstructure and Micromechanics. Results Mater. 2021, 10, 100178. [Google Scholar] [CrossRef]
- Li, B.; Wang, H.; Jie, J.; Wei, Z. Effects of Yttrium and Heat Treatment on the Microstructure and Tensile Properties of Al–7.5Si–0.5Mg Alloy. Mater. Des. 2011, 32, 1617–1622. [Google Scholar] [CrossRef]
- Fathi, P.; Mohammadi, M.; Duan, X.; Nasiri, A.M. A Comparative Study on Corrosion and Microstructure of Direct Metal Laser Sintered AlSi10Mg_200C and Die Cast A360.1 Aluminum. J. Mater. Process. Technol. 2018, 259, 1–14. [Google Scholar] [CrossRef]
- Rafieazad, M.; Mohammadi, M.; Nasiri, A.M. On Microstructure and Early Stage Corrosion Performance of Heat Treated Direct Metal Laser Sintered AlSi10Mg. Addit. Manuf. 2019, 28, 107–119. [Google Scholar] [CrossRef]
- Aboulkhair, N.T.; Simonelli, M.; Parry, L.; Ashcroft, I.; Tuck, C.; Hague, R. 3D Printing of Aluminium Alloys: Additive Manufacturing of Aluminium Alloys Using Selective Laser Melting. Prog. Mater. Sci. 2019, 106, 100578. [Google Scholar] [CrossRef]
- Revilla, R.I.; Verkens, D.; Rubben, T.; De Graeve, I. Corrosion and Corrosion Protection of Additively Manufactured Aluminium Alloys—A Critical Review. Materials 2020, 13, 4804. [Google Scholar] [CrossRef]
- Trevisan, F.; Calignano, F.; Lorusso, M.; Pakkanen, J.; Aversa, A.; Ambrosio, E.P.; Lombardi, M.; Fino, P.; Manfredi, D.; Requena, G. On the Selective Laser Melting (SLM) of the AlSi10Mg Alloy: Process, Microstructure, and Mechanical Properties. Materials 2017, 10, 76. [Google Scholar] [CrossRef] [PubMed]
- Aboulkhair, N.T.; Maskery, I.; Tuck, C.; Ashcroft, I.; Everitt, N.M. Improving the Fatigue Behaviour of a Selectively Laser Melted Aluminium Alloy: Influence of Heat Treatment and Surface Quality. Mater. Des. 2016, 104, 174–182. [Google Scholar] [CrossRef]
- Uzan, N.E.; Shneck, R.; Yeheskel, O.; Frage, N. Fatigue of AlSi10Mg Specimens Fabricated by Additive Manufacturing Selective Laser Melting (AM-SLM). Mater. Sci. Eng. A 2017, 704, 229–237. [Google Scholar] [CrossRef]
- Mower, T.M.; Long, M.J. Mechanical Behavior of Additive Manufactured, Powder-Bed Laser-Fused Materials. Mater. Sci. Eng. A 2016, 651, 198–213. [Google Scholar] [CrossRef]
- Raja, A.; Cheethirala, S.R.; Gupta, P.; Vasa, N.J.; Jayaganthan, R. A Review on the Fatigue Behaviour of AlSi10Mg Alloy Fabricated Using Laser Powder Bed Fusion Technique. J. Mater. Res. Technol. 2022, 17, 1013–1029. [Google Scholar] [CrossRef]
- Santos Macías, J.G.; Elangeswaran, C.; Zhao, L.; Buffière, J.Y.; Van Hooreweder, B.; Simar, A. Fatigue Crack Nucleation and Growth in Laser Powder Bed Fusion AlSi10Mg under as Built and Post-Treated Conditions. Mater. Des. 2021, 210, 110084. [Google Scholar] [CrossRef]
- Niu, X.; Zhu, S.-P.; He, J.-C.; Liao, D.; Correia, J.; Berto, F.; Wang, Q. Defect tolerant fatigue assessment of AM materials: Size effect and probabilistic prospects. Int. J. Fatigue 2022, 160, 106884. [Google Scholar] [CrossRef]
- Ahmad, Z. Atmospheric Corrosion. In Principles of Corrosion Engineering and Corrosion Control; Elsevier: Amsterdam, The Netherlands, 2006; pp. 550–575. [Google Scholar]
- Magnin, T. Recent Advances in the Environment Sensitive Fracture Mechanisms of Aluminium Alloys. Mater. Sci. Forum 1996, 217, 83–94. [Google Scholar] [CrossRef]
- Chen, Y.; Song, X.; Ji, C.; Wang, F. Characterizing the Damage Behavior of Thin Sheets for Fuselage Based on in Situ Corrosion Fatigue Test and Digital Image Correlation Technique. Int. J. Damage Mech. 2021, 30, 399–414. [Google Scholar] [CrossRef]
- Cabrini, M.; Lorenzi, S.; Pastore, T.; Pellegrini, S.; Ambrosio, E.P.; Calignano, F.; Manfredi, D.; Pavese, M.; Fino, P. Effect of Heat Treatment on Corrosion Resistance of DMLS AlSi10Mg Alloy. Electrochim. Acta 2016, 206, 346–355. [Google Scholar] [CrossRef]
- Revilla, R.I.; Liang, J.; Godet, S.; De Graeve, I. Local Corrosion Behavior of Additive Manufactured AlSiMg Alloy Assessed by SEM and SKPFM. J. Electrochem. Soc. 2017, 164, C27–C35. [Google Scholar] [CrossRef]
- Al-Mukhtar, A.M. Case Studies of Aircraft Fuselage Cracking. Adv. Eng. Forum 2019, 33, 11–18. [Google Scholar] [CrossRef]
- Guérin, M.; Alexis, J.; Andrieu, E.; Blanc, C.; Odemer, G. Corrosion-Fatigue Lifetime of Aluminium-Copper-Lithium Alloy 2050 in Chloride Solution. Mater. Des. 2015, 87, 681–692. [Google Scholar] [CrossRef]
- Dolley, E.J.; Lee, B.; Wei, R.P. Effect of Pitting Corrosion on Fatigue Life. Fatigue Fract. Eng. Mater. Struct. 2000, 23, 555–560. [Google Scholar] [CrossRef]
- Ikechukwu, O.; Aniekan, I.; Ebunilo, P.O.; Ikpe, E. Investigation of a Vehicle Tie Rod Failure in Relation to the Forces Acting On the Suspension System. Am. J. Eng. Res. 2016, 5, 208–217. [Google Scholar]
- Kim, Y.S.; Kim, J.G. Evaluation of Corrosion Fatigue and Life Prediction of Lower Arm for Automotive Suspension Component. Met. Mater. Int. 2017, 23, 98–105. [Google Scholar] [CrossRef]
- Chan, C.; Yue, T.M.; Man, H.C. The Effect of Excimer Laser Surface Treatment on the Pitting Corrosion Fatigue Behaviour of Aluminium Alloy 7075. J. Mater. Sci. 2003, 38, 2689–2702. [Google Scholar] [CrossRef]
- Fernández Muñoz, A.; Luis Mier Buenhombre, J.; García-Diez, A.I.; Fabal, C.C.; José, J.; Díaz, G. Fatigue Study of the Pre-Corroded 6082-T6 Aluminum Alloy in Saline Atmosphere. Metals 2020, 10, 1260. [Google Scholar] [CrossRef]
- Shi, L.; Xiang, L.; Tao, J.; Liu, J.; Chen, Q.; Zhong, Y. Effects of Actual Marine Atmospheric Pre-Corrosion and Pre-Fatigue on the Fatigue Property of 7085 Aluminum Alloy. Metals 2022, 12, 81. [Google Scholar] [CrossRef]
- Leon, A.; Shirizly, A.; Aghion, E. Corrosion Behavior of AlSi10Mg Alloy Produced by Additive Manufacturing (AM) vs. Its Counterpart Gravity Cast Alloy. Metals 2016, 6, 148. [Google Scholar] [CrossRef]
- Leon, A.; Aghion, E. Effect of Surface Roughness on Corrosion Fatigue Performance of AlSi10Mg Alloy Produced by Selective Laser Melting (SLM). Mater. Charact. 2017, 131, 188–194. [Google Scholar] [CrossRef]
- Song, H.; Sun, L.; Du, J. Effect of Pre-Corrosion on the Fatigue Failure of Additive Manufactured AlSi10Mg Alloy. J. Mater. Eng. Perform. 2022, 31, 953–967. [Google Scholar] [CrossRef]
- DIN 55635; Cyclic Corrosion Testing of Materials & Components in Automotive Construction. DIN: Berlin, Germany, 2019.
- Vucko, F.; LeBozec, N.; Thierry, D.; Weber, B.; Dosdat, L.; Luckeneder, G.; Bschorr, T.; Rother, K.; Sciaboni, C.; Sczepanski, J. Combined Corrosion and Fatigue Performance of Joined Materials for Automotive Applications. Mater. Corros. 2016, 67, 1143–1151. [Google Scholar] [CrossRef]
- Thierry, D.; Vucko, F.; Luckeneder, G.; Weber, B.; Dosdat, L.; Bschorr, T.; Rother, K. Fatigue Behavior of Spot-Welded Joints in Air and under Corrosive Environments. Weld. World 2016, 60, 1231–1245. [Google Scholar] [CrossRef]
- Chen, H.; Zhang, C.; Jia, D.; Wellmann, D.; Liu, W. Corrosion Behaviors of Selective Laser Melted Aluminum Alloys: A Review. Metals 2020, 10, 102. [Google Scholar] [CrossRef]
- Domfang Ngnekou, J.N.; Nadot, Y.; Henaff, G.; Nicolai, J.; Kan, W.H.; Cairney, J.M.; Ridosz, L. Fatigue Properties of AlSi10Mg Produced by Additive Layer Manufacturing. Int. J. Fatigue 2019, 119, 160–172. [Google Scholar] [CrossRef]
- Osmond, P.; Le, V.D.; Morel, F.; Bellett, D.; Saintier, N. Effect of Porosity on the Fatigue Strength of Cast Aluminium Alloys: From the Specimen to the Structure. Procedia Eng. 2018, 213, 630–643. [Google Scholar] [CrossRef]
- Sotoudeh, K.; Nguyen, T.H.; Foley, R.T.; Brown, B.F. The Chemical Nature of Aluminum Corrosion: I Corrosion of Aluminum Surfaces by Aluminum Salts. Corrosion 1981, 37, 358–362. [Google Scholar] [CrossRef]
- Yadollahi, A.; Shamsaei, N. Additive Manufacturing of Fatigue Resistant Materials: Challenges and Opportunities. Int. J. Fatigue 2017, 98, 14–31. [Google Scholar] [CrossRef]
- Hoeppner, D.W.; Arriscorreta, C.A. Exfoliation Corrosion and Pitting Corrosion and Their Role in Fatigue Predictive Modeling: State-of-the-Art Review. Int. J. Aerosp. Eng. 2012, 2012, 191879. [Google Scholar] [CrossRef]
- Shyam, A.; Lara-Curzio, E. A Model for the Formation of Fatigue Striations and Its Relationship with Small Fatigue Crack Growth in an Aluminum Alloy. Int. J. Fatigue 2010, 32, 1843–1852. [Google Scholar] [CrossRef]


| Surface Condition | Average Pit Depth [µm] | Maximum Pit Depth [µm] | Pit Density [pit/cm2] |
|---|---|---|---|
| As-printed | 50 ± 12 | 65 | 536 ± 20 |
| Machined | 11 ± 1 | 14 | 140 ± 4 |
Disclaimer/Publisher’s Note: The statements, opinions and data contained in all publications are solely those of the individual author(s) and contributor(s) and not of MDPI and/or the editor(s). MDPI and/or the editor(s) disclaim responsibility for any injury to people or property resulting from any ideas, methods, instructions or products referred to in the content. |
© 2023 by the authors. Licensee MDPI, Basel, Switzerland. This article is an open access article distributed under the terms and conditions of the Creative Commons Attribution (CC BY) license (https://creativecommons.org/licenses/by/4.0/).
Share and Cite
Linder, C.; Vucko, F.; Ma, T.; Proper, S.; Dartfeldt, E. Corrosion-Fatigue Performance of 3D-Printed (L-PBF) AlSi10Mg. Materials 2023, 16, 5964. https://doi.org/10.3390/ma16175964
Linder C, Vucko F, Ma T, Proper S, Dartfeldt E. Corrosion-Fatigue Performance of 3D-Printed (L-PBF) AlSi10Mg. Materials. 2023; 16(17):5964. https://doi.org/10.3390/ma16175964
Chicago/Turabian StyleLinder, Clara, Flavien Vucko, Taoran Ma, Sebastian Proper, and Erik Dartfeldt. 2023. "Corrosion-Fatigue Performance of 3D-Printed (L-PBF) AlSi10Mg" Materials 16, no. 17: 5964. https://doi.org/10.3390/ma16175964