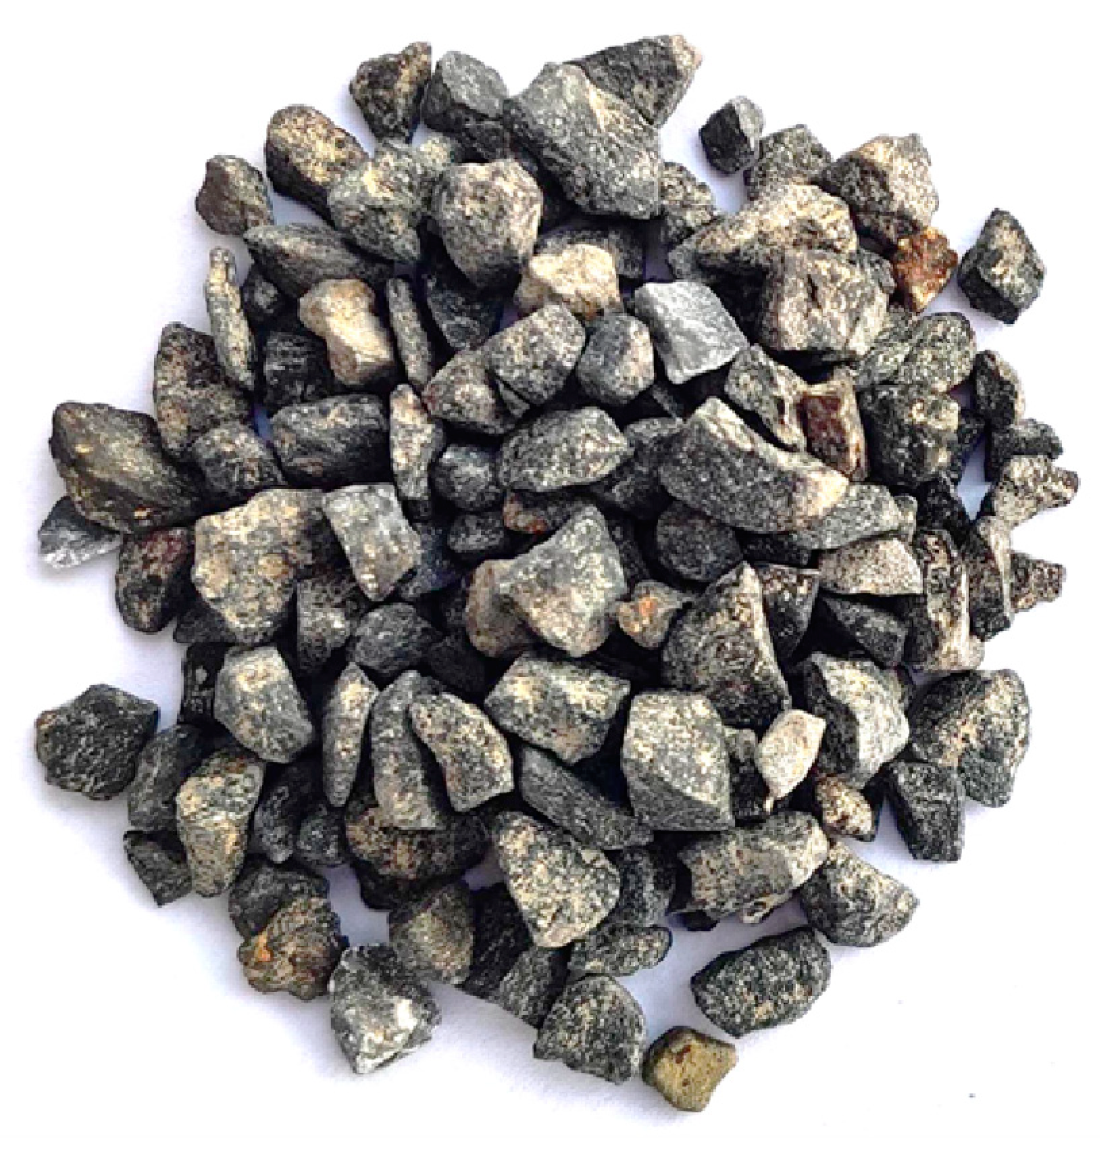
Figure 1.
Aggregate photograph.
Figure 1.
Aggregate photograph.
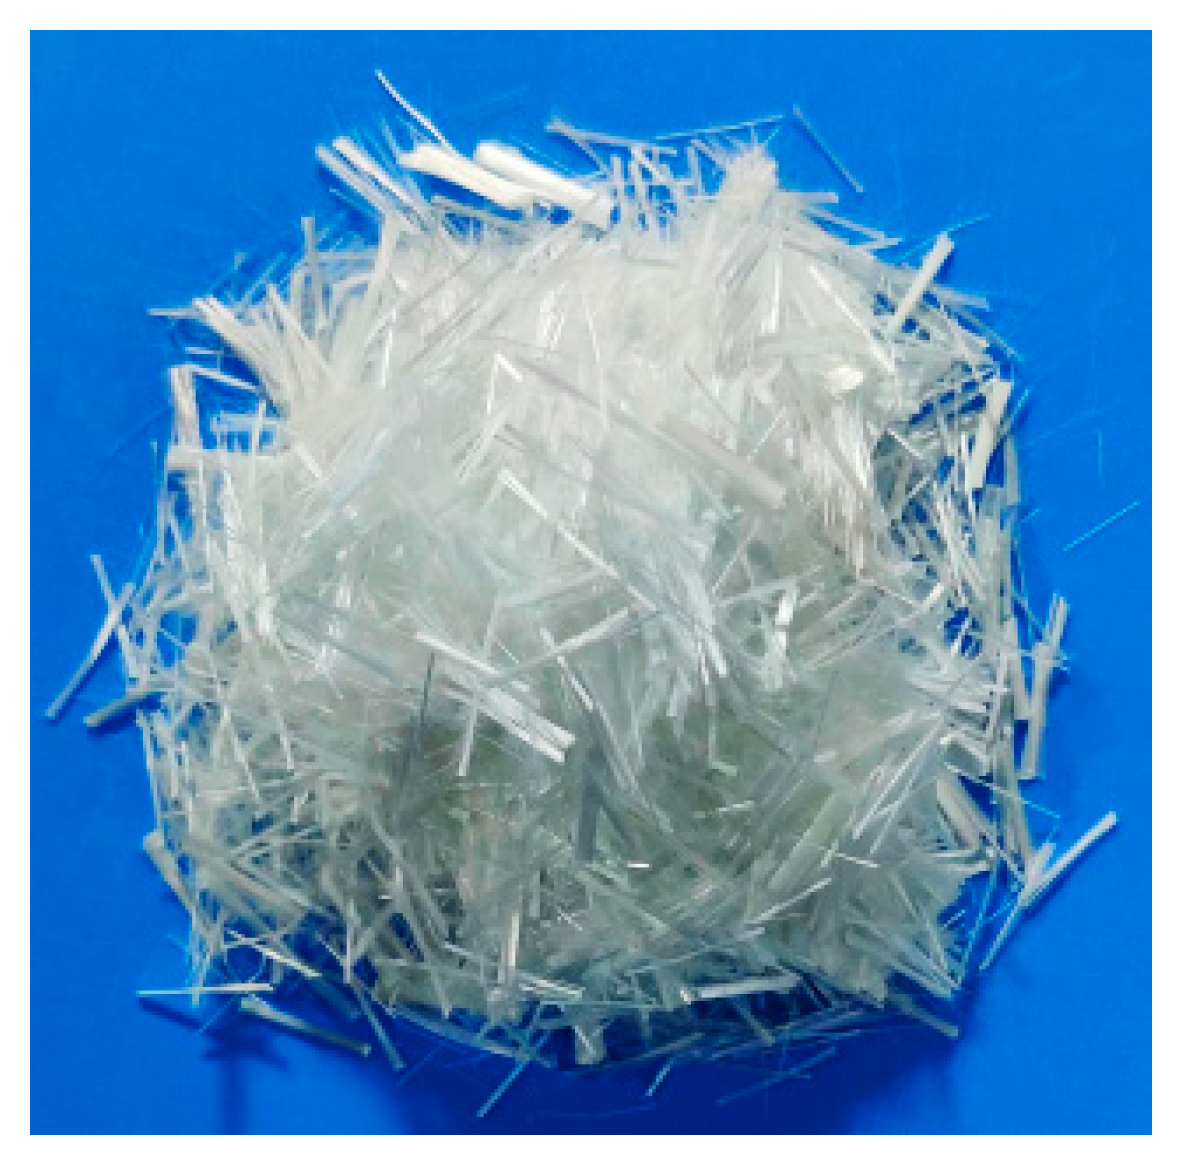
Figure 2.
Glass fiber photograph.
Figure 2.
Glass fiber photograph.
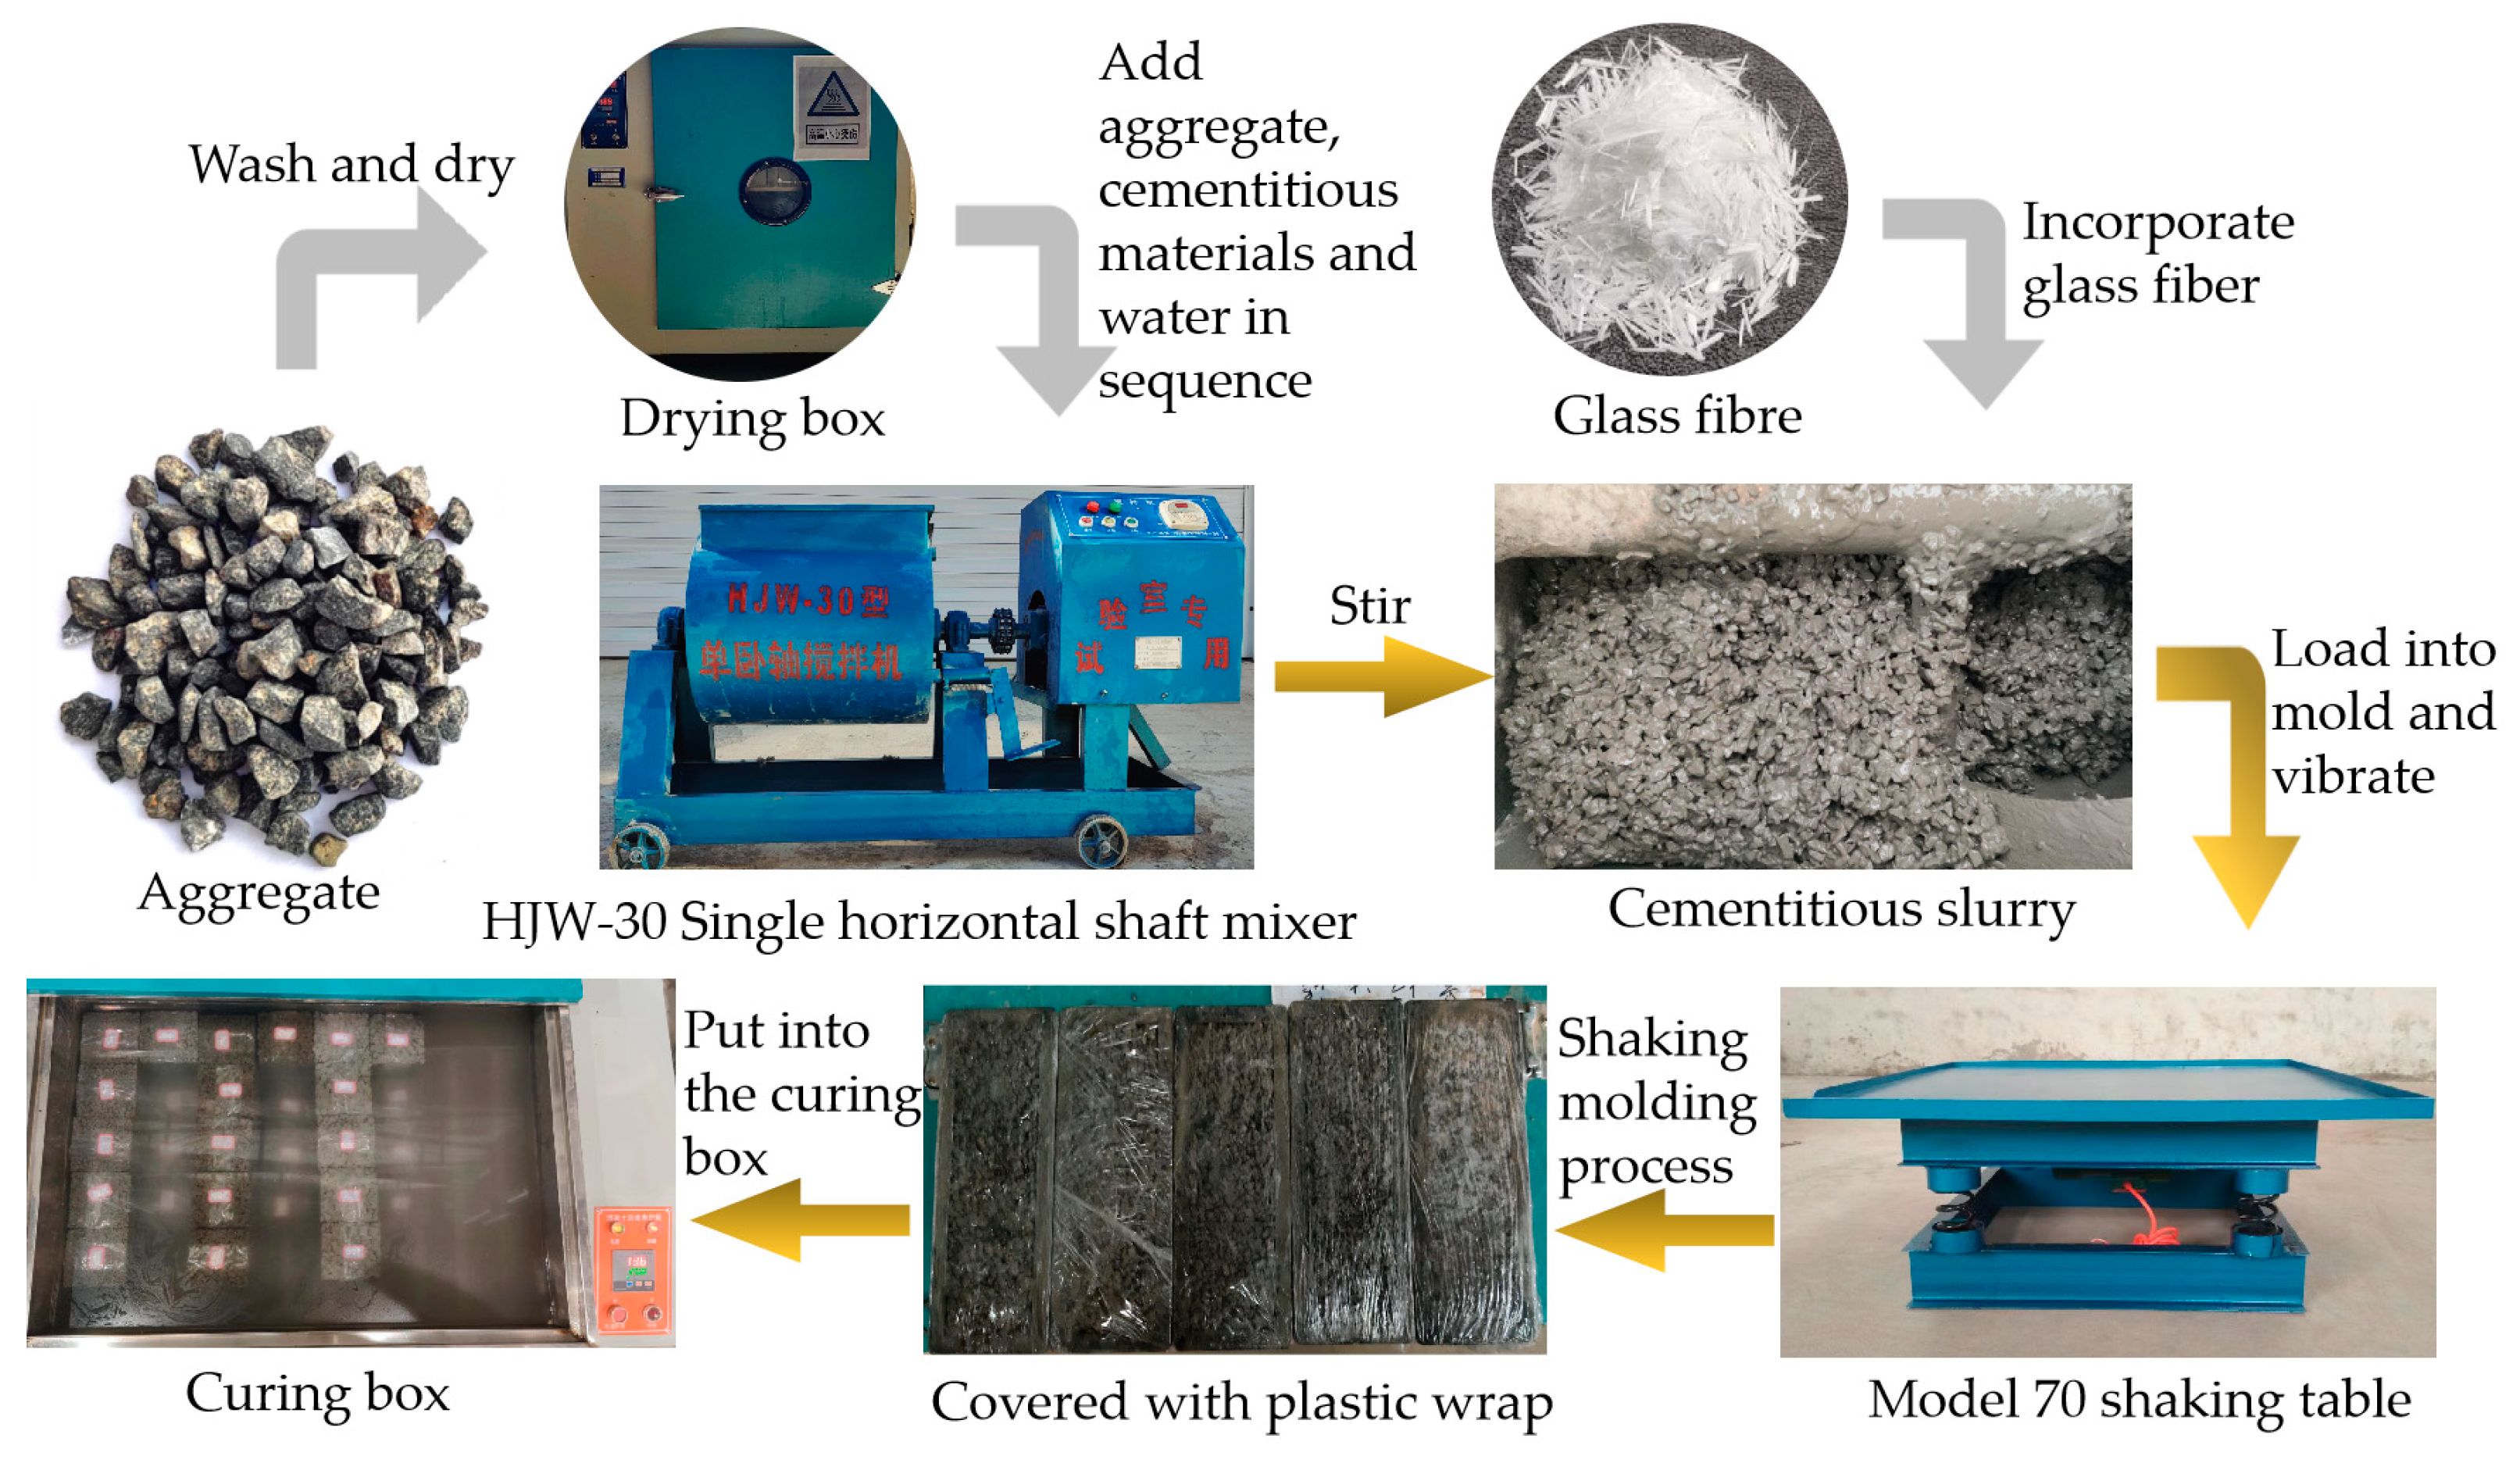
Figure 3.
Preparation flow chart.
Figure 3.
Preparation flow chart.
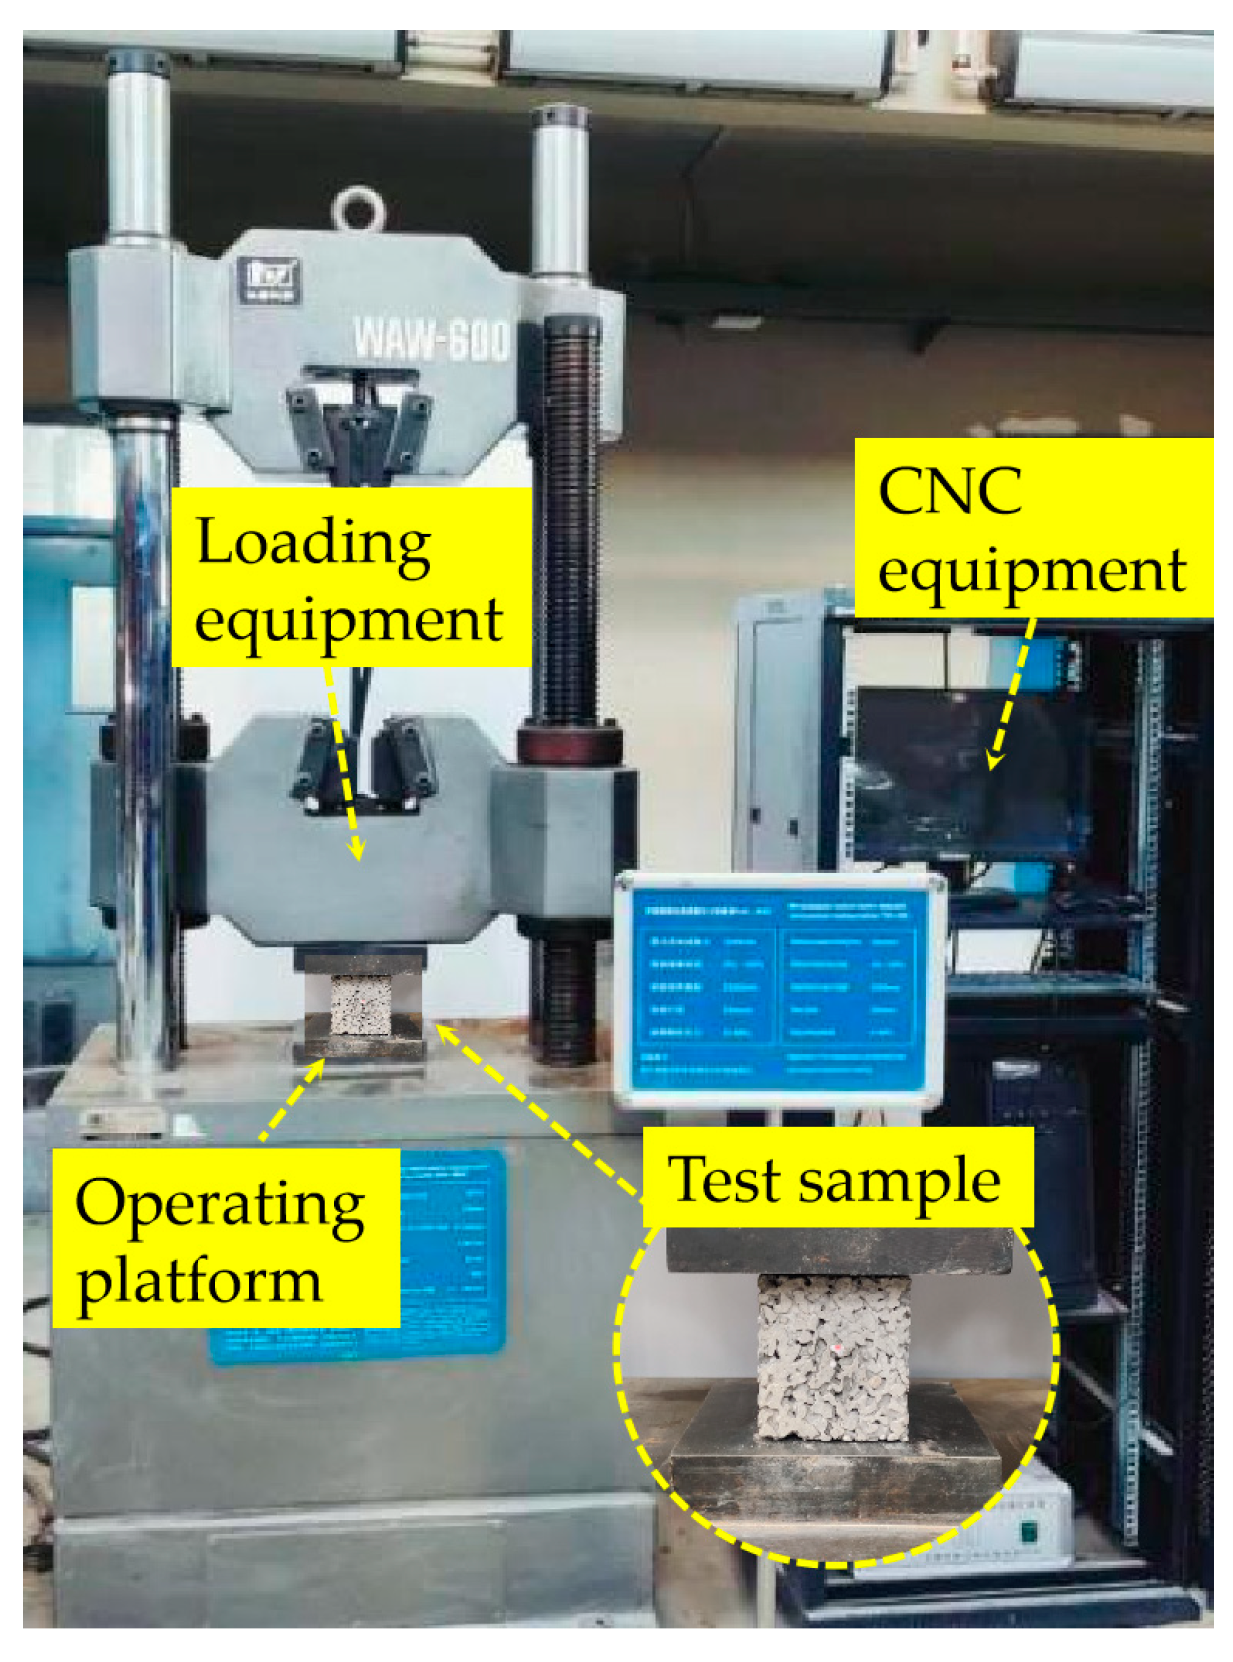
Figure 4.
Microcomputer servo pressure testing machine.
Figure 4.
Microcomputer servo pressure testing machine.
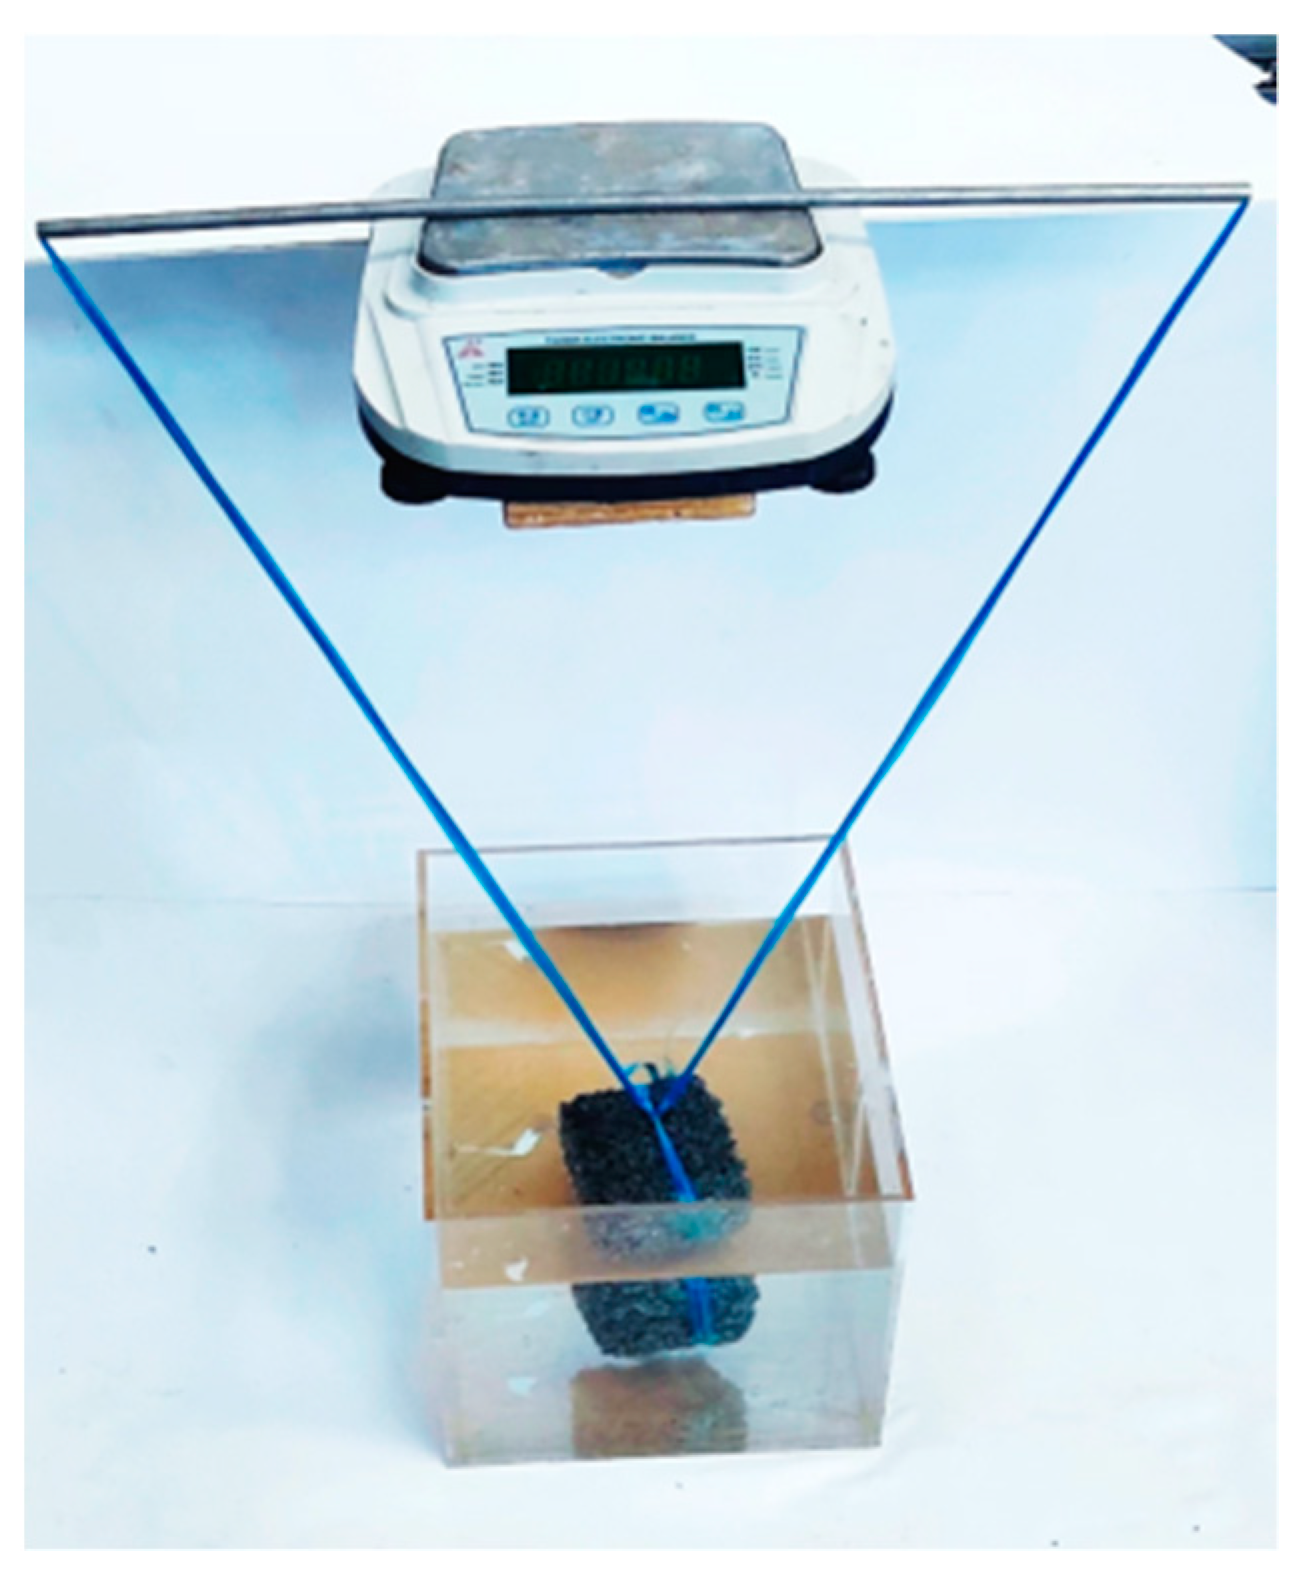
Figure 5.
Porosity measurement equipment.
Figure 5.
Porosity measurement equipment.
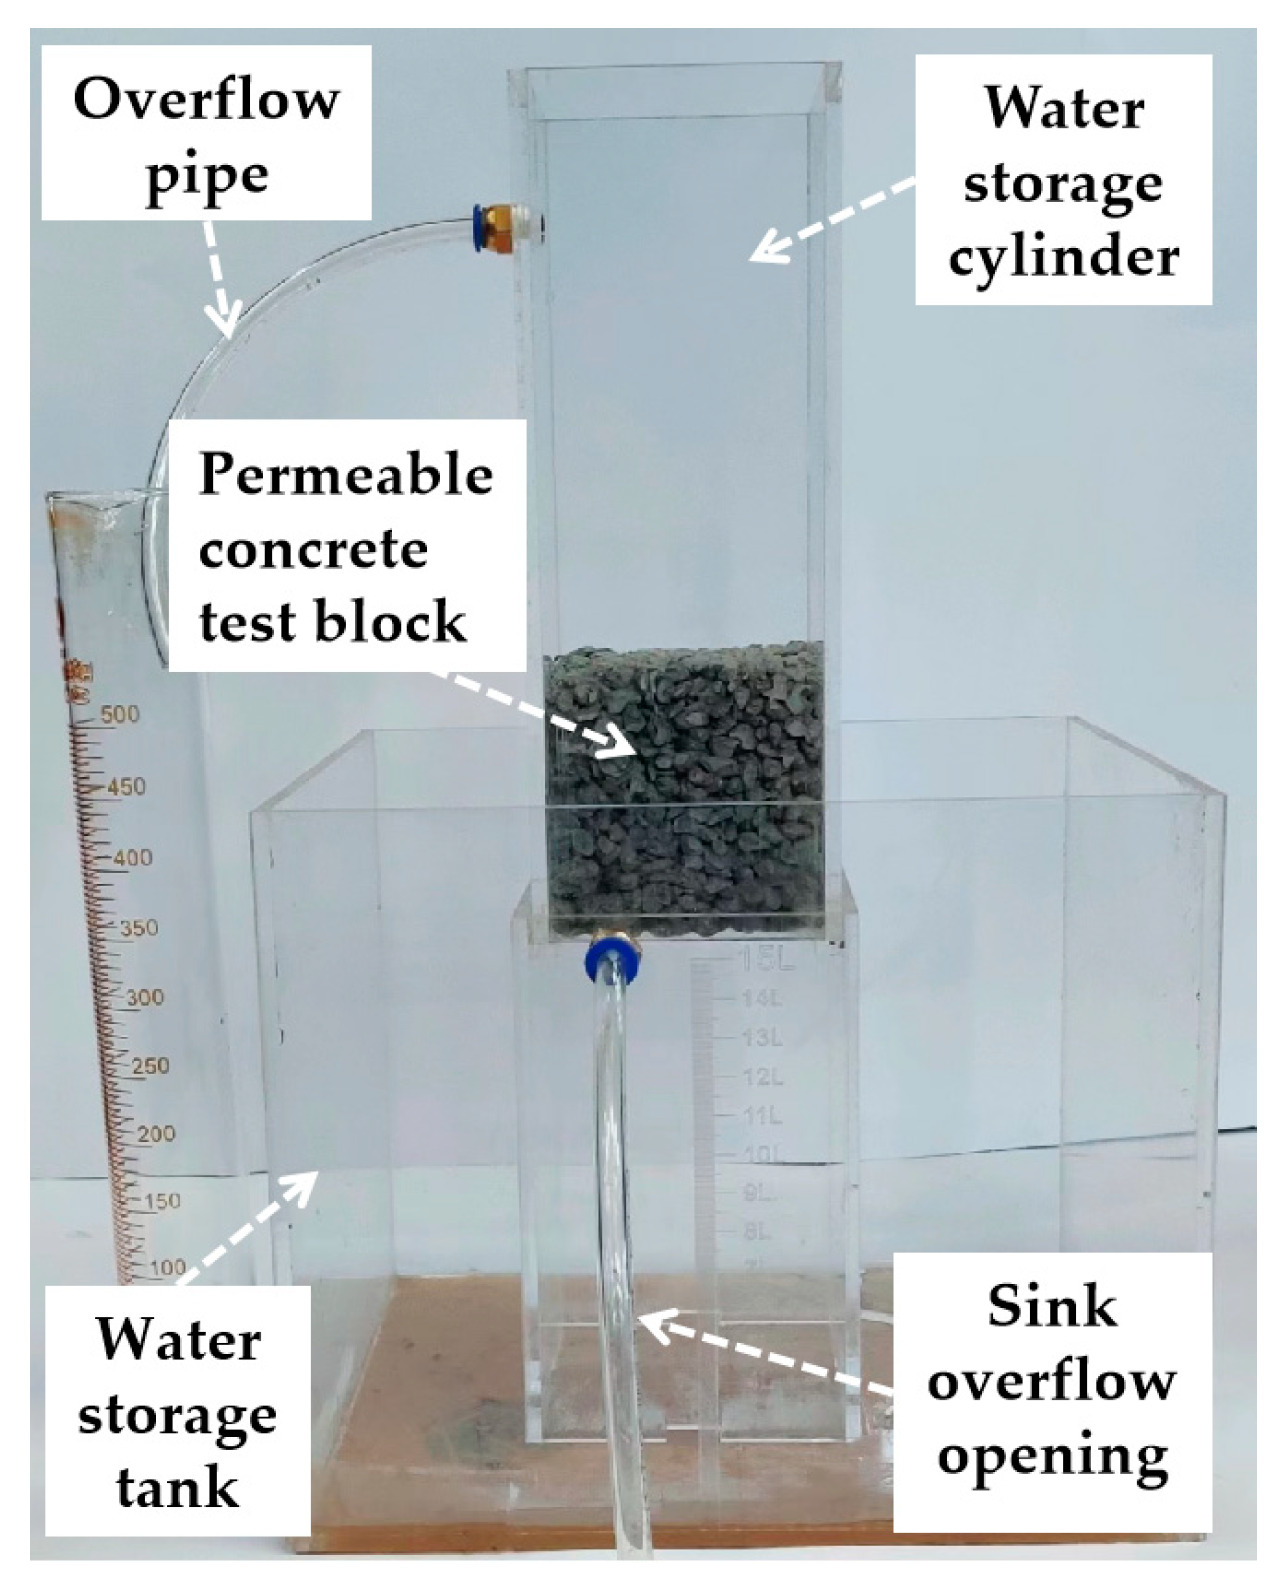
Figure 6.
Water permeability coefficient measuring equipment.
Figure 6.
Water permeability coefficient measuring equipment.
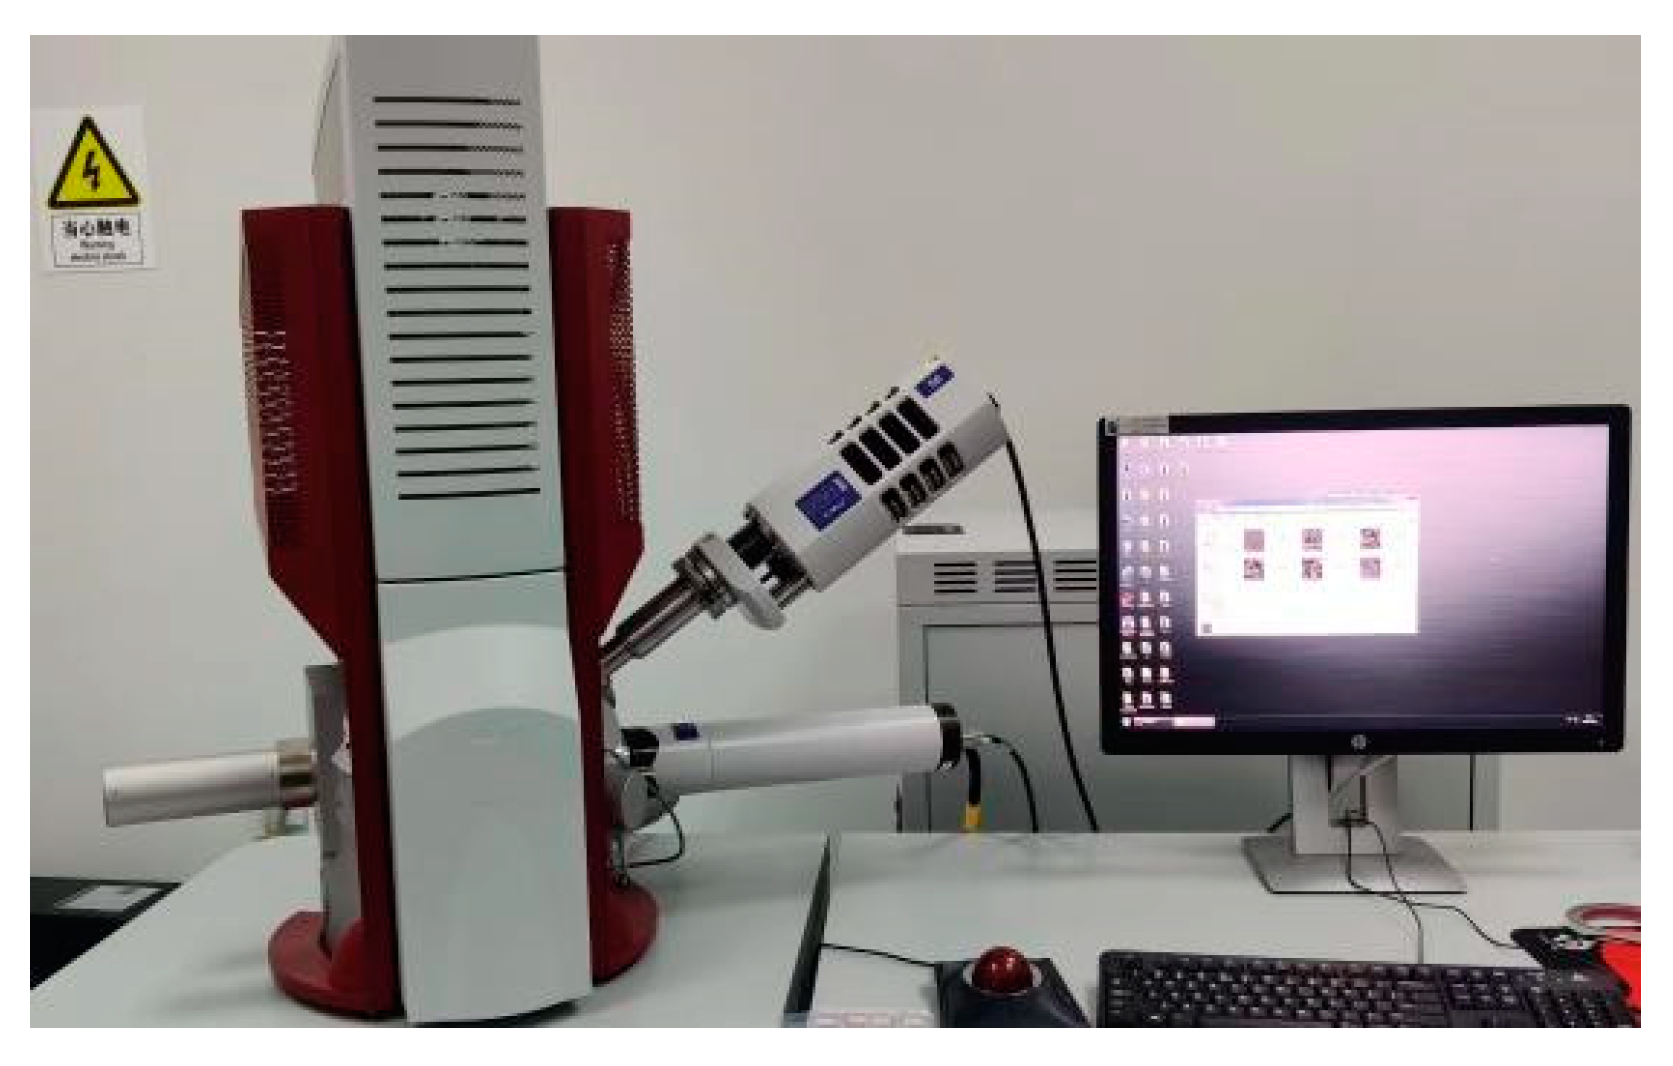
Figure 7.
Scanning electron microscope.
Figure 7.
Scanning electron microscope.
Figure 8.
Photos of permeable concrete at different shaking times: (a) 3 s; (b) 5 s; (c) 10 s; (d) 15 s; (e) 20 s; and (f) 25 s.
Figure 8.
Photos of permeable concrete at different shaking times: (a) 3 s; (b) 5 s; (c) 10 s; (d) 15 s; (e) 20 s; and (f) 25 s.
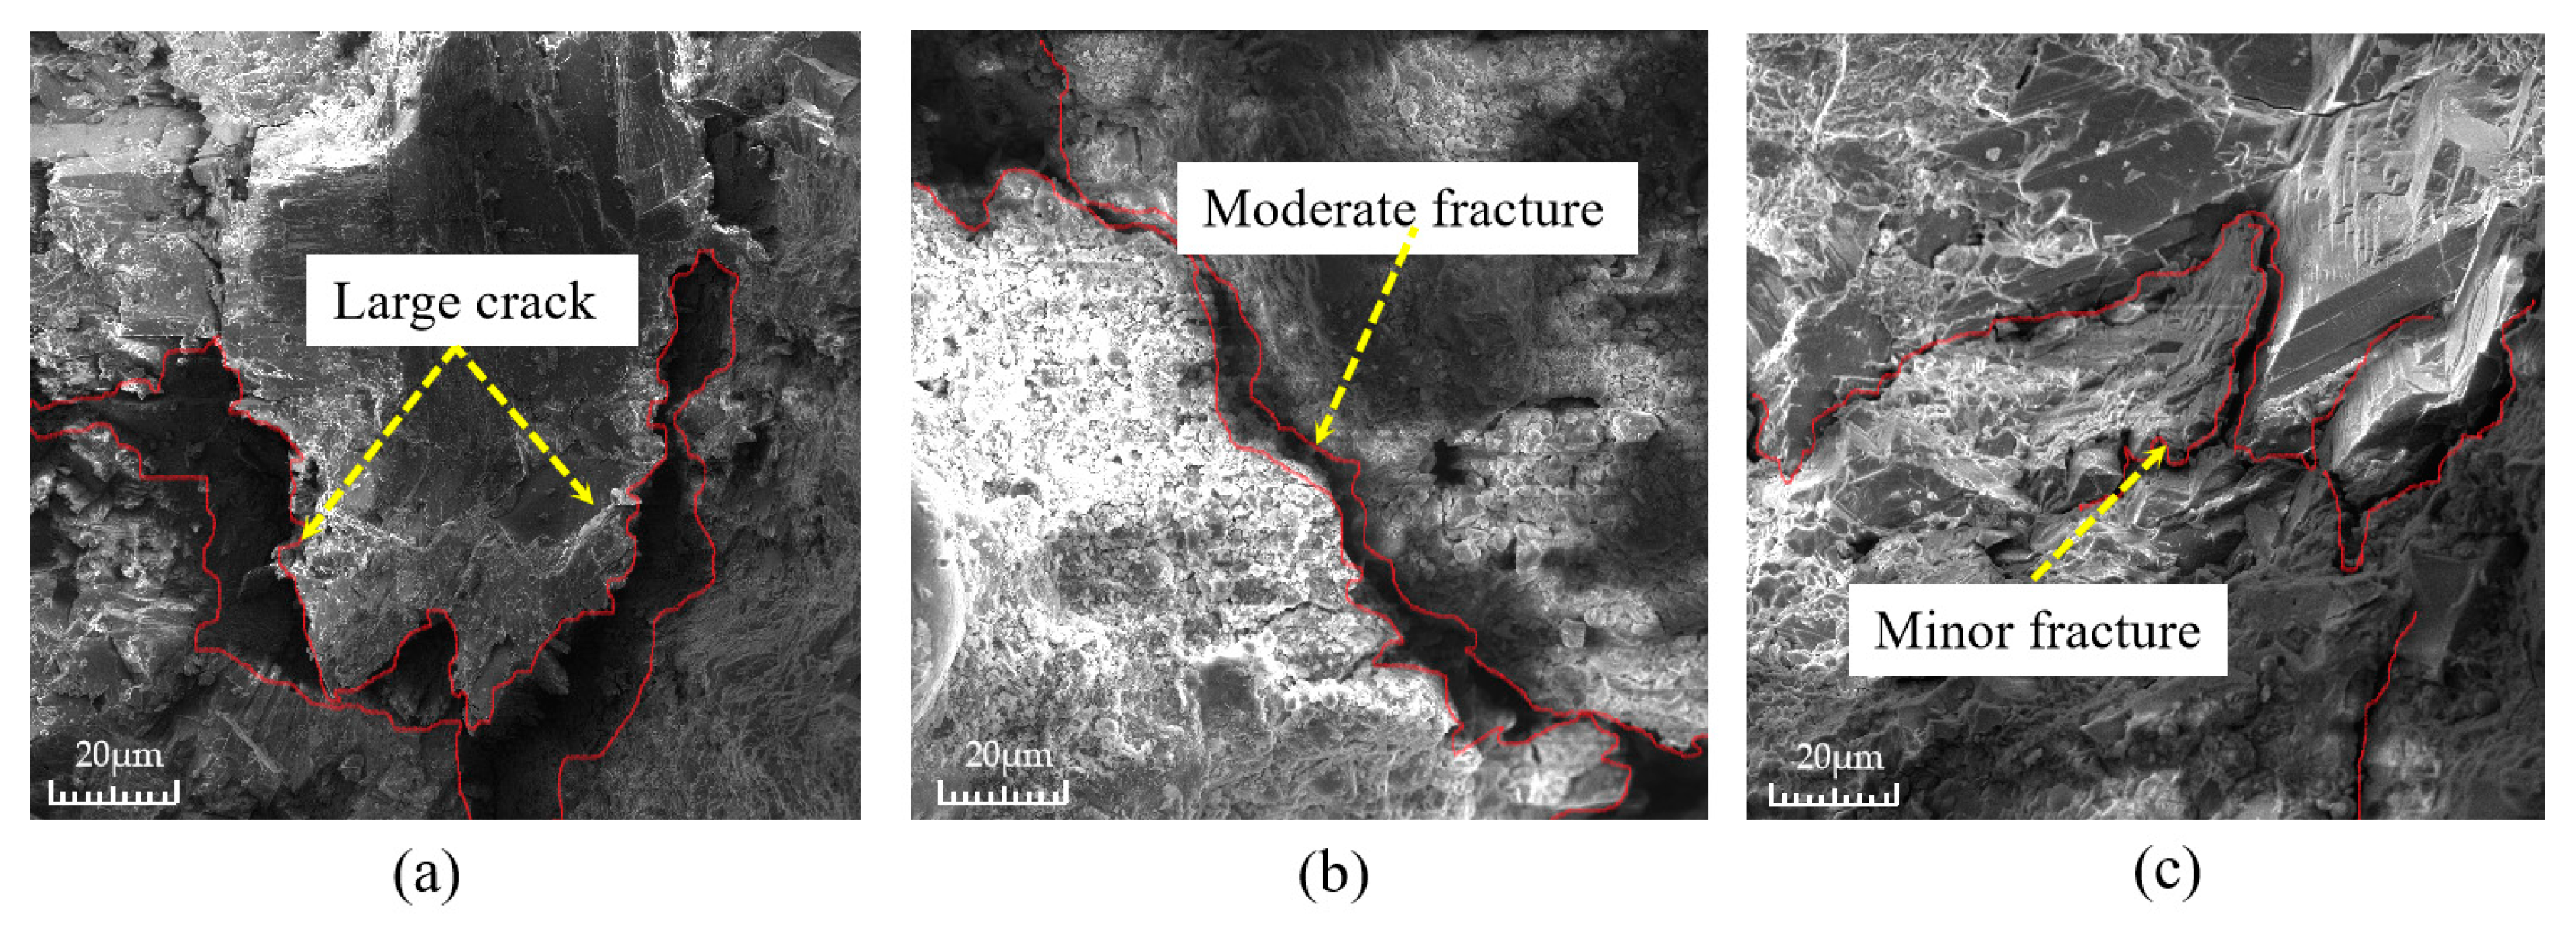
Figure 9.
Micro-morphology of cracks between aggregates and cementation layers at different shaking times: (a) 5 s; (b) 10 s; and (c) 15 s.
Figure 9.
Micro-morphology of cracks between aggregates and cementation layers at different shaking times: (a) 5 s; (b) 10 s; and (c) 15 s.
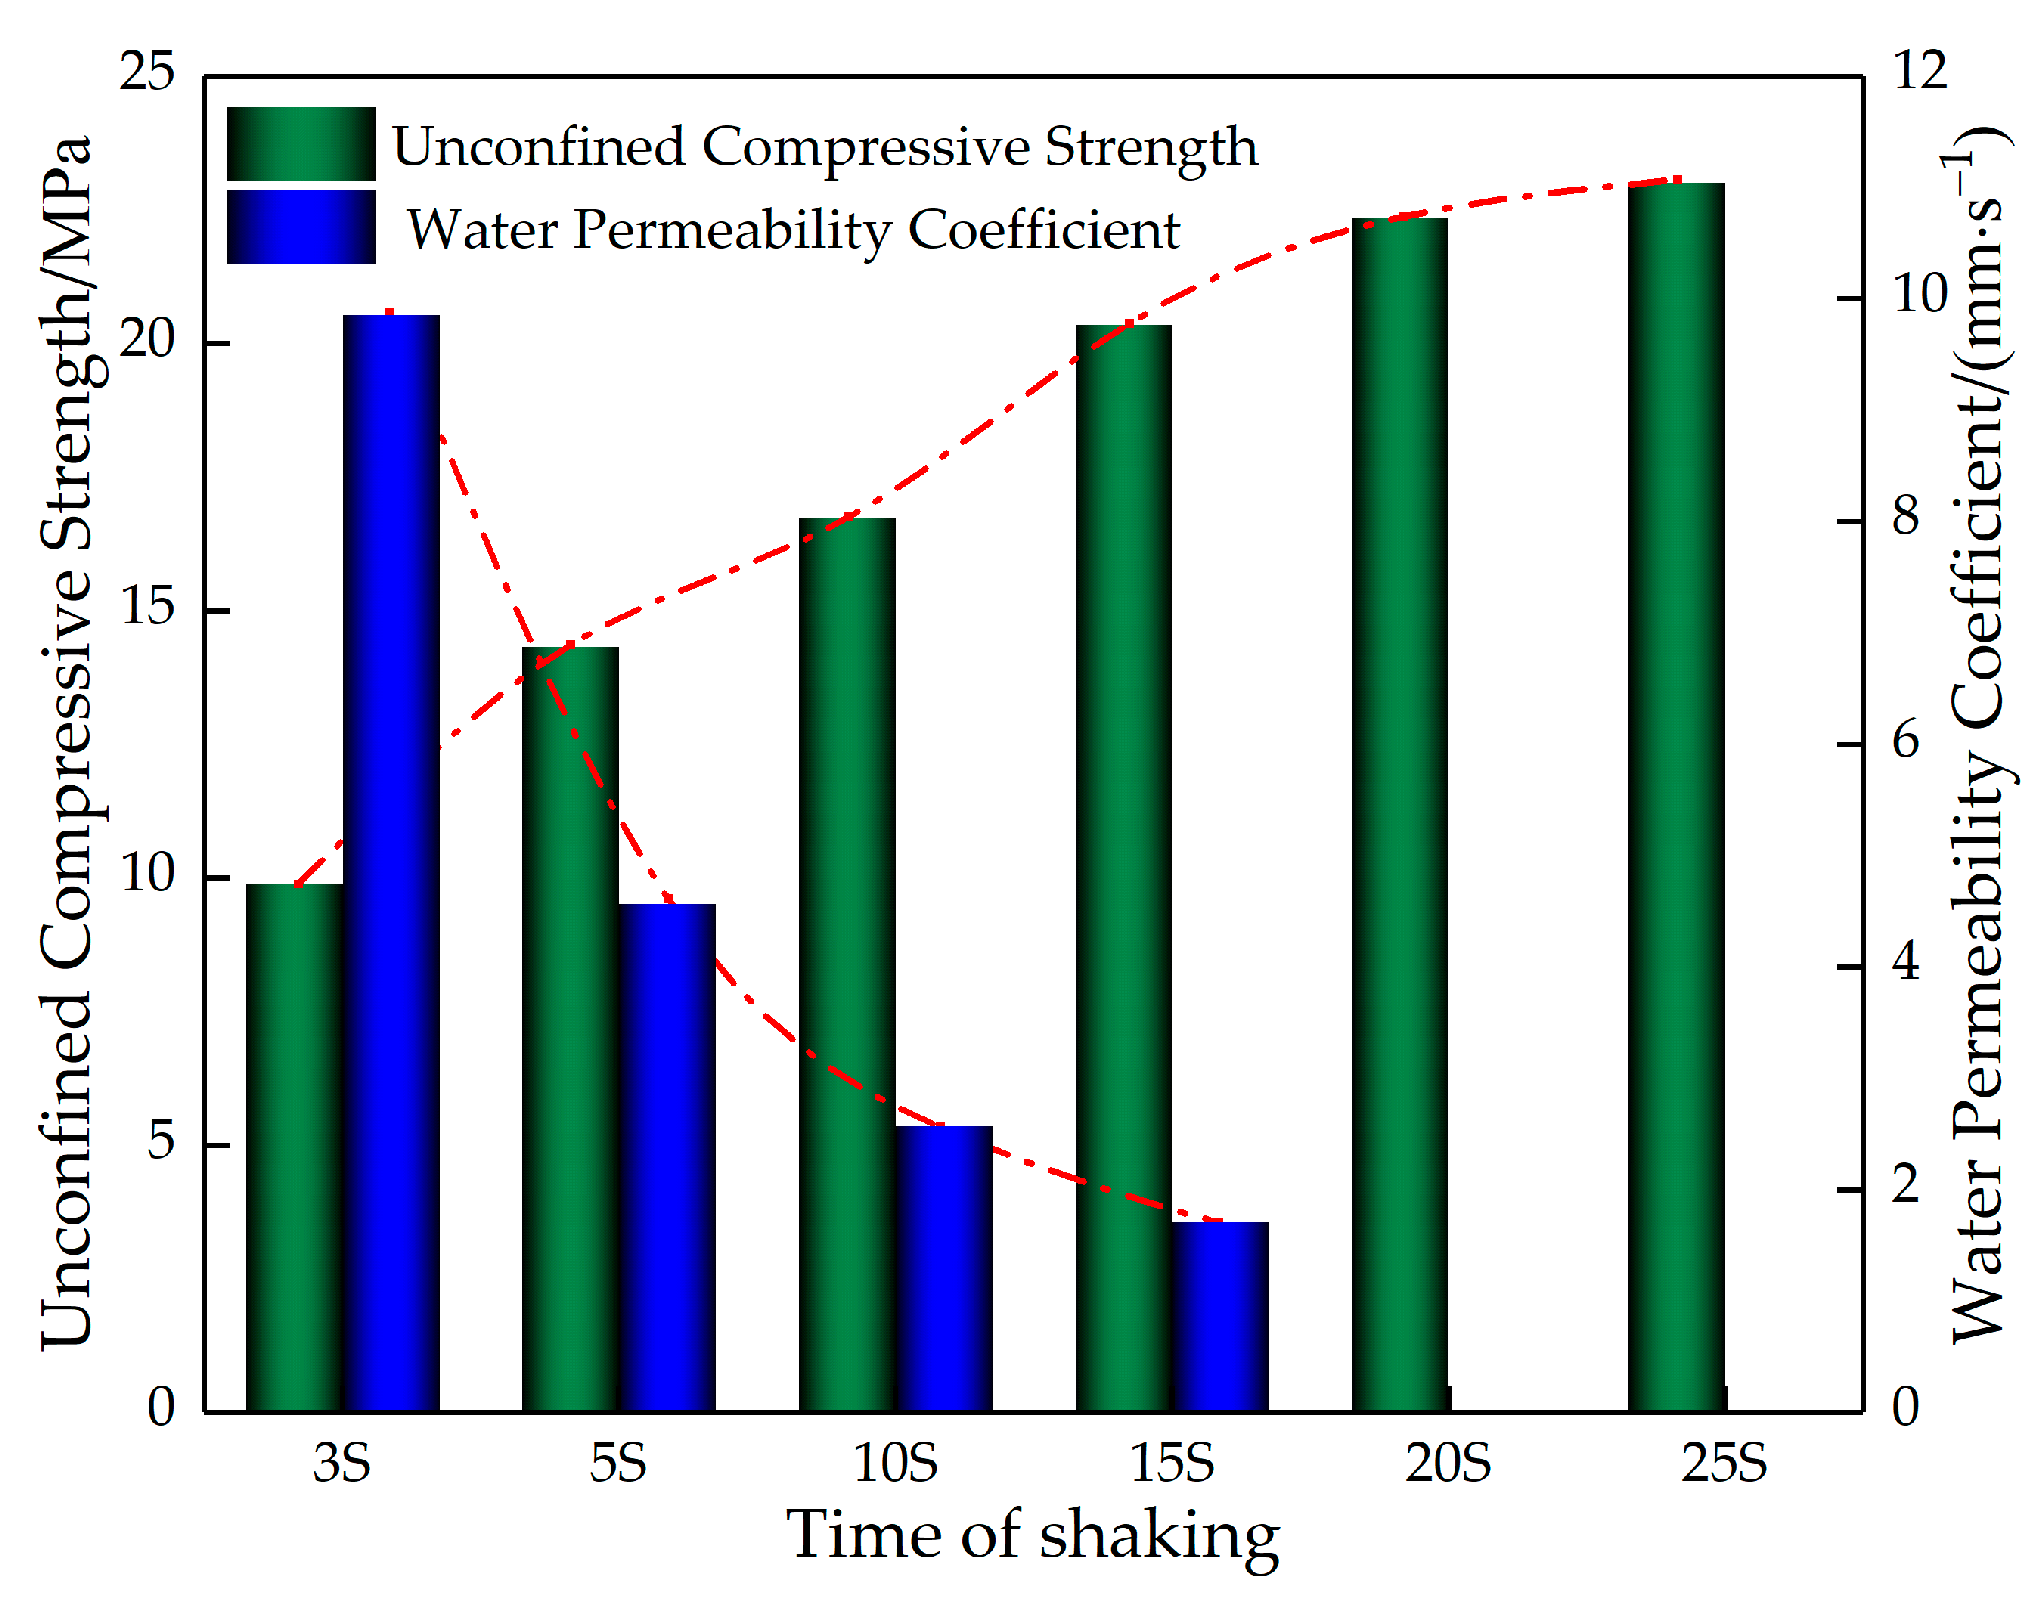
Figure 10.
Relationship between the strength and permeable coefficient of permeable concrete.
Figure 10.
Relationship between the strength and permeable coefficient of permeable concrete.
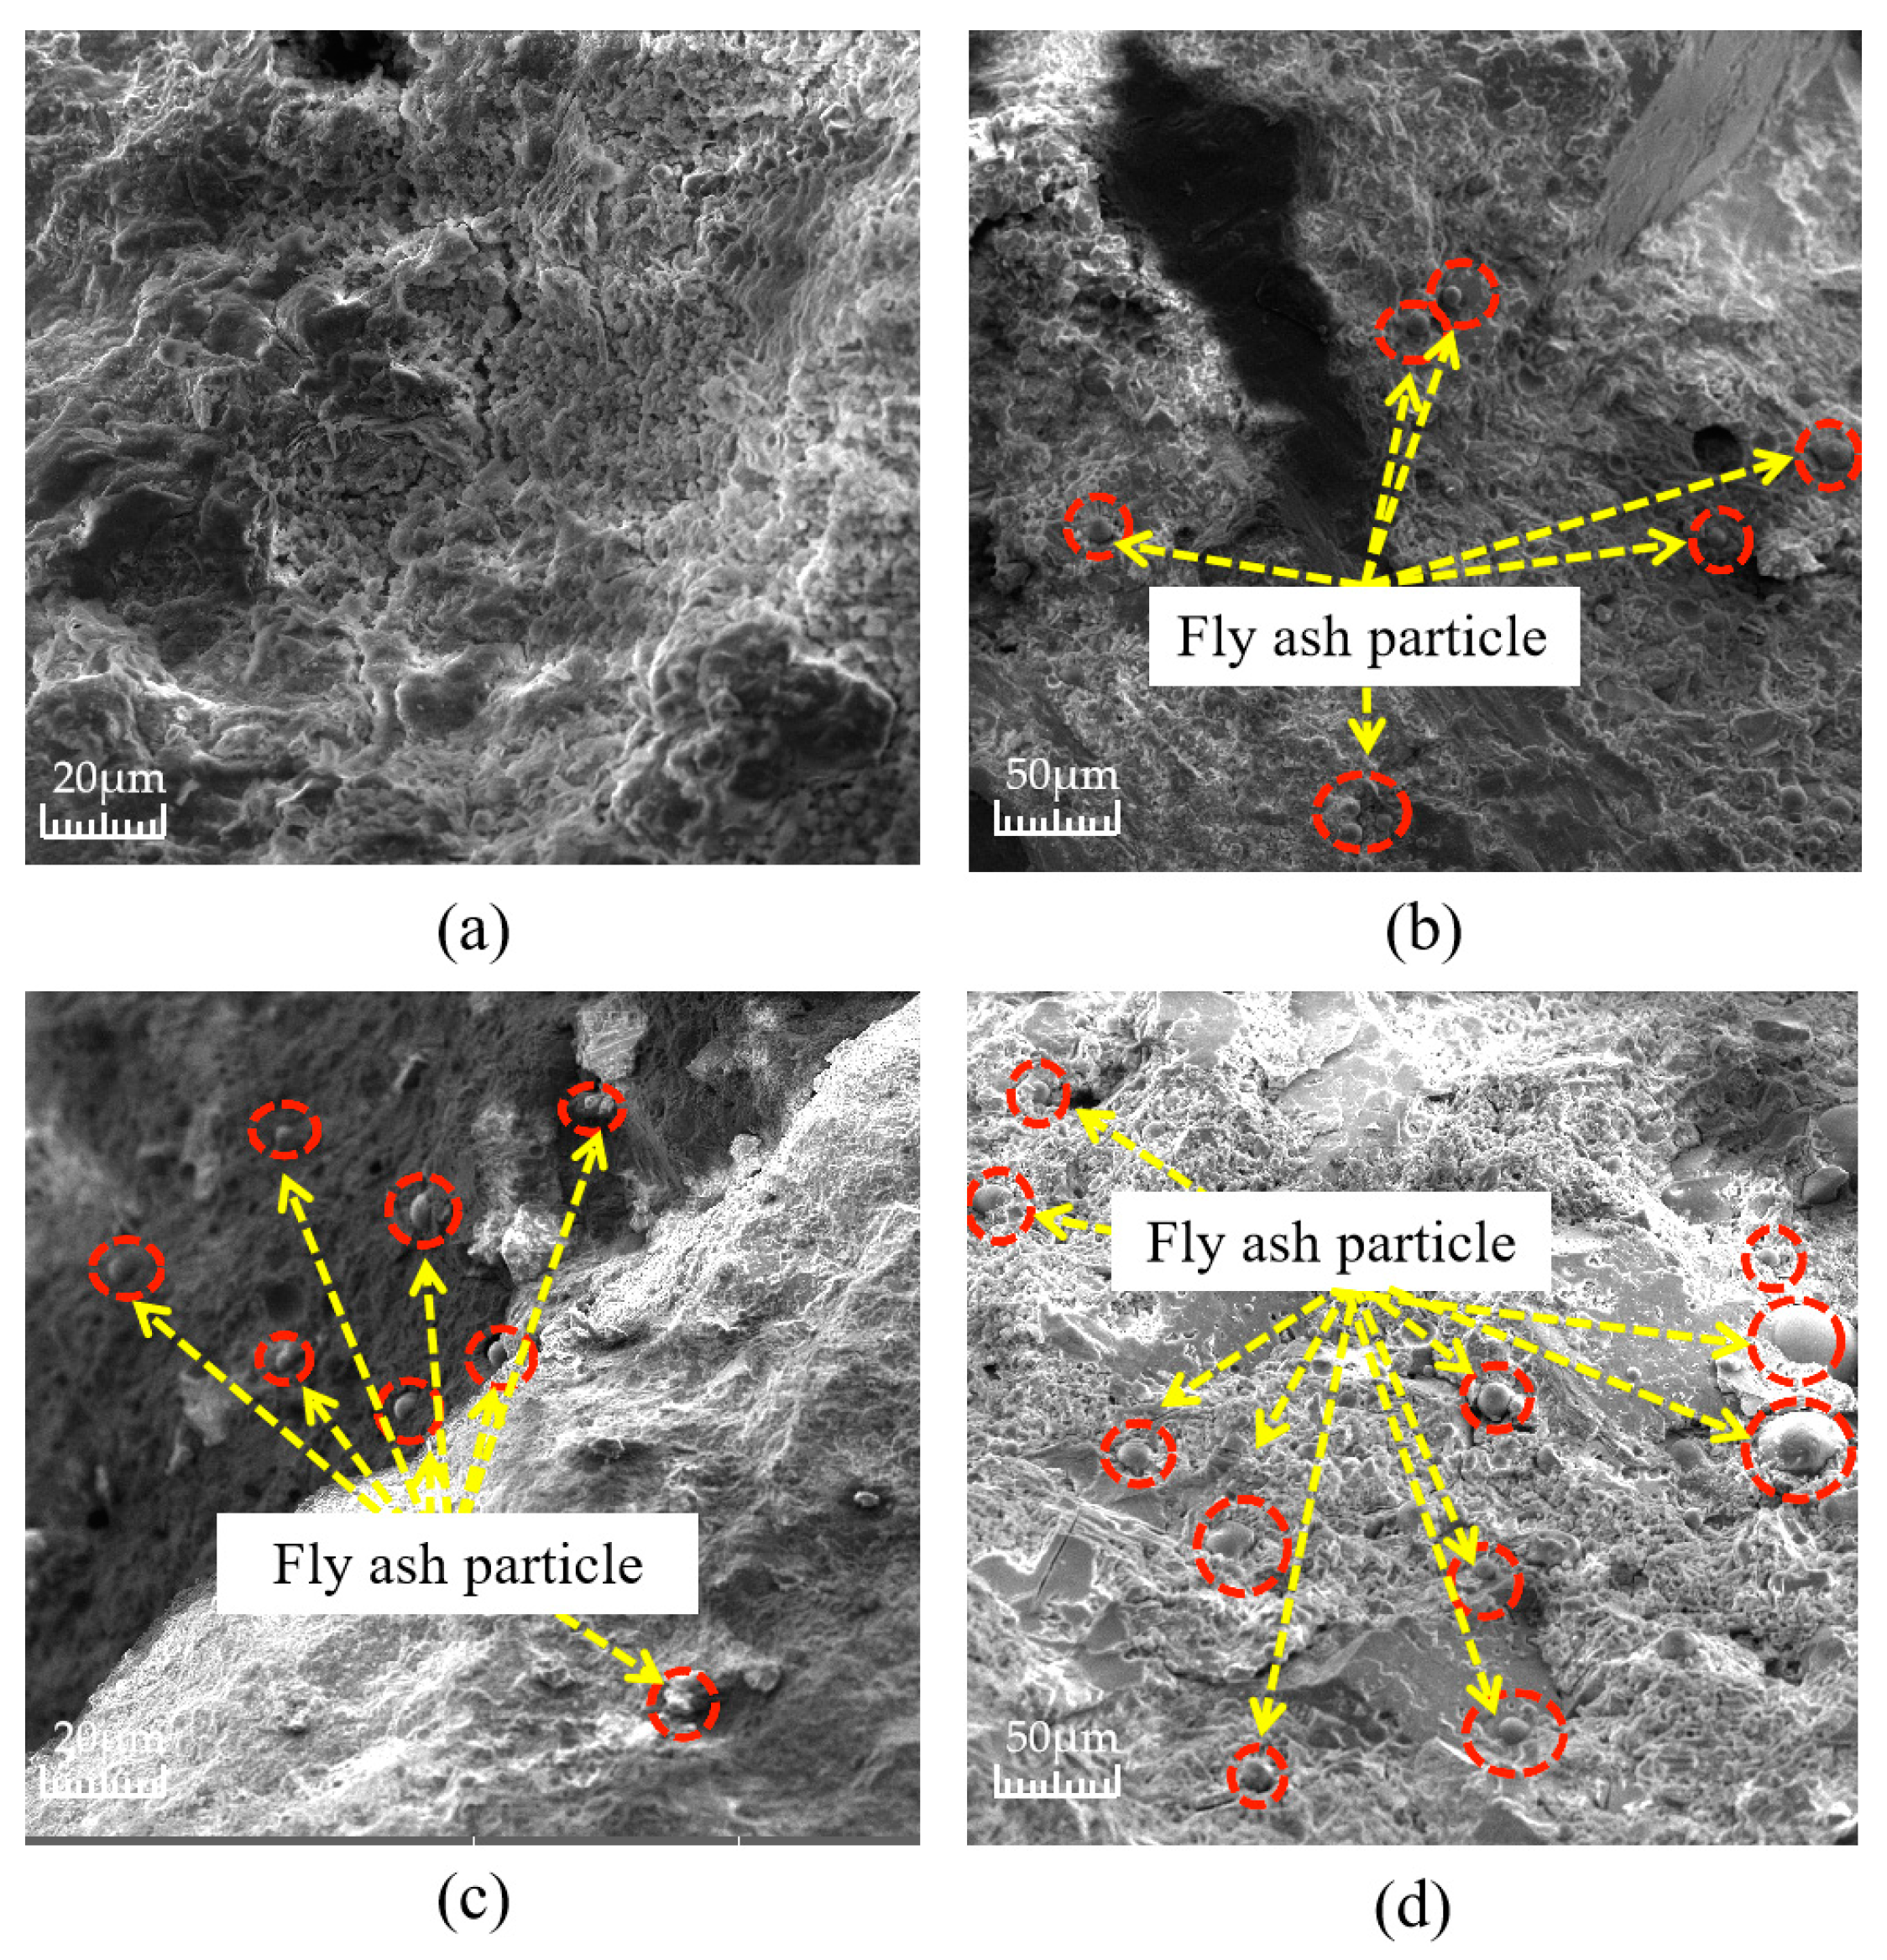
Figure 11.
The distribution of fly ash in the cemented layers with different fly ash content: (a) fly ash content 0%; (b) fly ash content 5%; (c) fly ash content 7.5%; and (d) fly ash content 10%.
Figure 11.
The distribution of fly ash in the cemented layers with different fly ash content: (a) fly ash content 0%; (b) fly ash content 5%; (c) fly ash content 7.5%; and (d) fly ash content 10%.
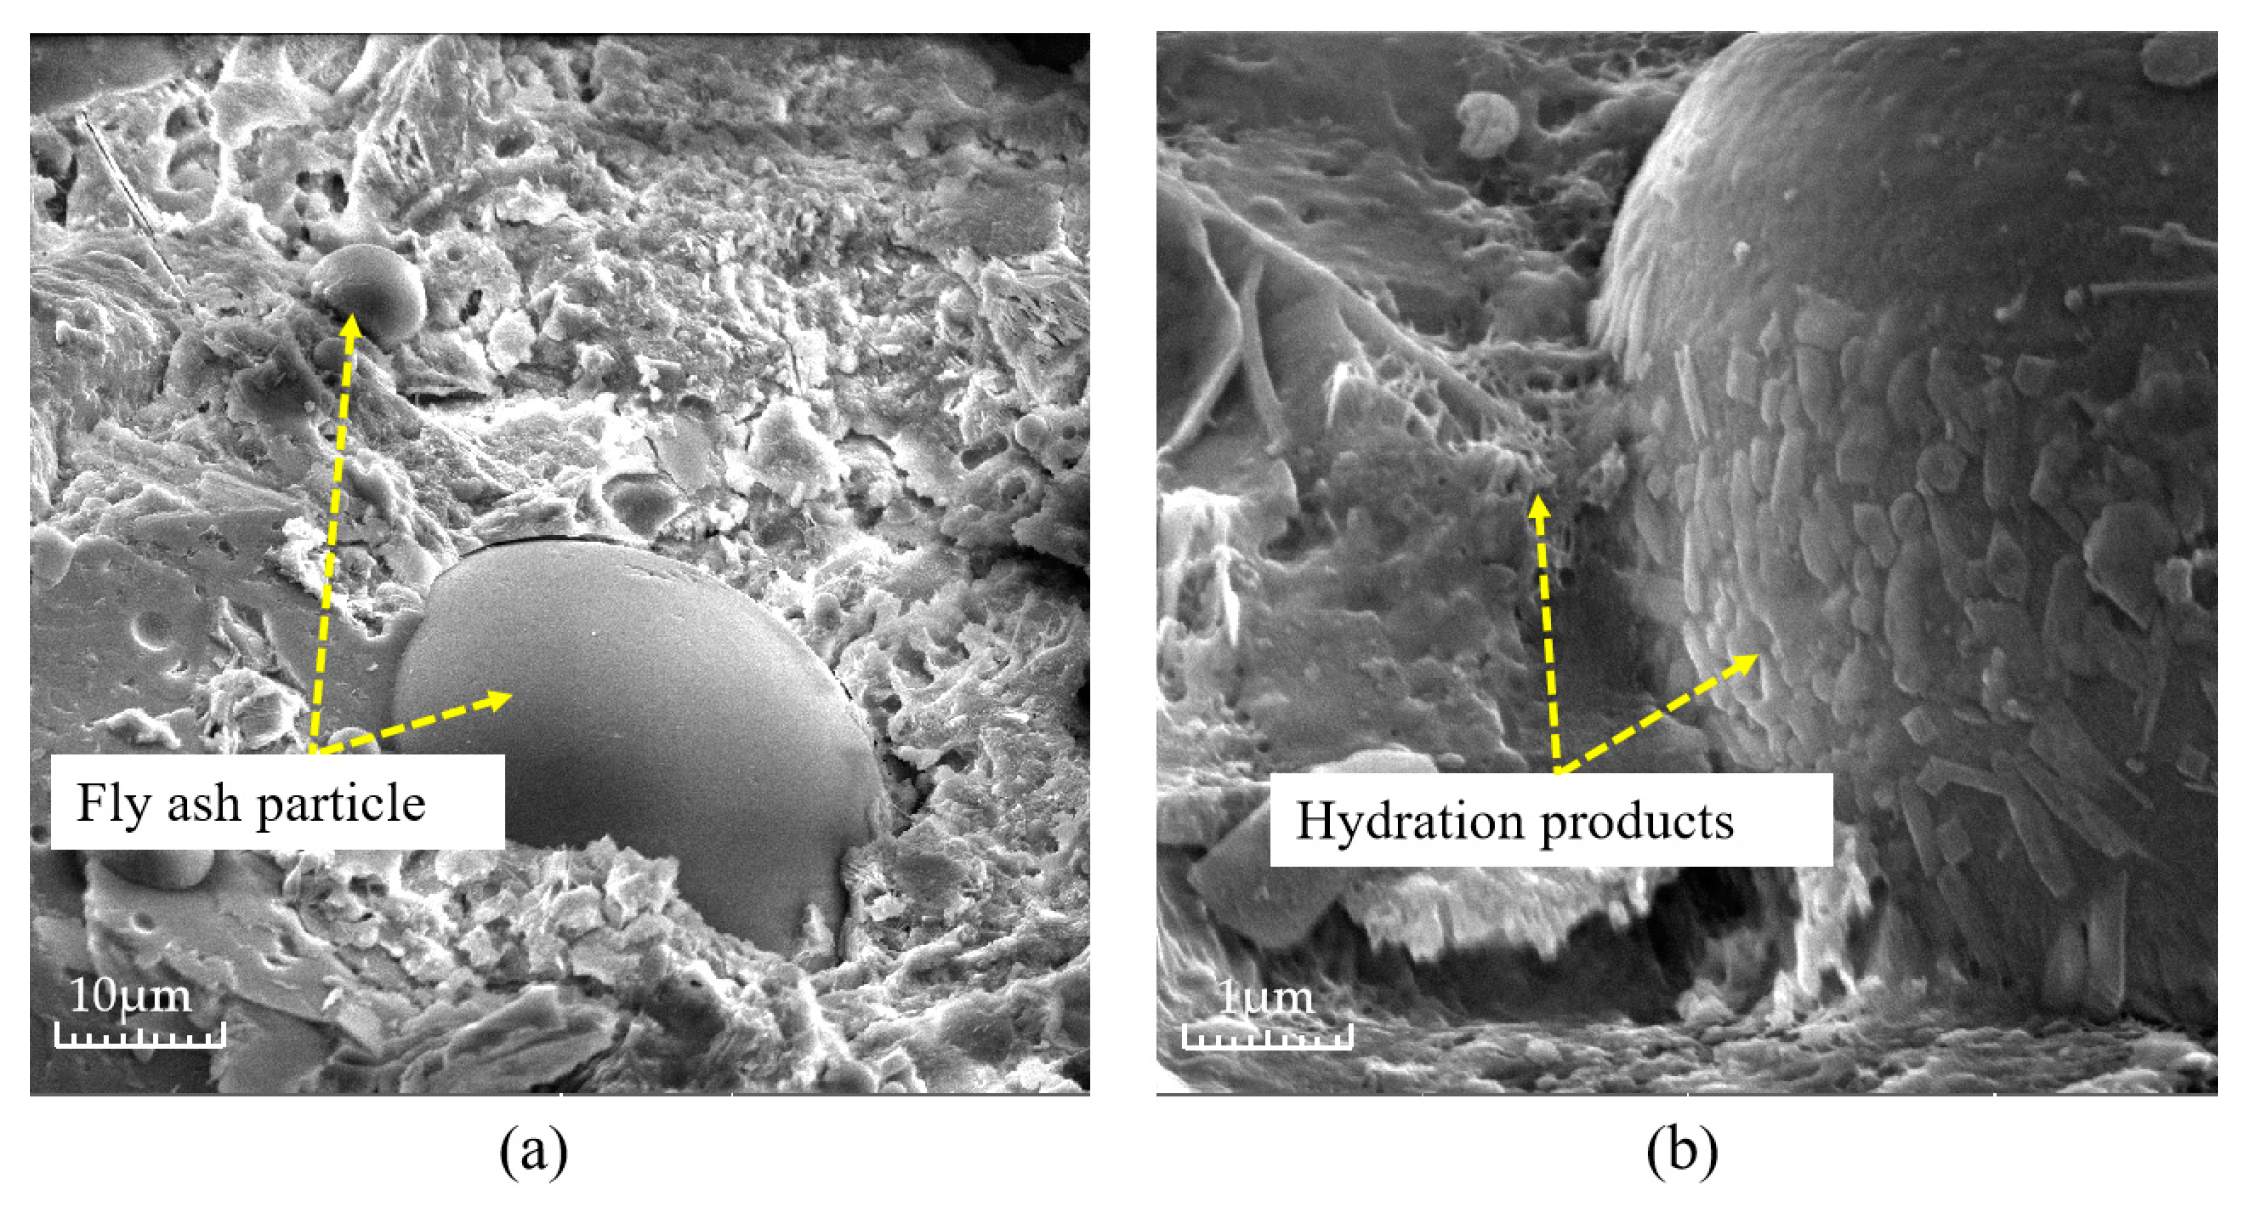
Figure 12.
Microstructure of fly ash in the cemented layer: (a) 10 μm and (b) 1 μm.
Figure 12.
Microstructure of fly ash in the cemented layer: (a) 10 μm and (b) 1 μm.
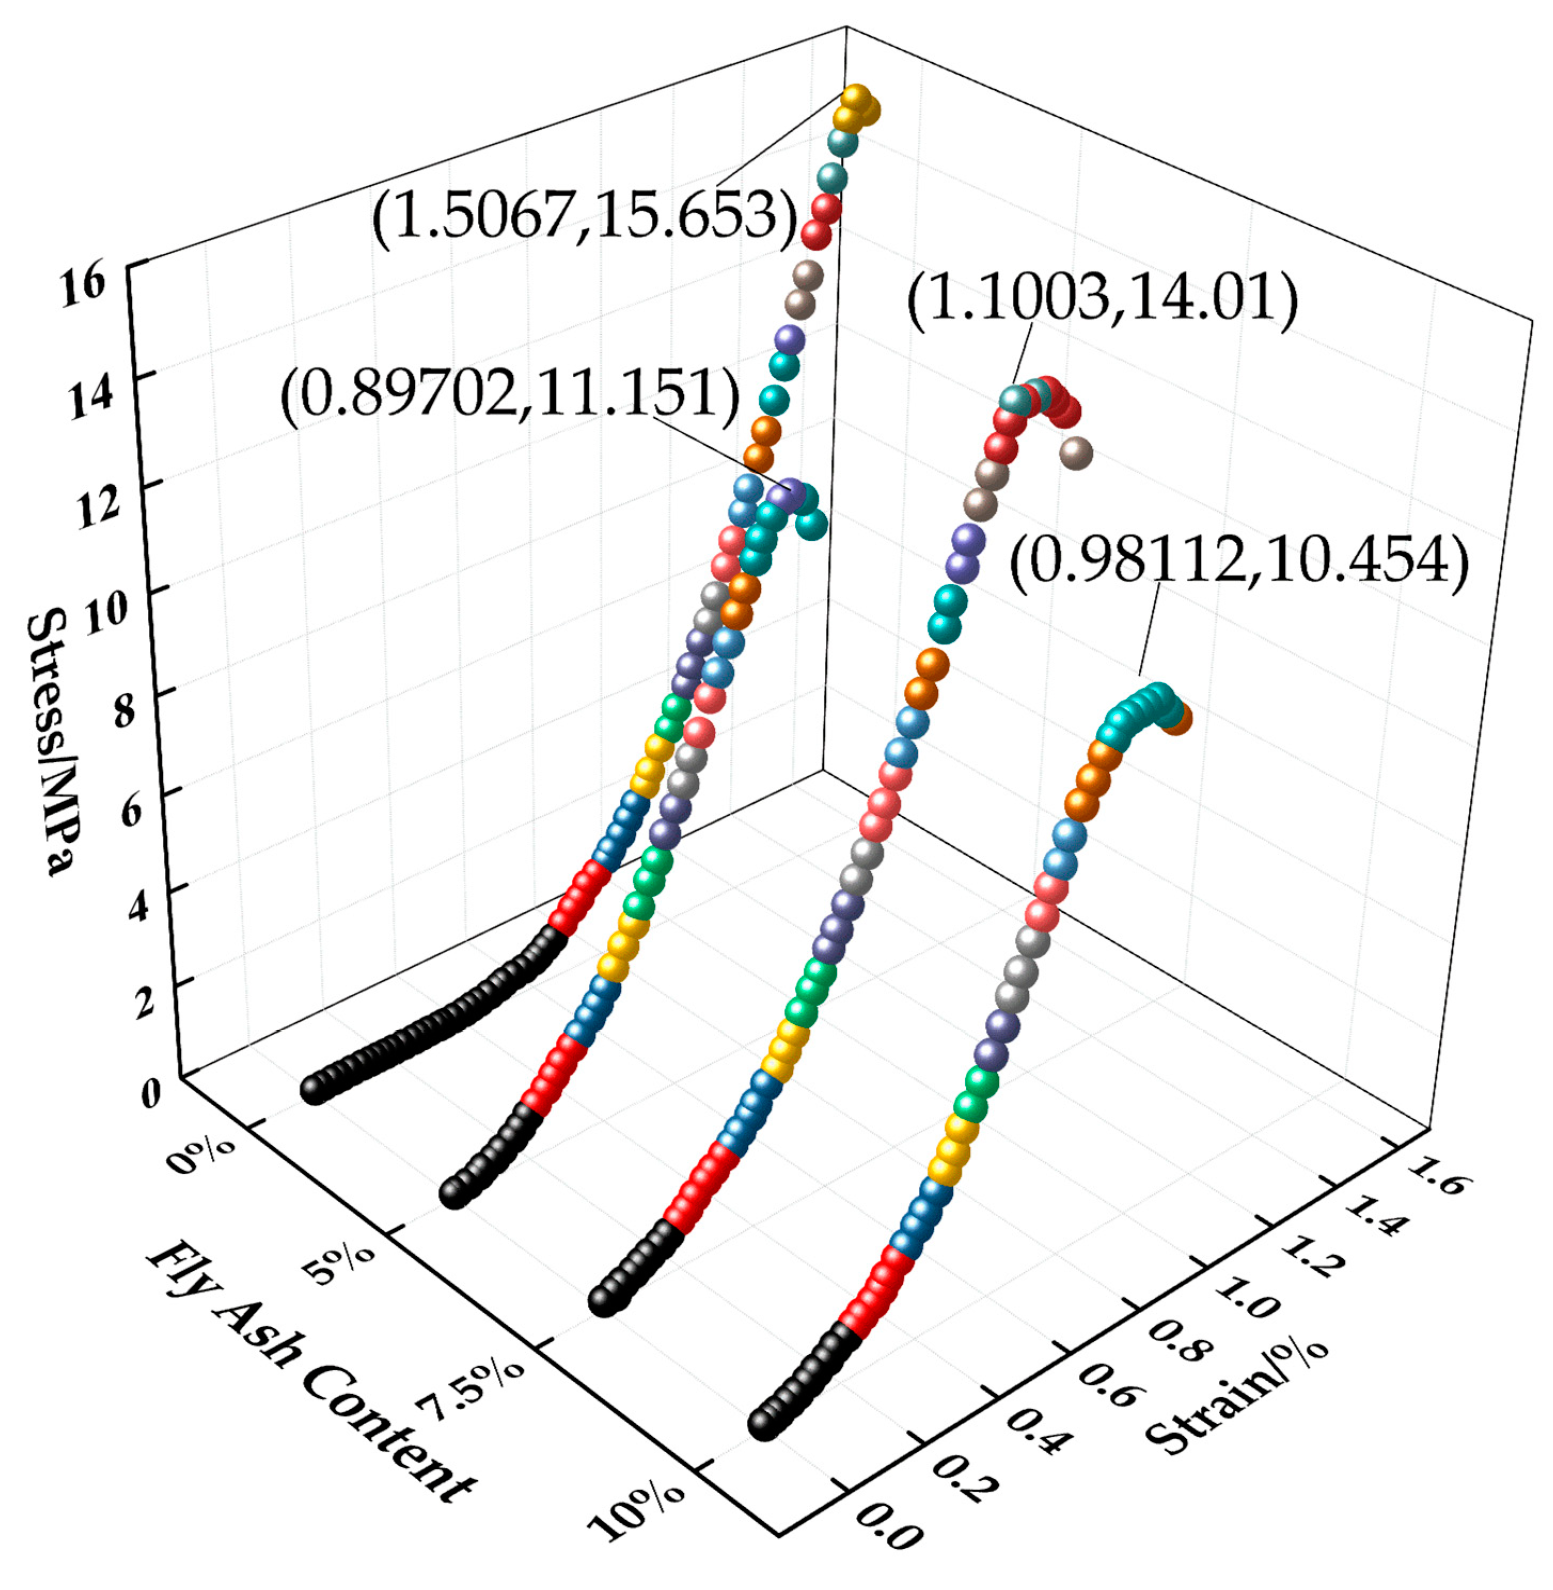
Figure 13.
Stress–strain relationship curve of the test block under different fly ash content values.
Figure 13.
Stress–strain relationship curve of the test block under different fly ash content values.
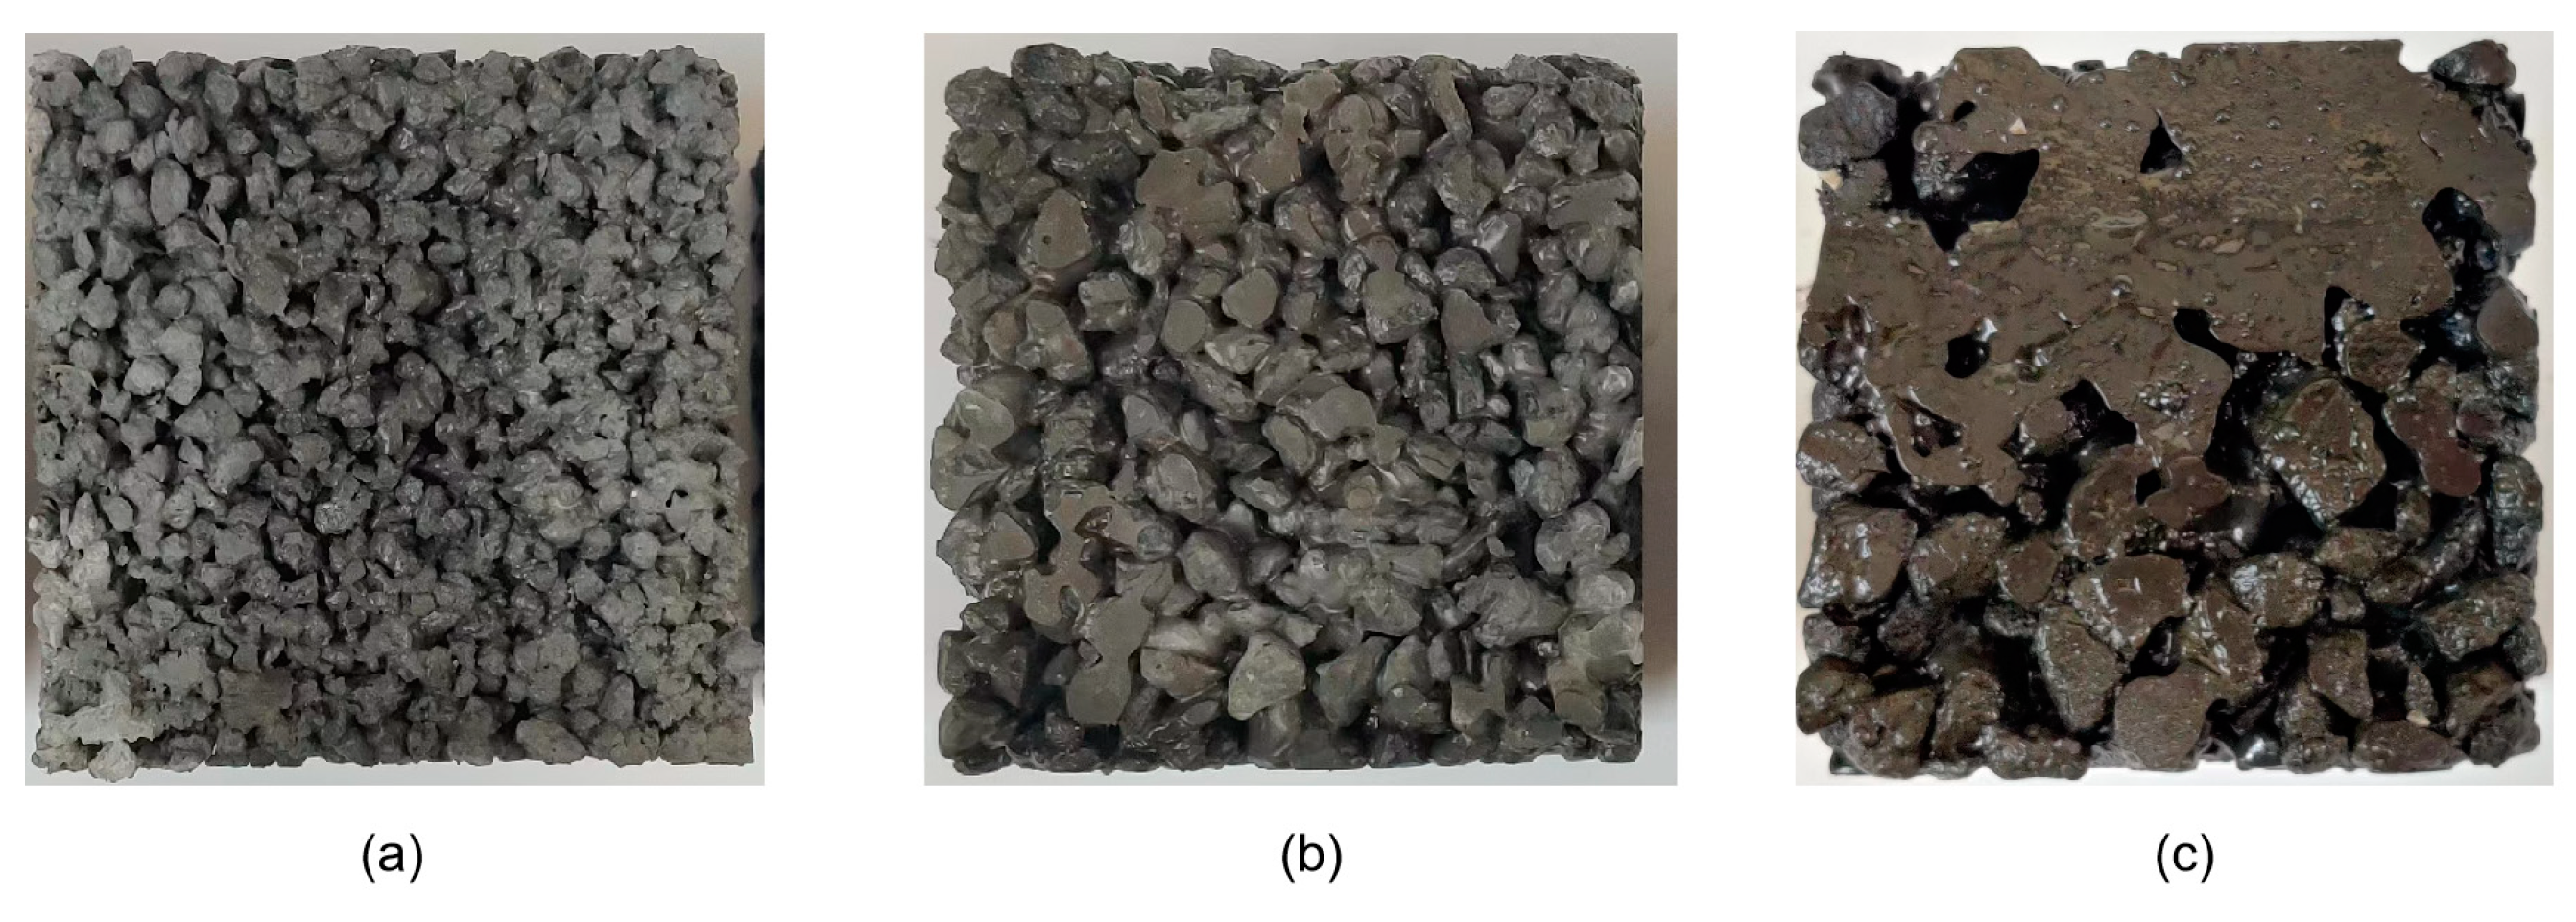
Figure 14.
Photos of the bottom of the permeable concrete surface with different aggregate sizes: (a) 3–5 mm; (b) 5–10 mm; and (c) 10–15 mm.
Figure 14.
Photos of the bottom of the permeable concrete surface with different aggregate sizes: (a) 3–5 mm; (b) 5–10 mm; and (c) 10–15 mm.
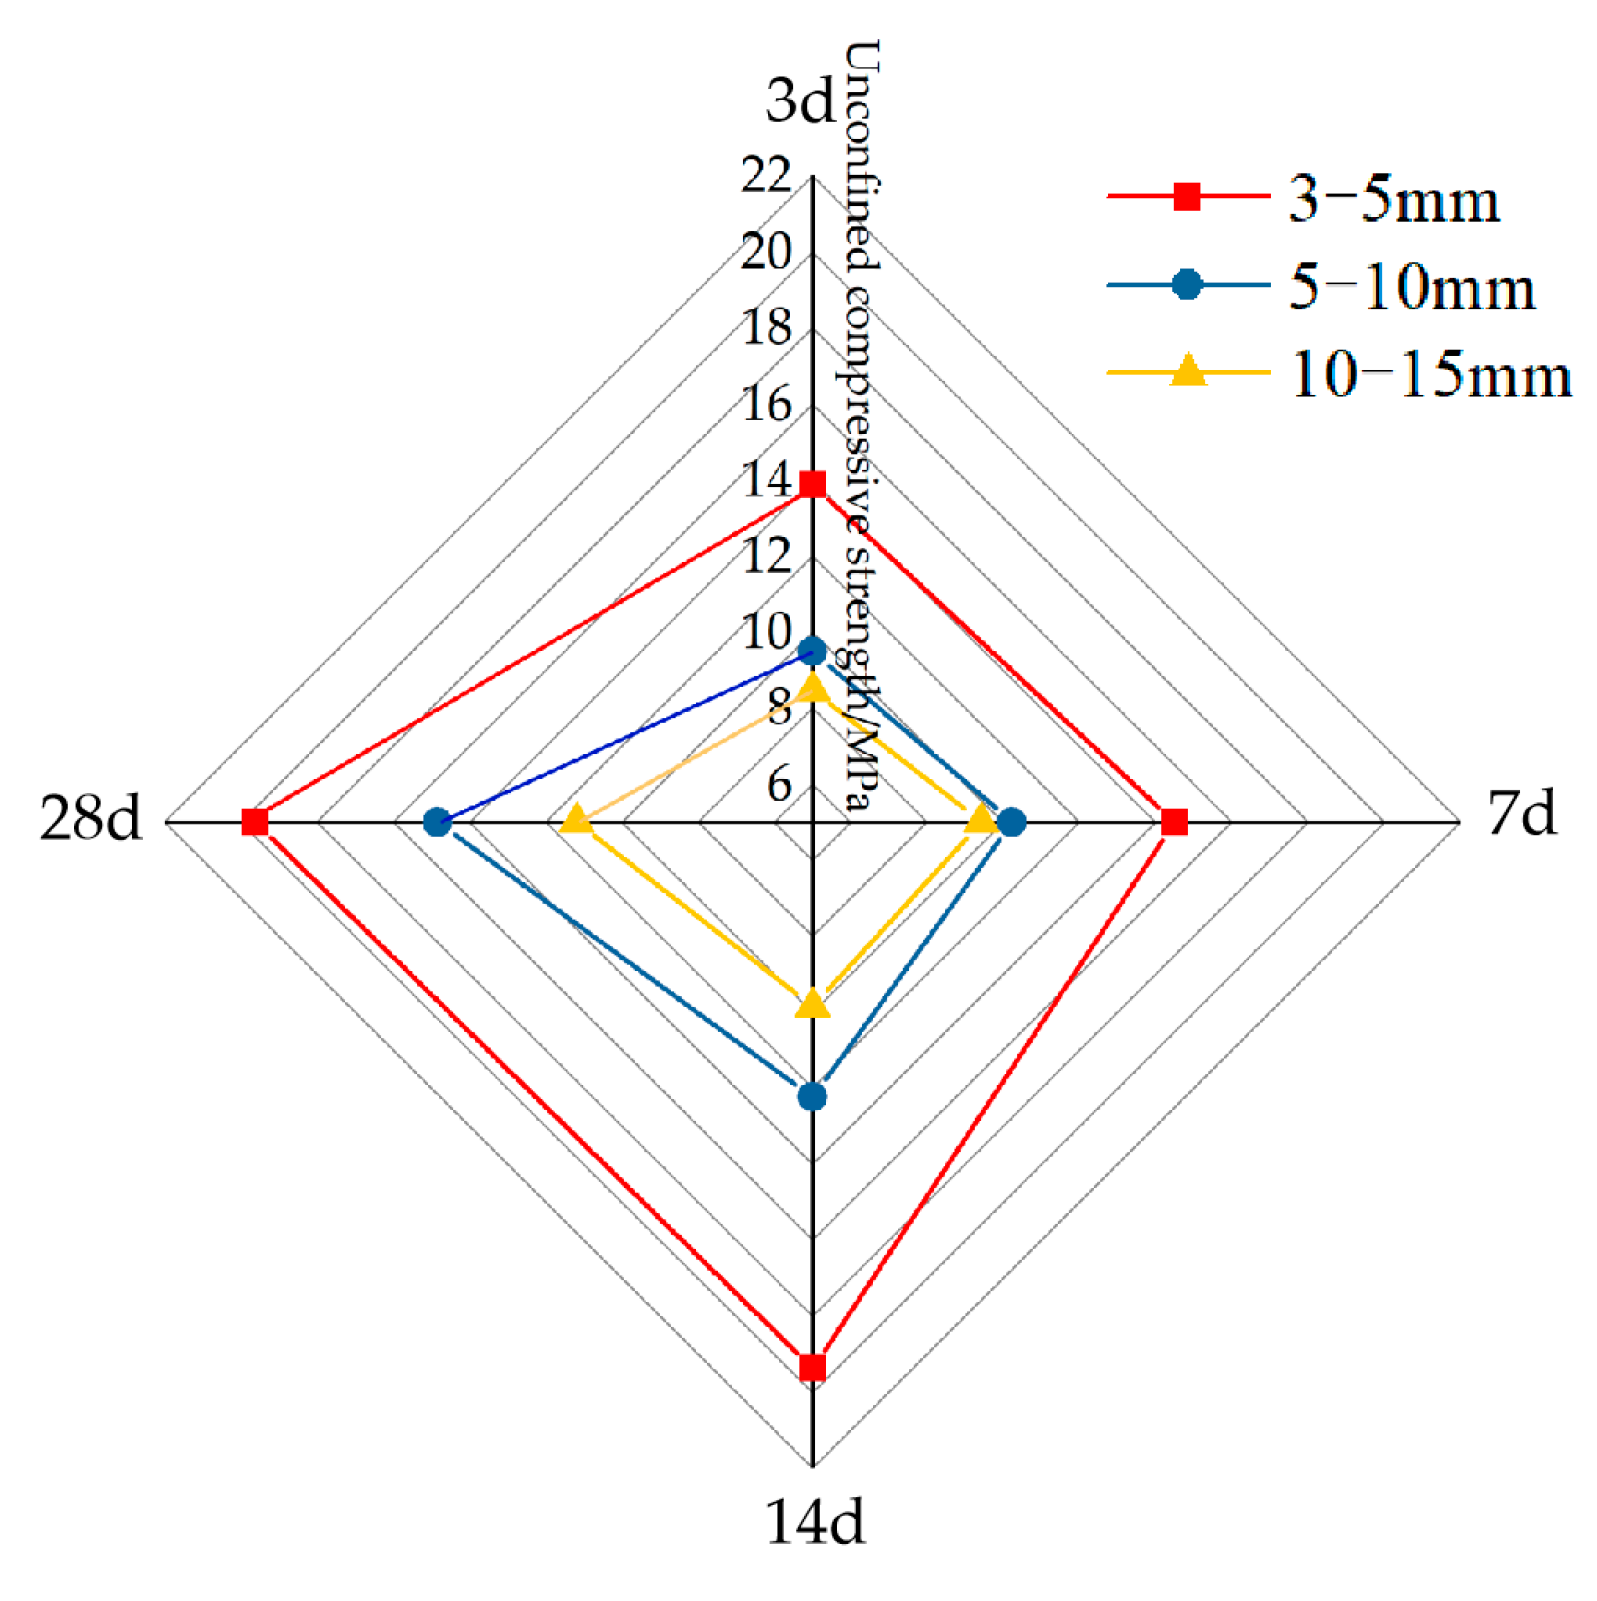
Figure 15.
Strength of permeability concrete specimens with different aggregate sizes at different curing ages.
Figure 15.
Strength of permeability concrete specimens with different aggregate sizes at different curing ages.
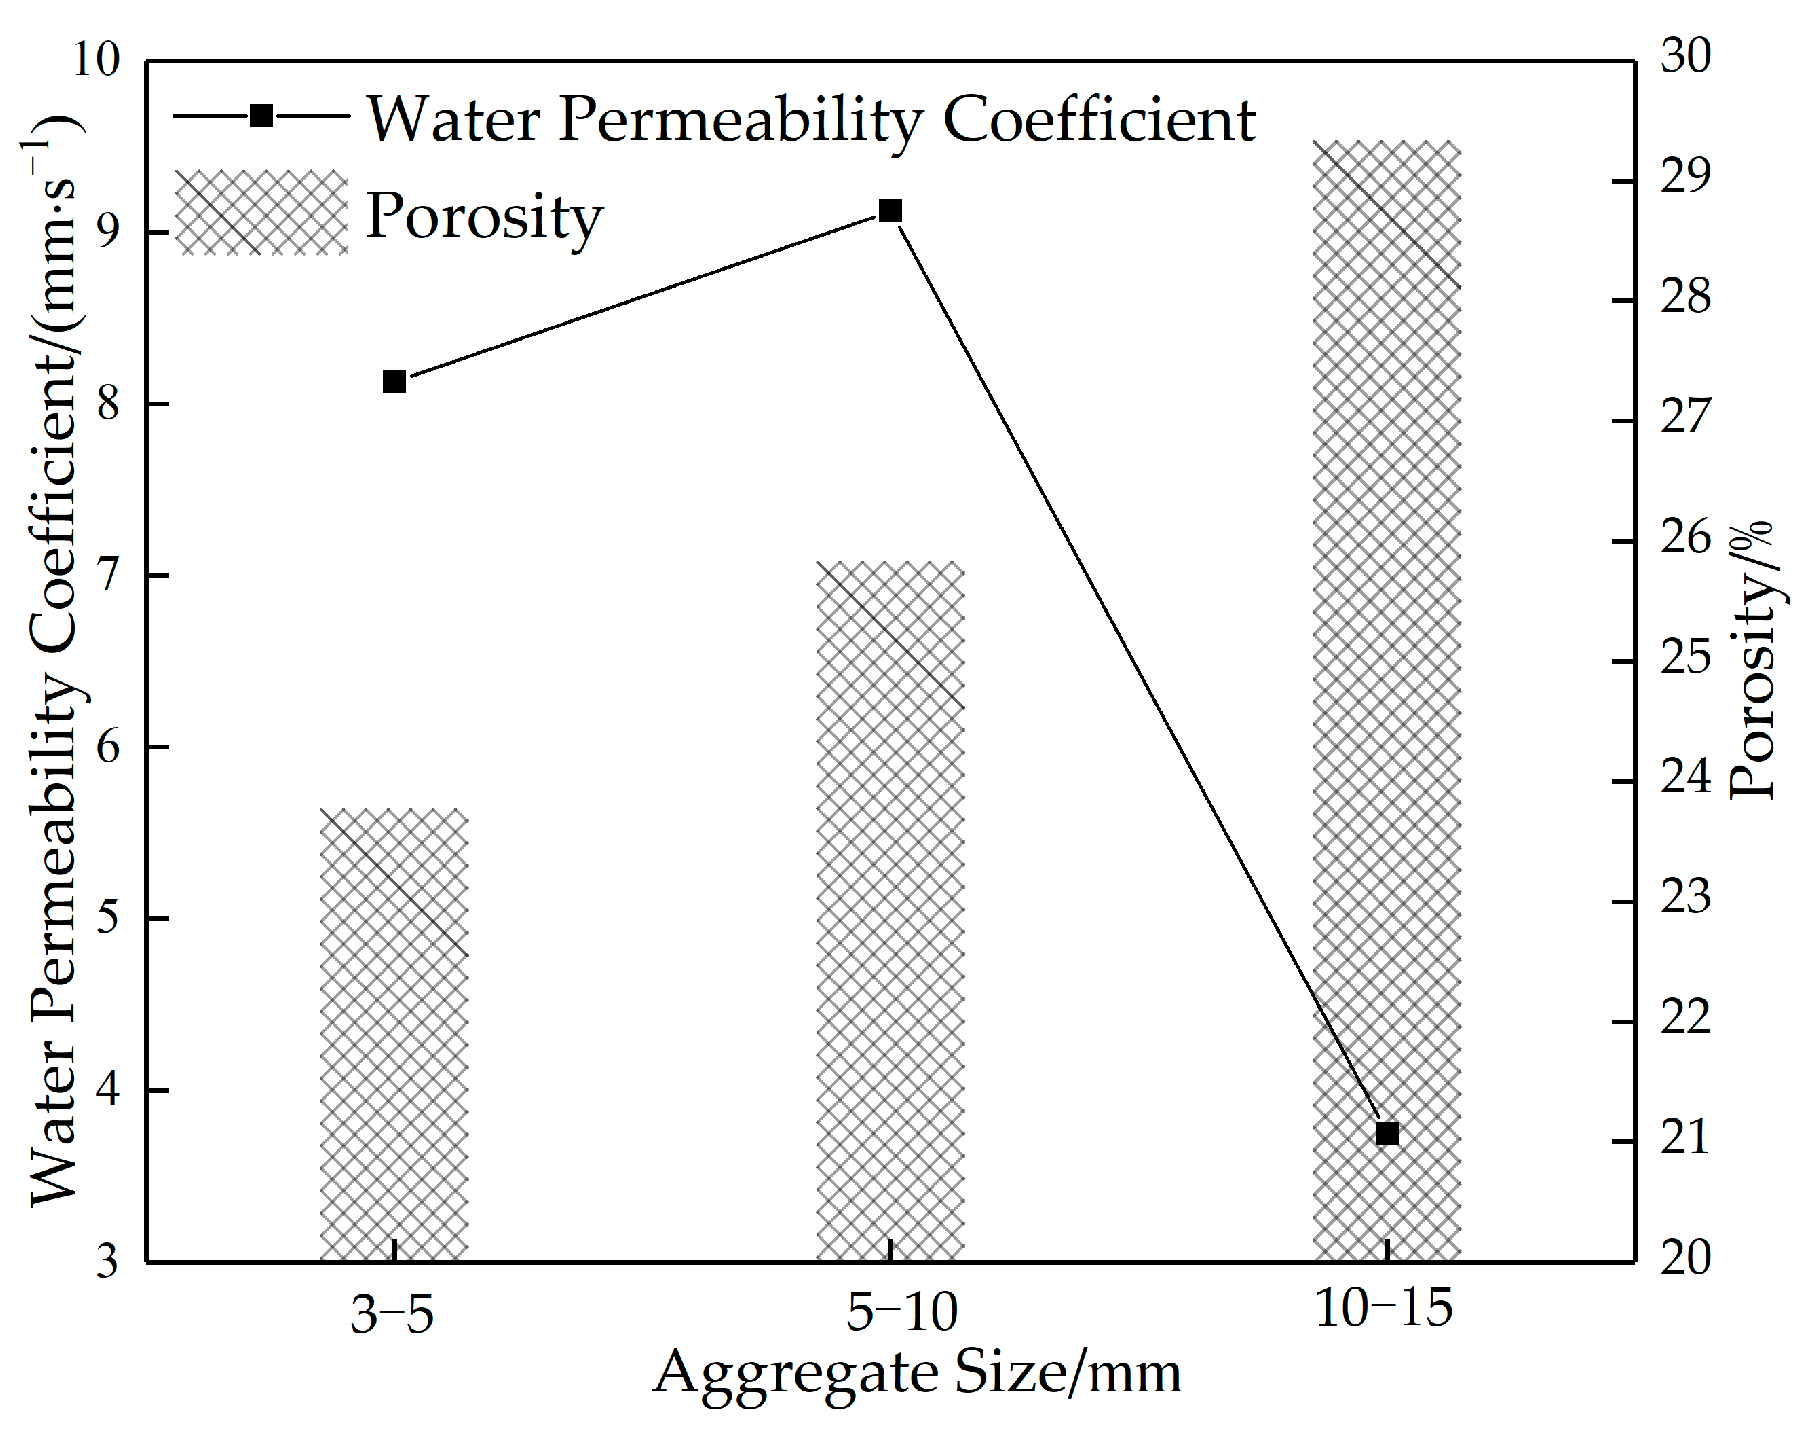
Figure 16.
Plot of porosity versus water permeability coefficient of permeable concrete specimens with different aggregate particle sizes.
Figure 16.
Plot of porosity versus water permeability coefficient of permeable concrete specimens with different aggregate particle sizes.
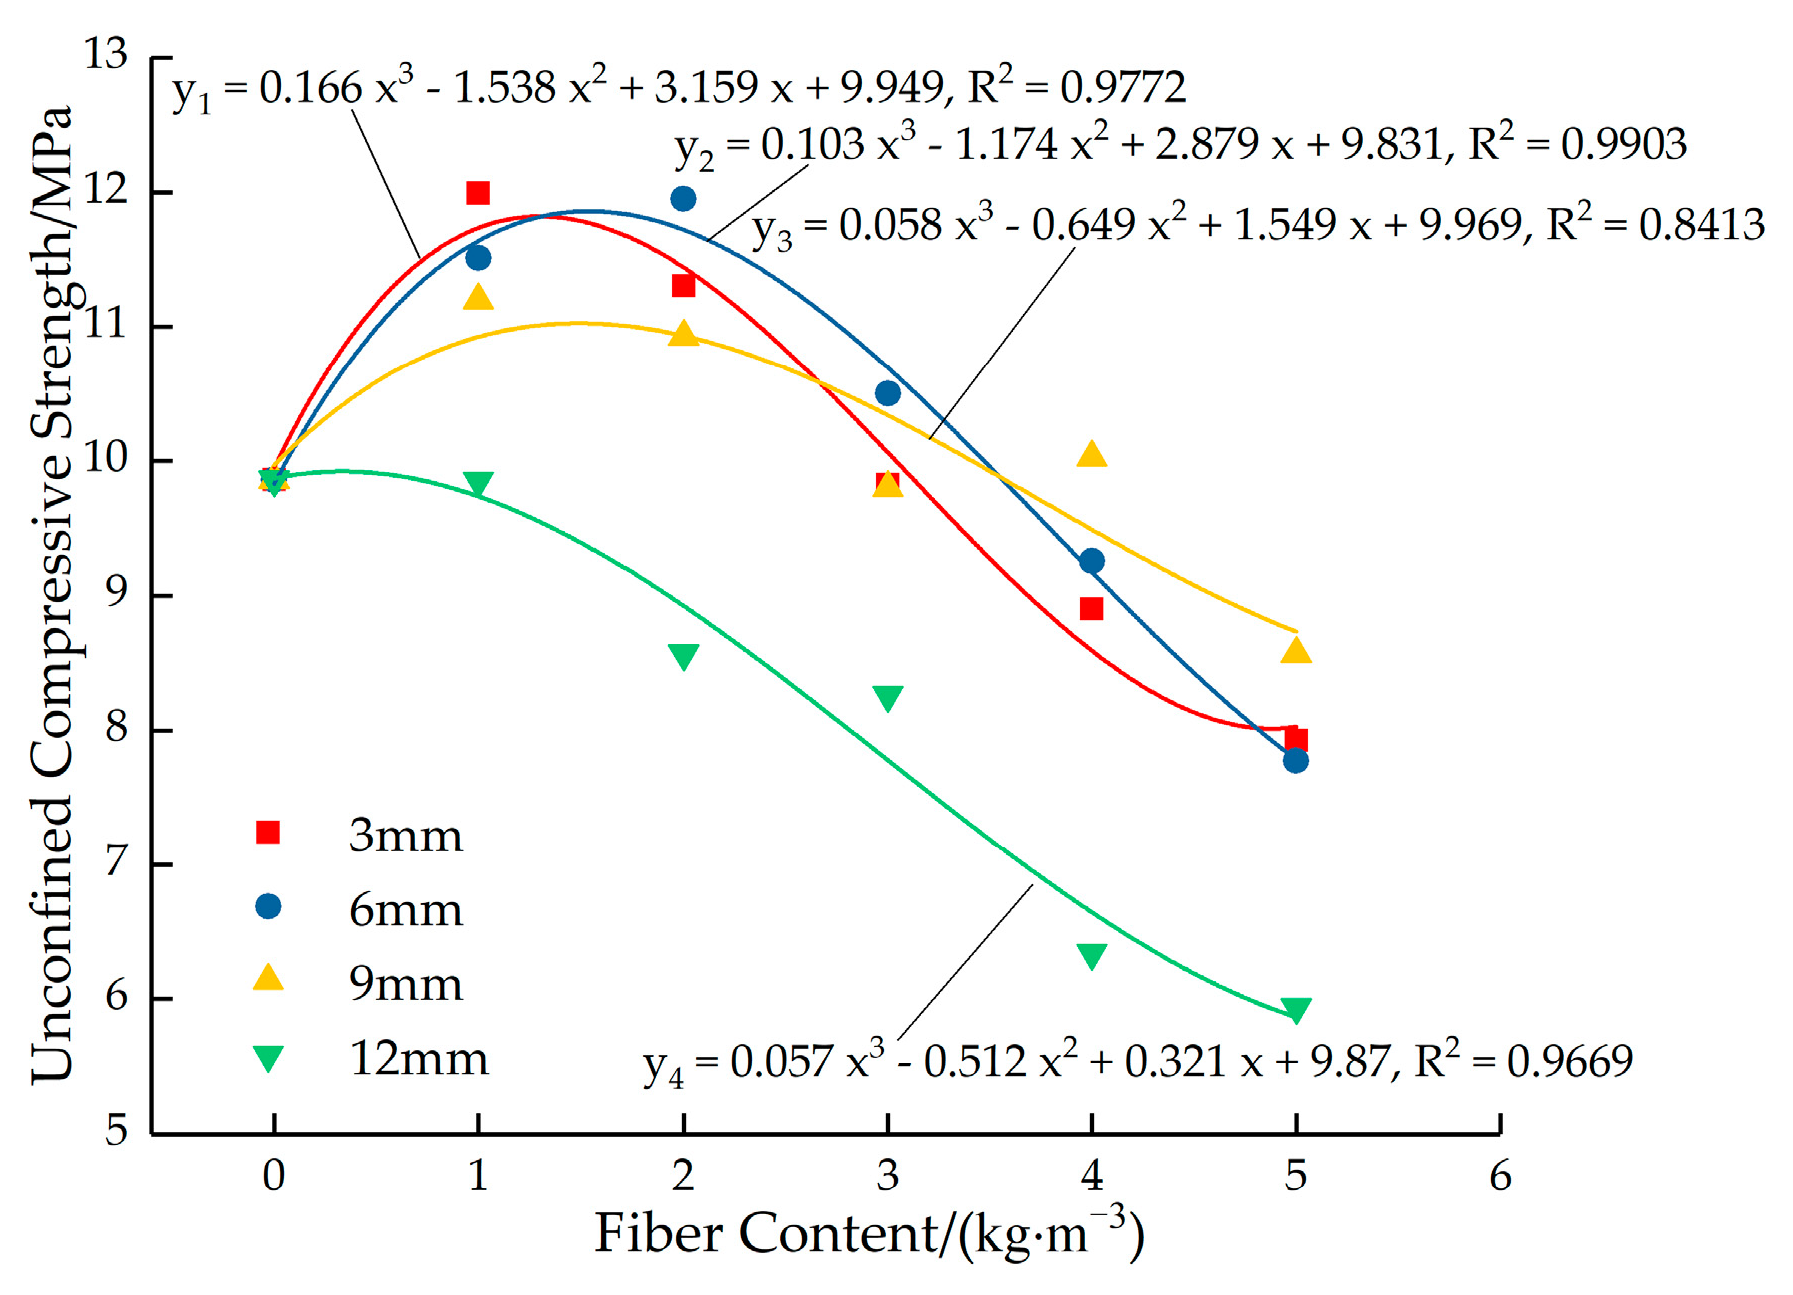
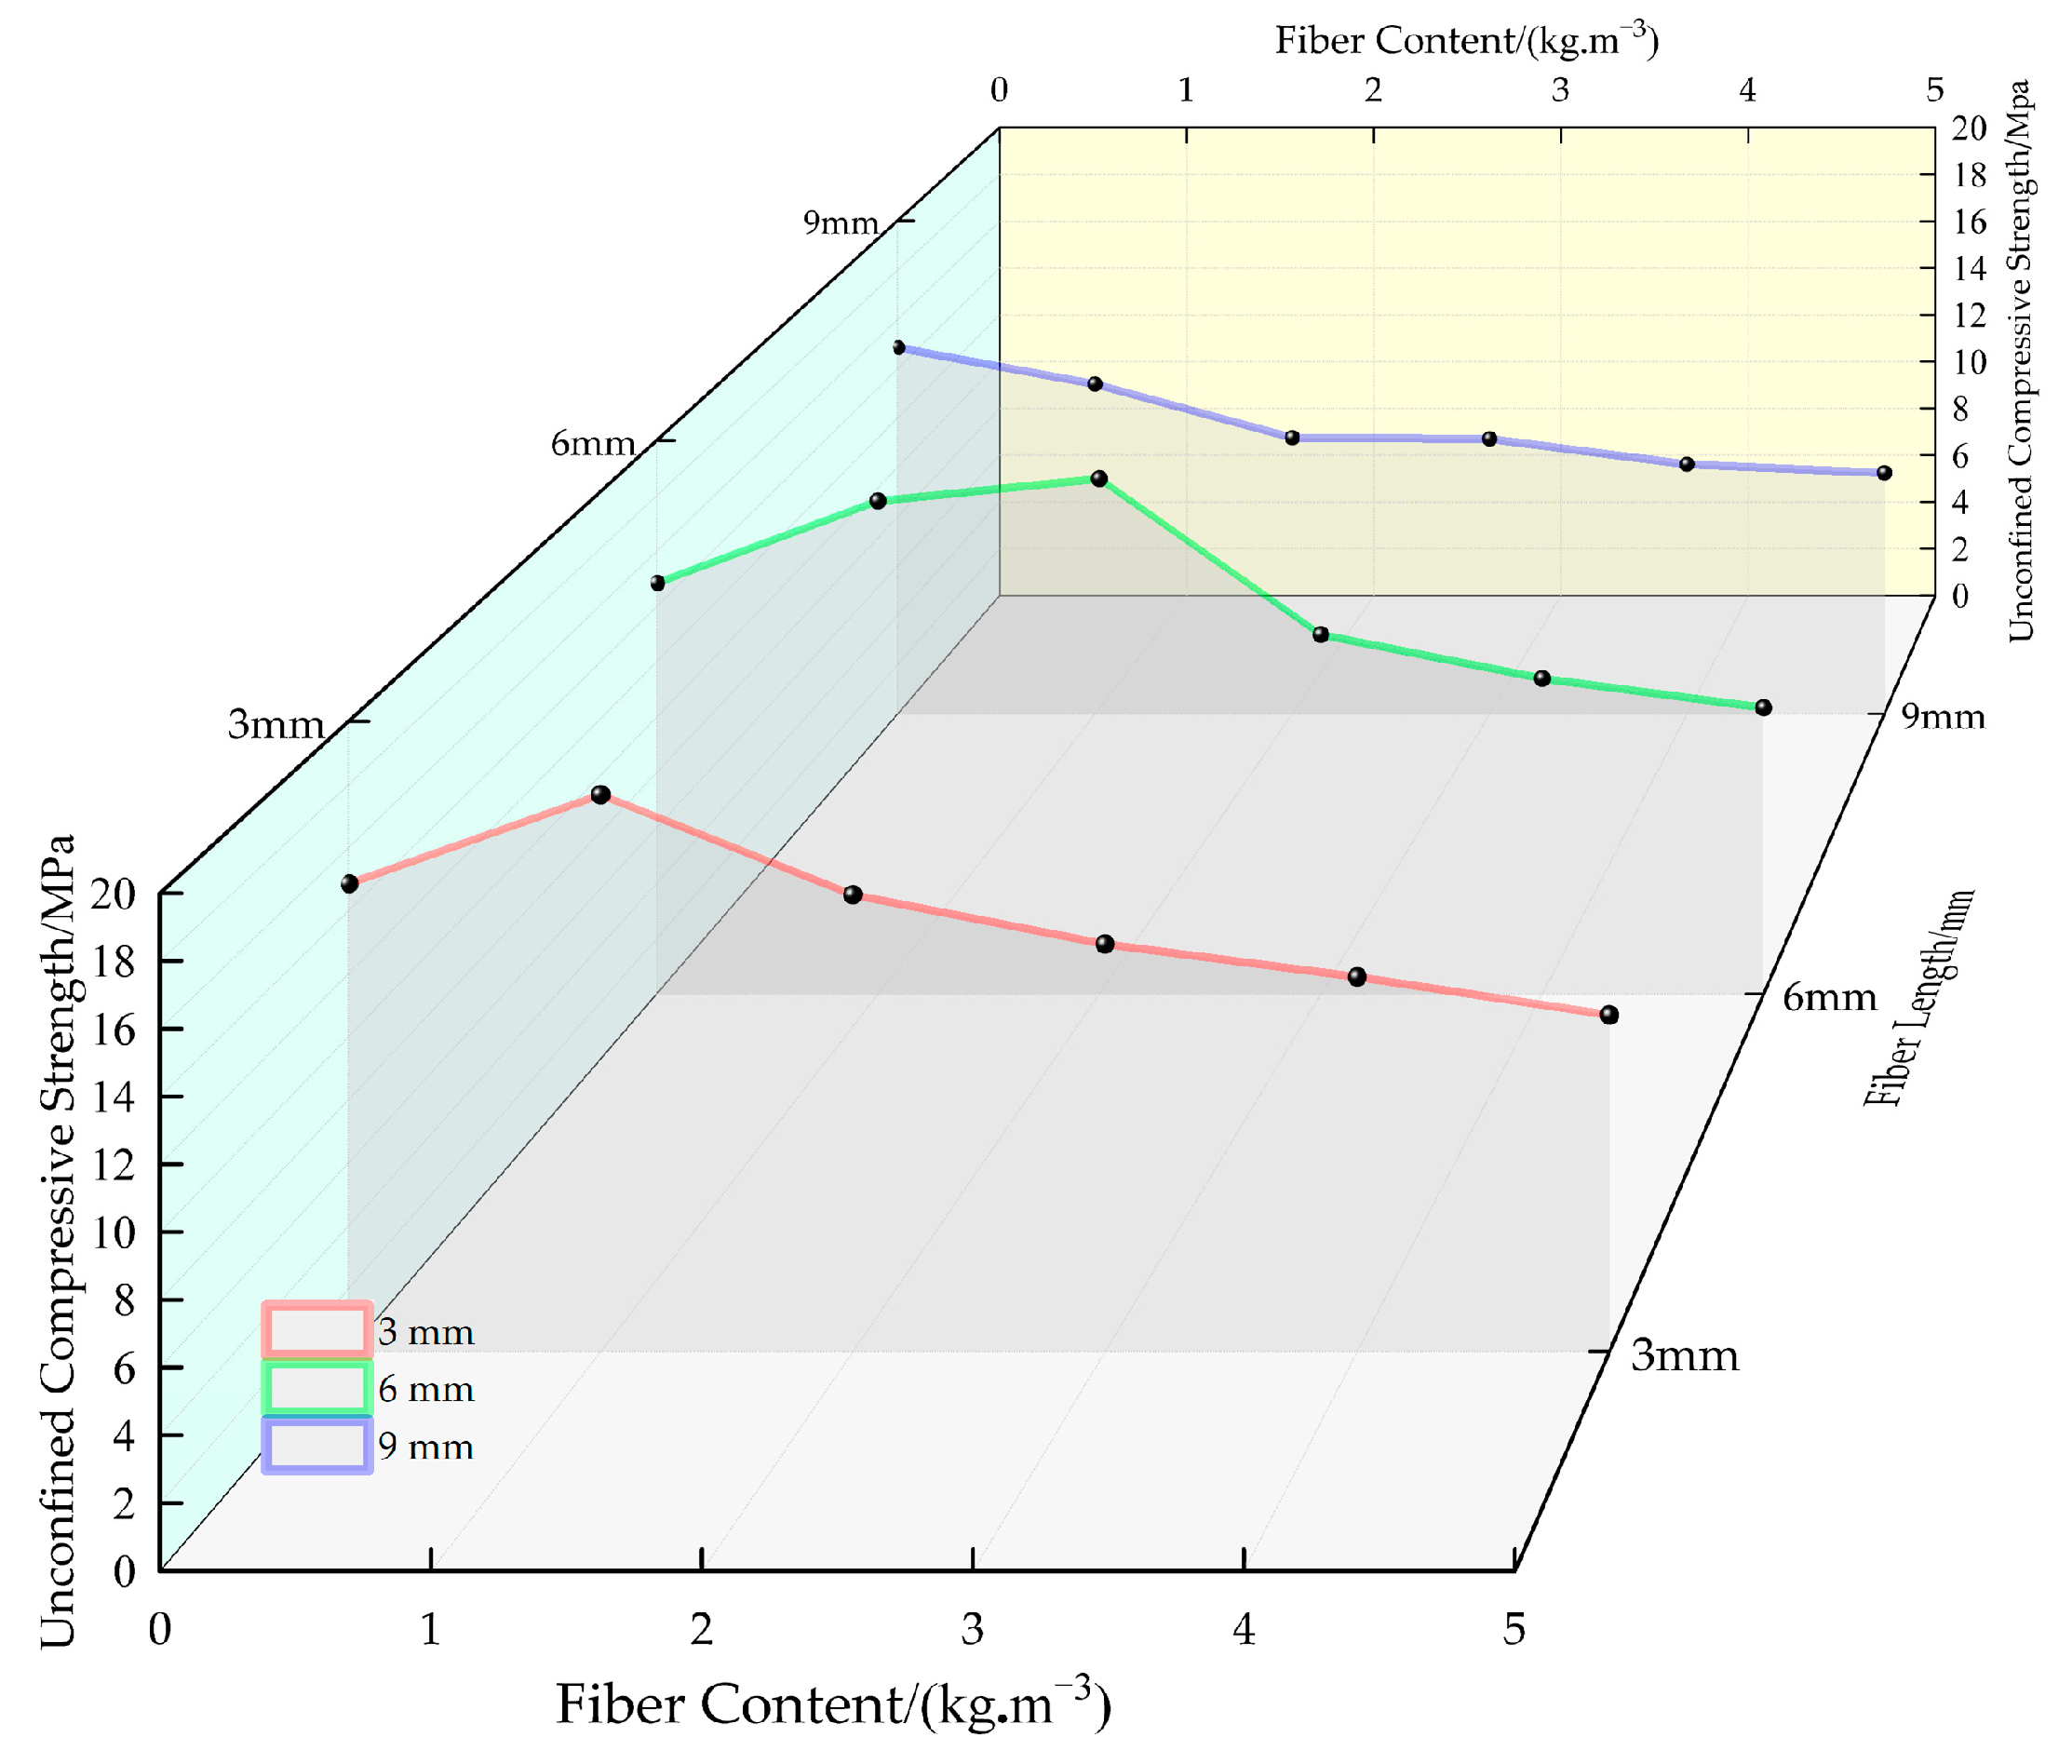
Figure 17.
Fitted curves for the variation in the peak strength of permeable concrete with fiber content for different fiber lengths (7 days).
Figure 17.
Fitted curves for the variation in the peak strength of permeable concrete with fiber content for different fiber lengths (7 days).
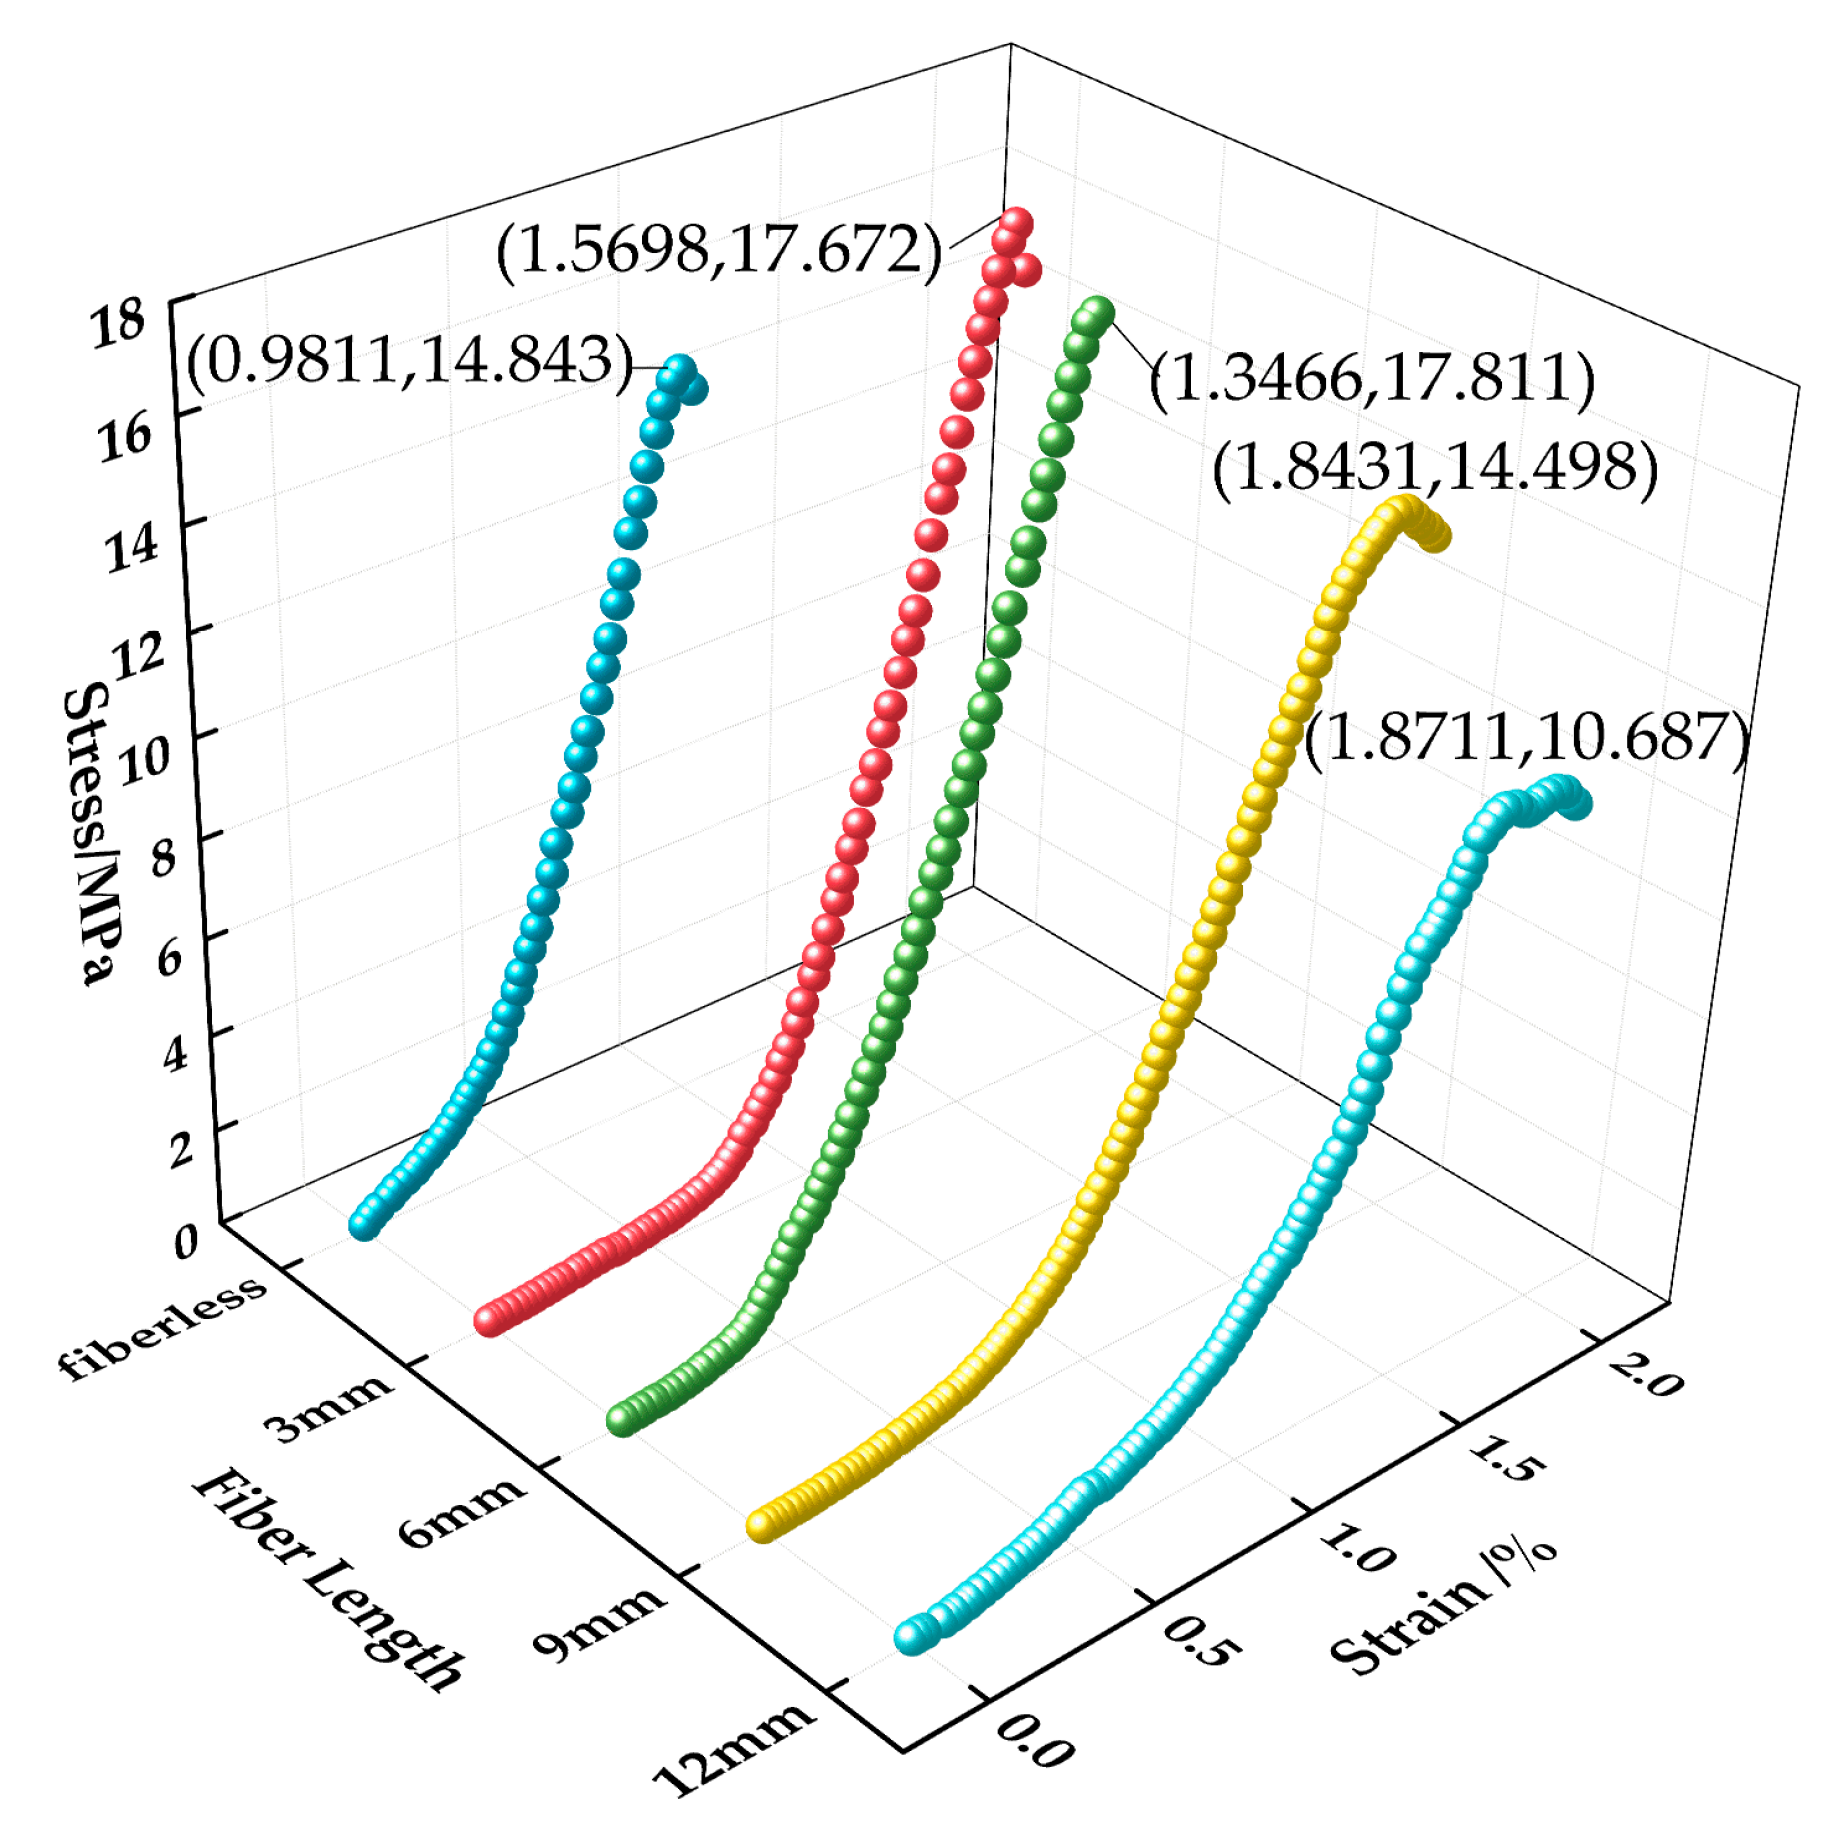
Figure 18.
Stress–strain relationship curves of permeable concrete with different fiber lengths (1 kg/m3).
Figure 18.
Stress–strain relationship curves of permeable concrete with different fiber lengths (1 kg/m3).
Figure 19.
Diagram of different lengths of fibers acting inside the test block: (a) 3 mm, (b) 6 mm, (c) 9 mm, and 12 mm.
Figure 19.
Diagram of different lengths of fibers acting inside the test block: (a) 3 mm, (b) 6 mm, (c) 9 mm, and 12 mm.
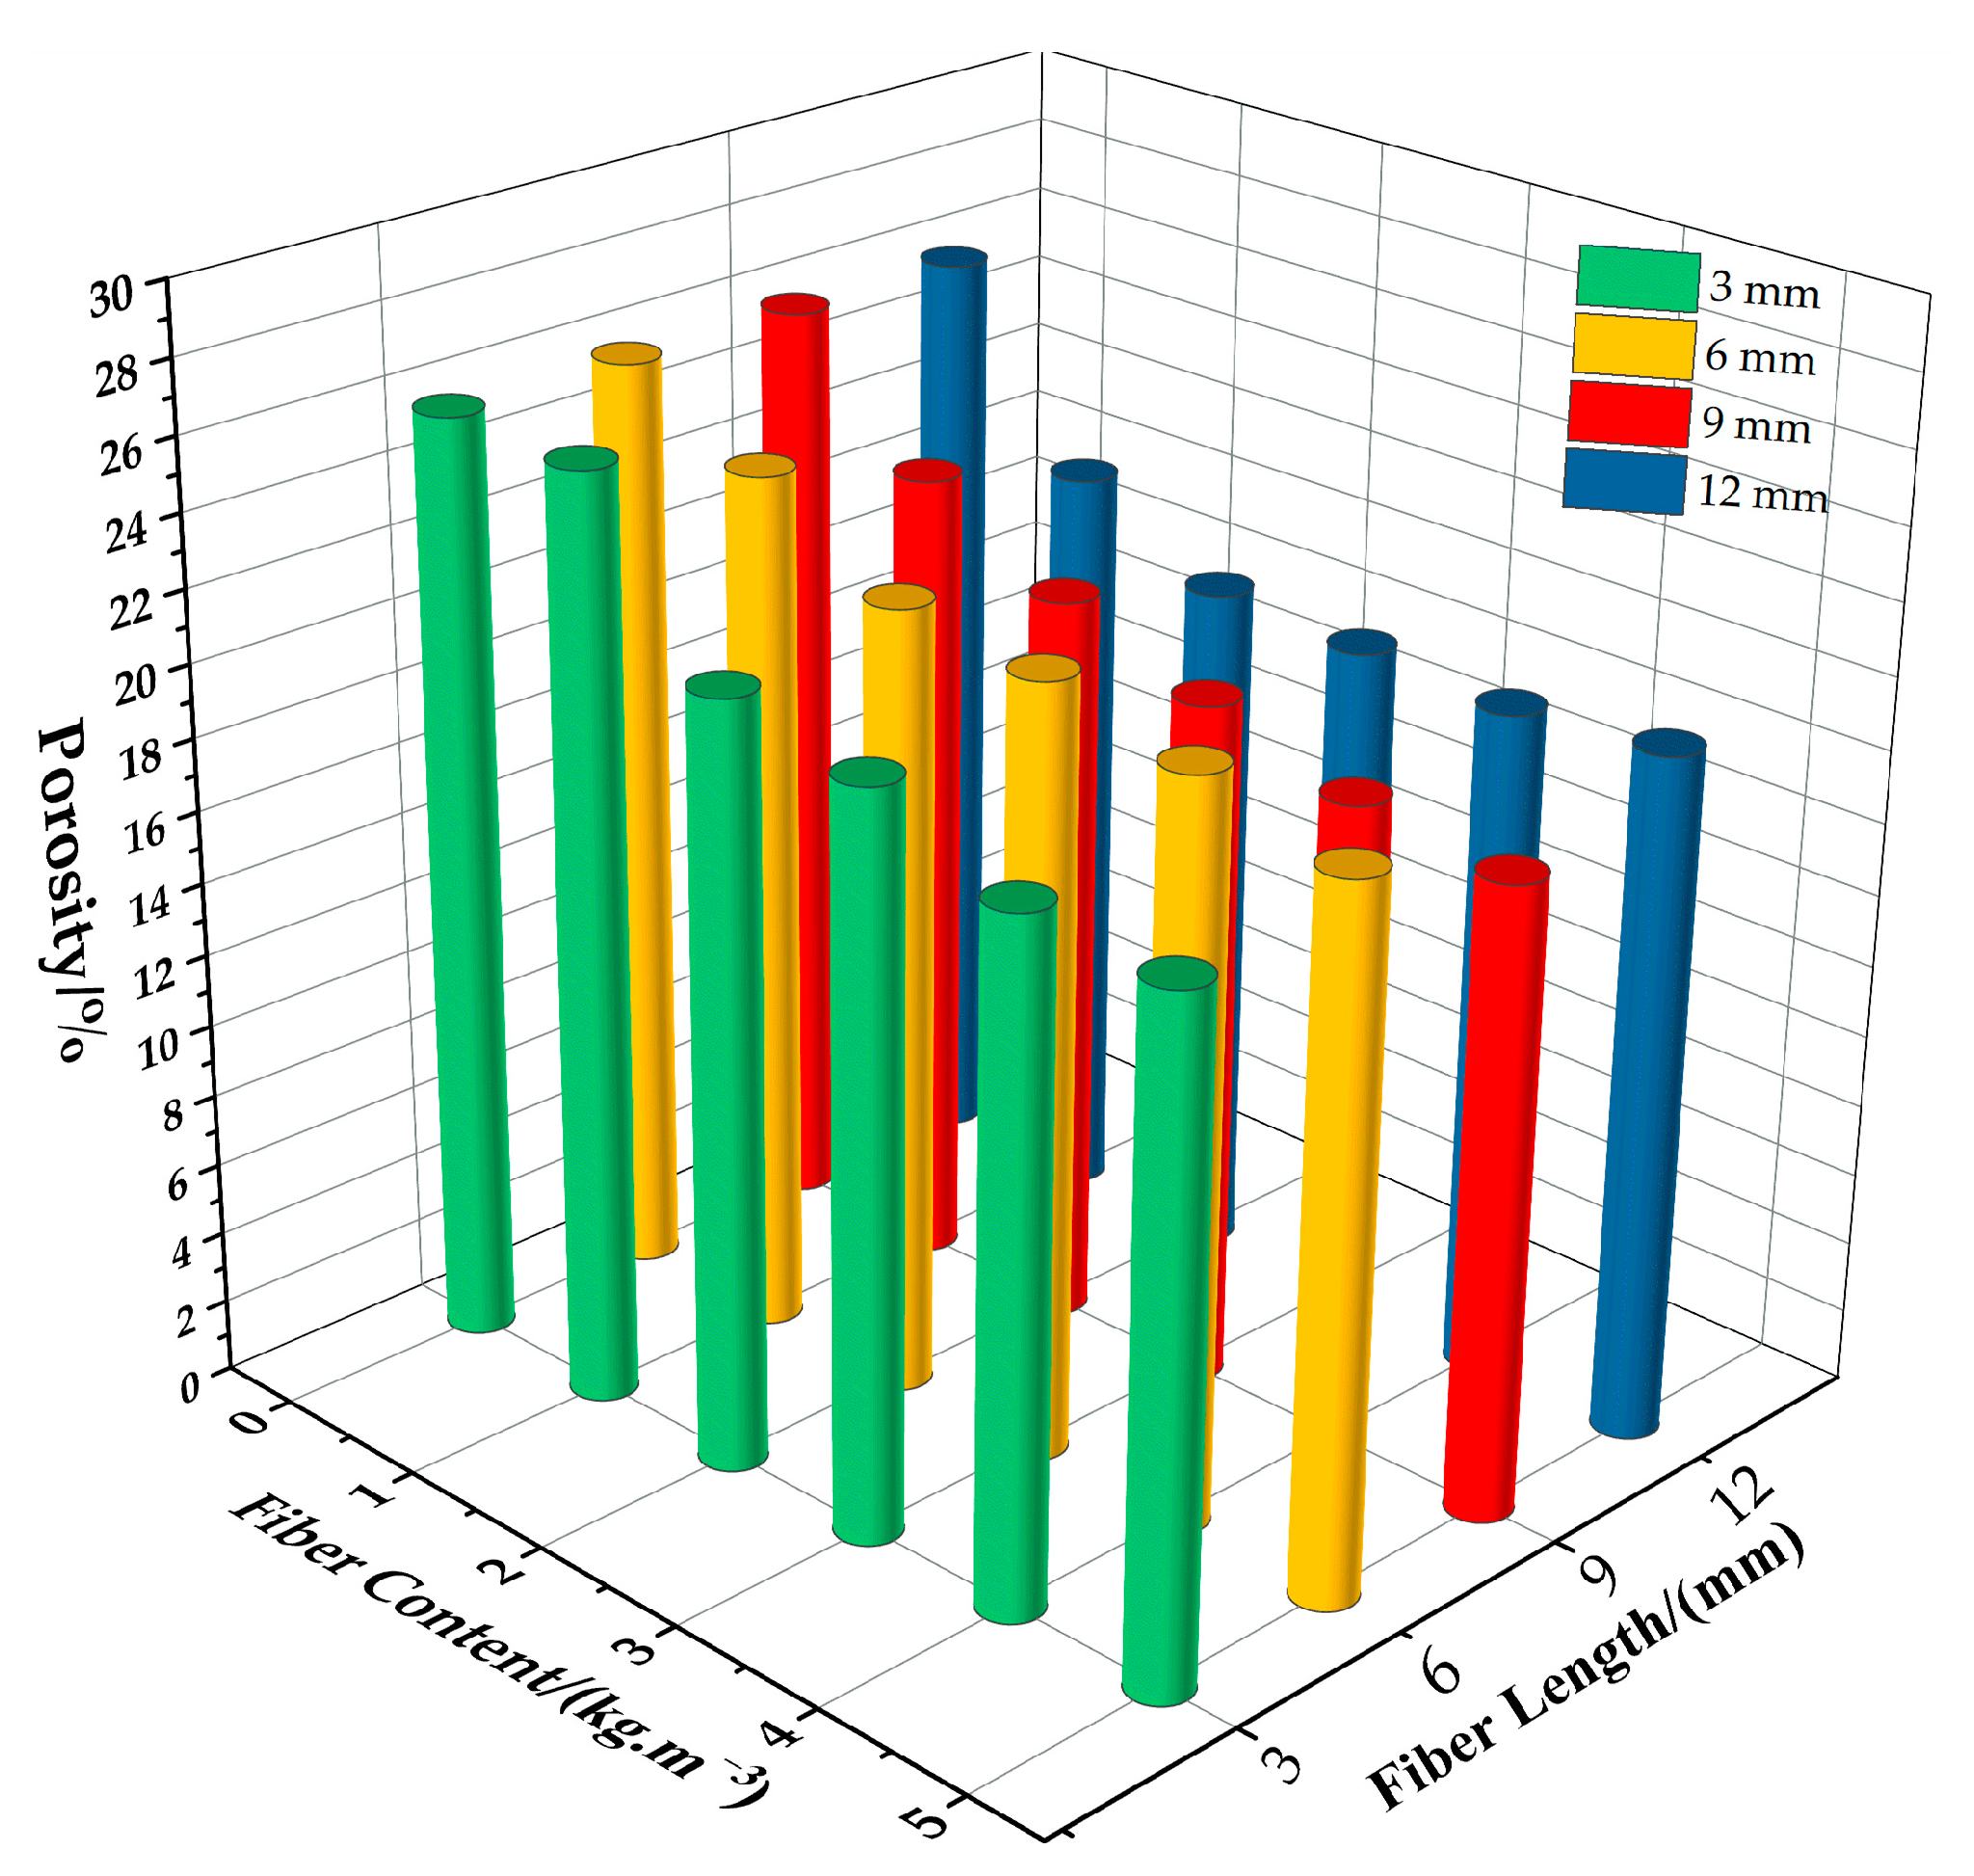
Figure 20.
Relationship between changes in the porosity of permeable concrete and fiber dosage for different fiber lengths.
Figure 20.
Relationship between changes in the porosity of permeable concrete and fiber dosage for different fiber lengths.
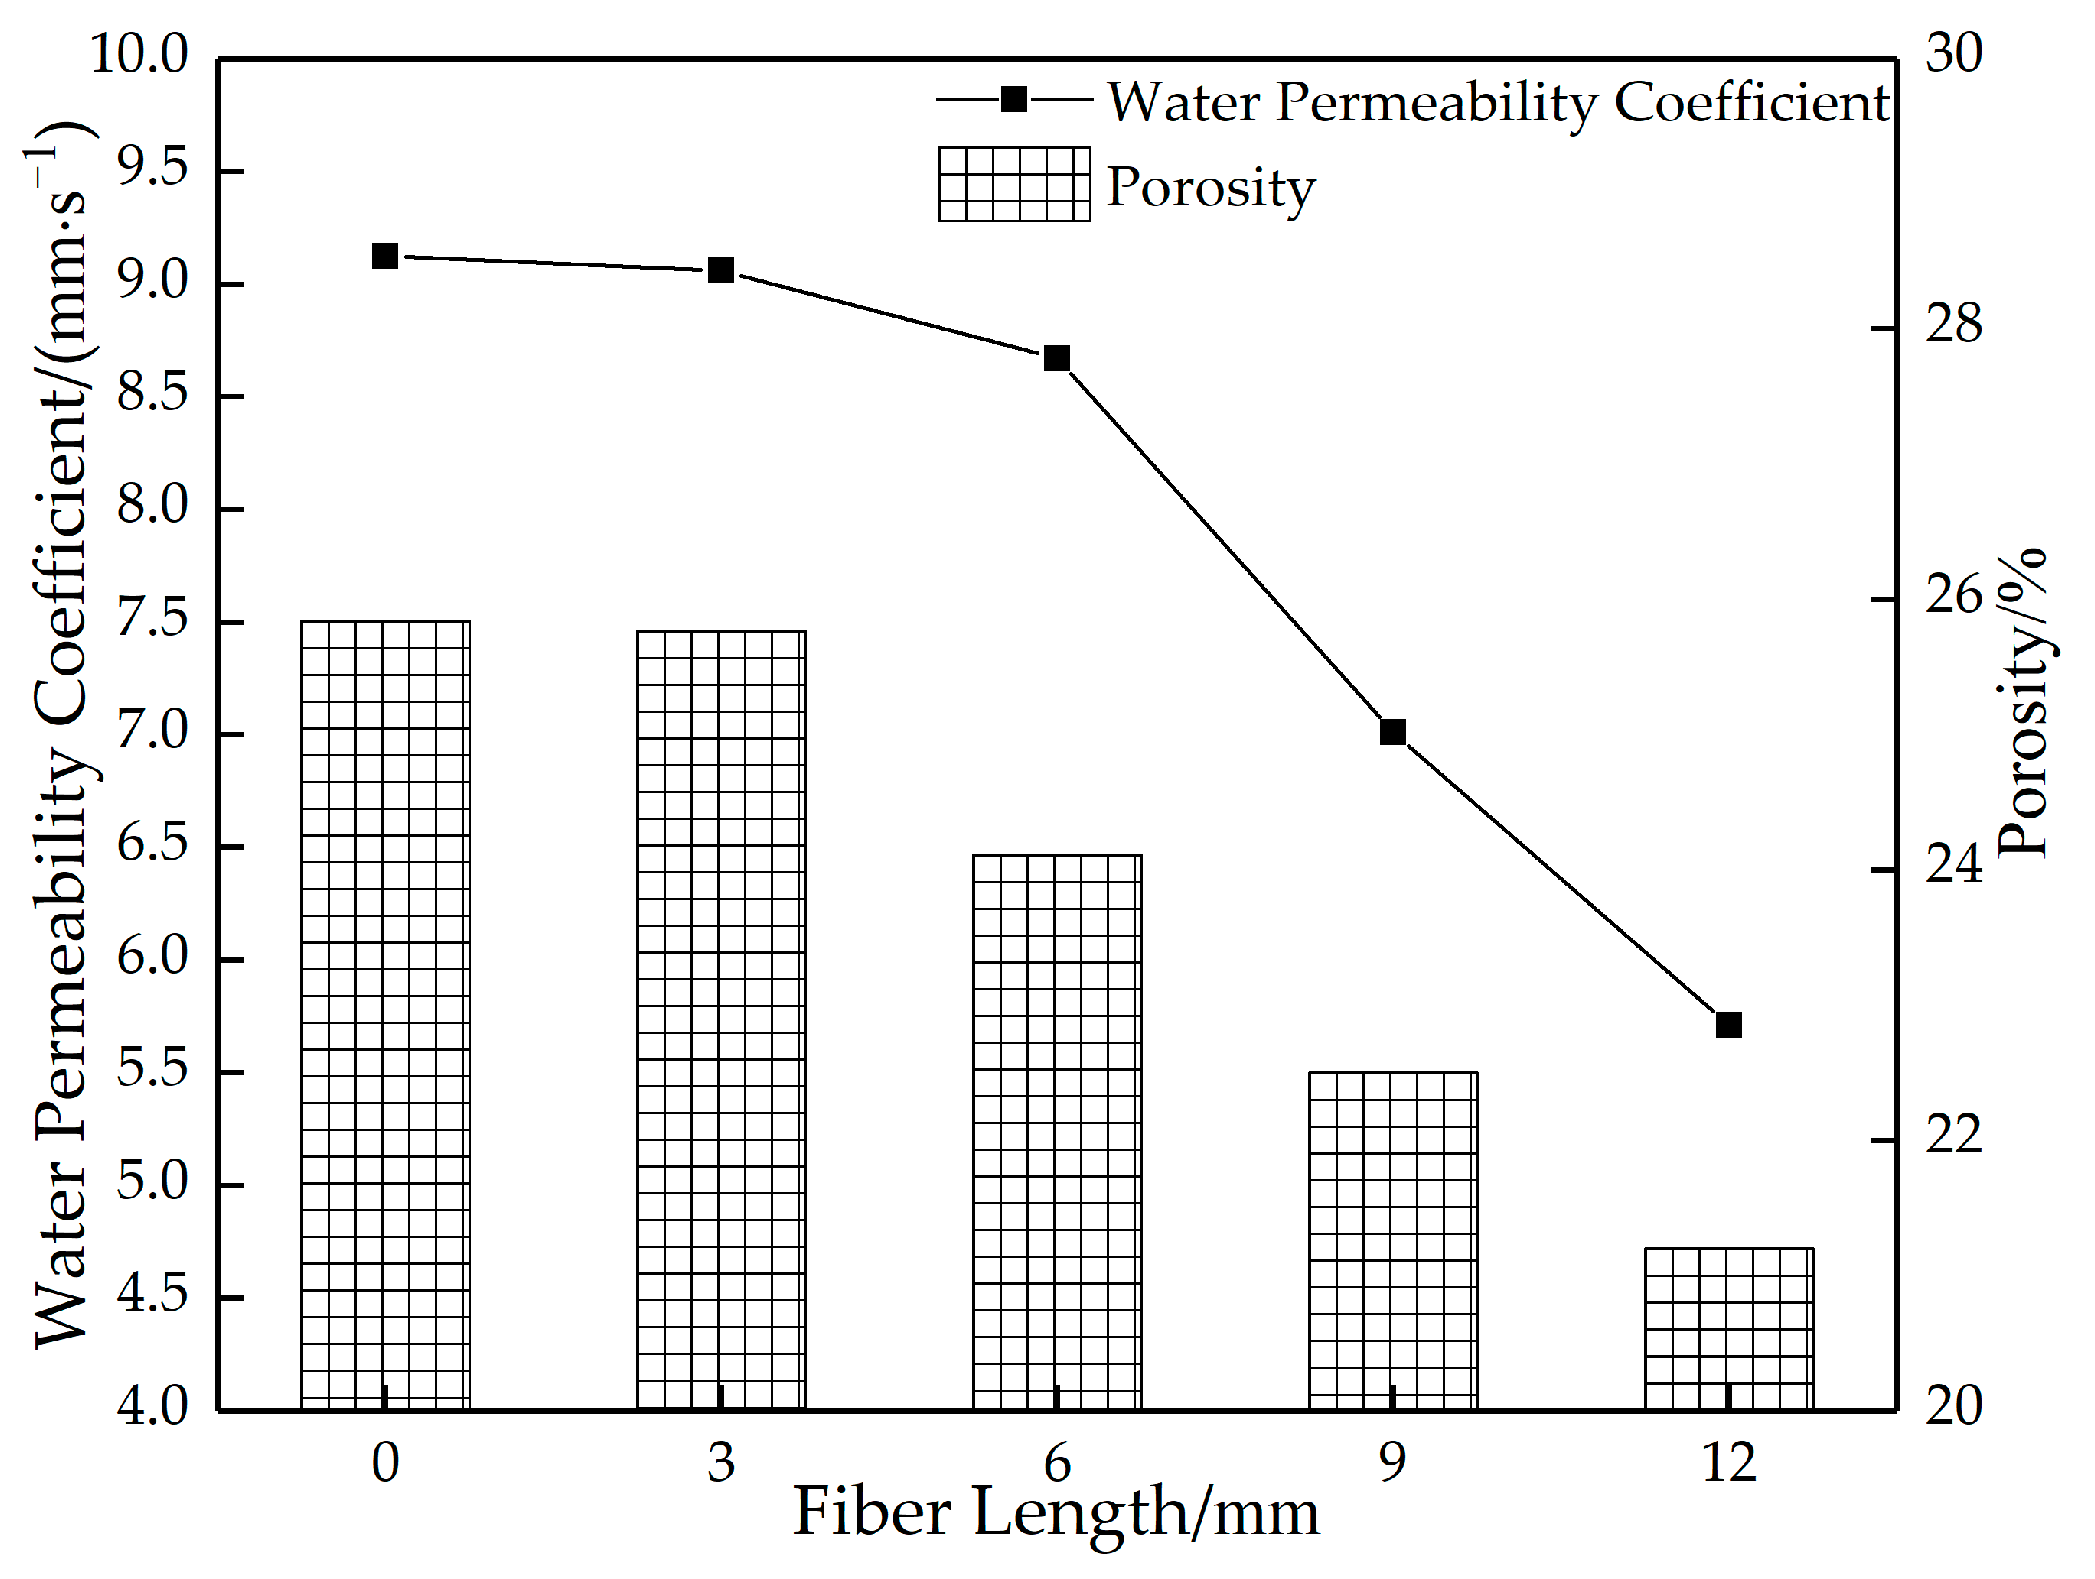
Figure 21.
Relationship between the porosity and water permeability coefficient of permeable concrete with different fiber lengths (2 kg/m3).
Figure 21.
Relationship between the porosity and water permeability coefficient of permeable concrete with different fiber lengths (2 kg/m3).
Figure 22.
Variation curves of the strength of permeable concrete with different fiber content values (28 days).
Figure 22.
Variation curves of the strength of permeable concrete with different fiber content values (28 days).
Figure 23.
Stress–strain relationship of permeable concrete with different fiber content values (6 mm).
Figure 23.
Stress–strain relationship of permeable concrete with different fiber content values (6 mm).
Figure 24.
The relationship between the porosity and water permeability coefficient of permeable concrete with different fiber content values (6 mm).
Figure 24.
The relationship between the porosity and water permeability coefficient of permeable concrete with different fiber content values (6 mm).
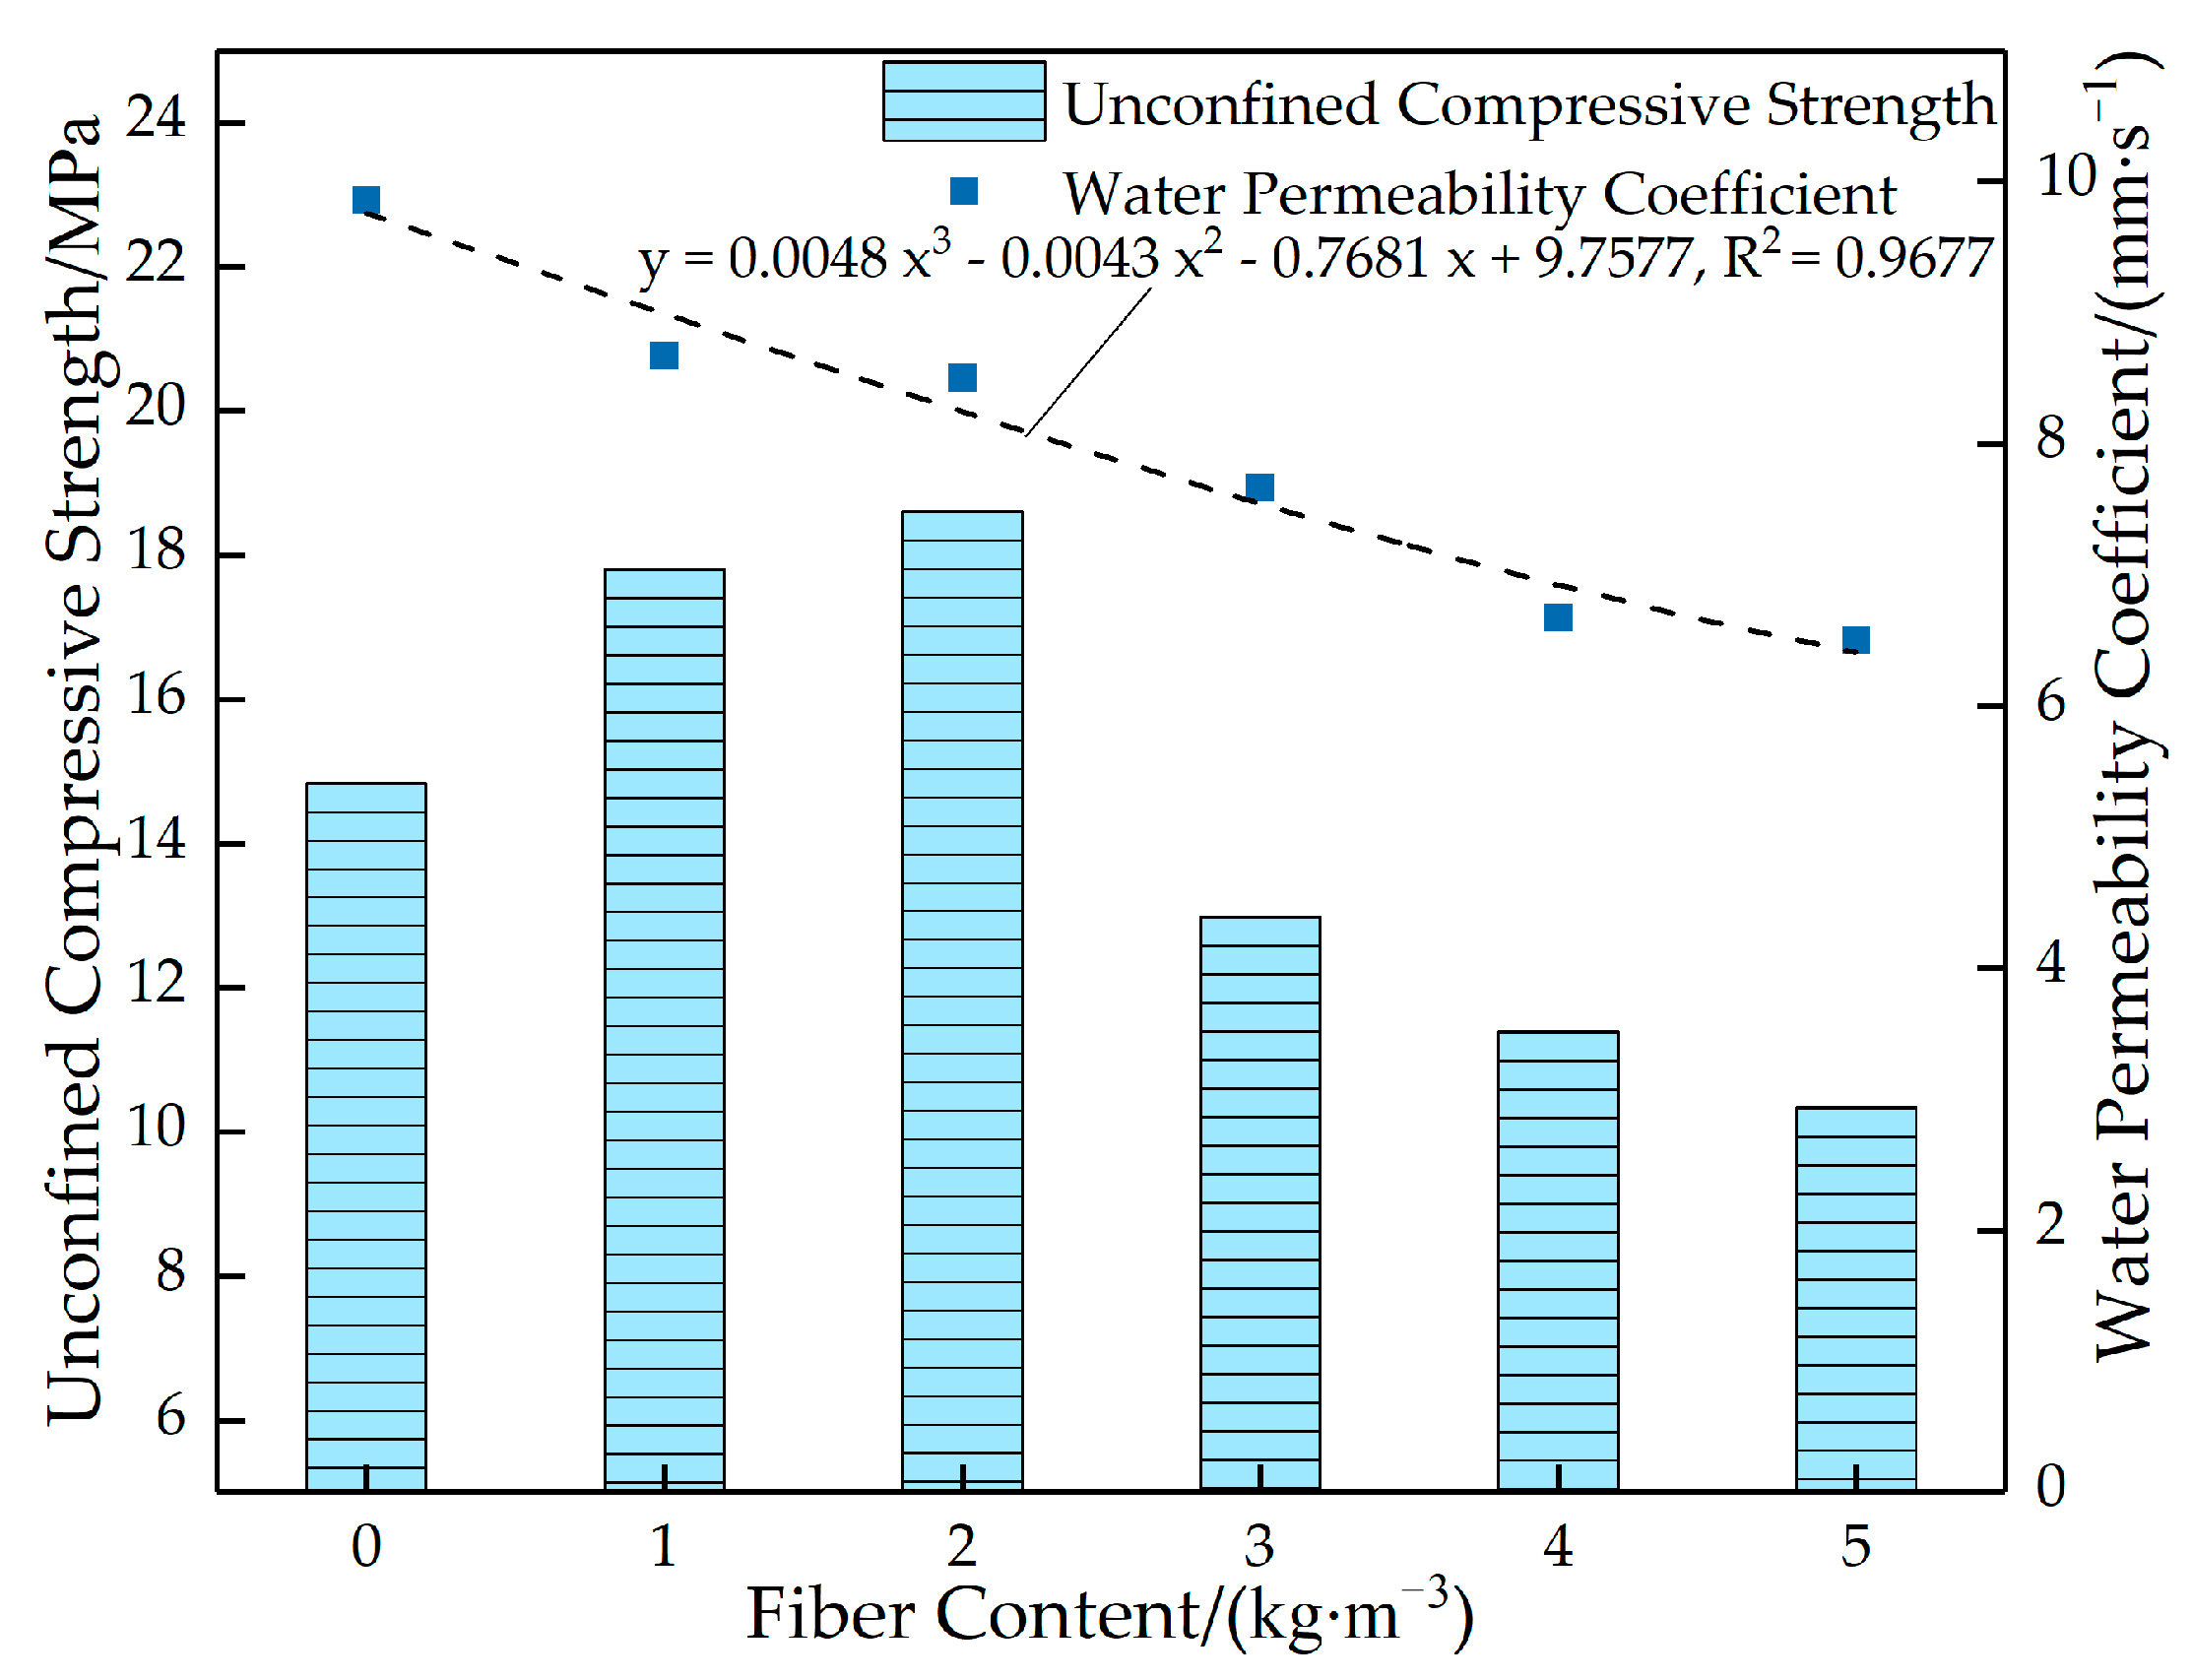
Figure 25.
Relationship between the strength and water permeability coefficient of permeable concrete with different fiber content values (6 mm).
Figure 25.
Relationship between the strength and water permeability coefficient of permeable concrete with different fiber content values (6 mm).
Figure 26.
Vertical strain cloud map of permeable concrete based on Vic-3D technology: (a) ordinary permeable concrete precompression stage, (b) ordinary permeable concrete after compression, (c) ordinary permeable concrete damage photos, (d) reinforced permeable concrete at the precompression stage, (e) reinforced permeable concrete after compression, and (f) reinforced permeable concrete damage photos.
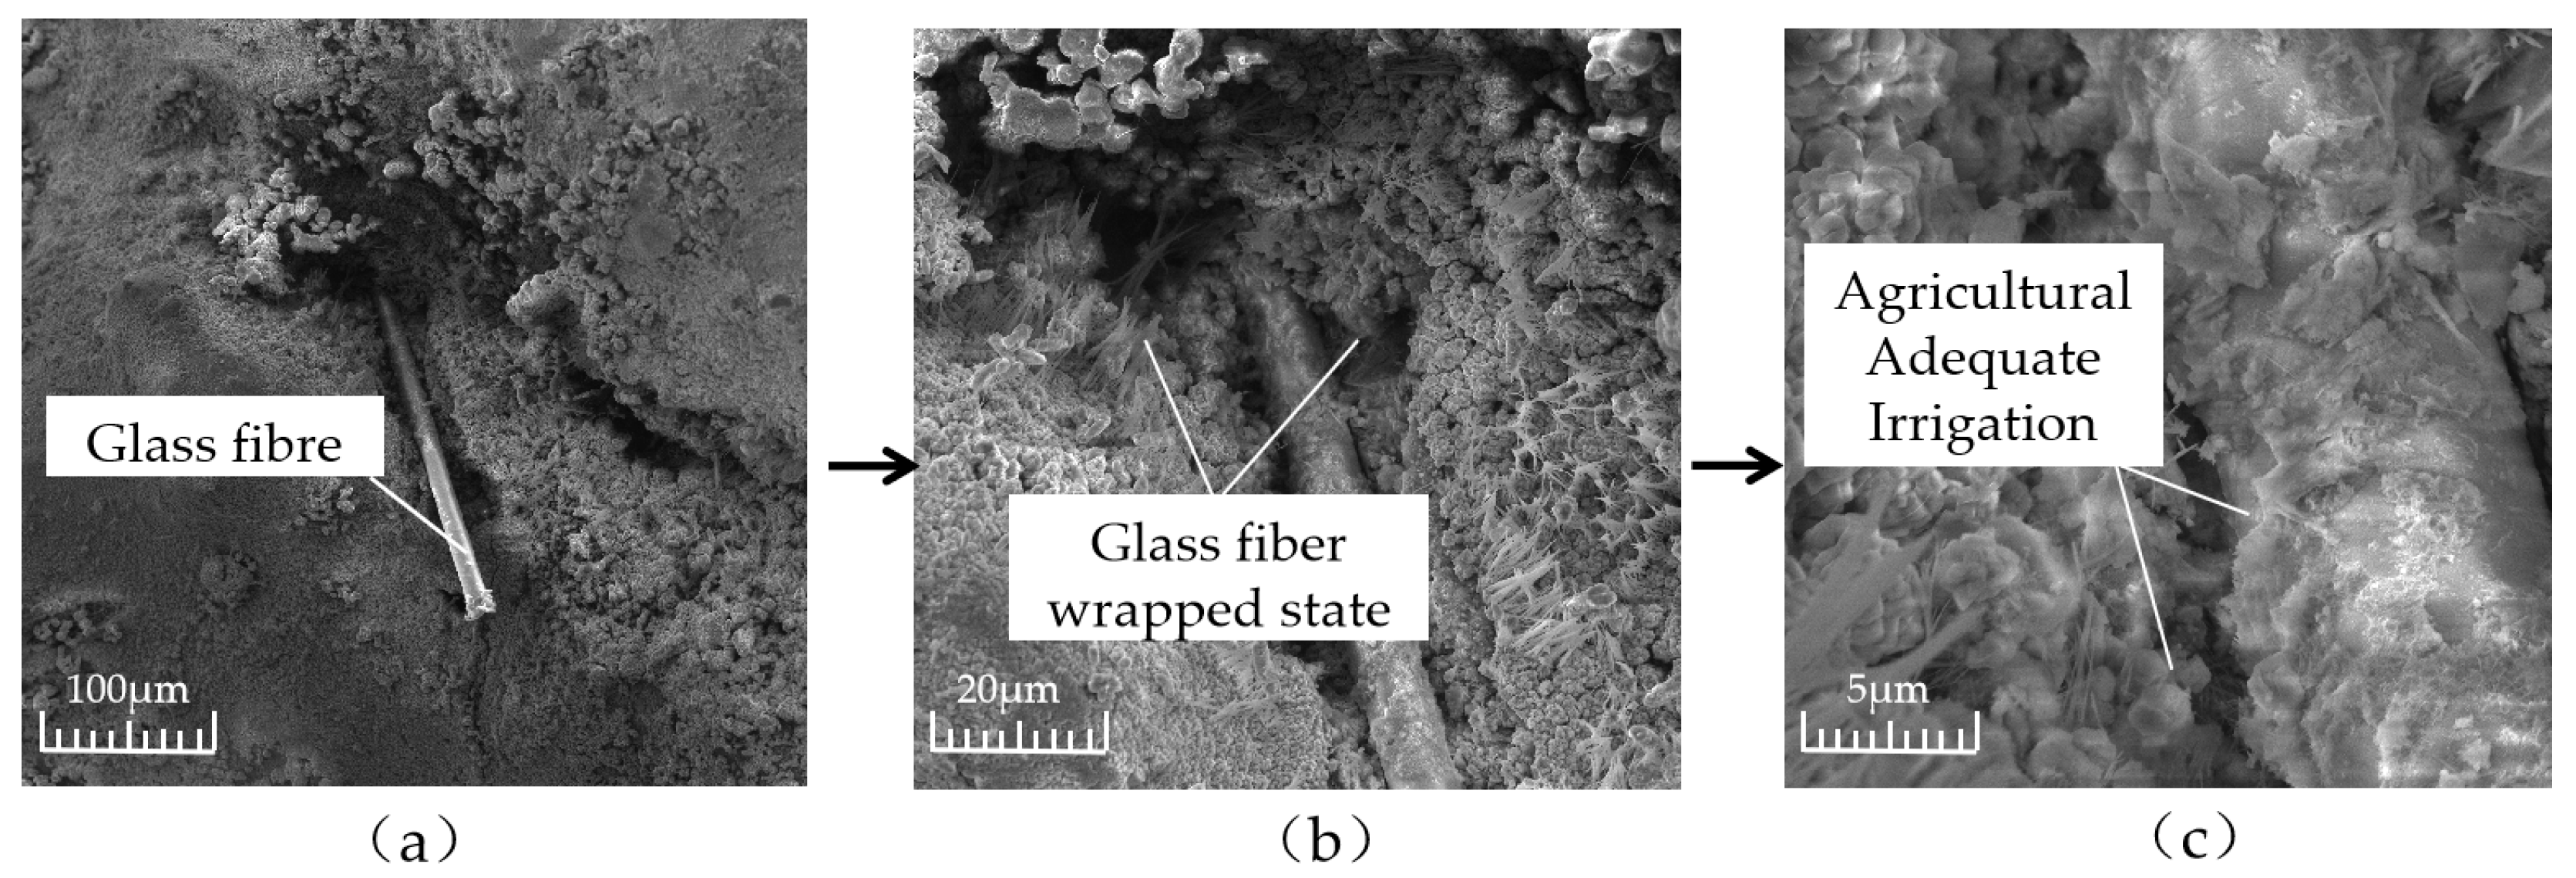
Figure 27.
Microstructure of glass fiber in the cementing layer: (a) 100 μm; (b) 50 μm; and (c) 5 μm.
Figure 27.
Microstructure of glass fiber in the cementing layer: (a) 100 μm; (b) 50 μm; and (c) 5 μm.
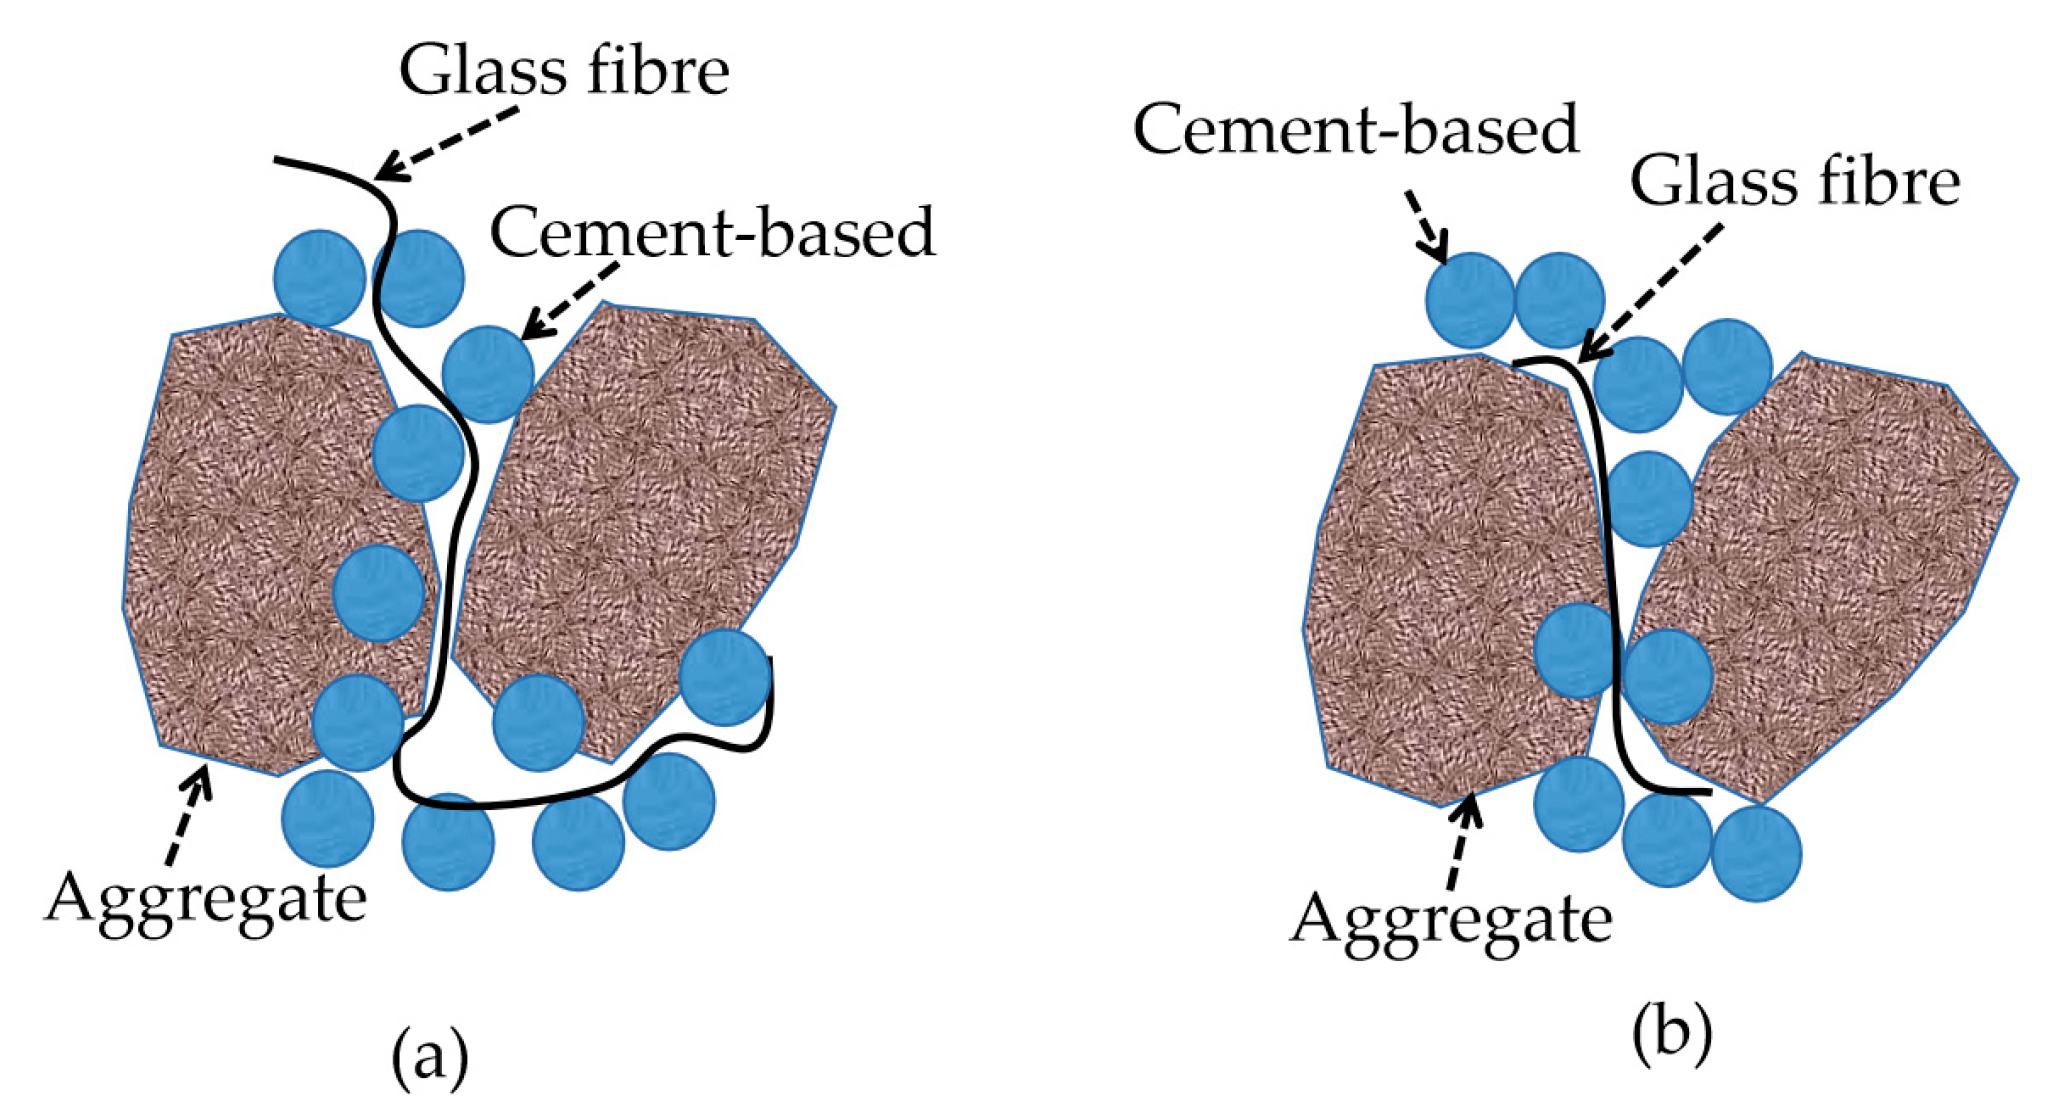
Figure 28.
Reinforcement diagram of glass fiber in the cementing layer: (a) longer fibers and (b) appropriate length fibers.
Figure 28.
Reinforcement diagram of glass fiber in the cementing layer: (a) longer fibers and (b) appropriate length fibers.
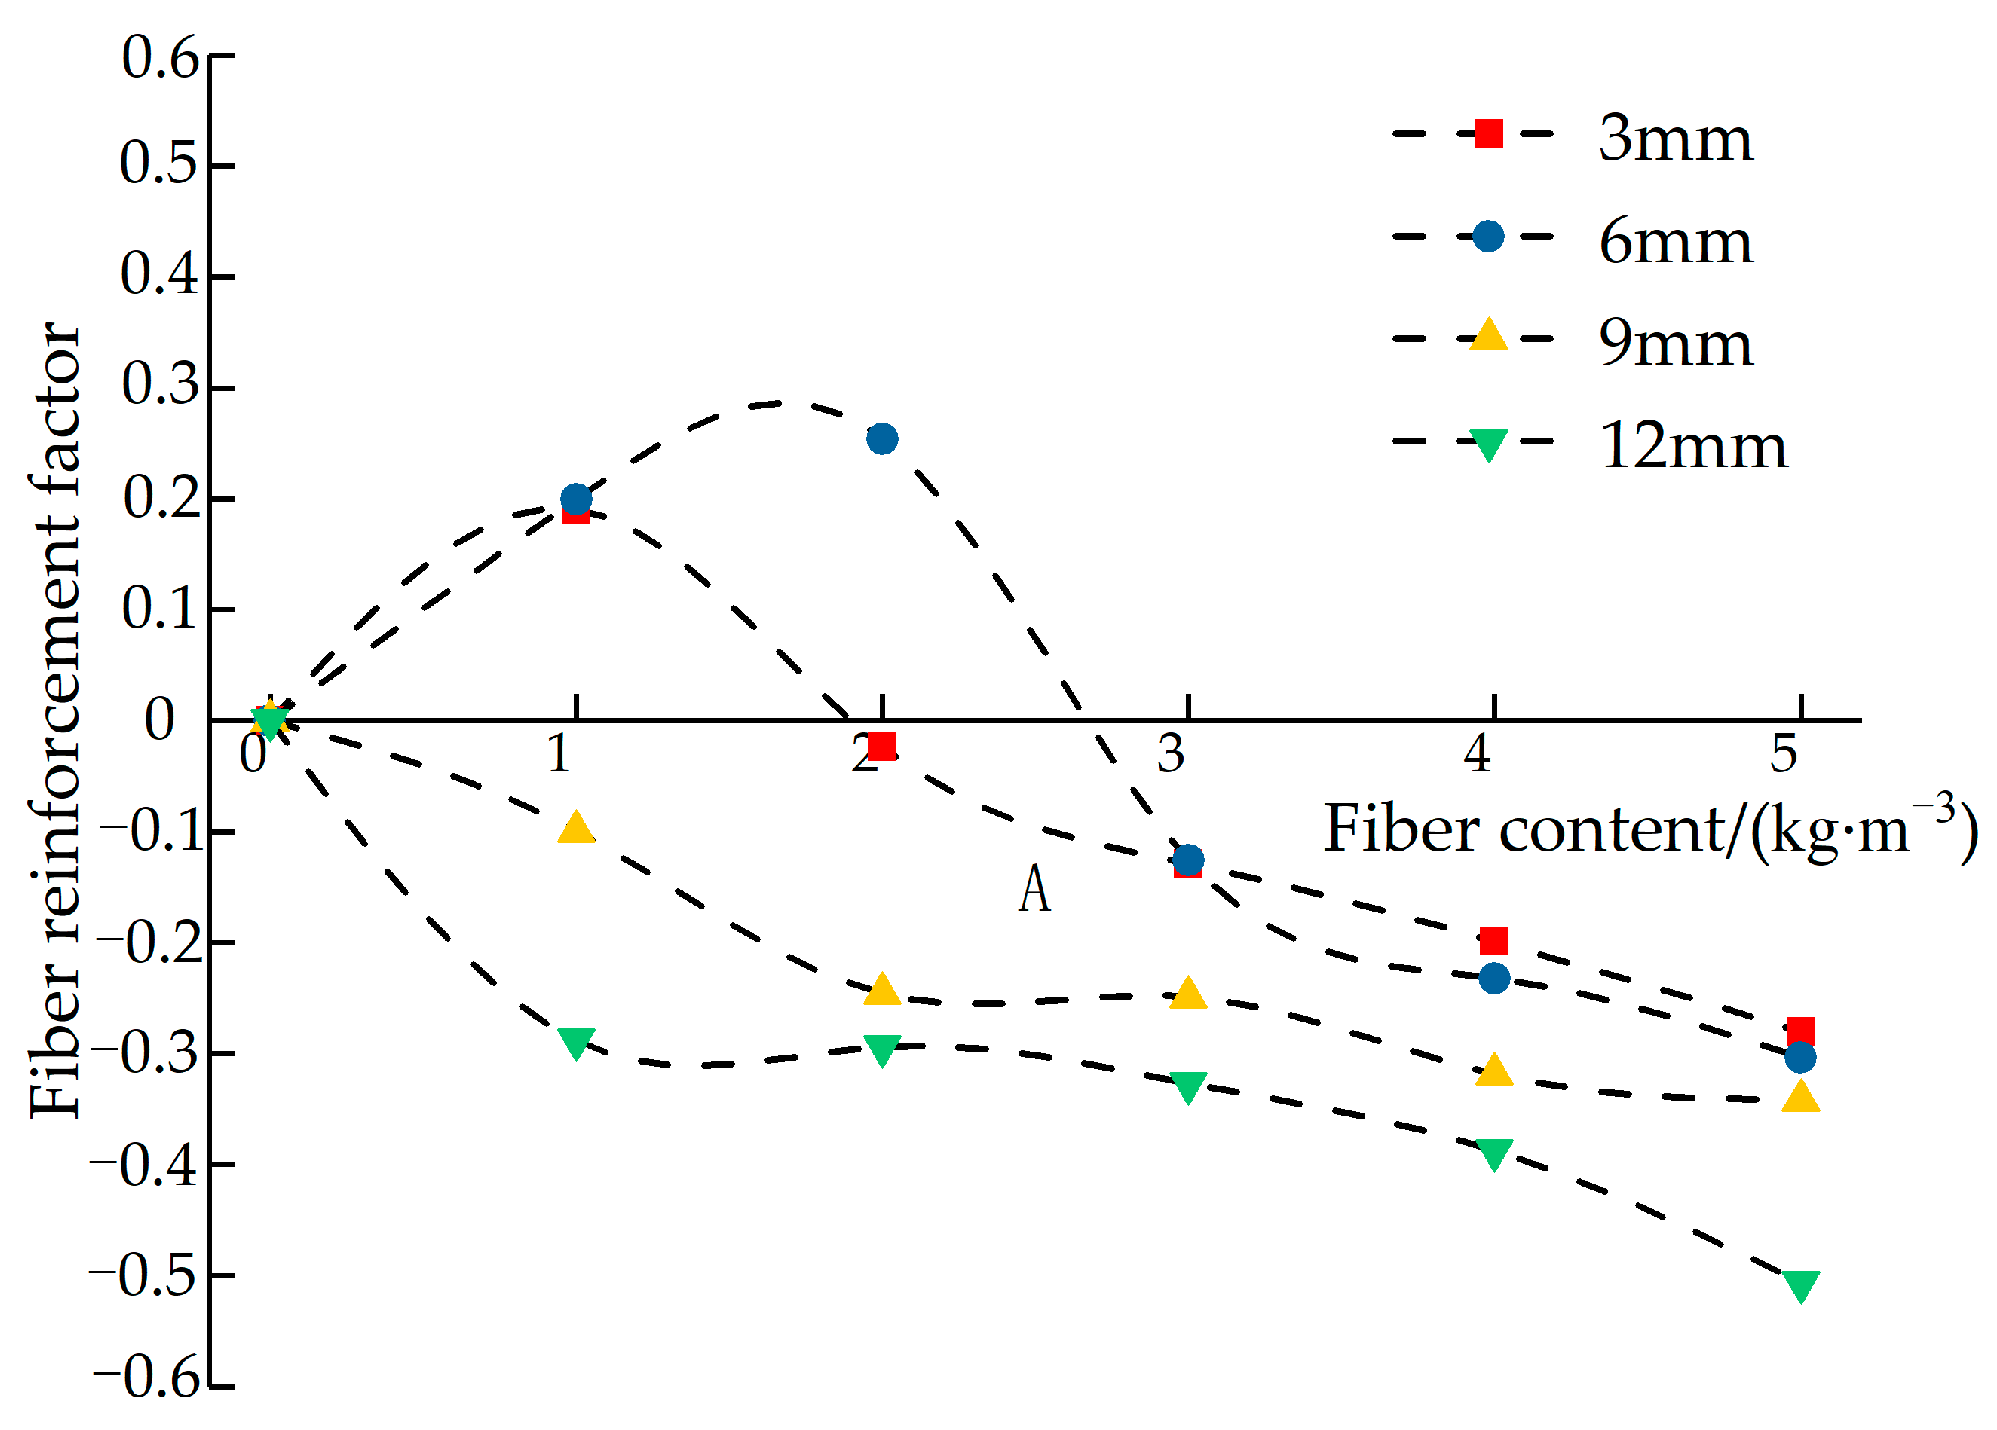
Figure 29.
The relationship between the reinforcement factors of different fiber lengths and dosages.
Figure 29.
The relationship between the reinforcement factors of different fiber lengths and dosages.
Table 1.
Physical properties of Portland cement.
Table 1.
Physical properties of Portland cement.
| Specific Surface Area (m2/kg) | Setting Time (min) | Rupture Strength (MPa) | Compressive Strength (MPa) |
|---|
| Initial Set | Final Set | 3d | 28d | 3d | 28d |
|---|
| 351 | 168 | 258 | 5.5 | 9.1 | 23.9 | 50.1 |
Table 2.
Performance index of fly ash.
Table 2.
Performance index of fly ash.
| Density (g/cm3) | Burn Loss | Water Content | Activity Index | Stability |
|---|
| 2.85 | ≤4.5% | ≤1.0% | 80% | on test |
Table 3.
Performance index of crushed stone aggregate.
Table 3.
Performance index of crushed stone aggregate.
| Particle Size (mm) | Performance Density (kg/m3) | Bulk Density (kg/m3) | Void Volume Fraction |
|---|
| 3~5 | 1570 | 2780 | 43.52% |
| 5~10 | 1483 | 3026 | 50.99% |
| 10~15 | 1600 | 2810 | 43.06% |
Table 4.
Mix ratio design of ordinary permeable concrete.
Table 4.
Mix ratio design of ordinary permeable concrete.
| Particle Size (mm) | Aggregate Dosage (kg/m3) | Cement Content (kg/m3) | Fly ash Consumption (kg/m3) |
|---|
| 3~5 | 1453.56 | 482.38 | 25.38 |
| 5~10 | 1538.61 | 371.92 | 19.58 |
| 352.92 | 39.15 |
| 362.25 | 29.25 |
| 10~15 | 1568.01 | 365.17 | 19.22 |
Table 5.
Test scheme and mix ratio of glass fiber permeable concrete.
Table 5.
Test scheme and mix ratio of glass fiber permeable concrete.
| Particle Size (mm) | Cement Content (kg/m3) | Fly Ash Content (kg/m3) | Fiber Length (mm) | Fiber Content (kg/m3) |
|---|
| 5~10 | 362.25 | 29.25 | 3 mm | 1, 2, 3, 4, 5 |
| 5~10 | 362.25 | 29.25 | 6 mm | 1, 2, 3, 4, 5 |
| 5~10 | 362.25 | 29.25 | 9 mm | 1, 2, 3, 4, 5 |
| 5~10 | 362.25 | 29.25 | 12 mm | 1, 2, 3, 4, 5 |
Table 6.
Peak value and growth rate of the stress–strain curve.
Table 6.
Peak value and growth rate of the stress–strain curve.
| Fiber Length (mm) | σmax (MPa) | Rate of Increase | ε | Rate of Increase |
|---|
| 3 | 17.672 | 19.06% | 1.5689% | 59.91% |
| 6 | 17.811 | 20.00% | 1.3466% | 37.25% |
| 9 | 14.498 | −2.32% | 1.8431% | 87.86% |
| 12 | 10.687 | −28.00% | 1.8711% | 90.71% |


