
Assessment of the Technical Condition of Timber Structural Elements Using Sclerometric Tests


Abstract
:1. Introduction
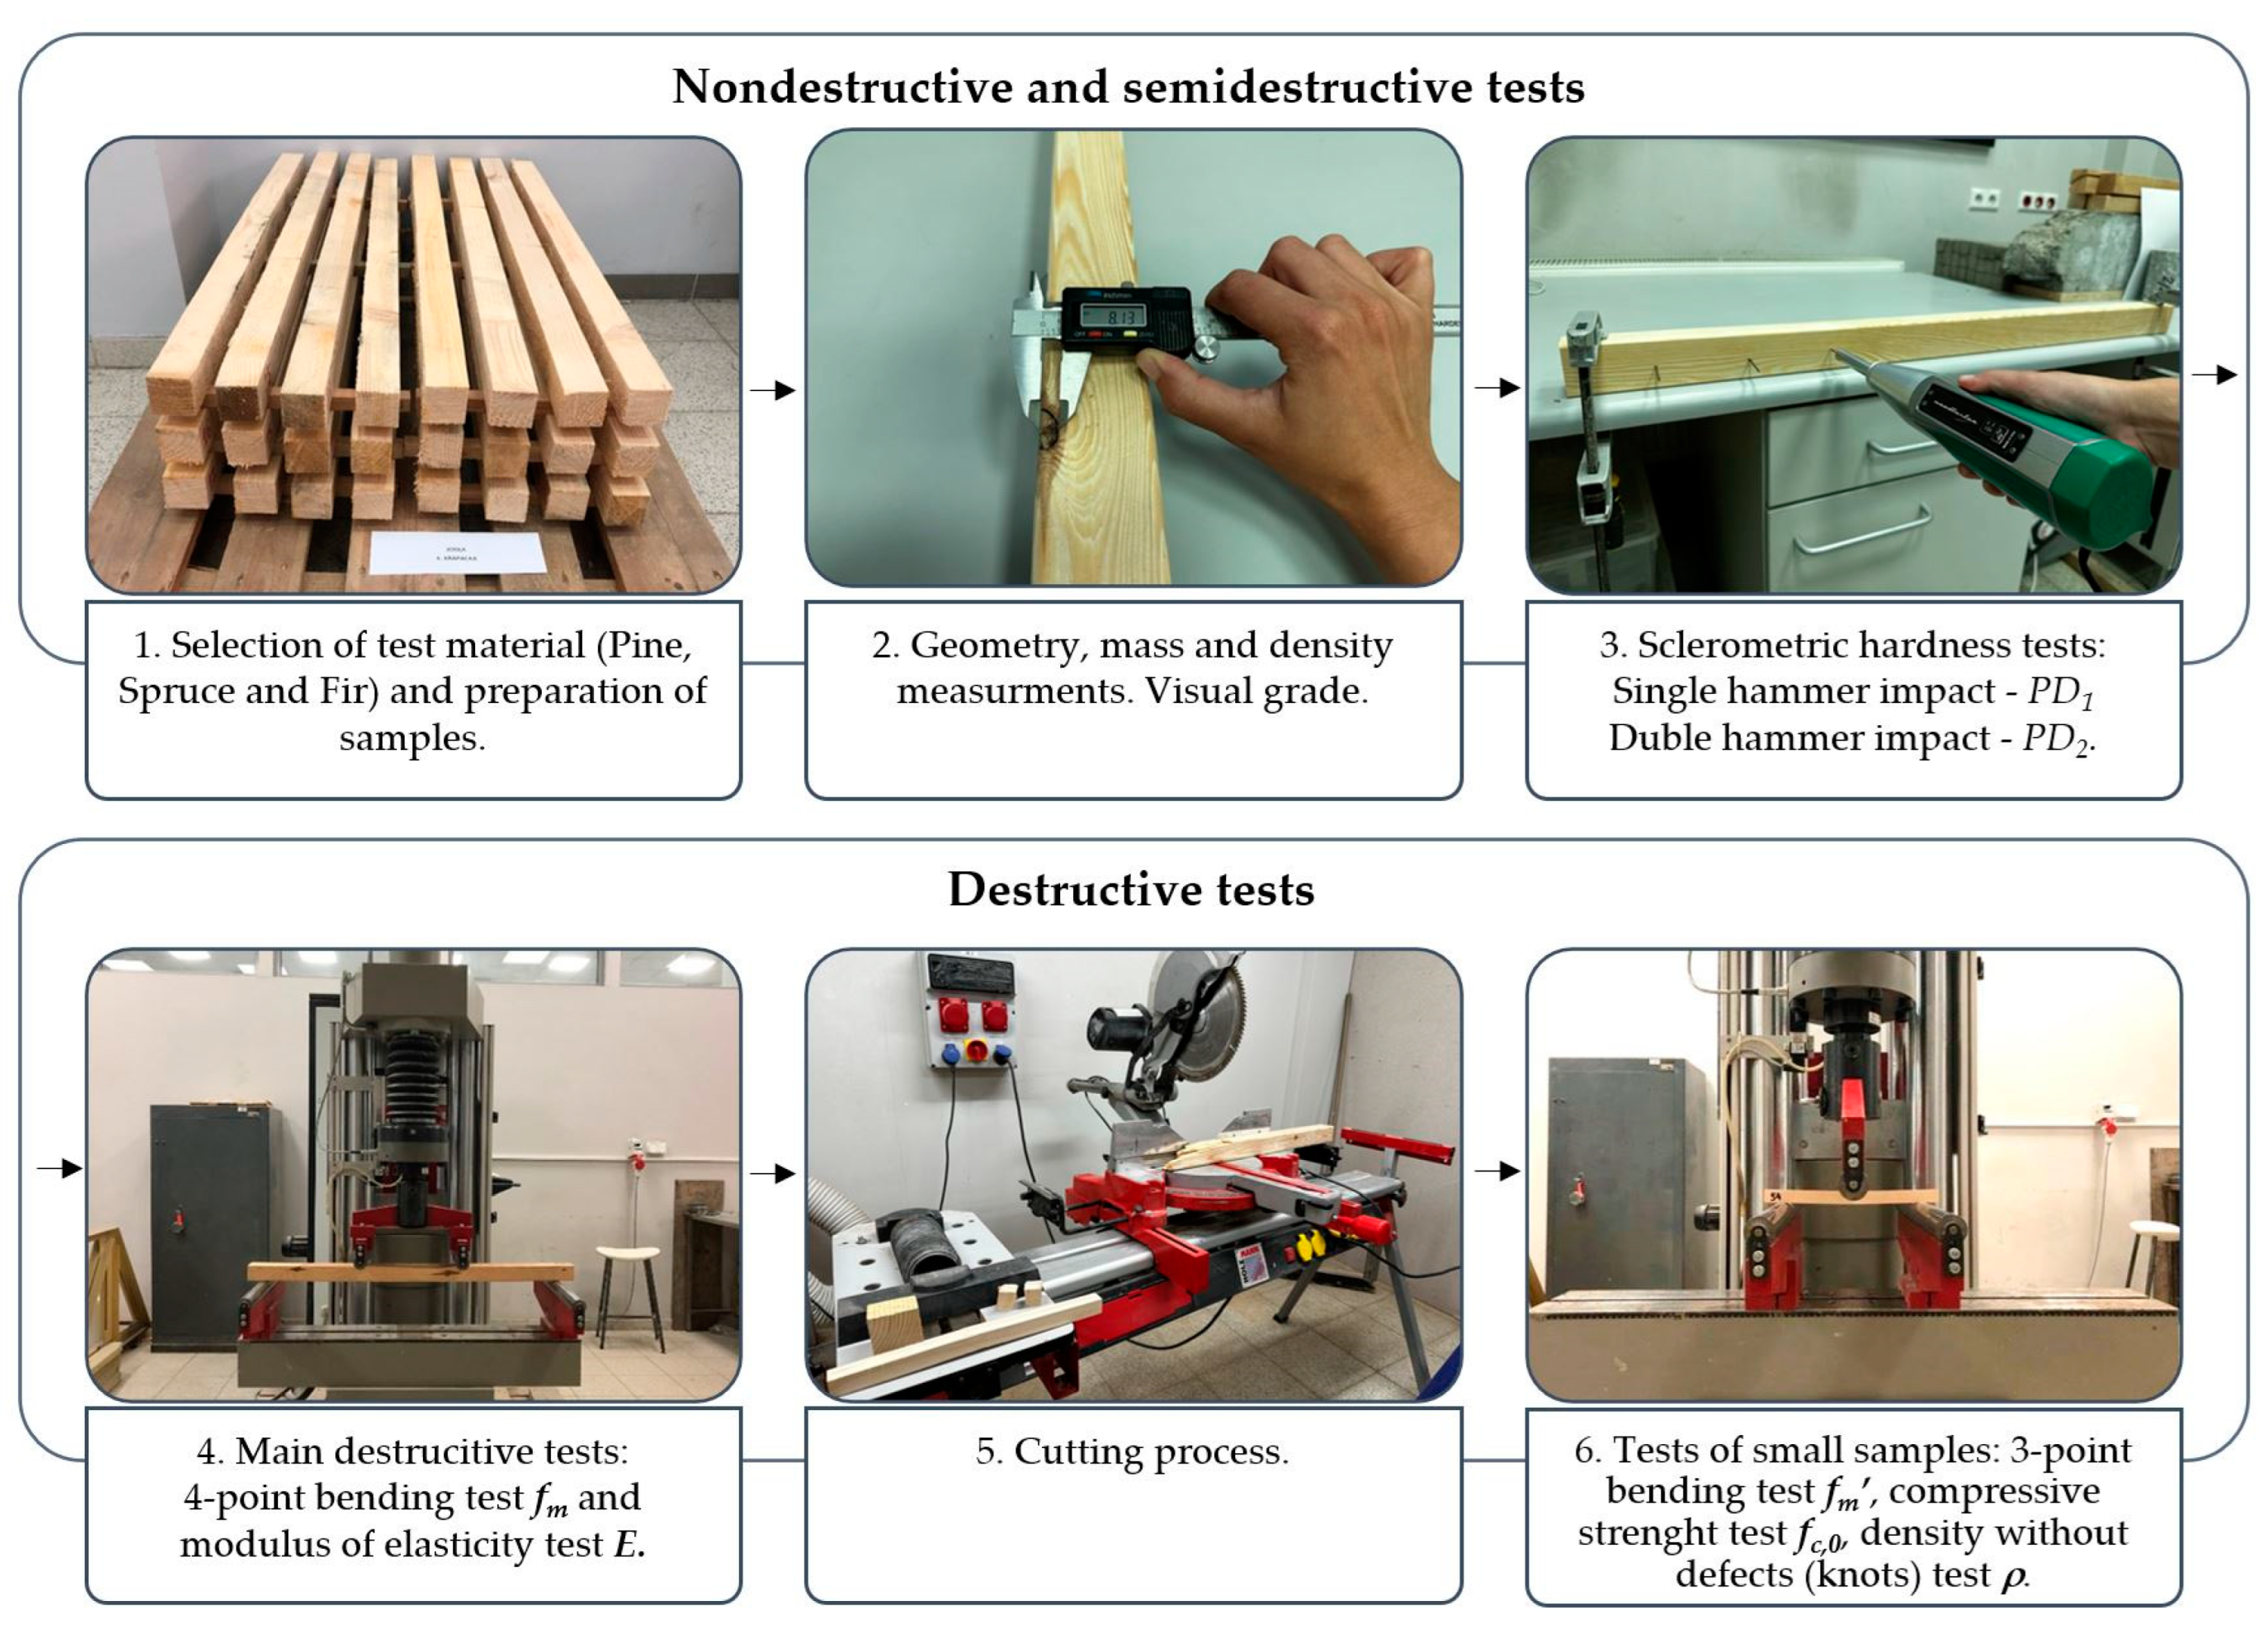
2. Materials and Methods
2.1. Sample Selection and Non-Destructive Testing
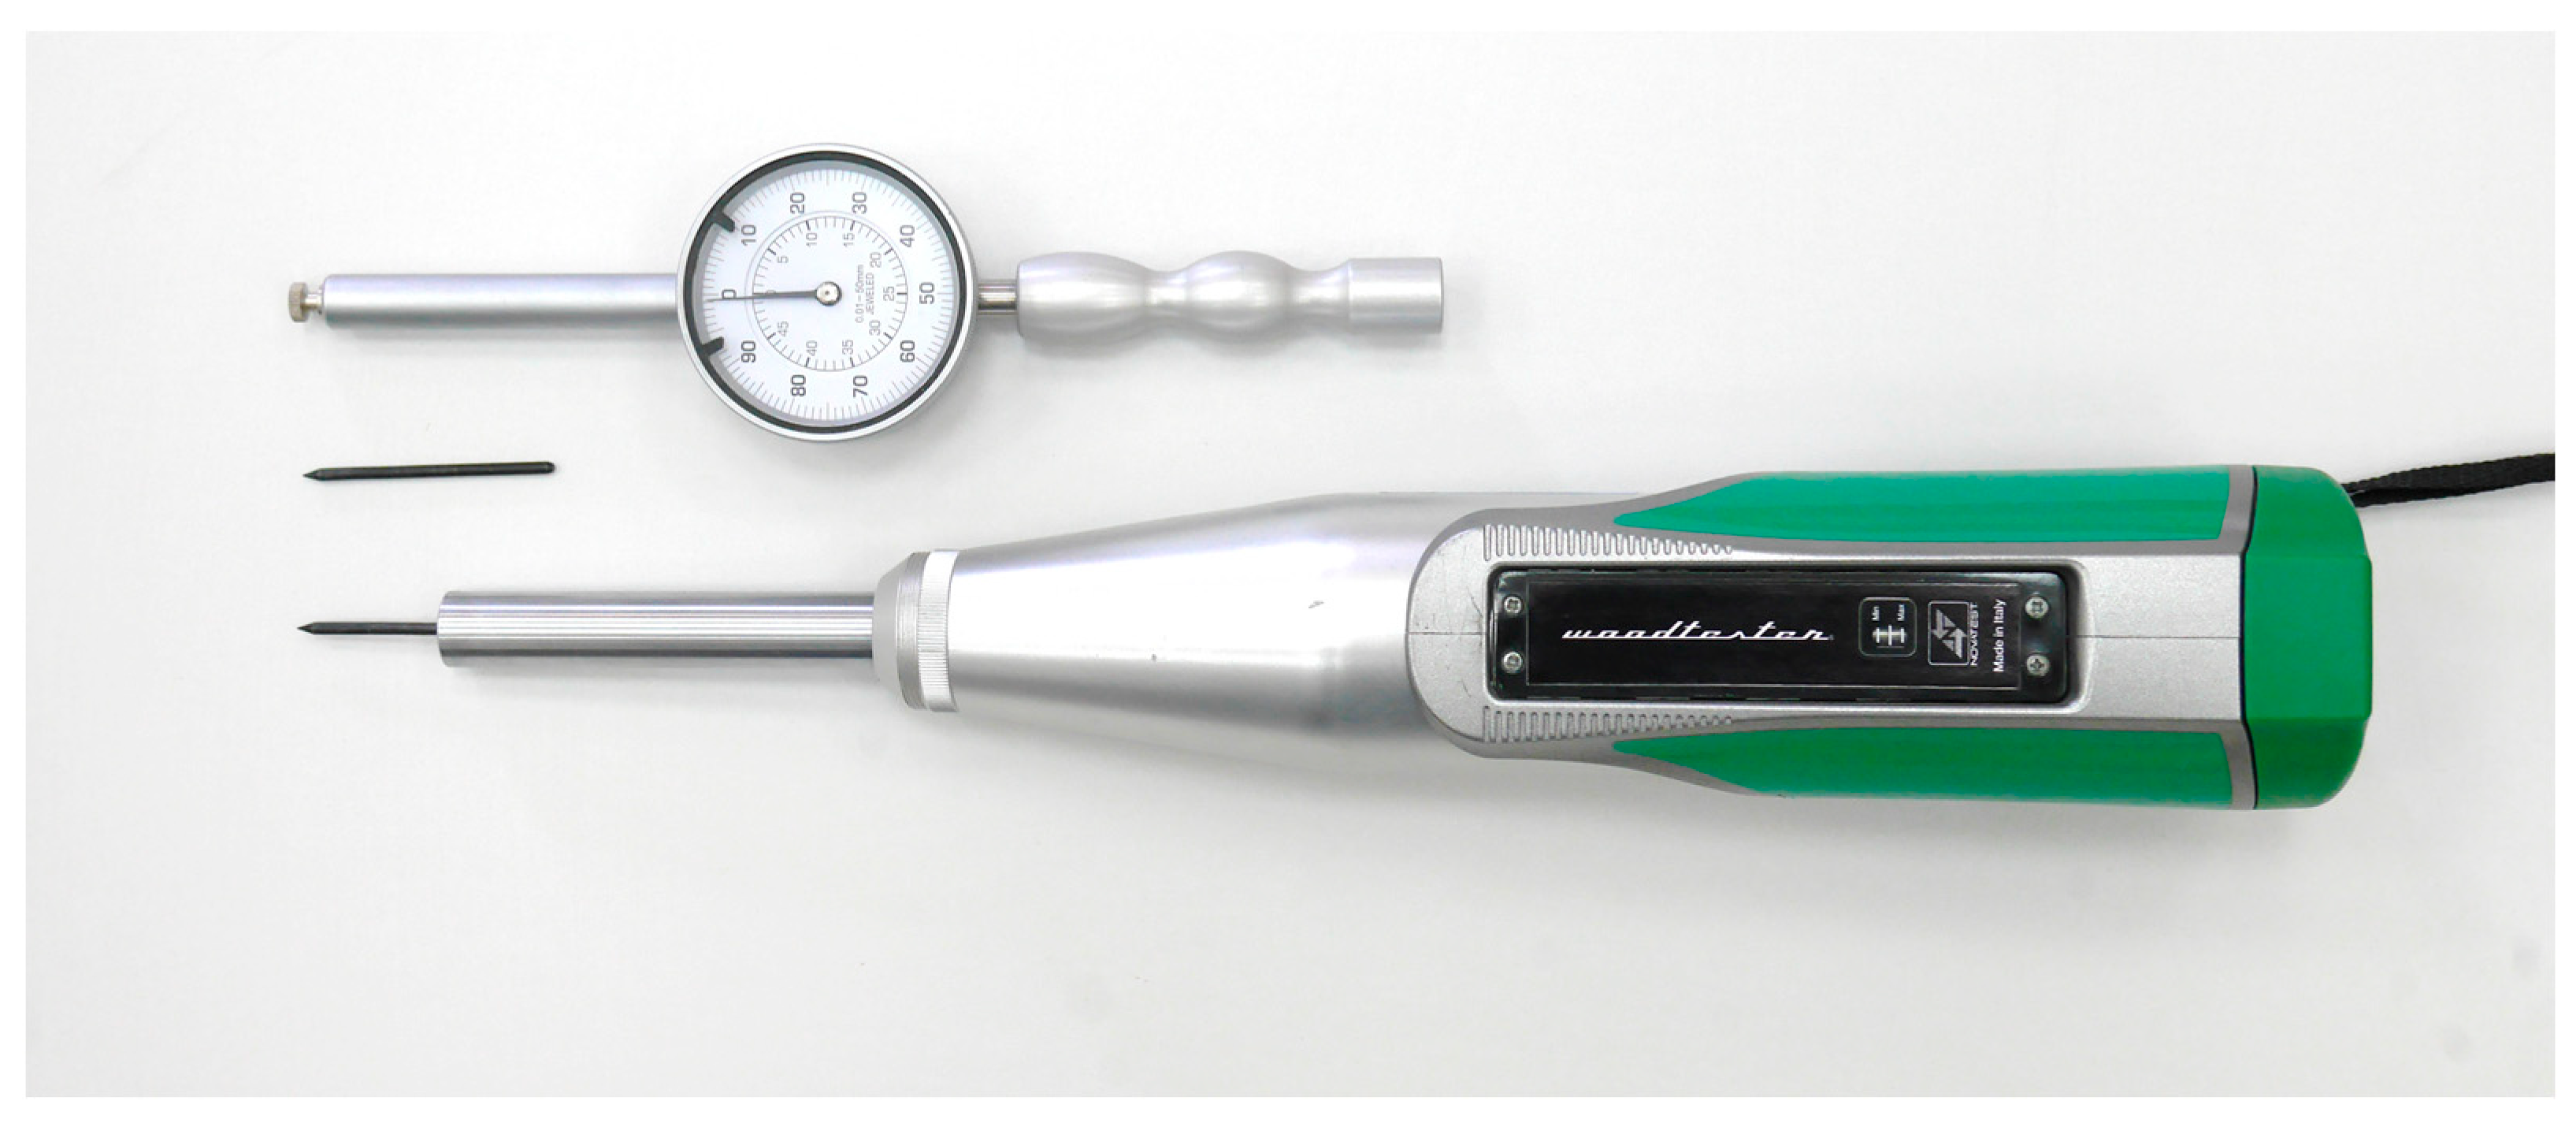
2.2. Hardness Testing
2.3. Destructive Testing
3. Results
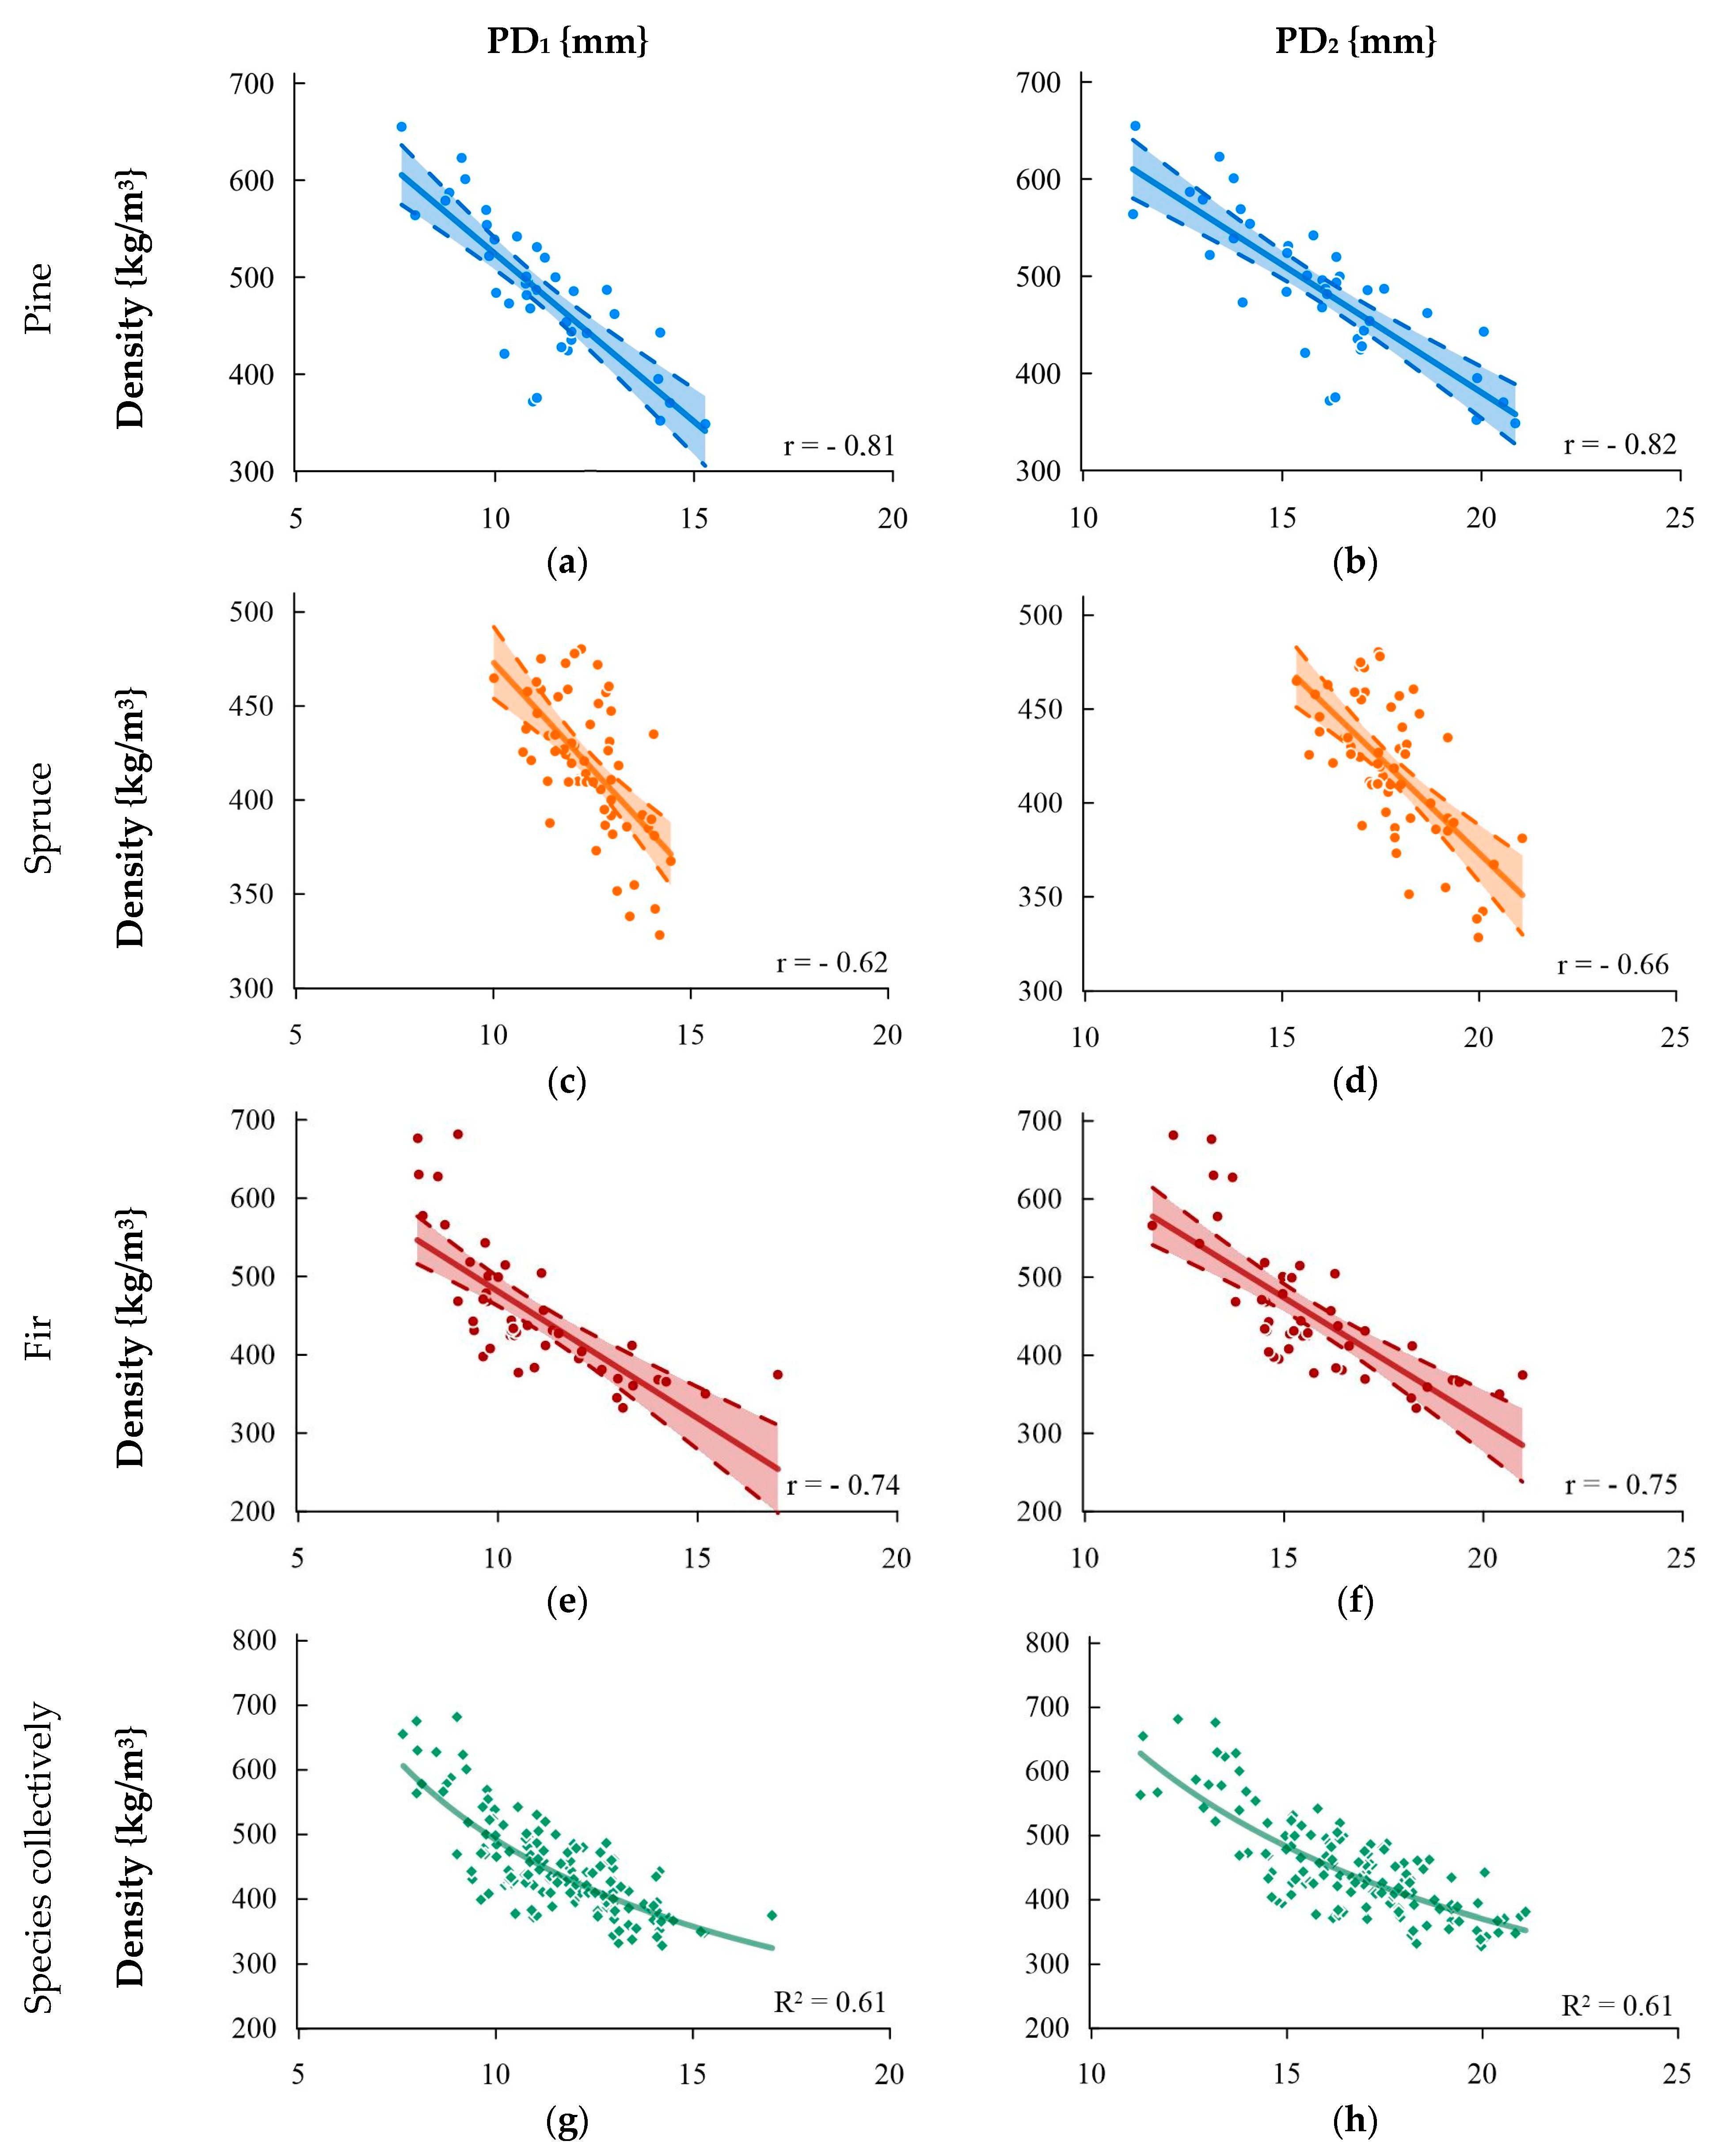
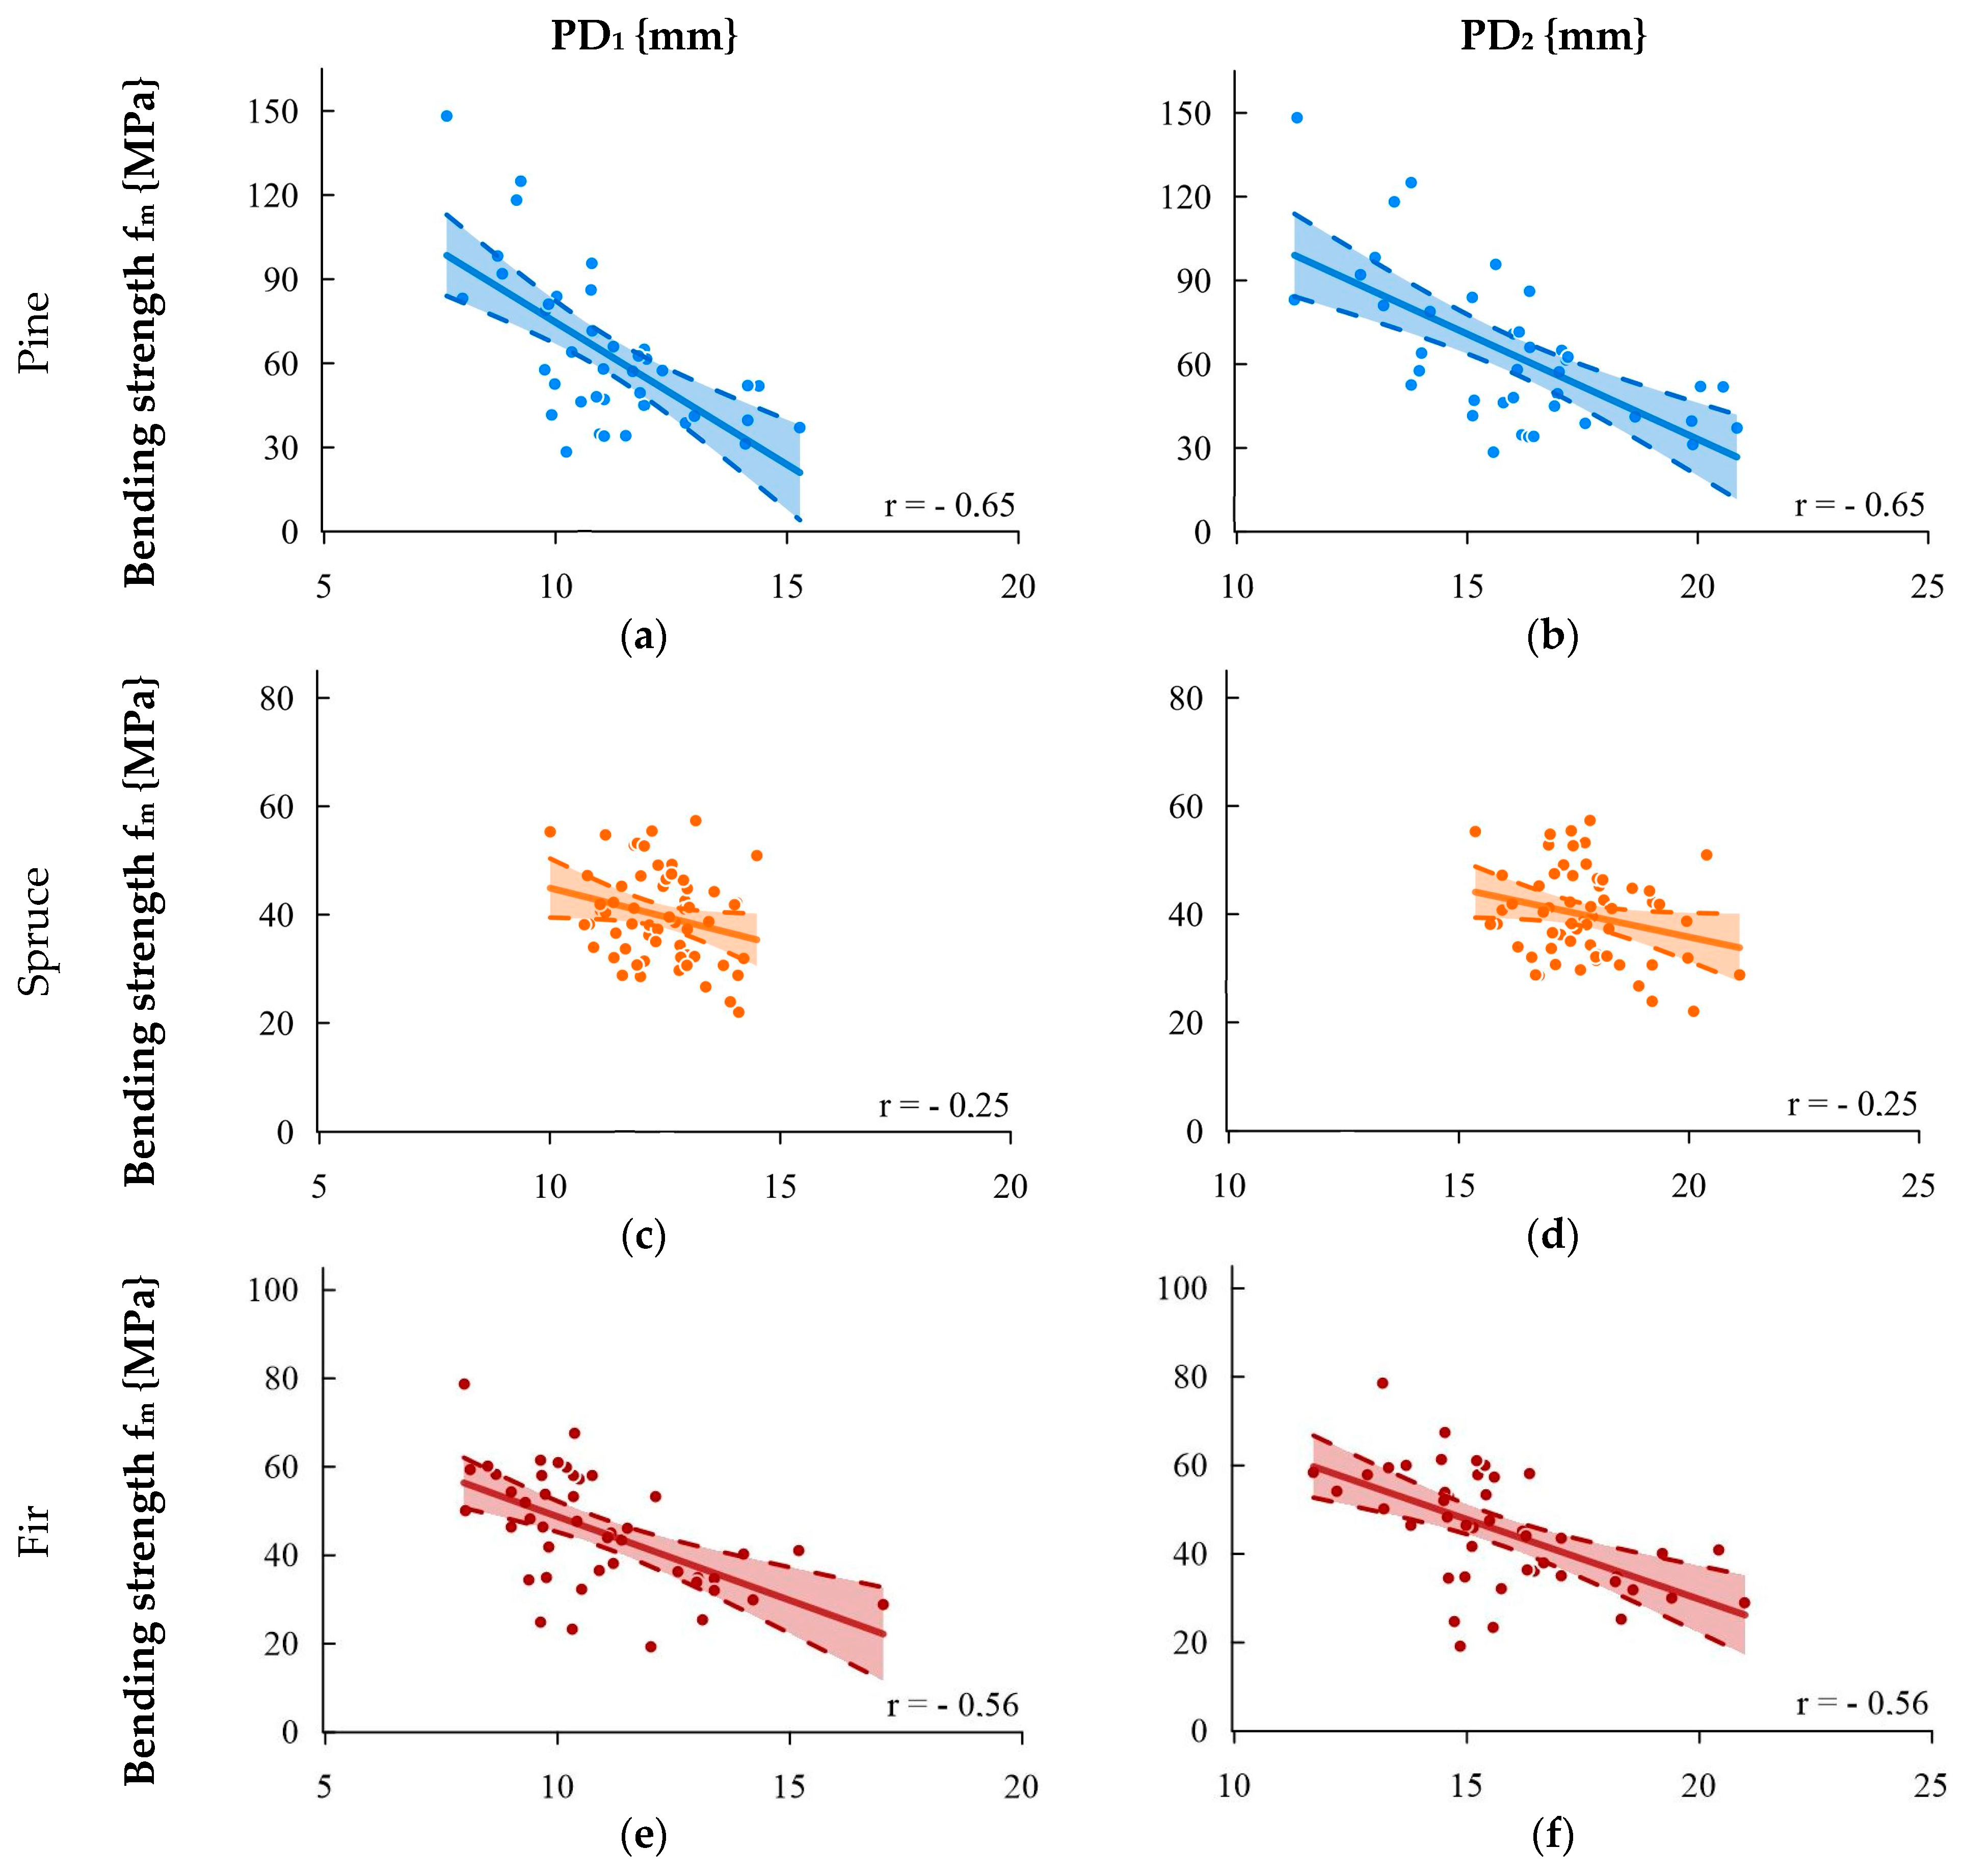
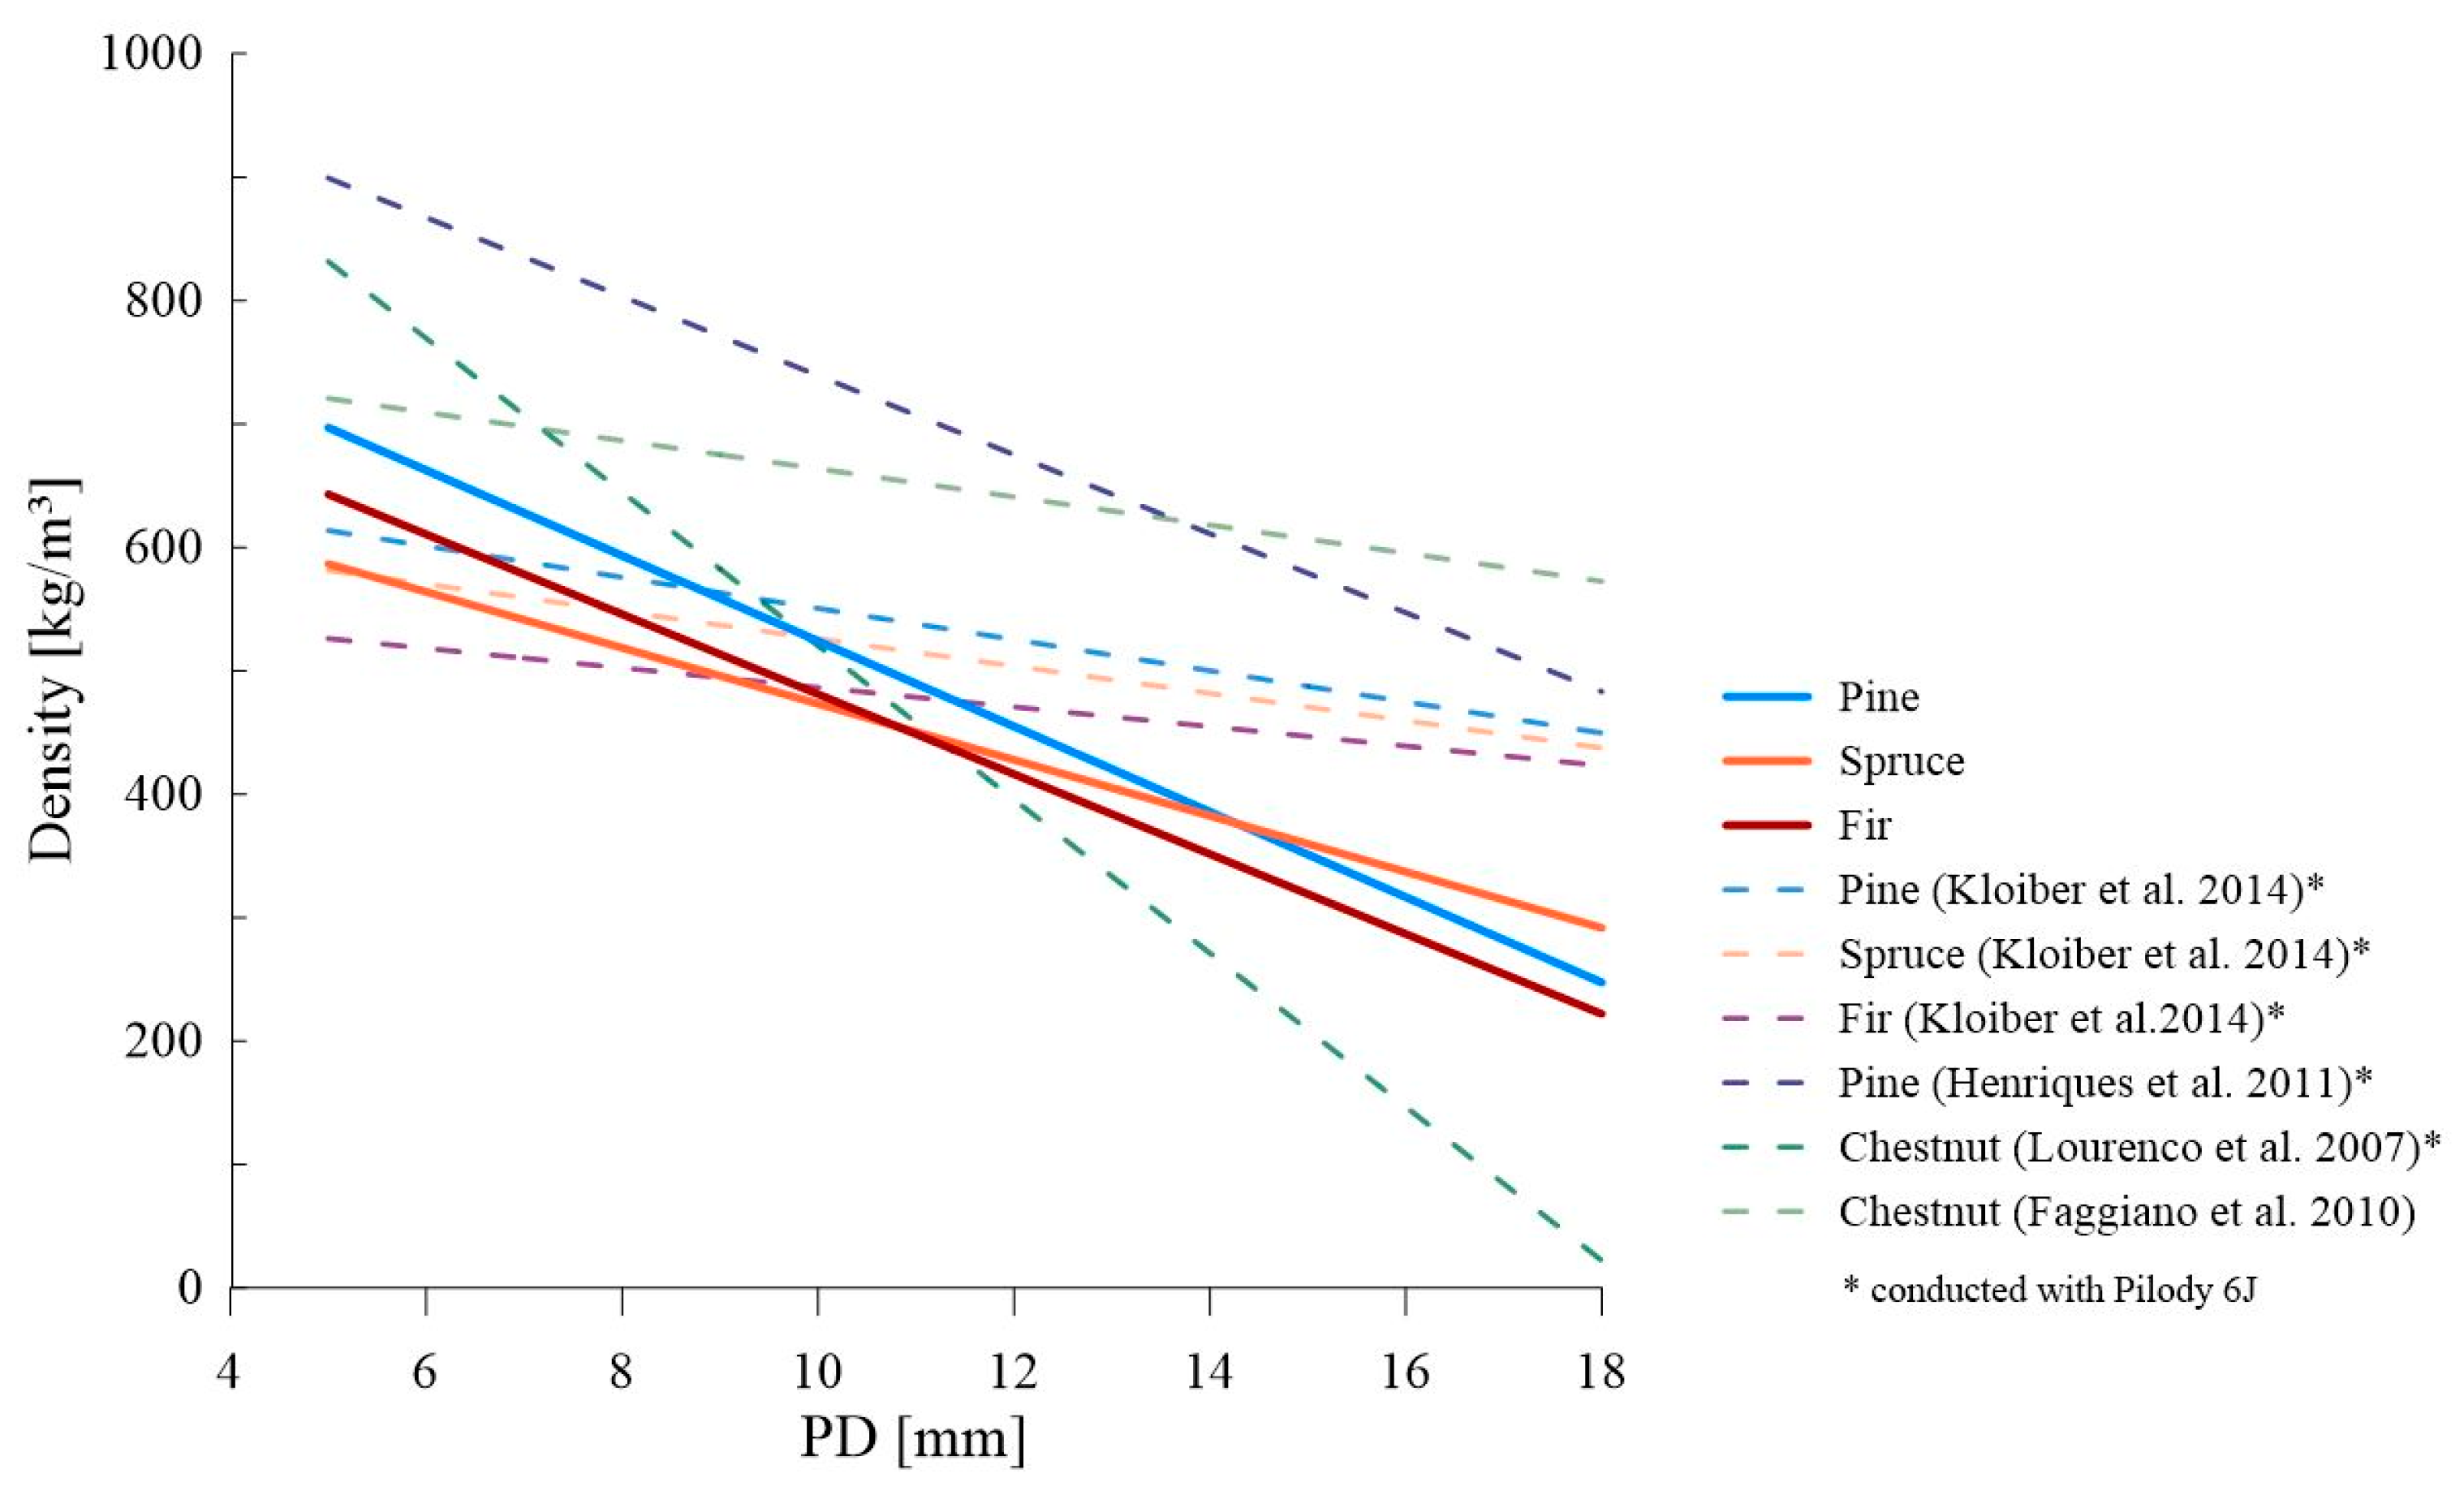
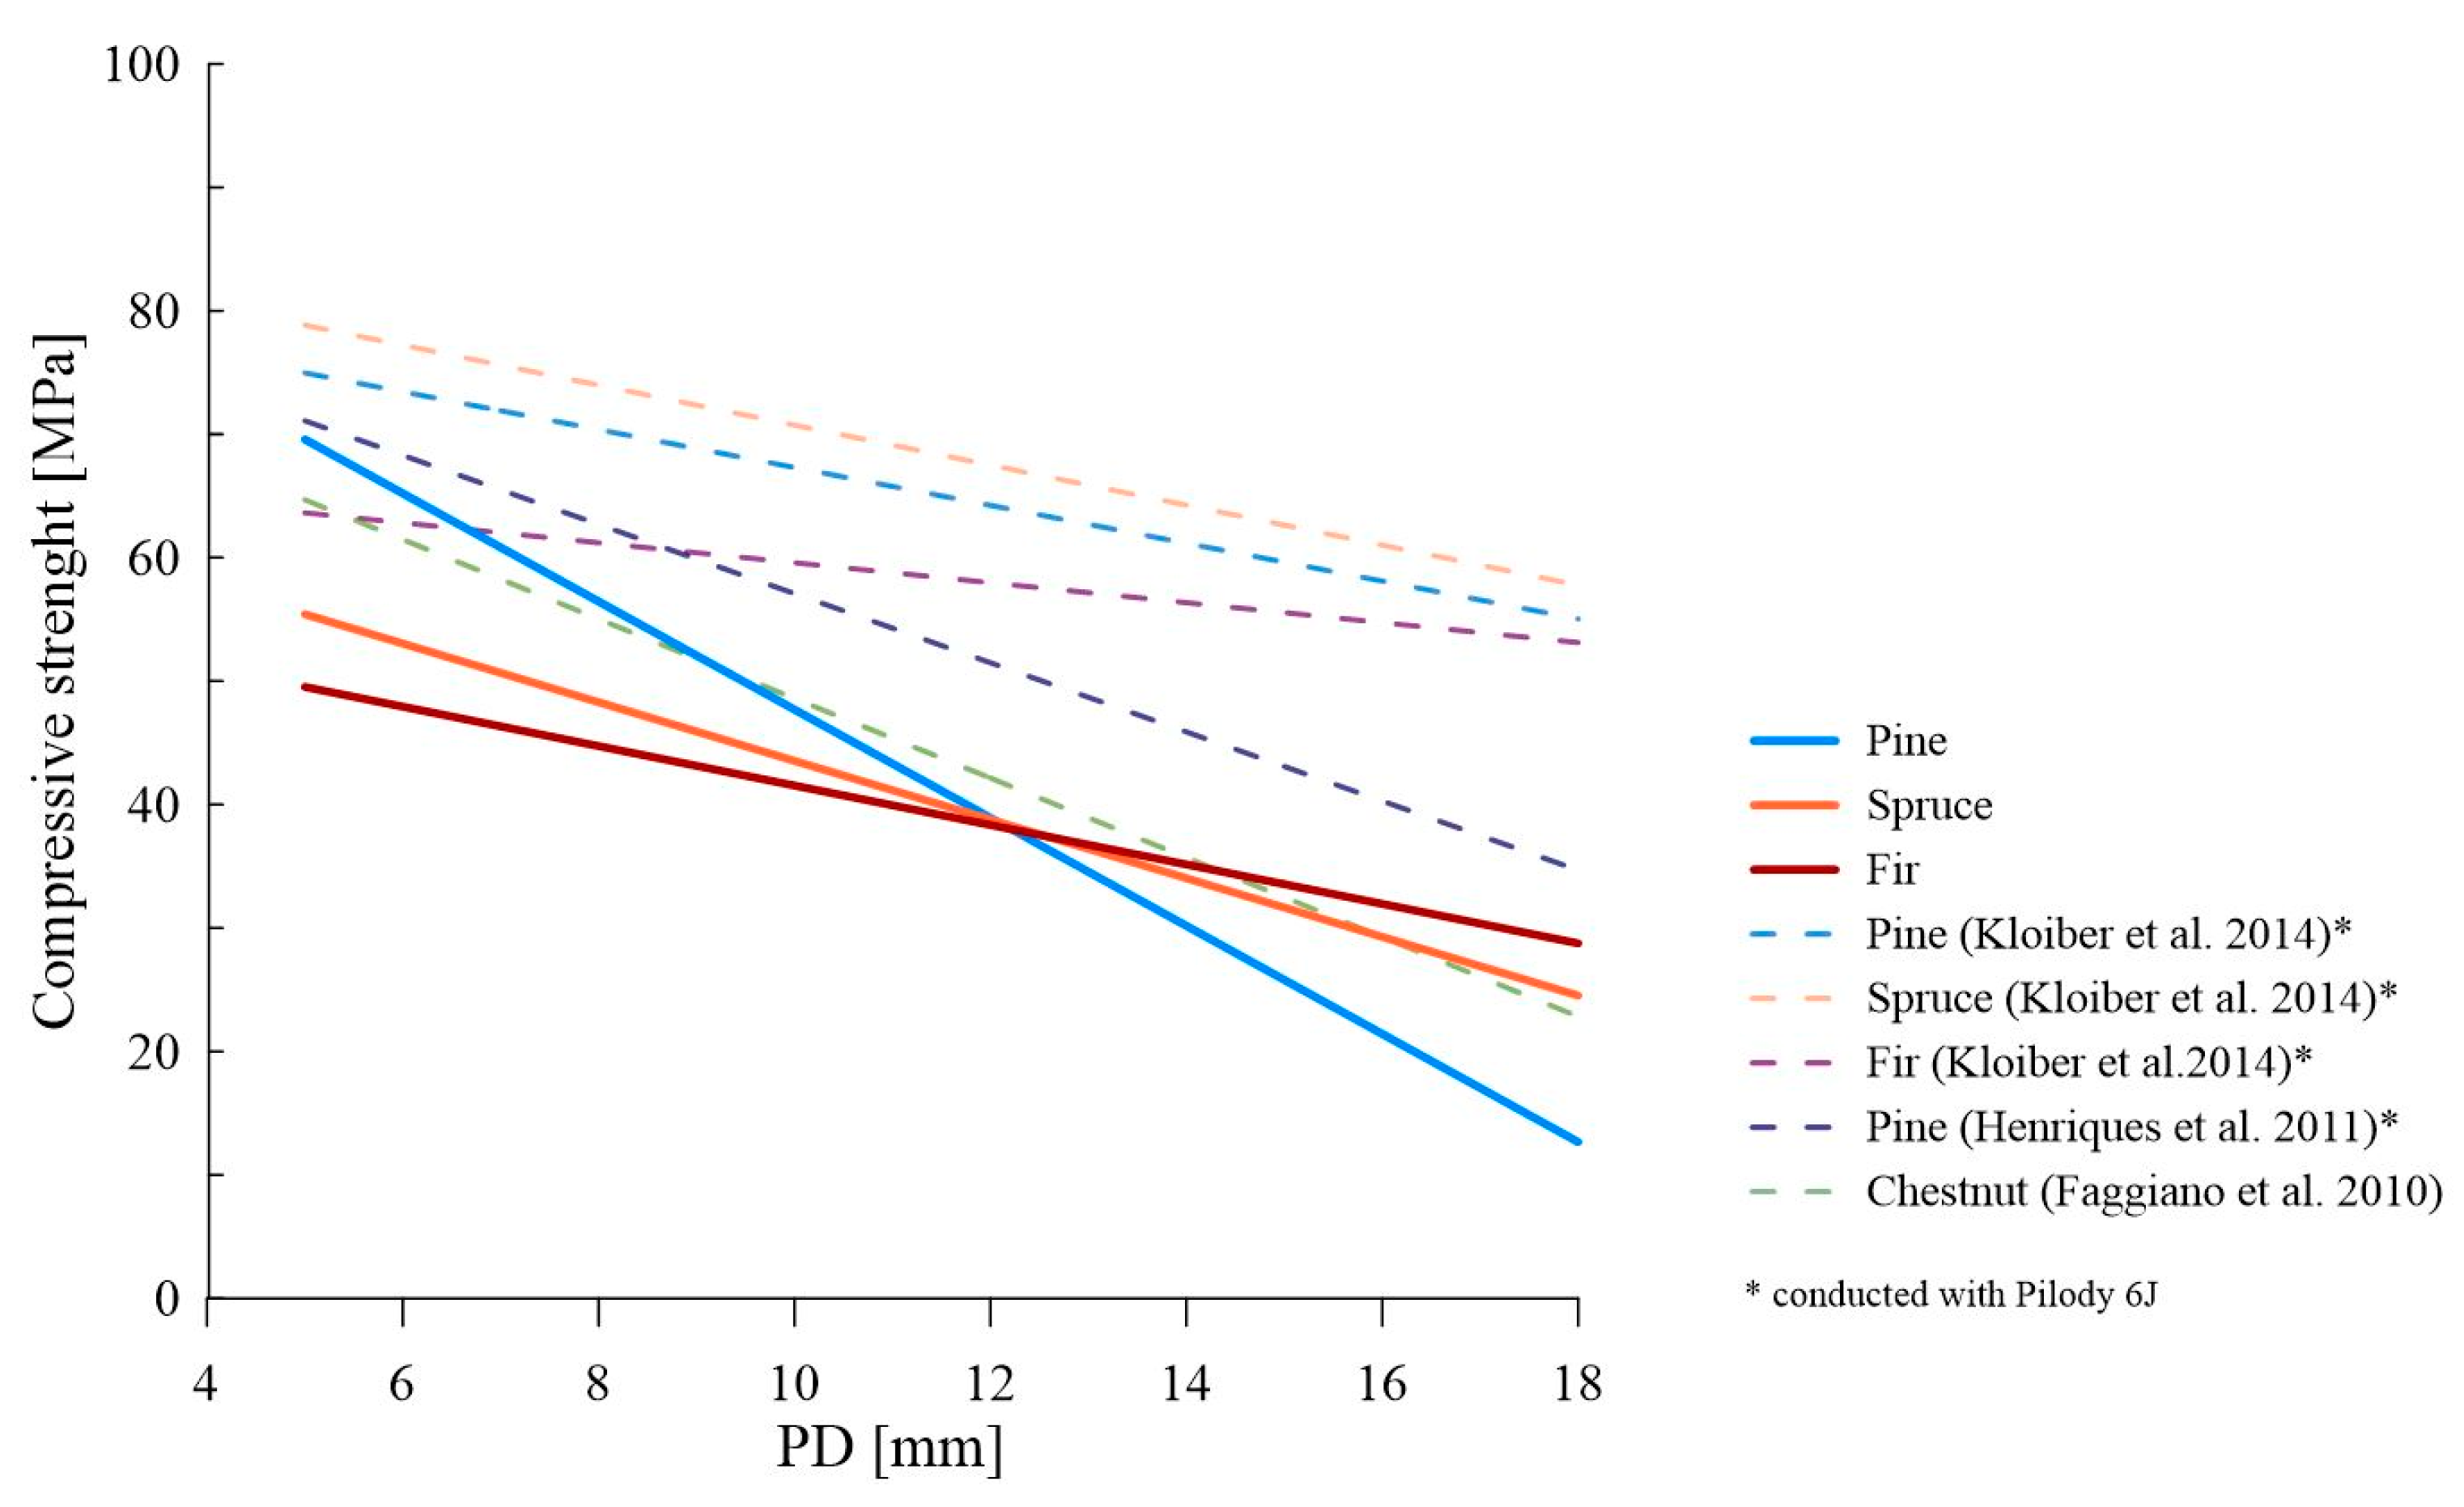
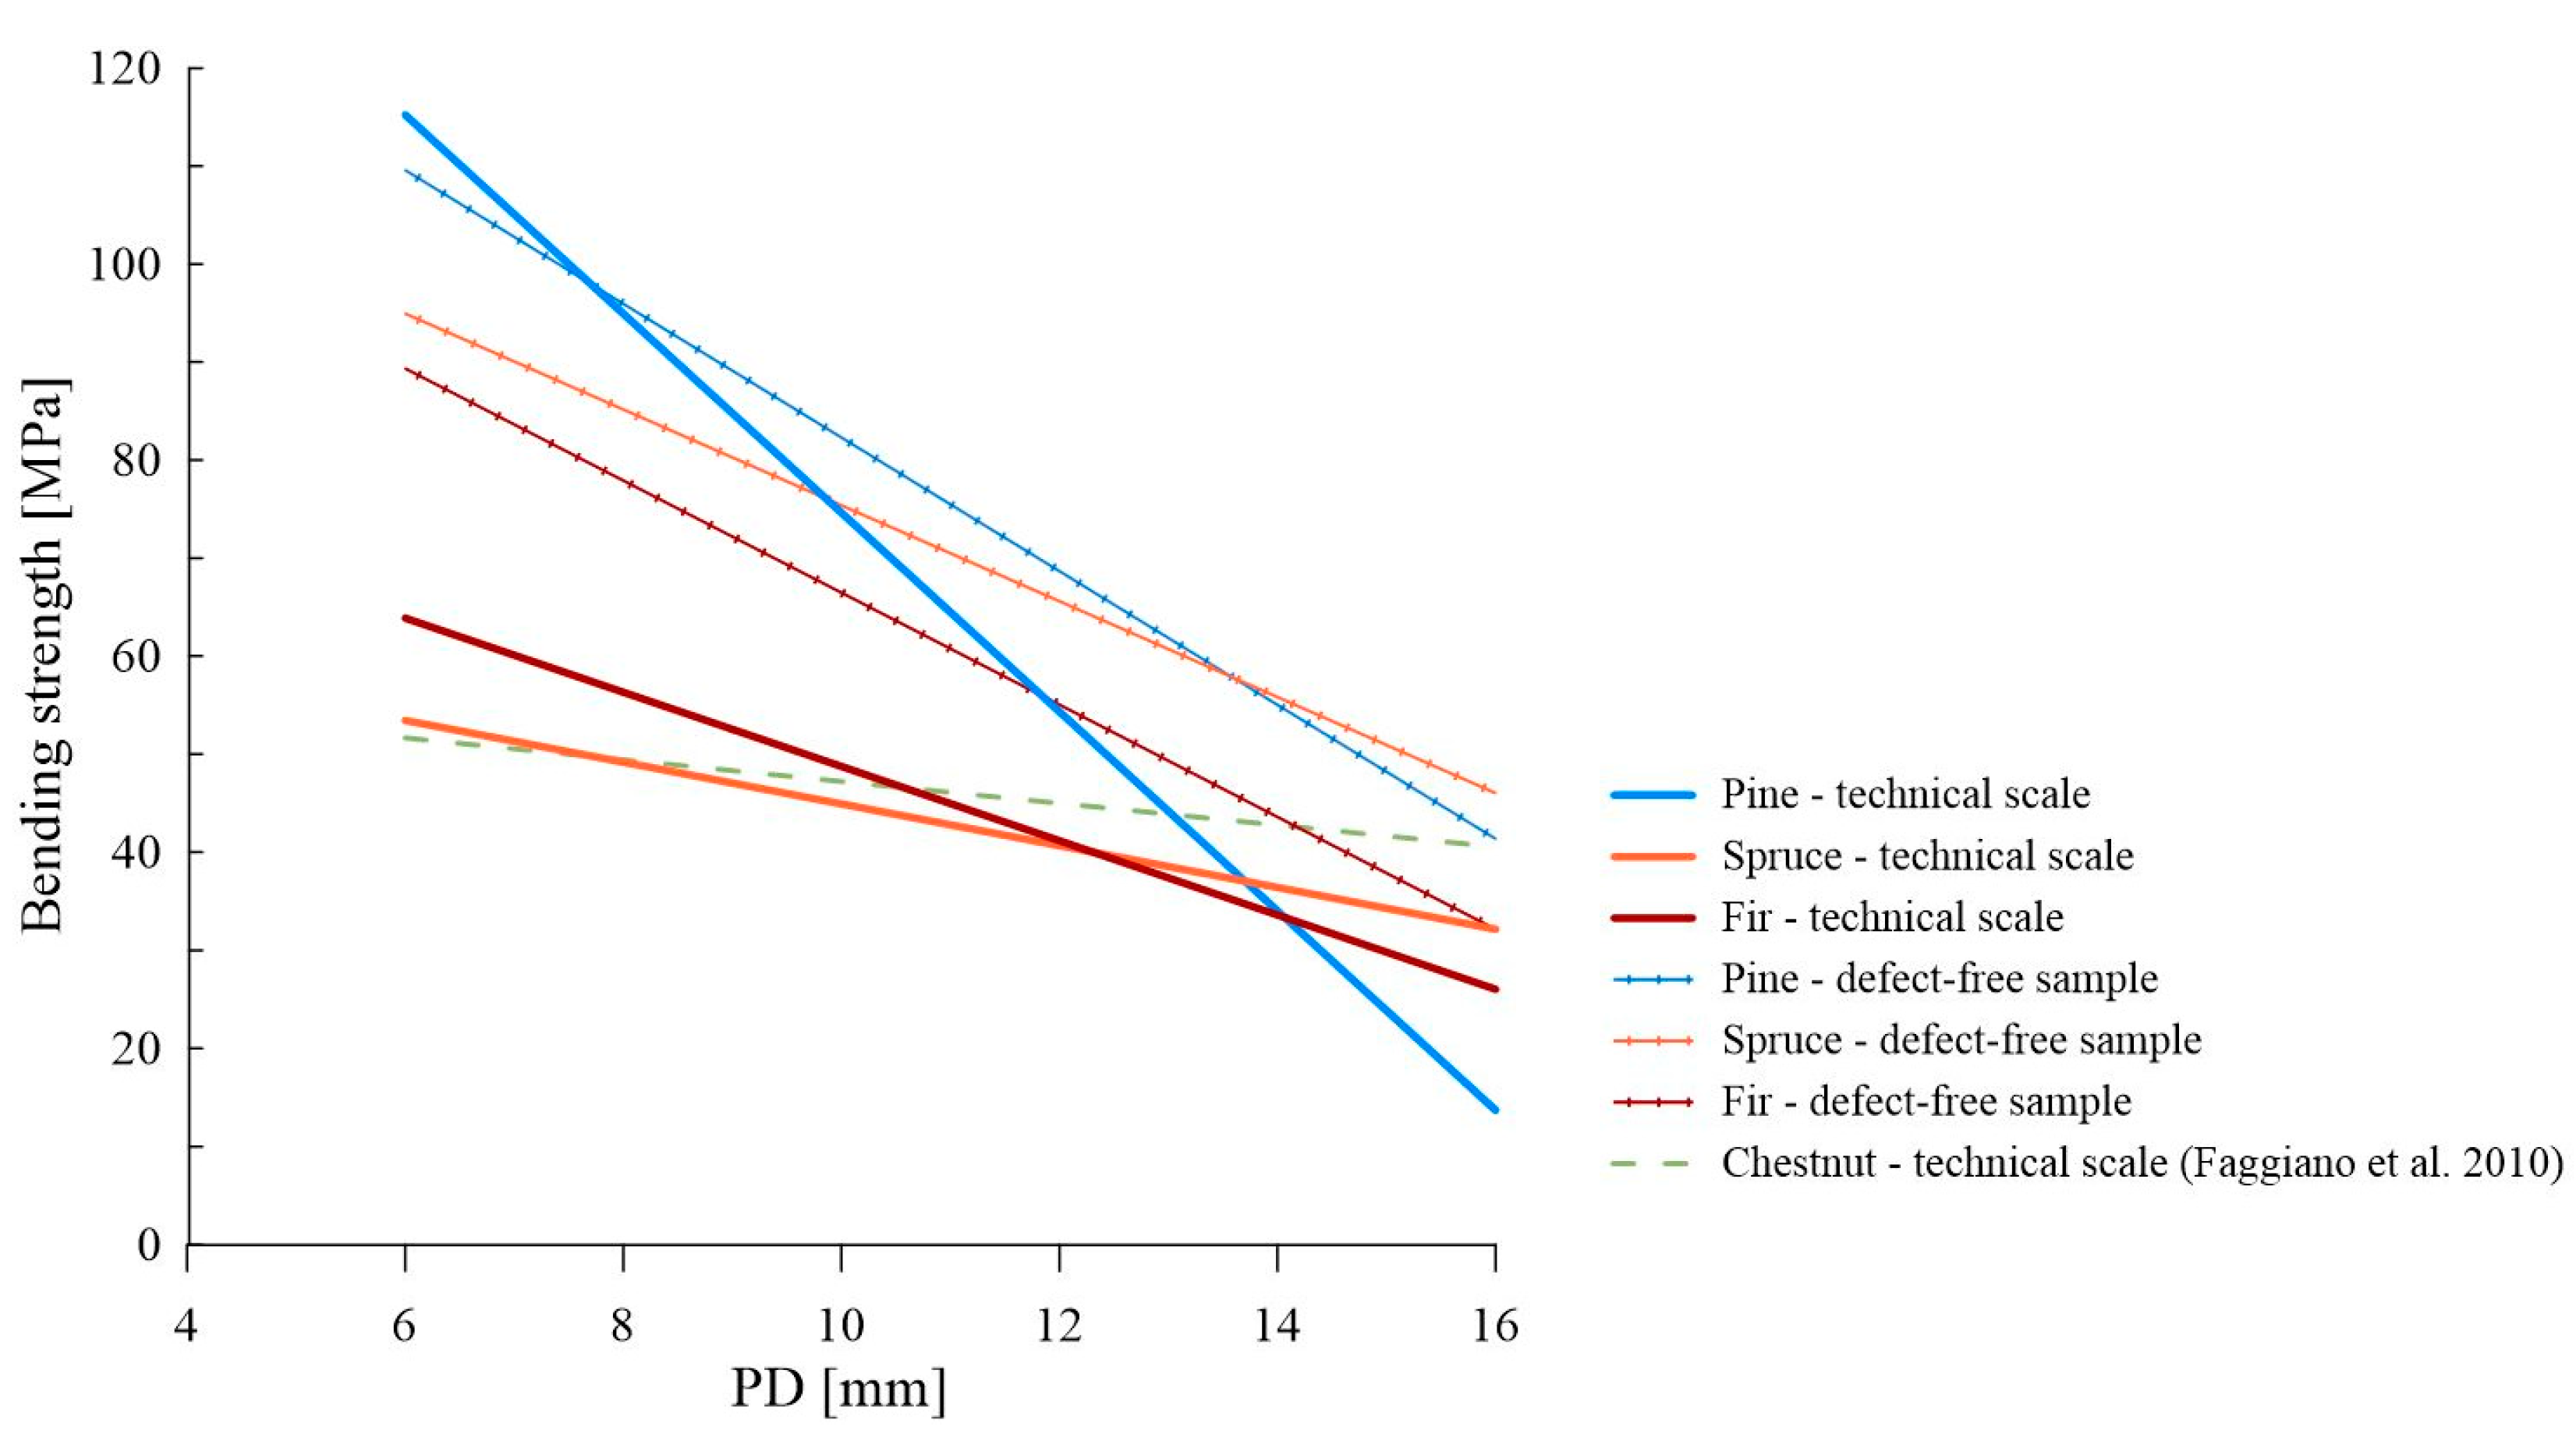
3.1. Correlation Dependencies without Considering Visual Grade
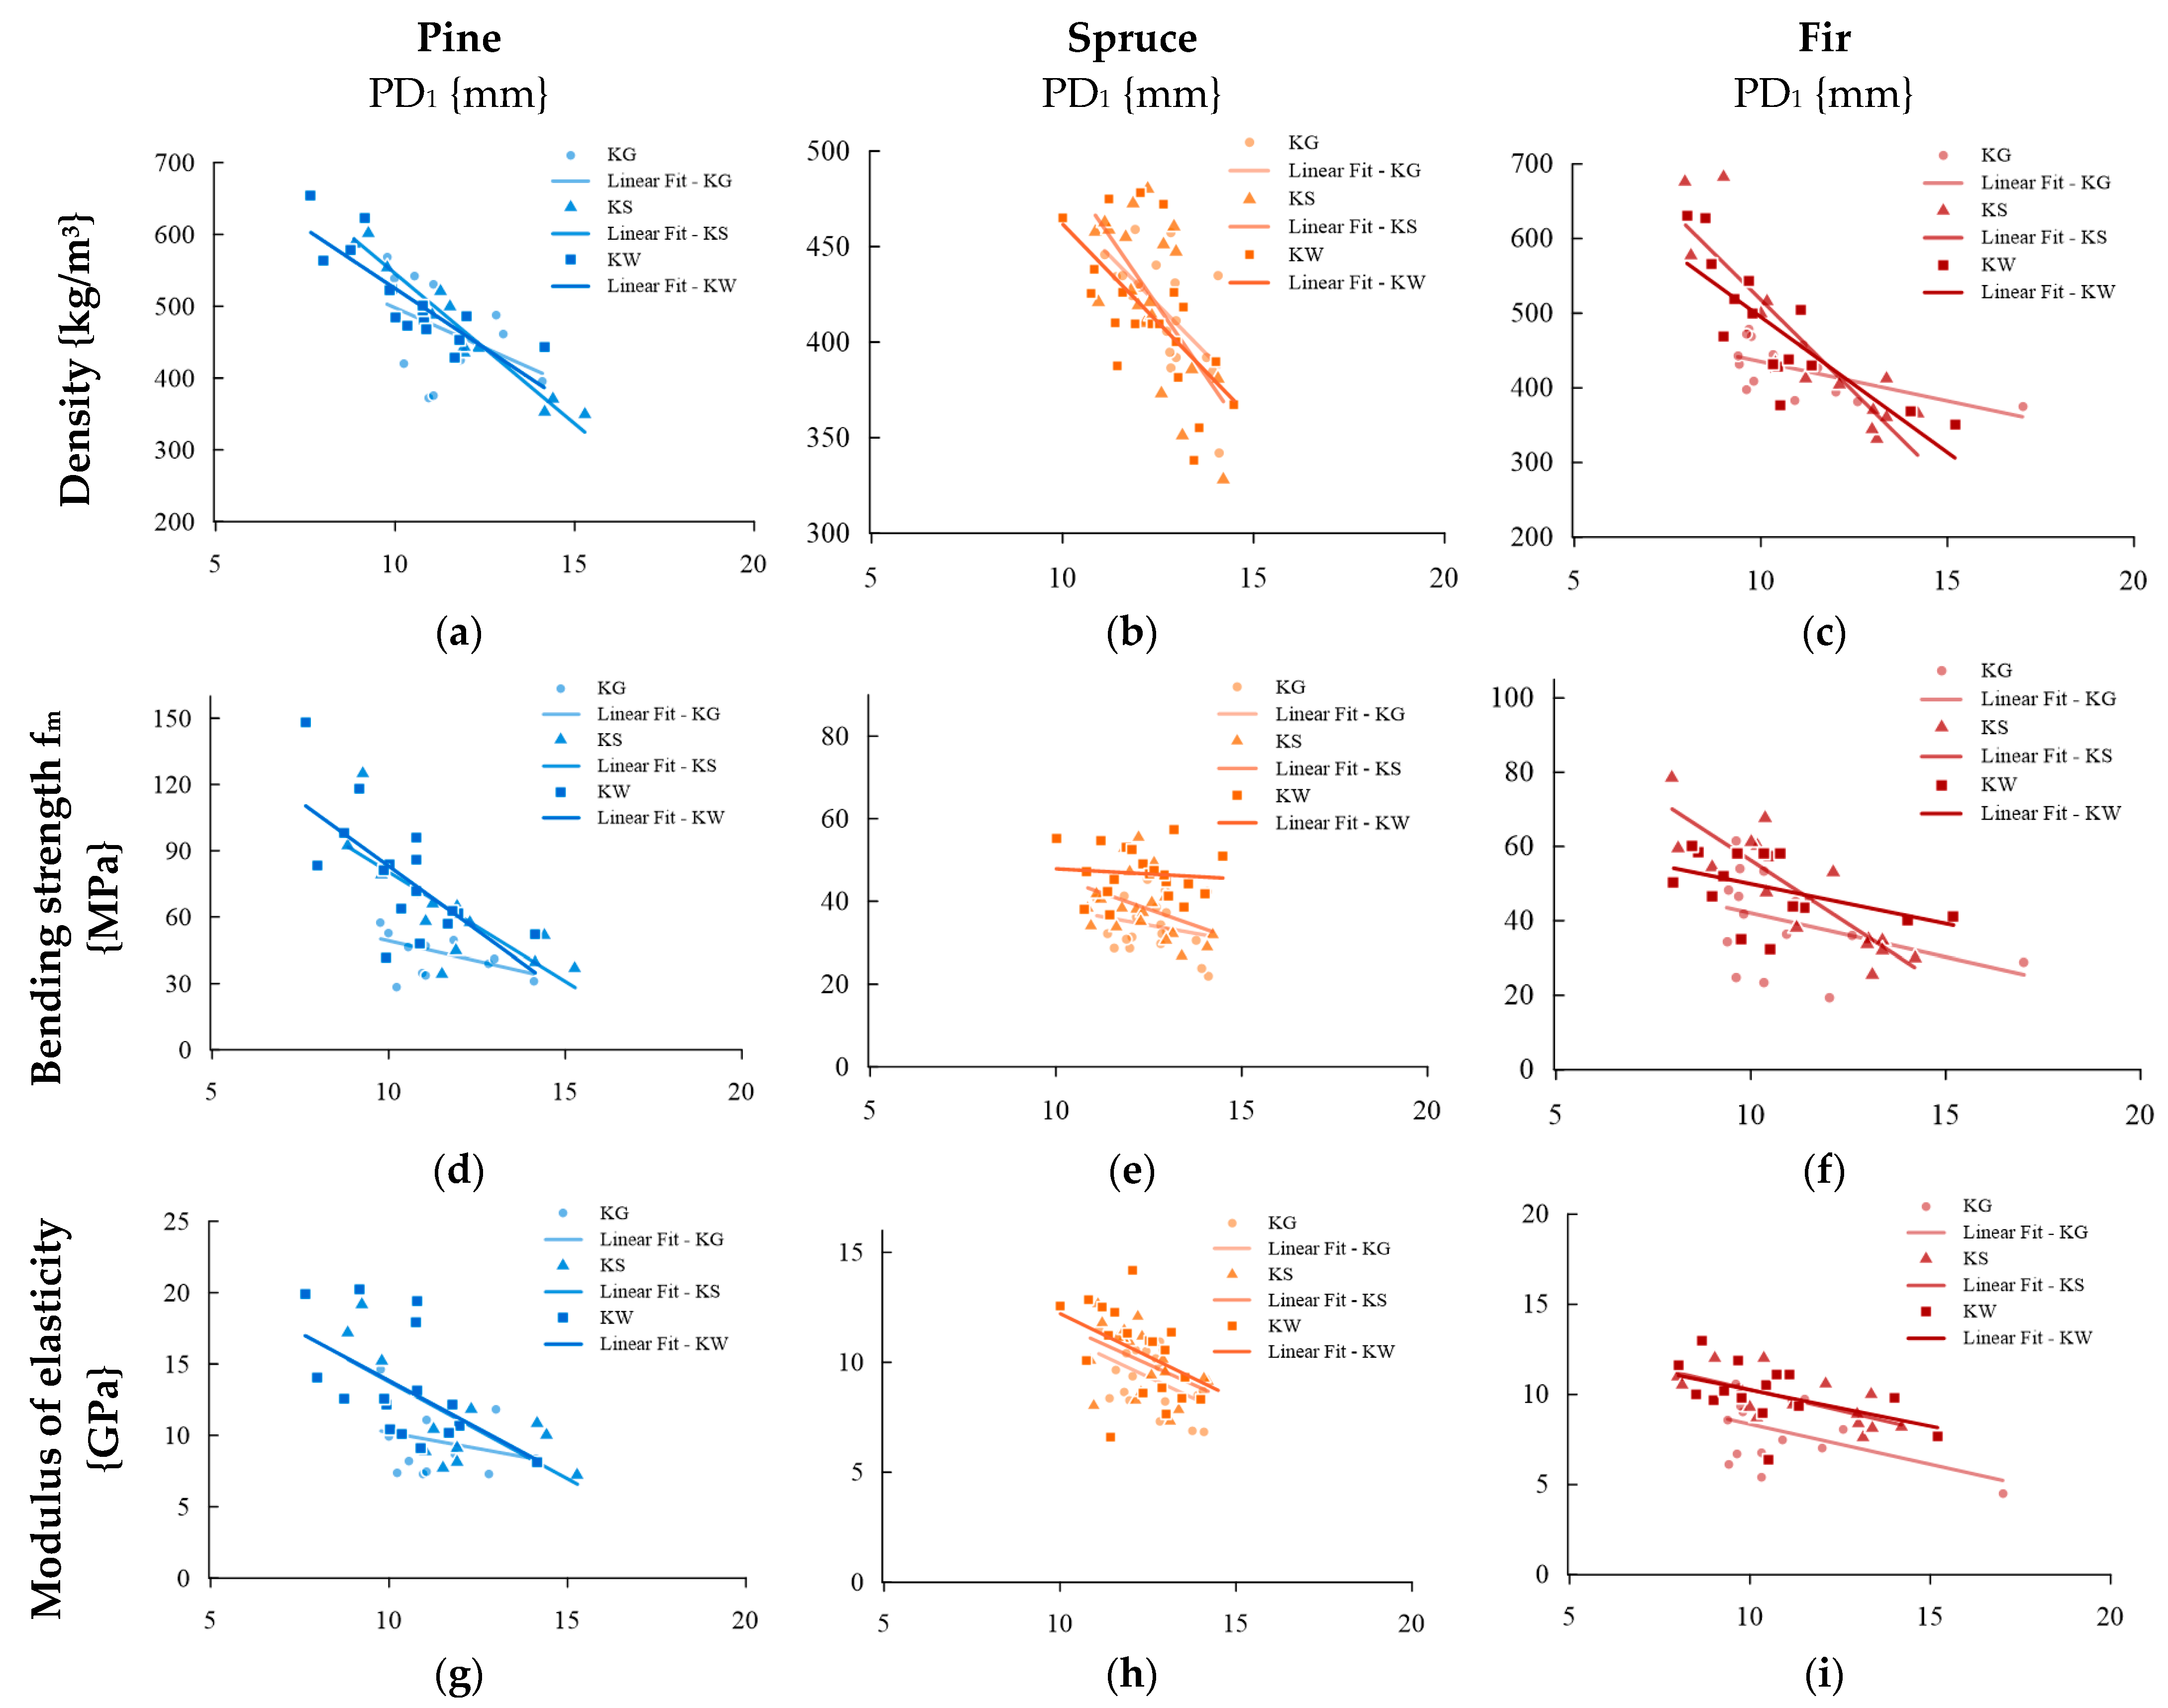
3.2. Correlation Dependencies Considering Visual Grade
4. Discussion
5. Conclusions
Author Contributions
Funding
Institutional Review Board Statement
Informed Consent Statement
Data Availability Statement
Conflicts of Interest
Appendix A

| PD1 | PD2 | ||||
|---|---|---|---|---|---|
| Pine | Scope | 7.5 ÷ 15.5 | 11.0 ÷ 21.0 | {mm} | |
| Density | ρ | = −34.593·PD1 + 870.06 | = −26.299·PD2 + 906.23 | {kg/m3} | |
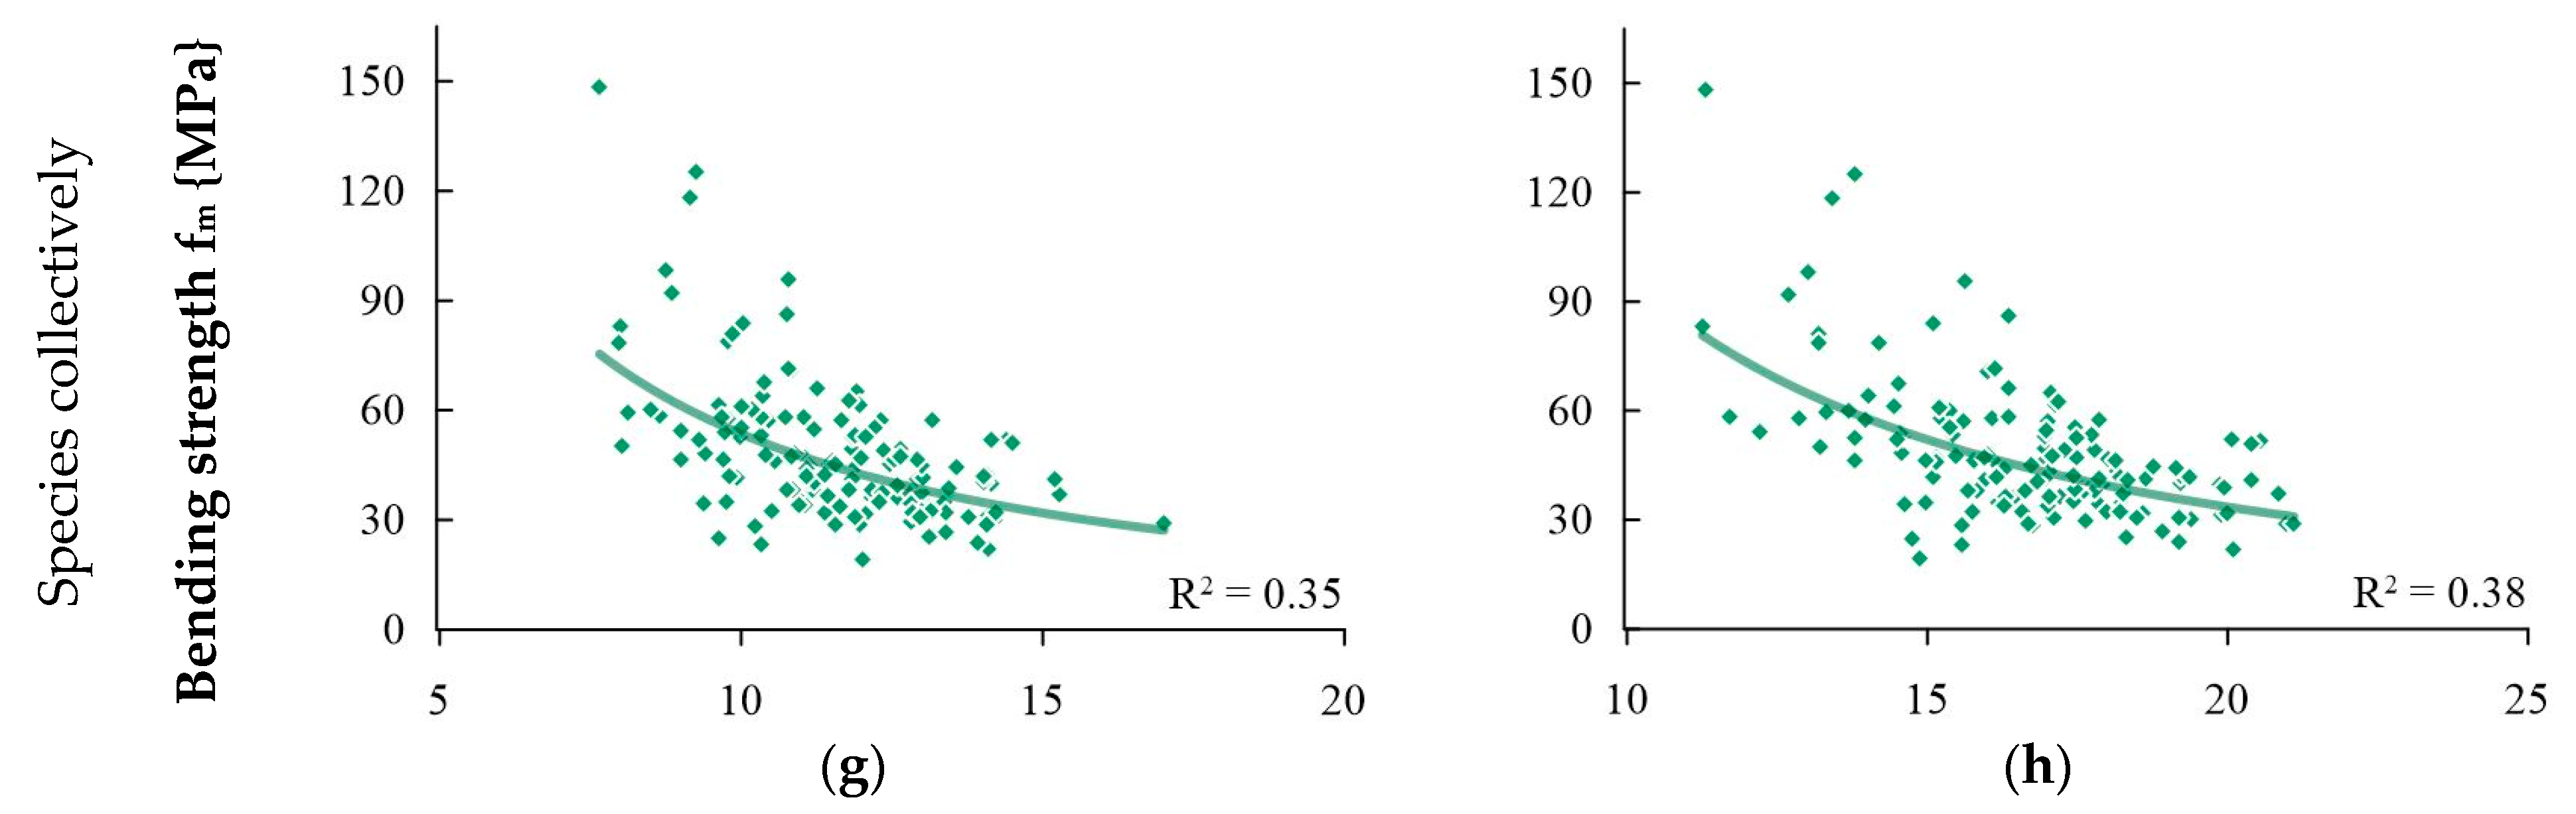
| Bending strength | fm | = −10.152 PD1 + 176.14 | = −7.5324·PD2 + 183.79 | {MPa} | |
| Bending strength | fm’ | = −6.8236 PD1 + 150.54 | = −5.0348·PD2 + 155.24 | {MPa} | |
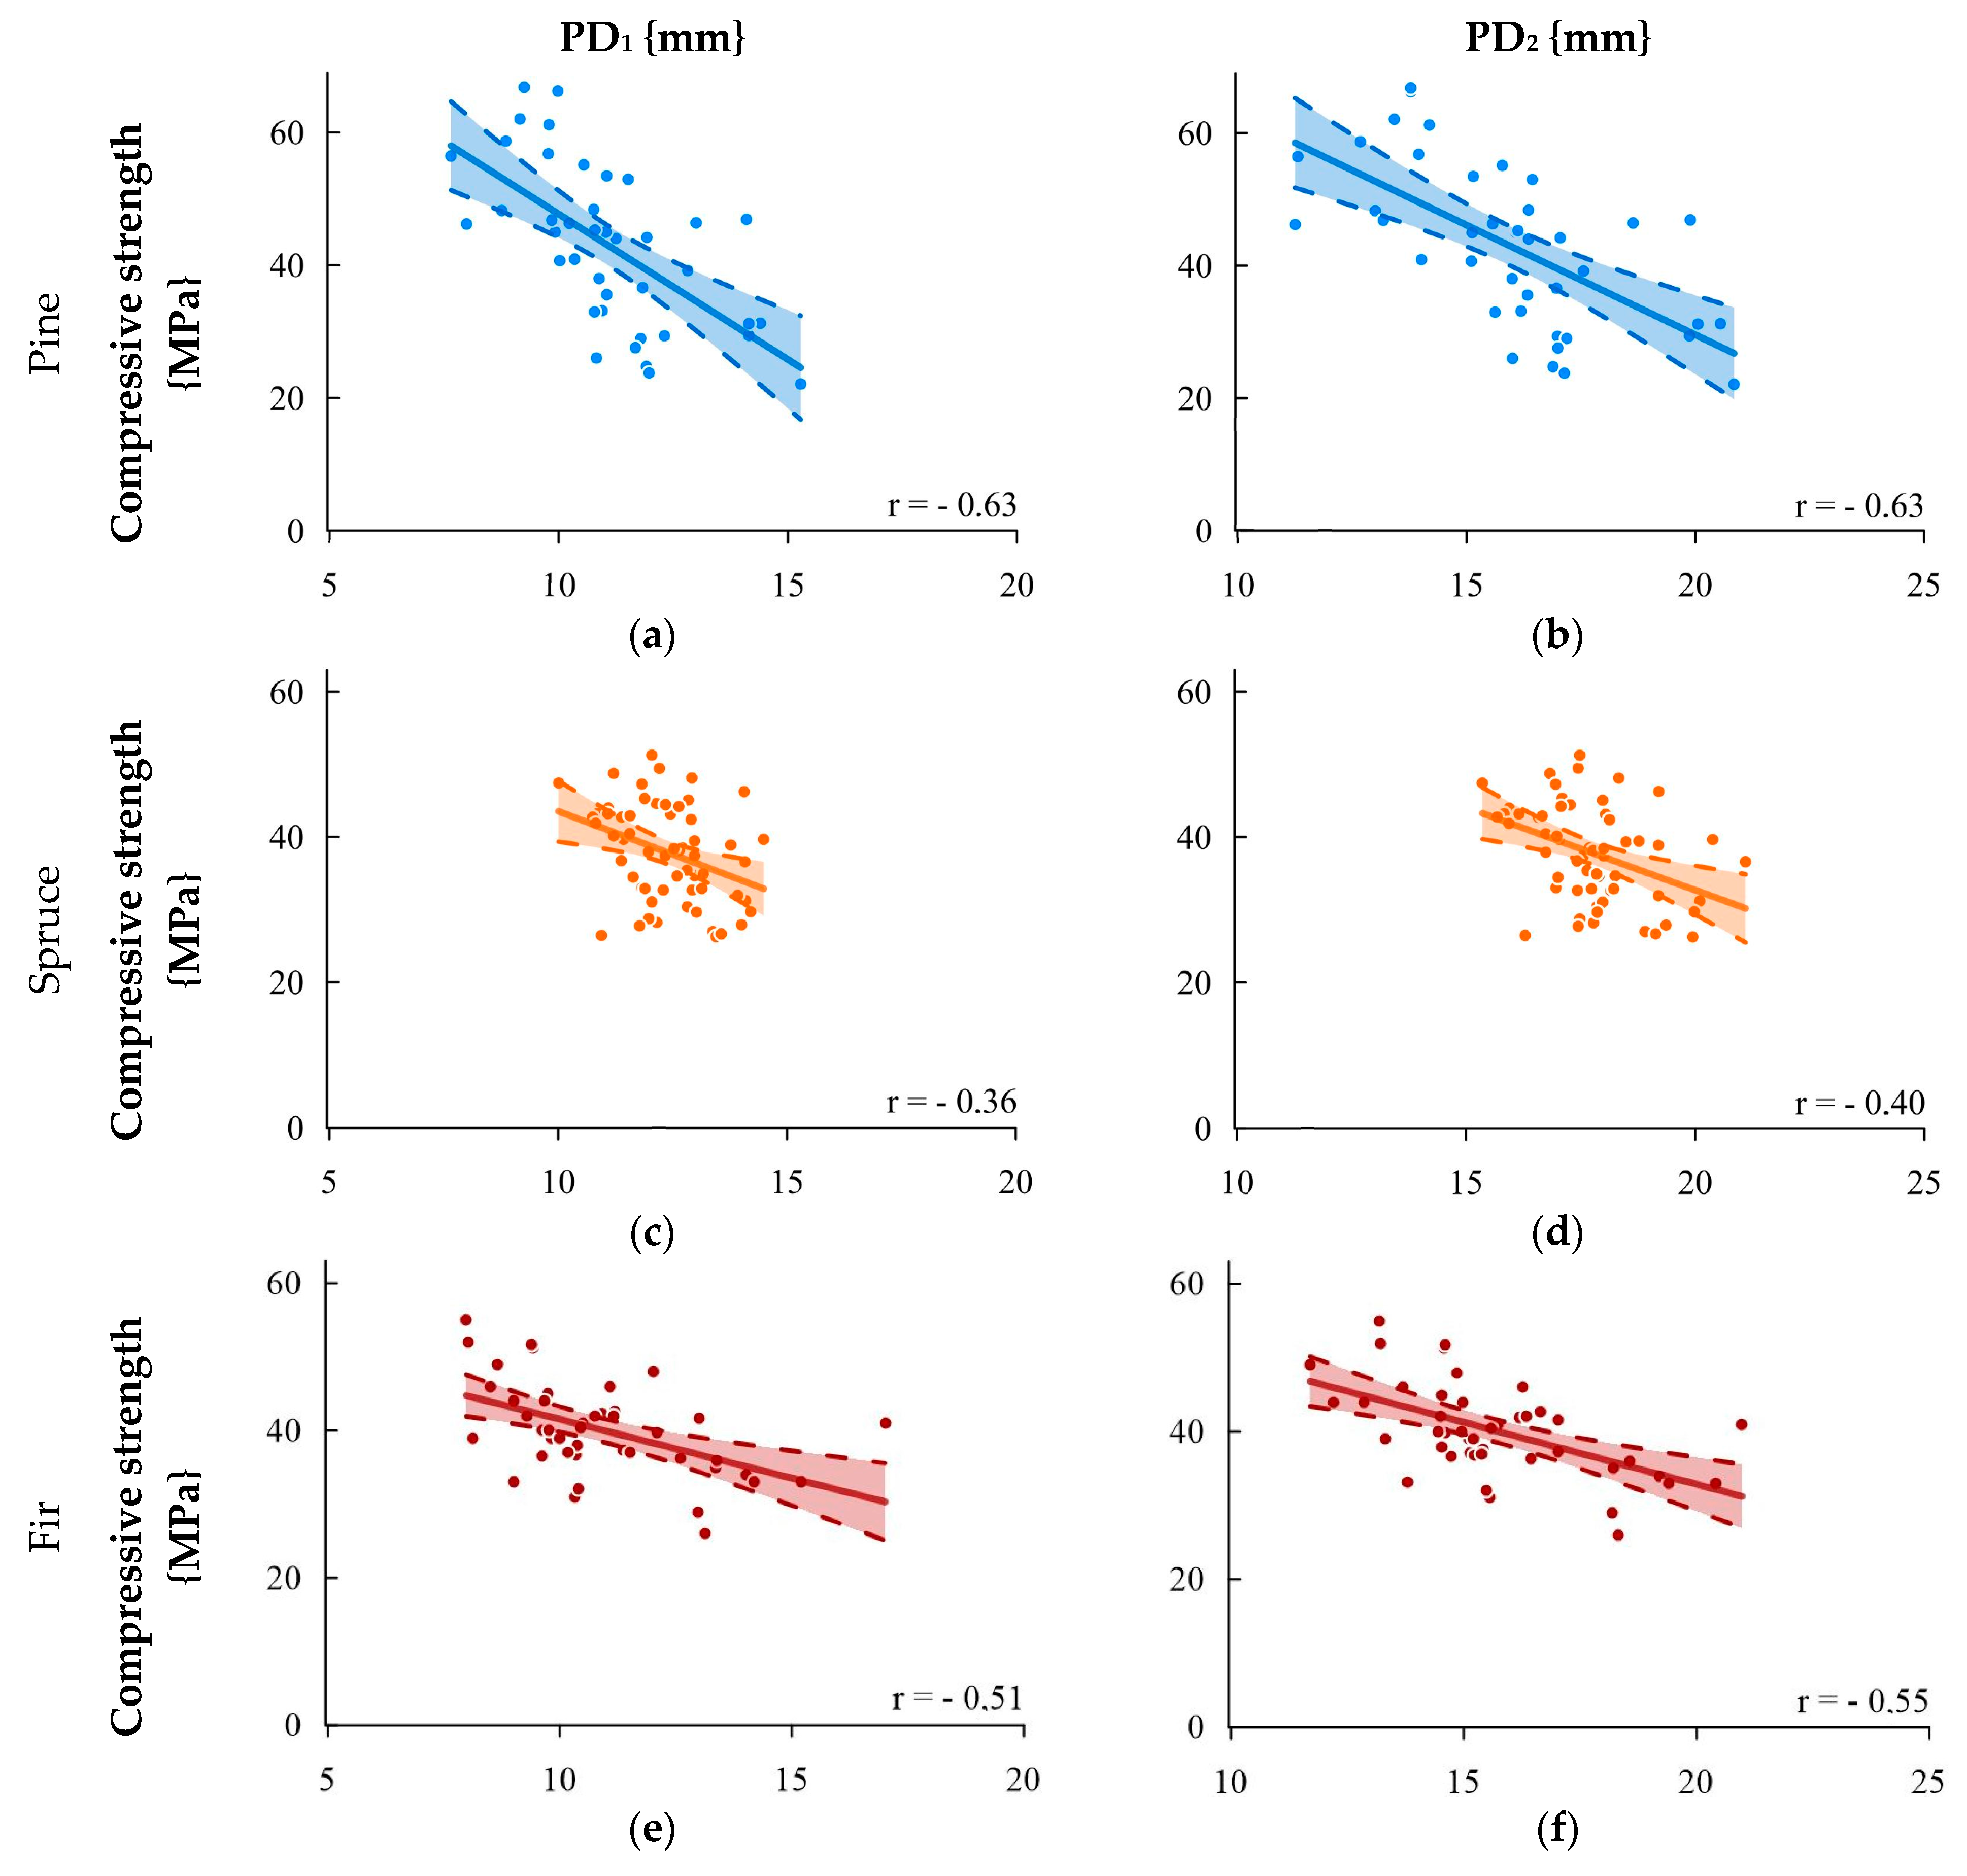
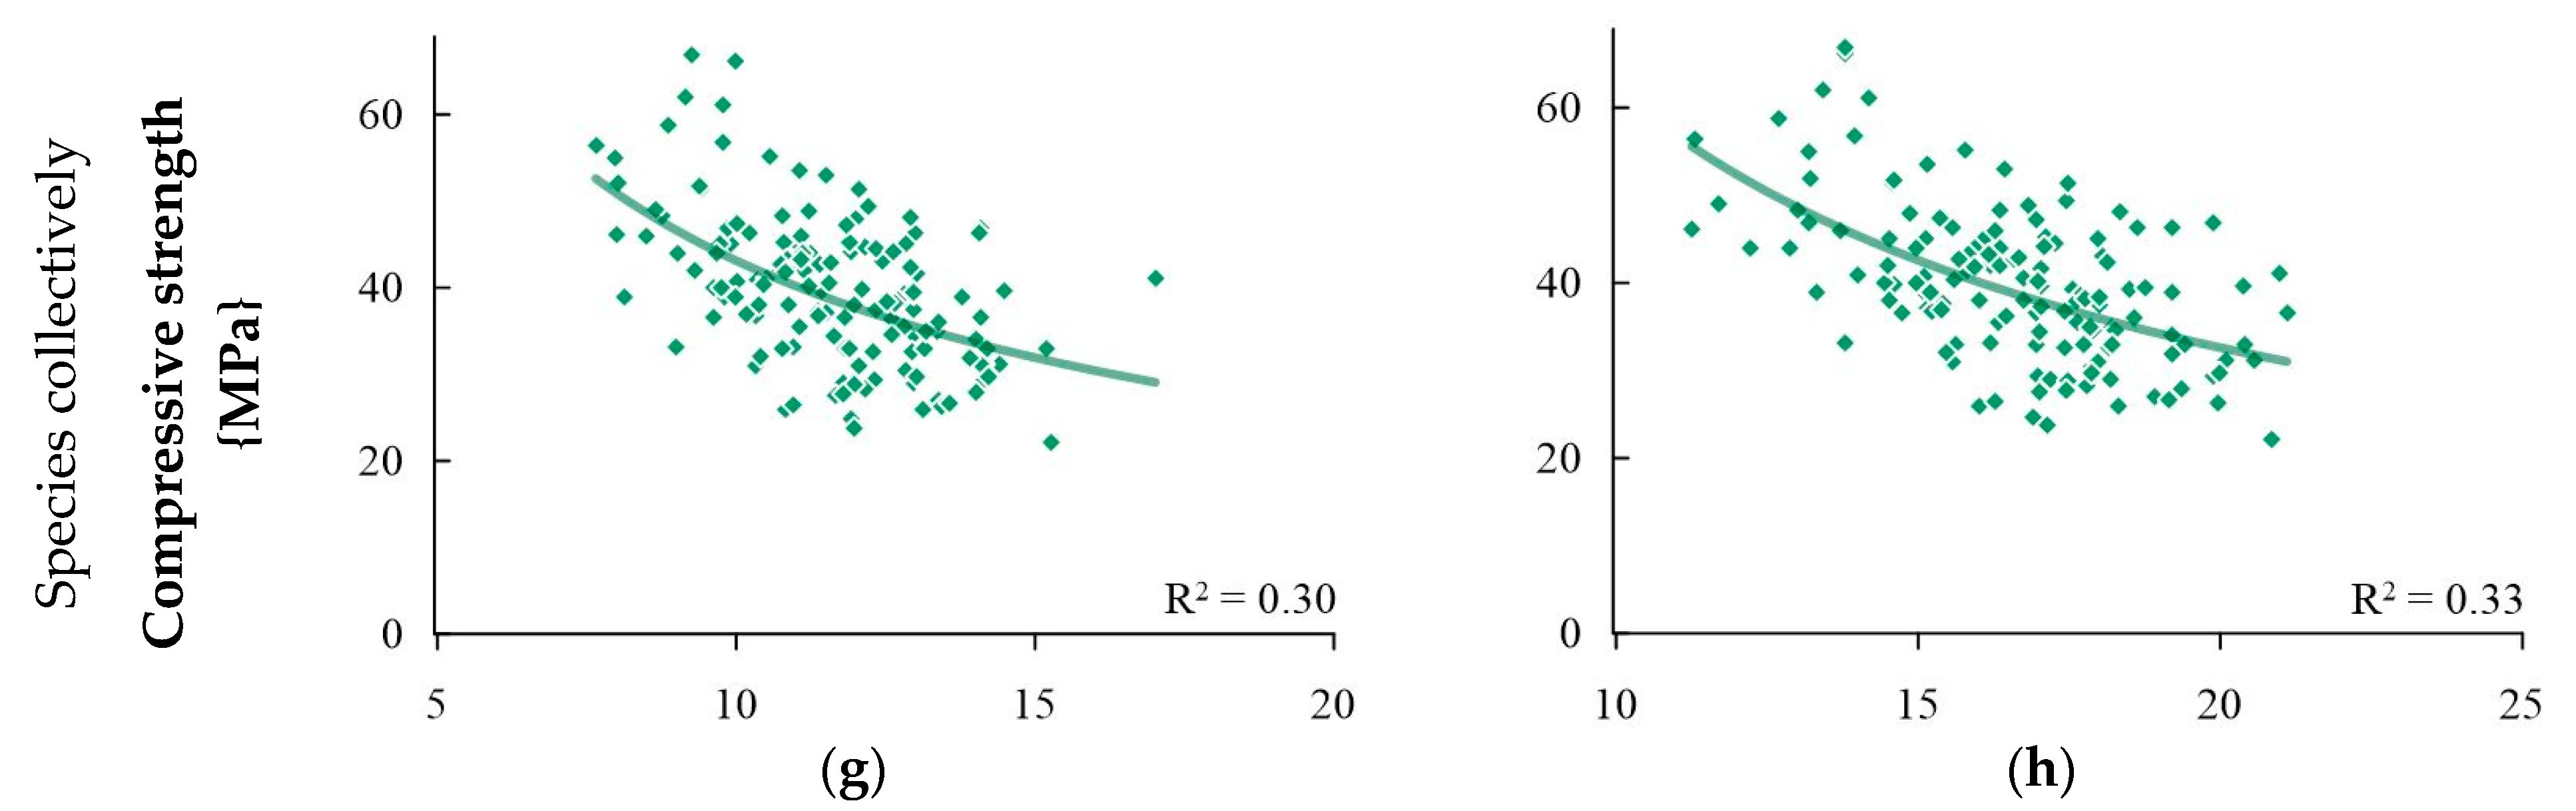
| Compressive strength | fc,0 | = −4.3784 PD1 + 91.476 | = −3.3075·PD2 + 95.719 | {MPa} | |
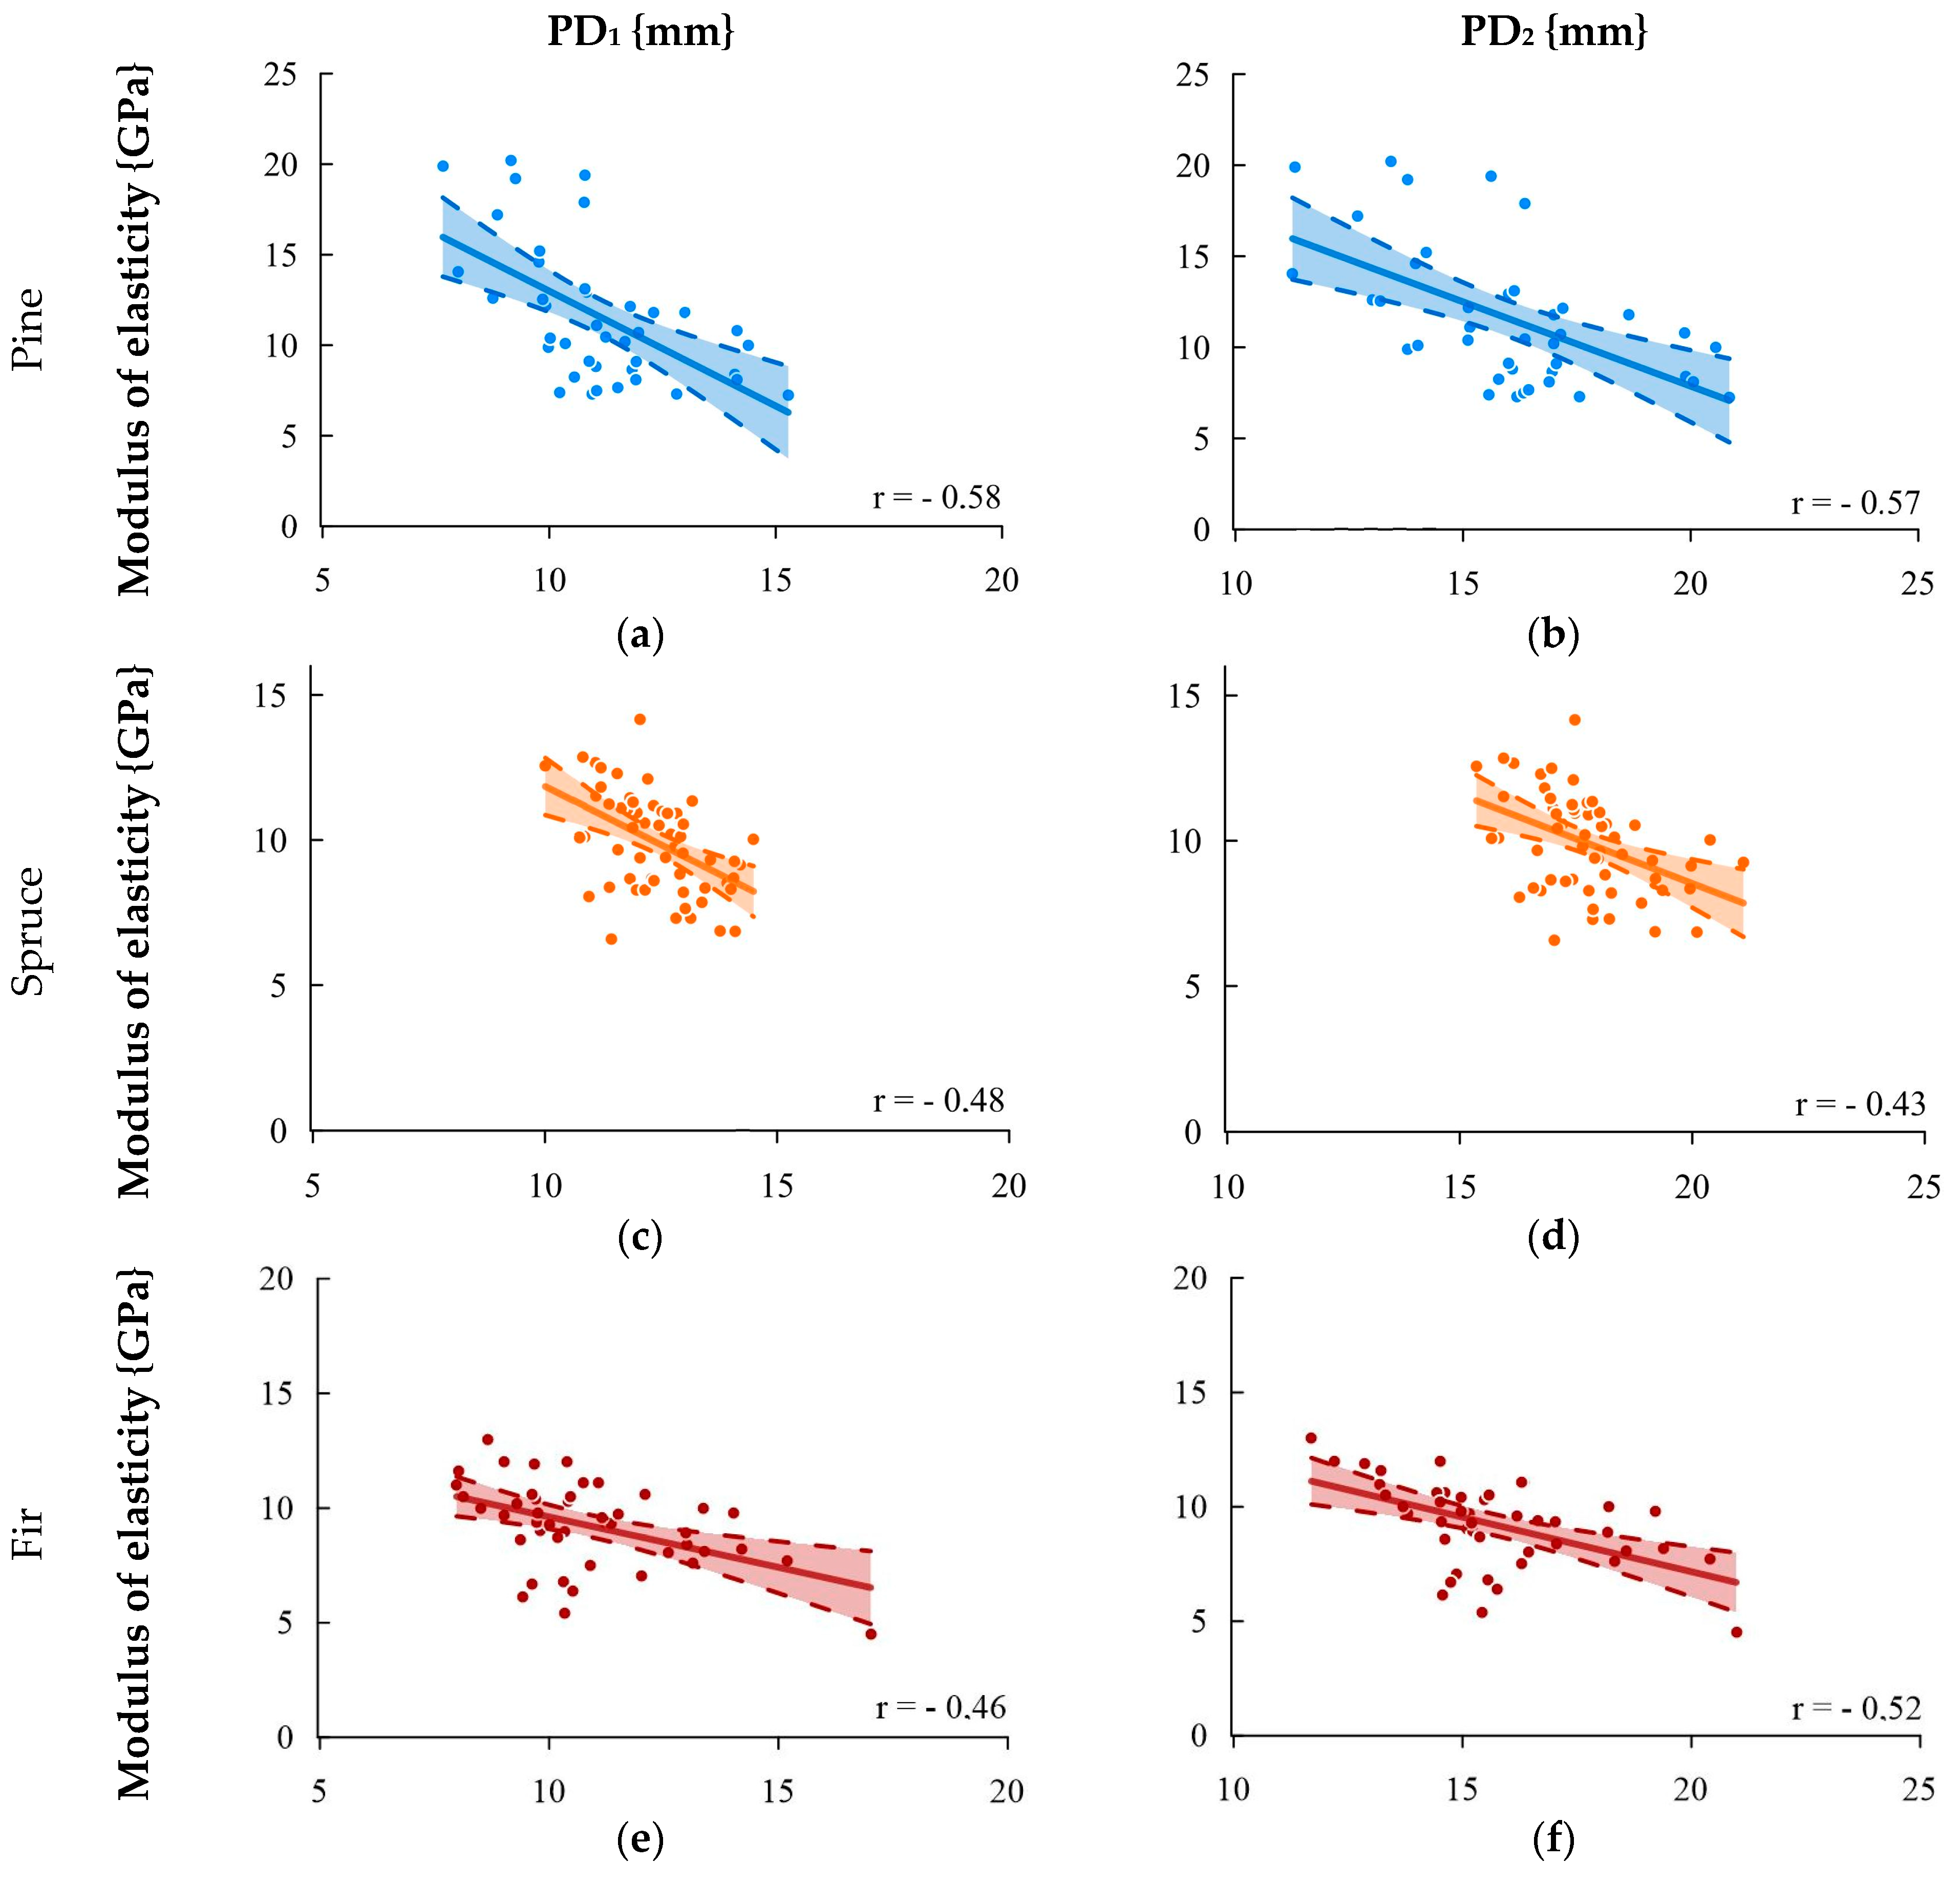
| Modulus of elasticity | E | = −1.2683 PD1 + 25.671 | = −0.926·PD2 + 26.386 | {GPa} | |
| Spruce | Scope | 10.0 ÷ 15.0 | 15.0 ÷ 21.5 | {mm} | |
| Density | ρ | = −22.687·PD1 + 700.07 | = −20.227·PD2 + 777.65 | {kg/m3} | |
| Bending strength | fm | = −2.1265·PD1 + 66.188 | = −1.7908·PD2 + 71.594 | {MPa} | |
| Bending strength | fm’ | = −4.8925·PD1 + 124.3 | = −4.1546·PD2 + 137.35 | {MPa} | |
| Compressive strength | fc,0 | = −2.3761 PD1 + 67.301 | = −2.2765·PD2 + 78.234 | {MPa} | |
| Modulus of elasticity | E | = −0.8063·PD1 + 19.915 | = −0.614·PD2 + 20.811 | {GPa} | |
| Fir | Scope | 7.5 ÷ 17.5 | 11.0 ÷ 21.0 | {mm} | |
| Density | ρ | = −32.383· + 804.88 | = −31.568·PD2 + 947.23 | {kg/m3} | |
| Bending strength | fm | = −3.7841·PD1 + 86.574 | = −3.6131·PD2 + 102.02 | {MPa} | |
| Bending strength | fm’ | = −5.7204·PD1 + 123.67 | = −5.8014·PD2 + 153.3 | {MPa} | |
| Compressive strength | fc,0 | = −1.5976·PD1 + 57.519 | = −1.6767·PD2 + 66.411 | {MPa} | |
| Modulus of elasticity | E | = −0.44·PD1 + 14.017 | = −0.4768·PD2 + 16.701 | {GPa} | |
| Species collectively | Scope | 7.5 ÷ 17.5 | 11.0 ÷ 21.5 | {mm} | |
| Density | ρ | = 2971.5 PD1−0.781 | = 5798.9 PD2−0.918 | {kg/m3} | |
| Bending strength | fm | = 1012.9 PD1−1.277 | = 3257 PD2−1.527 | {MPa} | |
| Bending strength | fm’ | = 616.84 PD1−0.928 | = 1250.8 PD2−1.059 | {MPa} | |
| Compressive strength | fc,0 | = 237.89 PD1−0.742 | = 524.04 PD2−0.927 | {MPa} | |
| Modulus of elasticity | E | = 52 PD1−0.682 | = 98.638 PD2−0.822 | {GPa} |
Appendix B
| PD1 {mm} | PD2 {mm} | |||||
|---|---|---|---|---|---|---|
| Pine | KW | Density | ρ | = −33.22 PD1 + 856.82 | = −22.303 PD2 + 848.31 | {kg/m3} |
| Bending strength | fm | = −11.6 PD1 + 199.02 | = −7.782 PD2 + 195.96 | {MPa} | ||
| Modulus of elasticity | E | = −1.3405 PD1 + 27.239 | = −0.8266 PD2 + 25.788 | {GPa} | ||
| KS | Density | ρ | = −41.832 PD1 + 963.88 | = −32.342 PD2 + 1013.8 | {kg/m3} | |
| Bending strength | fm | = −9.8796 PD1 + 179.12 | = −7.5332 PD2 + 189.14 | {MPa} | ||
| Modulus of elasticity | E | = −1.3594 PD1 + 27.345 | = −1.0637 PD2 + 29.18 | {GPa} | ||
| KG | Density | ρ | = −22.26 PD1 + 720.35 * | = −22.472 PD2 + 834.5 | {kg/m3} | |
| Bending strength | fm | = −3.6176 PD1 + 85.399 * | = −3.179 PD2 + 96.23 * | {MPa} | ||
| Modulus of elasticity | E | = −0.455 PD1 + 14.756 * | = −0.446 PD2 + 16.872 * | {GPa} | ||
| Spruce | KW | Density | ρ | = −20.593 PD1 + 667.71 | = −20.926 PD2 + 784.76 | {kg/m3} |
| Bending strength | fm | = −0.4964 PD1 + 52.812 | = −0.6619 PD2 + 58.424 | {MPa} | ||
| Modulus of elasticity | E | = −0.7766 PD1 + 19.982 | = −0.6322 PD2 + 21.616 | {GPa} | ||
| KS | Density | ρ | = −29.083 PD1 + 782.15 | = −21.57 PD2 + 806.74 | {kg/m3} | |
| Bending strength | fm | = −3.1565 PD1 + 77.495 | = −2.7742 PD2 + 87.85 | {MPa} | ||
| Modulus of elasticity | E | = −0.7221 PD1 + 18.942 | = −0.502 PD2 + 18.958 | {GPa} | ||
| KG | Density | ρ | = −20.291 PD1 + 673.12 | = −17.348 PD2 + 726.35 | {kg/m3} | |
| Bending strength | fm | = −1.6089 PD1 + 54.343 * | = −1.5538 PD2 + 61.741 * | {MPa} | ||
| Modulus of elasticity | E | = −0.7534 PD1 + 18.753 | = −0.6786 PD2 + 21.344 | {GPa} | ||
| Fir | KW | Density | ρ | = −36.286 PD1 + 857.75 | = −30.493 PD2 + 947.62 | {kg/m3} |
| Bending strength | fm | = −2.133 PD1 + 71.234 | = −2.0624 PD2 + 80.667 | {MPa} | ||
| Modulus of elasticity | E | = −0.4017 PD1 + 14.267 | = −0.4148 PD2 + 16.449 | {GPa} | ||
| KS | Density | ρ | = −49.538 PD1 + 1013.4 | = −43.799 PD2 + 1155.4 | {kg/m3} | |
| Bending strength | fm | = −6.8475 PD1 + 124.72 | = −6.1616 PD2 + 146.07 | {MPa} | ||
| Modulus of elasticity | E | = −0.4654 PD1 + 14.923 | = −0.5068 PD2 + 17.783 | {GPa} | ||
| KG | Density | ρ | = −10.538 PD1 + 540.5 | = −11.415 PD2 + 603.89 * | {kg/m3} | |
| Bending strength | fm | = −2.3566 PD1 + 65.605 * | = −2.314 PD2 + 76.06 * | {MPa} | ||
| Modulus of elasticity | E | = −0.4455 PD1 + 12.809 * | = −0.5873 PD2 + 17.121 * | {GPa} |
Appendix C
| PD1 {mm} | PD2 {mm} | ||||
|---|---|---|---|---|---|
| Pine | Scope | 7.5 ÷ 15.5 | 11.0 ÷ 21.0 | {mm} | |
| Density | ρ5% | = −34.6·PD1 + 825 | = −26.3·PD2 + 840 | {kg/m3} | |
| Bending strength | fm5% | = −10.1 PD1 + 155 | = −7.5·PD2 + 160 | {MPa} | |
| Bending strength | fm’5% | = −6.8 PD1 + 128 | = −5.0·PD2 + 133 | {MPa} | |
| Compressive strength | fc,05% | = −4.4 PD1 + 80 | = −3.3·PD2 + 84 | {MPa} | |
| Modulus of elasticity | E5% | = −1.35 PD1 + 23.3 | = −0.9·PD2 + 22.5 | {GPa} | |
| Spruce | Scope | 10.0 ÷ 15.0 | 15.0 ÷ 21.5 | {mm} | |
| Density | ρ5% | = −22.9·PD1 +660 | = −20.4·PD2 + 740 | {kg/m3} | |
| Bending strength | fm5% | = −2.1·PD1 + 56.2 | = −2.3·PD2 + 71.3 | {MPa} | |
| Bending strength | fm’5% | = −4.9·PD1 + 114.1 | = −4.2·PD2 + 128.5 | {MPa} | |
| Compressive strength | fc,05% | = −2.4·PD1 + 60.5 | = −2.3·PD2 + 70.8 | {MPa} | |
| Modulus of elasticity | E5% | = −0.95·PD1 +19.9 | = −0.7·PD2 + 20.4 | {GPa} | |
| Fir | Scope | 7.5 ÷ 17.5 | 11.0 ÷ 21.0 | {mm} | |
| Density | ρ5% | = −32.3·PD1 + 750 | = −31.6·PD2 + 902 | {kg/m3} | |
| Bending strength | fm5% | = −3.8·PD1 + 76.4 | = −3.6·PD2 + 90.3 | {MPa} | |
| Bending strength | fm’5% | = −5.7·PD1 + 110.4 | = −5.8·PD2 + 140.5 | {MPa} | |
| Compressive strength | fc,05% | = −1.6·PD1 + 51.3 | = −1.7·PD2 + 62 | {MPa} | |
| Modulus of elasticity | E5% | = −0.44·PD1 + 12 | = −0.48·PD2 + 14.6 | {GPa} | |
| Species collectively | Scope | 7.5 ÷ 17.5 | 11.0 ÷ 21.5 | {mm} | |
| Density | ρ5% | = 2971 PD1−0.85 | = 5799 PD2−0.97 | {kg/m3} | |
| Bending strength | fm5% | = 1013 PD1−1.43 | = 3257 PD2−1.65 | {MPa} | |
| Bending strength | fm’5% | = 616 PD1−1.03 | = 1250 PD2−1.15 | {MPa} | |
| Compressive strength | fc,05% | = 237 PD1−0.85 | = 524 PD2−1.02 | {MPa} | |
| Modulus of elasticity | E5% | = 52 PD1−0.81 | = 98.7 PD2−0.91 | {GPa} |
References
- Branco, J.M.; Descamps, T.; Tsakanika, E. Repair and Strengthening of Traditional Timber Roof and Floor Structures. In Strengthening and Retrofitting of Existing Structures; Springer: Singapore, 2018; pp. 113–138. [Google Scholar] [CrossRef]
- Yu, T.; Sousa, H.S.; Branco, J.M. Combination of non-destructive tests for assessing decay in existing timber elements. Nondestruct. Test. Eval. 2020, 35, 29–47. [Google Scholar] [CrossRef]
- Kloiber, M.; Frankeová, D.; Slížková, Z.; Kunecký, J. Repair of Old Timber Log House Using Cavity Filling with Compatible Natural Materials. Buildings 2023, 13, 550. [Google Scholar] [CrossRef]
- ISO 13822; Bases for design of structures—Assessment of Existing Structures. ISO: Geneva, Switzerland, 2010.
- Nowogońska, B. Diagnoses in the aging process of residential buildings constructed using traditional technology. Buildings 2019, 9, 126. [Google Scholar] [CrossRef]
- Palma, P.; Steiger, R. Structural health monitoring of timber structures—Review of available methods and case studies. Constr. Build. Mater. 2020, 248, 118528. [Google Scholar] [CrossRef]
- Kasal, B.; Gretchen, L.; Tannert, T.; Sbartai, M.; Anthony, R.W.; Yamaguchi, N.; Riggio, M.; Piazza, M.; Macchioni, N.; Pignatelli, O.; et al. In Situ Assessment of Structural Timber; State of the Art Report of the RILEM Technical Committee 215-AST; Kasal, B., Tannert, T., Eds.; Springer: Dordrecht, The Netherlands; Berlin/Heidelberg, Germany; London, UK; New York, NY, USA, 2010; ISBN 9789400705593. [Google Scholar]
- Riggio, M.; Anthony, R.W.; Augelli, F.; Kasal, B.; Lechner, T.; Muller, W.; Tannert, T. In situ assessment of structural timber using semi-destructive techniques. Mater. Struct. 2014, 47, 767–785. [Google Scholar] [CrossRef]
- Nowak, T.P.; Jasieńko, J.; Hamrol-Bielecka, K. In situ assessment of structural timber using the resistance drilling method—Evaluation of usefulness. Constr. Build. Mater. 2016, 102, 403–415. [Google Scholar] [CrossRef]
- Cai, Z.; Hunt, M.O.; Ross, R.J.; Soltis, L.A. Screw withdrawal—A means to evaluate densities of in-situ wood members. In Proceedings of the 13th International Symposium on Nondestructive Testing of Wood, Berkeley, CA, USA, 19–21 August 2002; pp. 277–281. [Google Scholar]
- Ksit, B.; Szymczak-Graczyk, A.; Thomas, M.; Pilch, R. Implementation of the Results of Experimental Studies with the Use of the Sclerometric Method of Plane Elements in Wooden Buildings. Energies 2022, 15, 6660. [Google Scholar] [CrossRef]
- EN 17121; Conservation of Cultural Heritage—Historic Timber Structures—Guidelines for the on-Site Assessment of Load-Bearing Timber Structures. European Committee For Standardization: Bruxelles, Belgium, 2019.
- Cruz, H.; Yeomans, D.; Tsakanika, E.; Macchioni, N.; Jorissen, A.; Touza, M.; Mannucci, M.; Lourenço, P.B. Guidelines for on-site assessment of historic timber structures. Int. J. Arch. Herit. 2015, 9, 277–289. [Google Scholar] [CrossRef]
- Perria, E.; Sieder, M. Six-Steps Process of Structural Assessment of Heritage Timber Structures: Definition Based on the State of the Art. Buildings 2020, 10, 109. [Google Scholar] [CrossRef]
- Hirata, S.; Ohta, M.; Honma, Y. Hardness distribution on wood surface. J. Wood Sci. 2001, 47, 1–7. [Google Scholar] [CrossRef]
- Piazza, M.; Turrini, G. Recupero statico dei solai in legno-Esperienze e realizzazioni. Recuper. Progett. Cantieri Tecnol. Prodotti 1983, 7, 396–407. [Google Scholar]
- Piazza, M.; Riggio, M. Visual strength-grading and NDT of timber in traditional structures. J. Build. Apprais. 2008, 3, 267–296. [Google Scholar] [CrossRef]
- Mäkipää, R.; Linkosalo, T. A non-destructive field method for measuring wood density of decaying logs. Silva Fenn. 2011, 45, 91. [Google Scholar] [CrossRef]
- Giefing, D.F. Construction and Application of Pilodyn Device. Sylwan 1985, CXXIX, 63–68. (In Polish) [Google Scholar]
- Giuriani, E.; Gubana, A. A penetration test to evaluate wood decay and its application to the Loggia monument. Mater. Struct. 1993, 26, 8–14. [Google Scholar] [CrossRef]
- Kucharska, M.; Jaskowska-Lemańska, J. Active thermography in diagnostics of timber elements covered with polychrome. Materials 2021, 14, 1134. [Google Scholar] [CrossRef]
- Nowak, T.; Patalas, F.; Karolak, A. Estimating mechanical properties of wood in existing structures—selected aspects. Materials 2021, 14, 1941. [Google Scholar] [CrossRef]
- PN-D-94021; Structural Softwood Lumber Graded by Strength Methods. Polski Komitet Normalizacyjny: Warszawa, Poland, 2013. (In Polish)
- EN 14081-1; Timber Structures—Strength Graded Structural Timber with Rectangular Cross Section—Part 1: General Requirements. European Committee For Standardization: Bruxelles, Belgium, 2016.
- PN-EN 384; Wood Structures. Determination of Characteristic Values of Mechanical Properties and Density. Polski Komitet Normalizacyjny: Warszawa, Poland, 2004. (In Polish)
- PN-EN 408; Wood Structures. Structural Solid and Glued Laminated Timber. Determination of Some Physical and Mechanical Properties. Polski Komitet Normalizacyjny: Warszawa, Poland, 2004. (In Polish)
- PN-D-04103; Wood. Determination of Static Bending Strength. Polski Komitet Normalizacyjny: Warszawa, Poland, 1977. (In Polish)
- PN-D-04102; Wood. Determination of Compressive Strength Along Fibers. Polski Komitet Normalizacyjny: Warszawa, Poland, 1979. (In Polish)
- Krzysik, F. Wood Science; Państwowe Wydawnictwo Naukowe: Warszawa, Poland, 1974. (In Polish) [Google Scholar]
- Wagenführ, R. Holzatlas; Fachbuchverlag; Carl Hauser Verlag: Leipzig, Germany, 2007. [Google Scholar]
- Kloiber, M.; Tippner, J.; Hrivnák, J. Mechanical properties of wood examined by semi-destructive devices. Mater. Struct. 2014, 47, 199–212. [Google Scholar] [CrossRef]
- Faggiano, B.; Grippa, M.R.; Marzo, A.; Mazzolani, F.M. Combined non-destructive and destructive tests for the mechanical characterization of old structural timber elements. In Proceedings of the 3rd International Conference on Advances in Experimental Structural Engineering, San Francisco, CA, USA, 15–16 October 2009; pp. 657–666. [Google Scholar]
- Giefing, D.F.; Romanowska, K. Relationship between pilodin needle penetration susceptibility and density and some mechanical properties of spruce wood (Picea ex celsa L.). Rocz. AR Pozn. Leś. 1992, 241, 27–33. [Google Scholar]
- Lourenco, P.B.; Feio, A.O.; Machado, J.S. Chestnut wood in compression perpendicular to the grain: Non-destructive correlations for test results in new and old wood. Constr. Build. Mater. 2007, 21, 1617–1627. [Google Scholar] [CrossRef]
- Henriques, D.F.; Nunes, L.; Machado, J.S.; de Brito, J. Timber in buildings: Estimation of some properties using Pilodyn and Resistograph. In Proceedings of the International Conference on Durability of Building Materials and Components, Porto, Portugal, 12–15 April 2011; pp. 1–8. [Google Scholar]
- Kollmann, F.F.P.; Cote, W.A. Principles of Wood Science and Technology I—Solid Wood; Springer: Berlin/Heidelberg, Germany, 1968. [Google Scholar]
- Lis, A.; Lis, P. Characterization of wood strength as its basic mechanical property. Zesz. Nauk. Politech. Częstochowskiej Bud. 2013, 19, 78–86. (In Polish) [Google Scholar]
- Íñiguez-González, G.; Arriaga, F.; Esteban, M.; Llana, D.F. Reference conditions and modification factors for the standardiza-tion of nondestructive variables used in the evaluation of existing timber structures. Constr. Build. Mater. 2015, 101, 1166–1171. [Google Scholar] [CrossRef]
- Jaskowska-Lemańska, J.; Przesmycka, E. Semi-destructive and non-destructive tests of timber structure of various moisture contents. Materials 2021, 14, 96. [Google Scholar] [CrossRef]
- Llana, D.F.; Hermoso, E.; Bobadilla, I.; Íñiguez-González, G. Influence of moisture content on the results of penetration and withdrawal resistance measurements on softwoods. Holzforschung 2018, 72, 549–555. [Google Scholar] [CrossRef]
- Fauziyyah, S.; Karlinasari, L.; Nandika, D. Penetration depth evaluation approach for termite-infested Shorea spp. lumber. BioRes 2019, 14, 7080–7094. [Google Scholar] [CrossRef]
- Sharapov, E.; Brischke, C.; Militz, H. Effect of Grain Direction on Drilling Resistance Measurements in Wood. Int. J. Arch. Heritage 2020, 15, 250–258. [Google Scholar] [CrossRef]


| Pine | Spruce | Fir | |
|---|---|---|---|
| Sample size {pcs.} | 45 | 60 | 45 |
| Sample density {kg/m3} min/mean/max standard deviation | 348.5/485.8/655.2 74.2 | 328.2/416.9/480.5 36.6 | 332.4/452.9/682.1 86.1 |
| Moisture content {%} min/mean/max standard deviation | 10.2/11.1/12.3 0.72 | 11.3/11.7/12.2 0.20 | 10.0/10.6/11.2 0.35 |
| Bending strength fm{MPa} min/mean/max standard deviation | 28.5/63.4/148.2 27.1 | 22.0/39.5/57.3 8.5 | 19.2/45.4/78.6 13.1 |
| Modulus of elasticity {GPa} min/mean/max standard deviation | 7.3/11.6/20.2 3.8 | 6.6/9.9/14.2 1.7 | 4.5/9.2/13.0 1.9 |
| Compressive strength fc,0 {MPa} min/mean/max standard deviation | 22.1/42.9/66.8 12.2 | 26.3/37.6/51.3 6.7 | 26.1/40.2/55.4 6.2 |
| Pine | Spruce | Fir | |||||
|---|---|---|---|---|---|---|---|
| PD1 | PD2 | PD1 | PD2 | PD1 | PD2 | ||
| {mm} | {mm} | {mm} | {mm} | {mm} | {mm} | ||
| KW | ρ {kg/m3} | −0.84 | −0.81 | −0.62 | −0.72 | −0.81 | 0.79 |
| fm {MPa} | −0.68 | −0.66 | −0.10 1 | −0.15 1 | −0.44 | −0.51 | |
| E {GPa} | −0.49 | −0.62 | −0.46 | −0.43 1 | −0.48 | −0.59 | |
| KS | ρ {kg/m3} | −0.97 | −0.96 | −0.66 | −0.64 | −0.86 | 0.84 |
| fm {MPa} | −0.71 | −0.71 | −0.39 | −0.45 | −0.86 | 0.74 | |
| E {GPa} | −0.76 | −0.74 | −0.45 | −0.41 | −0.81 | 0.57 | |
| KG | ρ {kg/m3} | −0.43 1 | −0.57 | −0.62 | −0.63 | −0.60 | −0.54 1 |
| fm {MPa} | −0.39 1 | −0.46 1 | −0.23 1 | −0.26 1 | −0.37 1 | −0.31 1 | |
| E {GPa} | −0.25 1 | −0.32 1 | −0.49 | −0.52 | −0.47 1 | −0.52 1 | |
| Pine r | Spruce r | Fir r | Species Collectively R2 | |||||||
|---|---|---|---|---|---|---|---|---|---|---|
| PD1 | PD2 | PD1 | PD2 | PD1 | PD2 | PD1 | PD2 | |||
| Density | ρ | {kg/m3} | −0.81 | −0.82 | −0.62 | −0.66 | −0.74 | −0.75 | 0.61 | 0.61 |
| Bending strength | fm | {MPa} | −0.65 | −0.65 | −0.25 | −0.25 | −056 | −0.56 | 0.35 | 0.38 |
| Bending strength 1 | fm’ | {MPa} | −0.70 | −0.69 | −0.50 | −0.51 | −0.72 | −0.75 | 0.41 | 0.43 |
| Compressive strength | fc,0 | {MPa} | −0.63 | −0.63 | −0.36 | −0.40 | −0.51 | −0.55 | 0.30 | 0.33 |
| Modulus of elasticity | E | {GPa} | −0.58 | −0.57 | −0.48 | −0.43 | −0.46 | −0.52 | 0.21 | 0.24 |
Disclaimer/Publisher’s Note: The statements, opinions and data contained in all publications are solely those of the individual author(s) and contributor(s) and not of MDPI and/or the editor(s). MDPI and/or the editor(s) disclaim responsibility for any injury to people or property resulting from any ideas, methods, instructions or products referred to in the content. |
© 2023 by the authors. Licensee MDPI, Basel, Switzerland. This article is an open access article distributed under the terms and conditions of the Creative Commons Attribution (CC BY) license (https://creativecommons.org/licenses/by/4.0/).
Share and Cite
Jaskowska-Lemańska, J.; Wałach, D. Assessment of the Technical Condition of Timber Structural Elements Using Sclerometric Tests. Materials 2023, 16, 6152. https://doi.org/10.3390/ma16186152
Jaskowska-Lemańska J, Wałach D. Assessment of the Technical Condition of Timber Structural Elements Using Sclerometric Tests. Materials. 2023; 16(18):6152. https://doi.org/10.3390/ma16186152
Chicago/Turabian StyleJaskowska-Lemańska, Justyna, and Daniel Wałach. 2023. "Assessment of the Technical Condition of Timber Structural Elements Using Sclerometric Tests" Materials 16, no. 18: 6152. https://doi.org/10.3390/ma16186152
APA StyleJaskowska-Lemańska, J., & Wałach, D. (2023). Assessment of the Technical Condition of Timber Structural Elements Using Sclerometric Tests. Materials, 16(18), 6152. https://doi.org/10.3390/ma16186152