
Bending Behavior of Hybrid Timber–Steel Beams

 , , ,
, , ,
Abstract
1. Introduction
1.1. Motivation and Scope of Paper
1.2. State of the Art of Hybrid Timber Construction
2. Materials and Methods
2.1. Materials
2.1.1. Timber, Wood Products and Steel
2.1.2. Adhesives
2.2. Methods
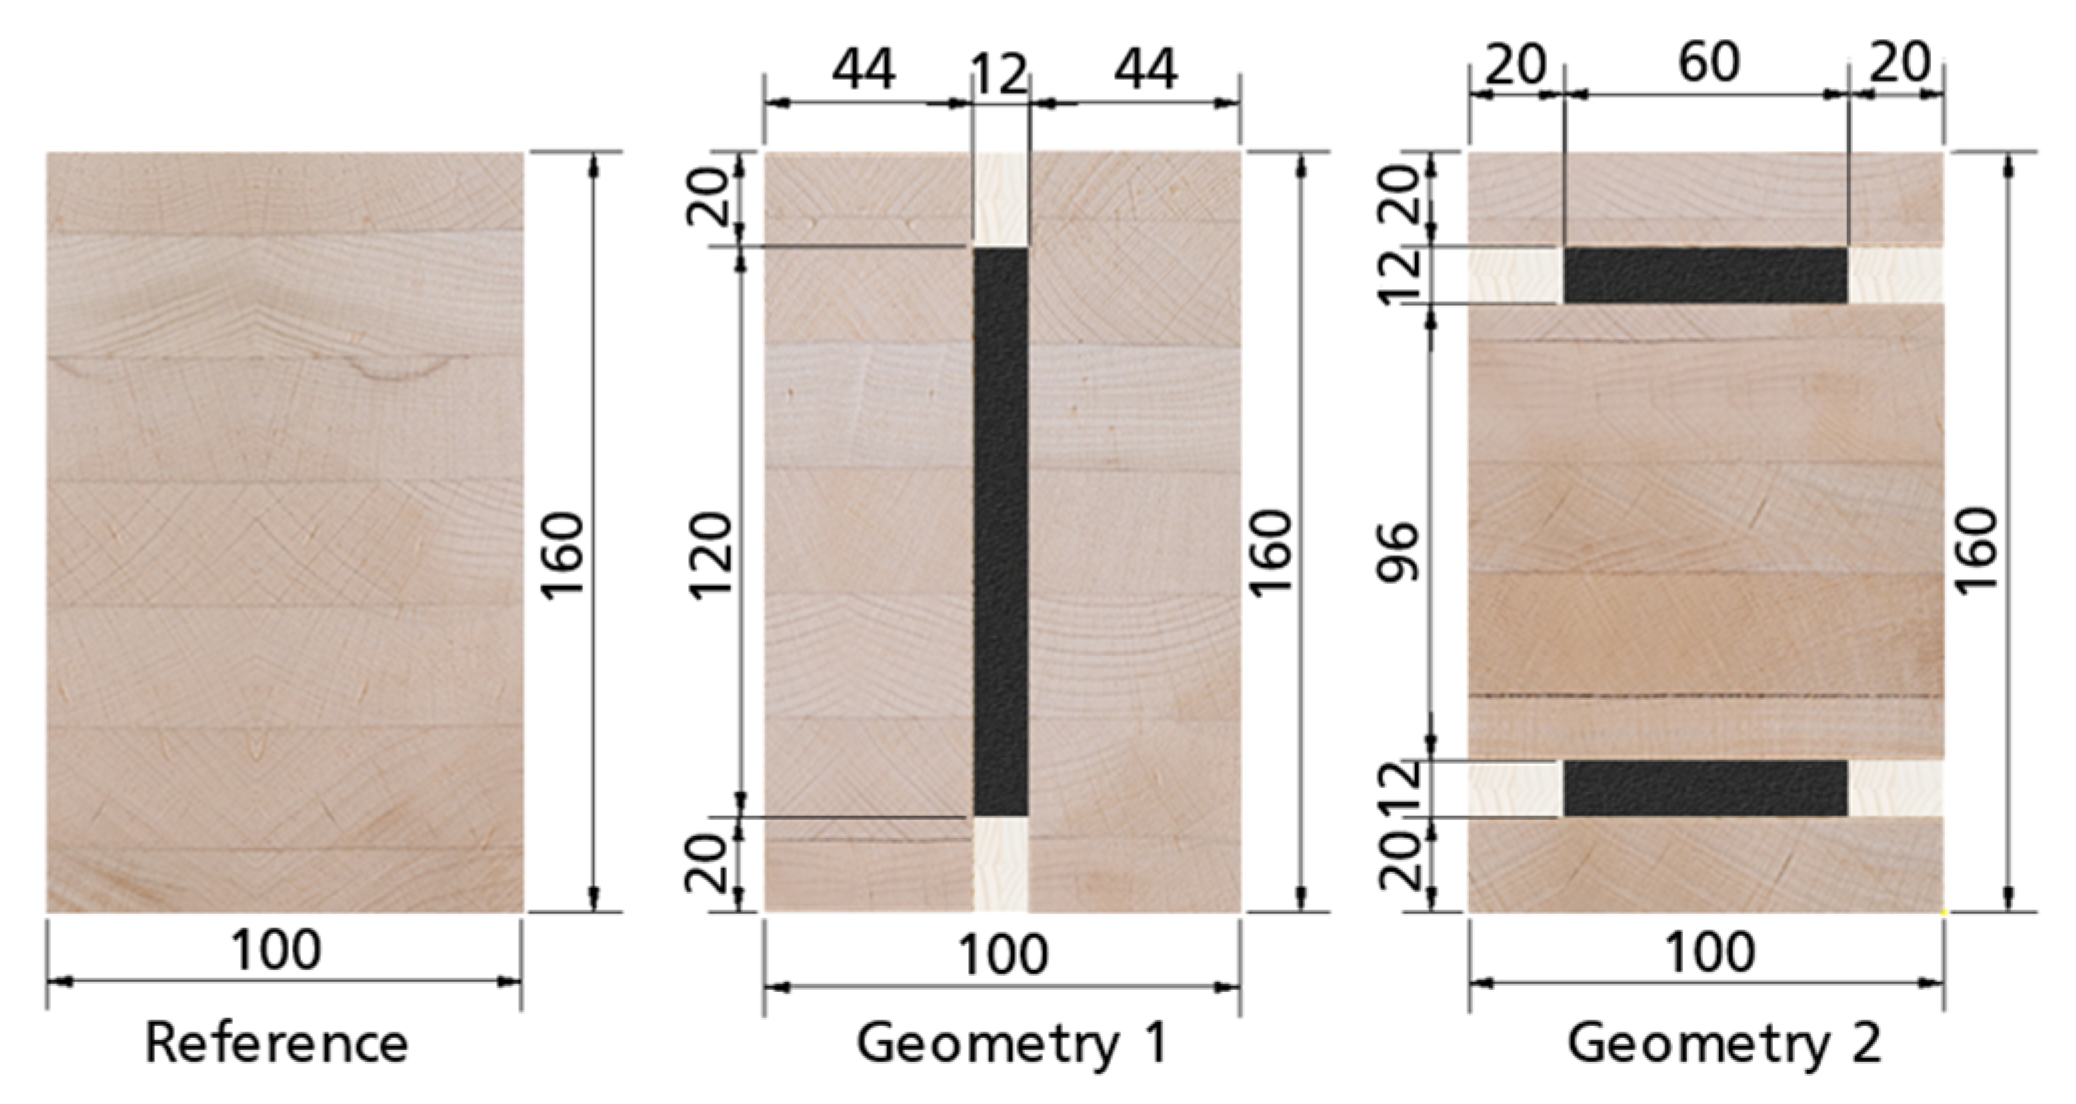
2.2.1. Specimen Geometry and Test Program
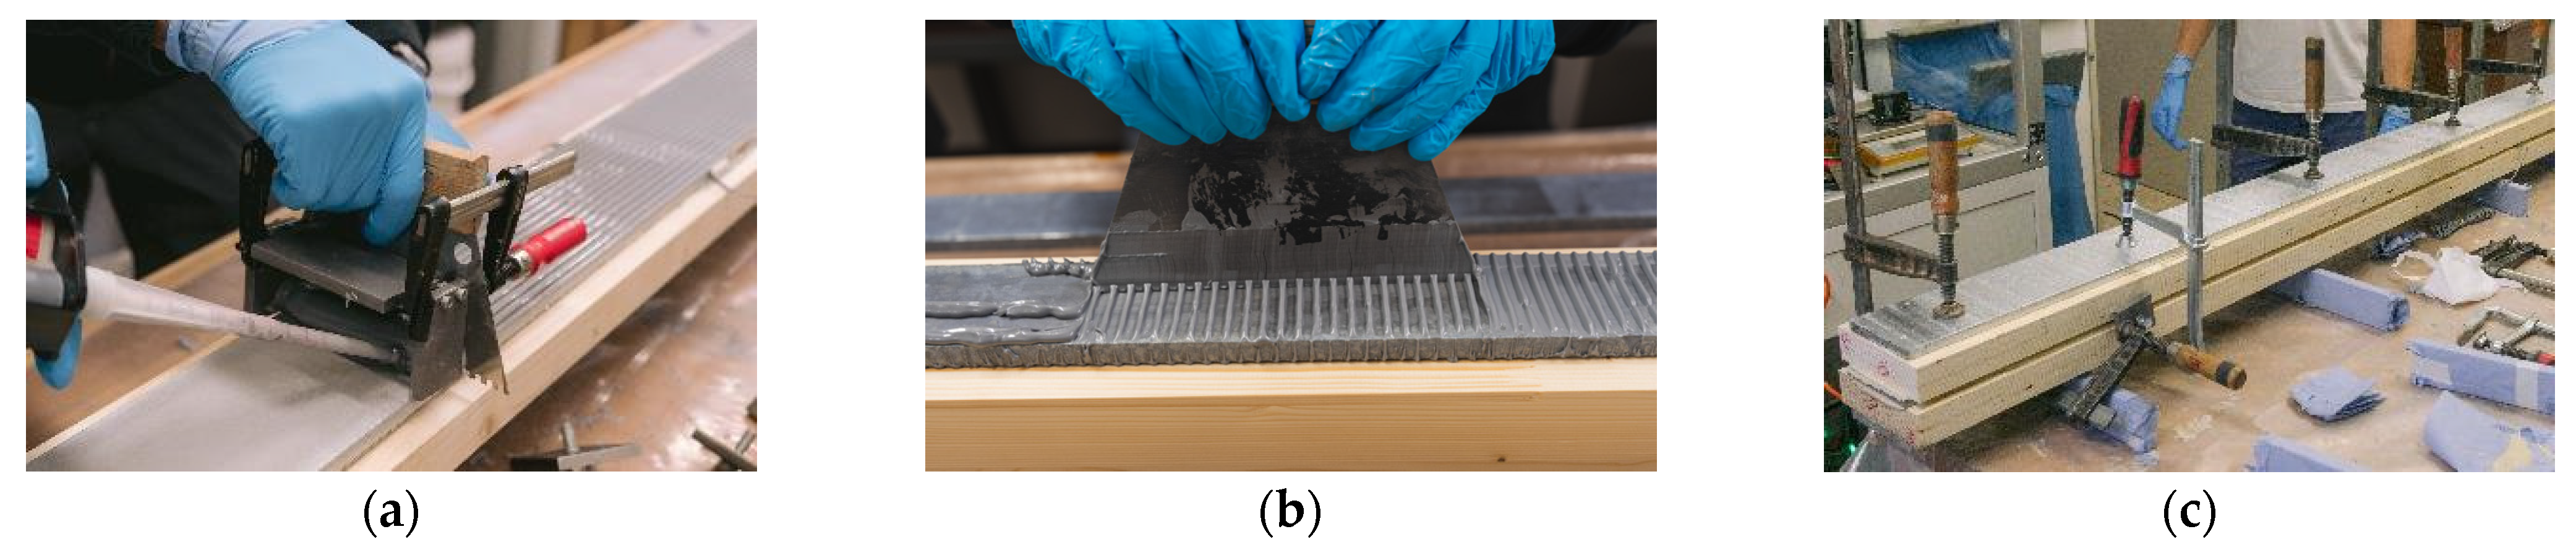
2.2.2. Manufacturing of the Specimens
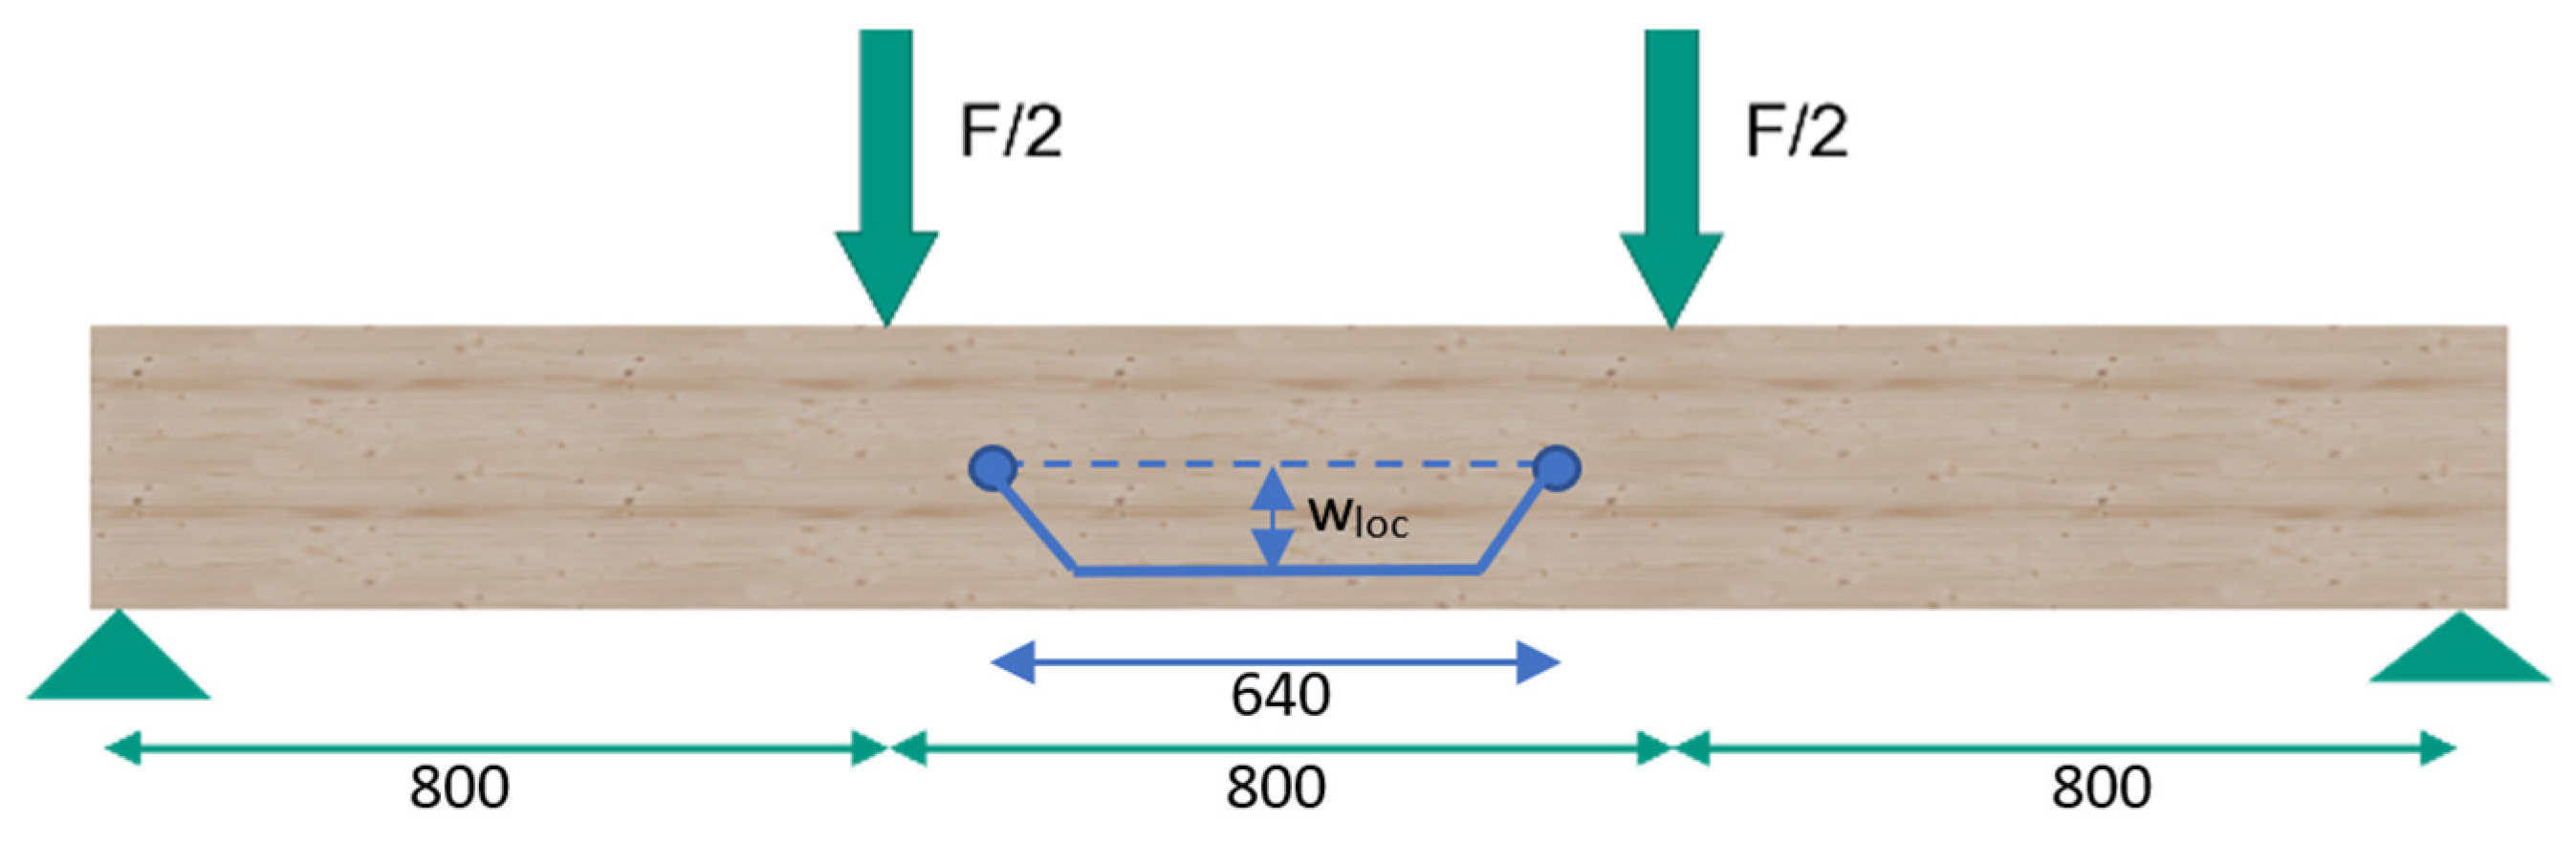
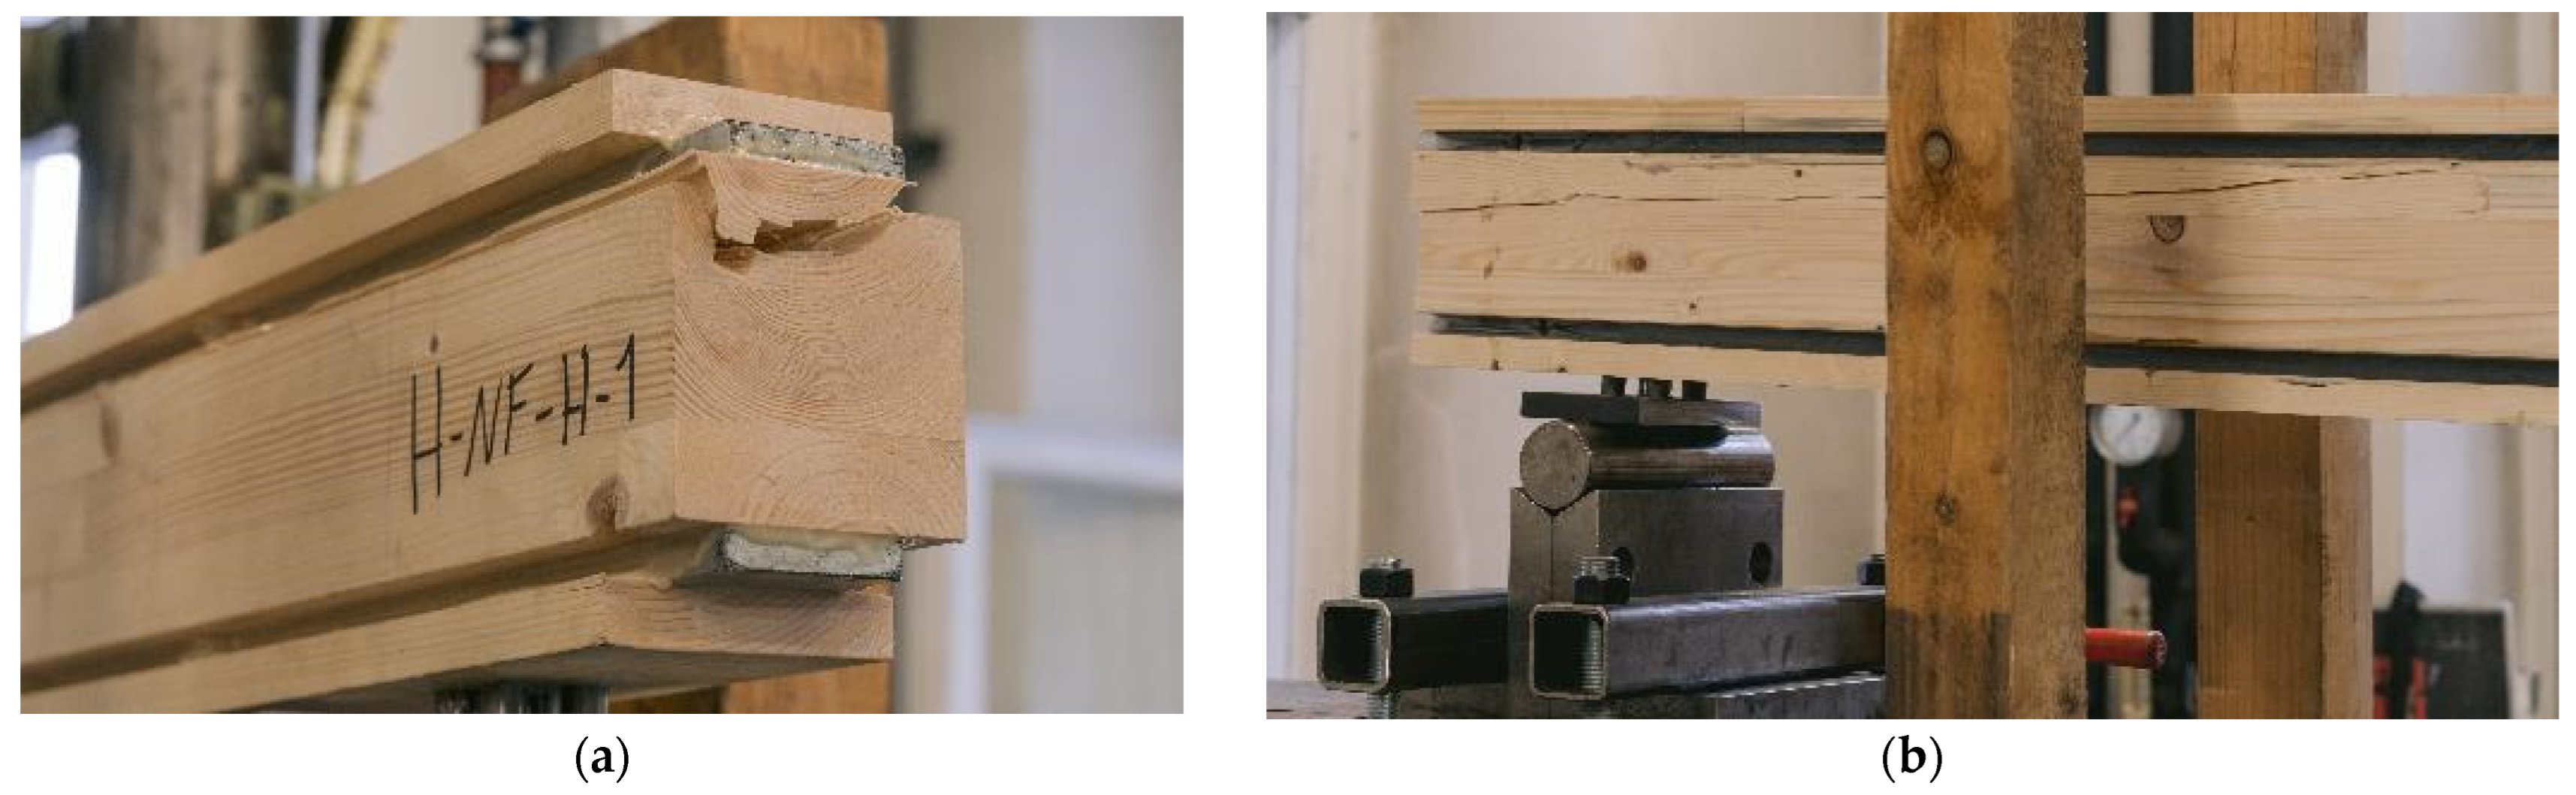
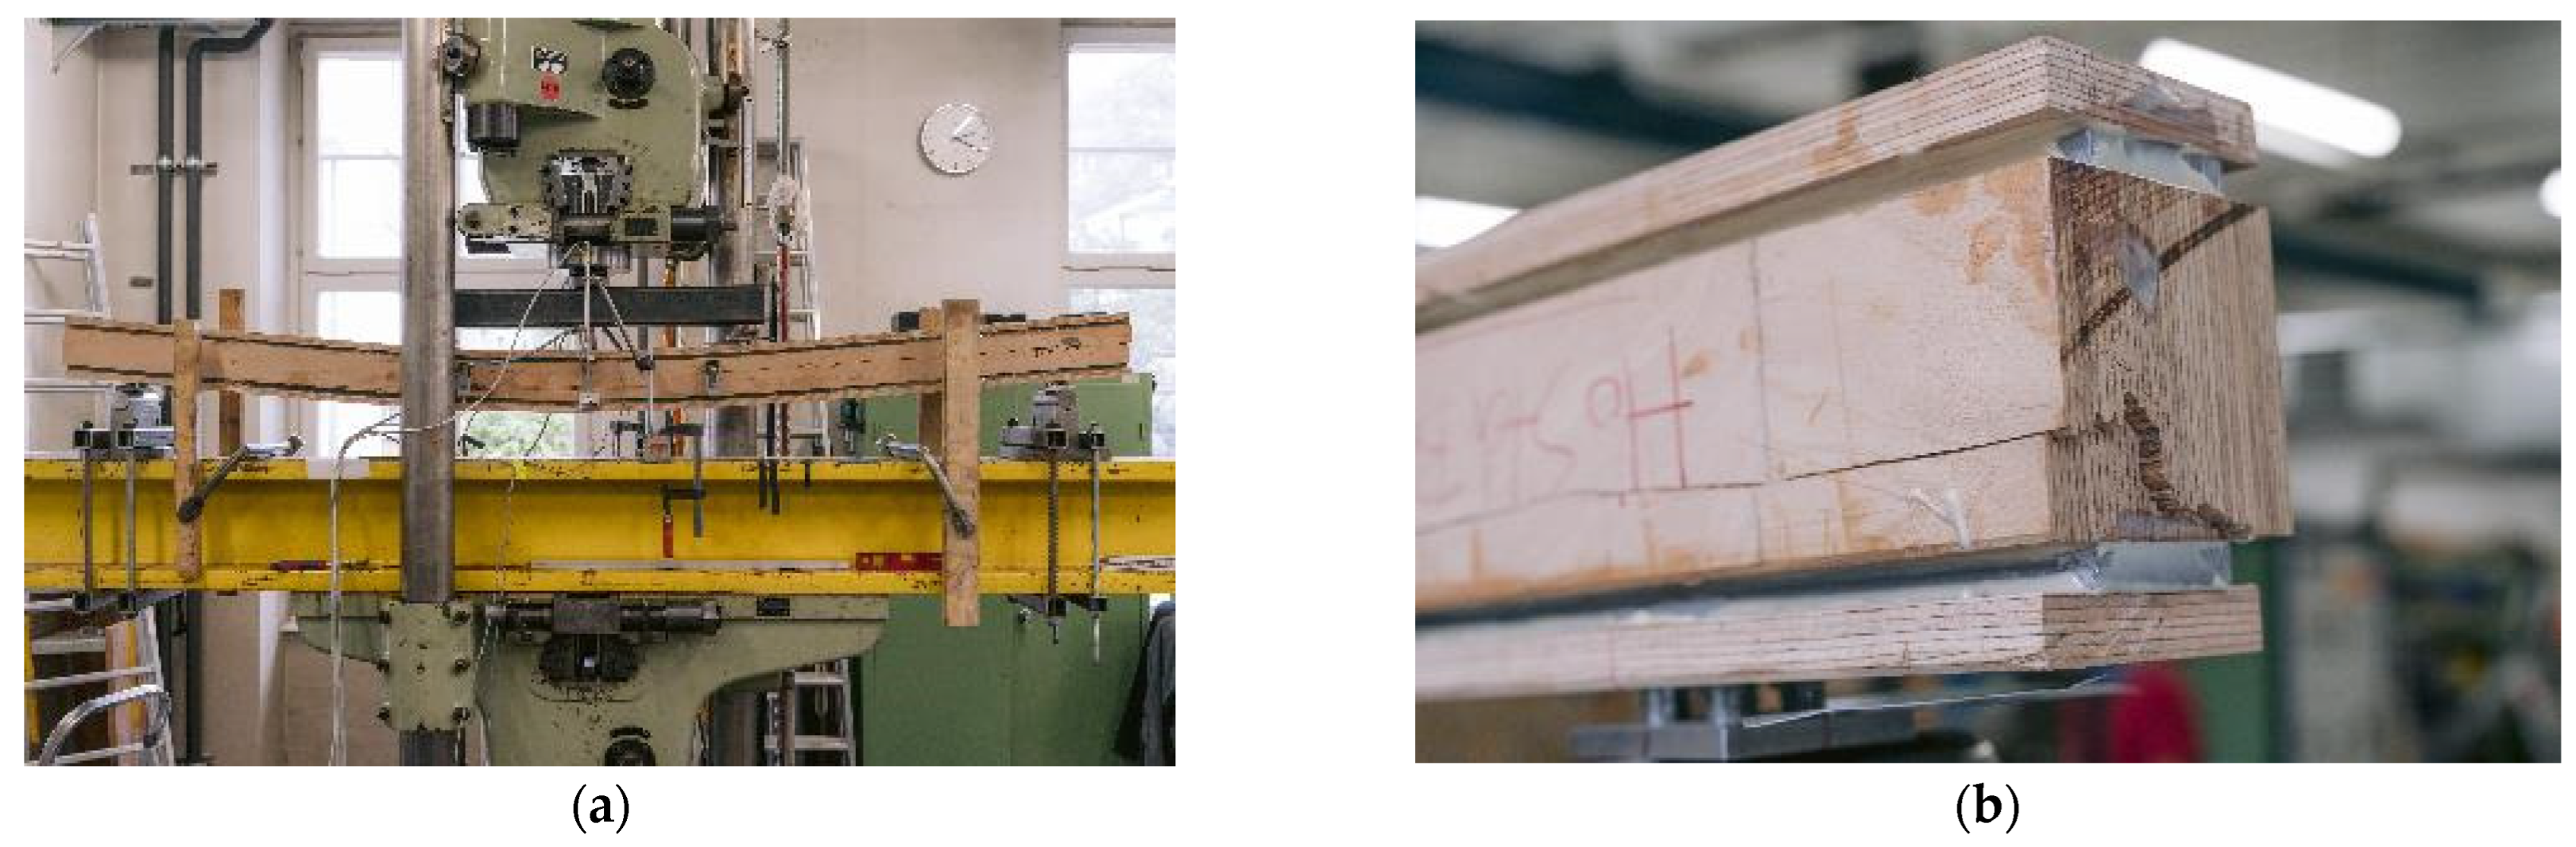
2.2.3. Experimental Testing
2.2.4. Analytical Calculations

| Material | Fexp,T,m,y [kN] | Fexp,S,y [kN] | Fexp,T,v [kN] | |
|---|---|---|---|---|
| Geometry 1 (vertical steel plate) | GL24h + S355 | 68.7 * | 52.4 | 278.9 |
| LVL48p + S420 | 95.0 * | 66.1 | 316.1 | |
| Geometry 2 (horizontal steel plates) | GL24h + S355 | 116.8 | 89.3 | 71.0 * |
| LVL80p + S420 | 199.0 | 120.5 * | 133.0 |
3. Results
3.1. Reference Specimens
3.2. Geometry 1 (Vertical Steel Sheet)
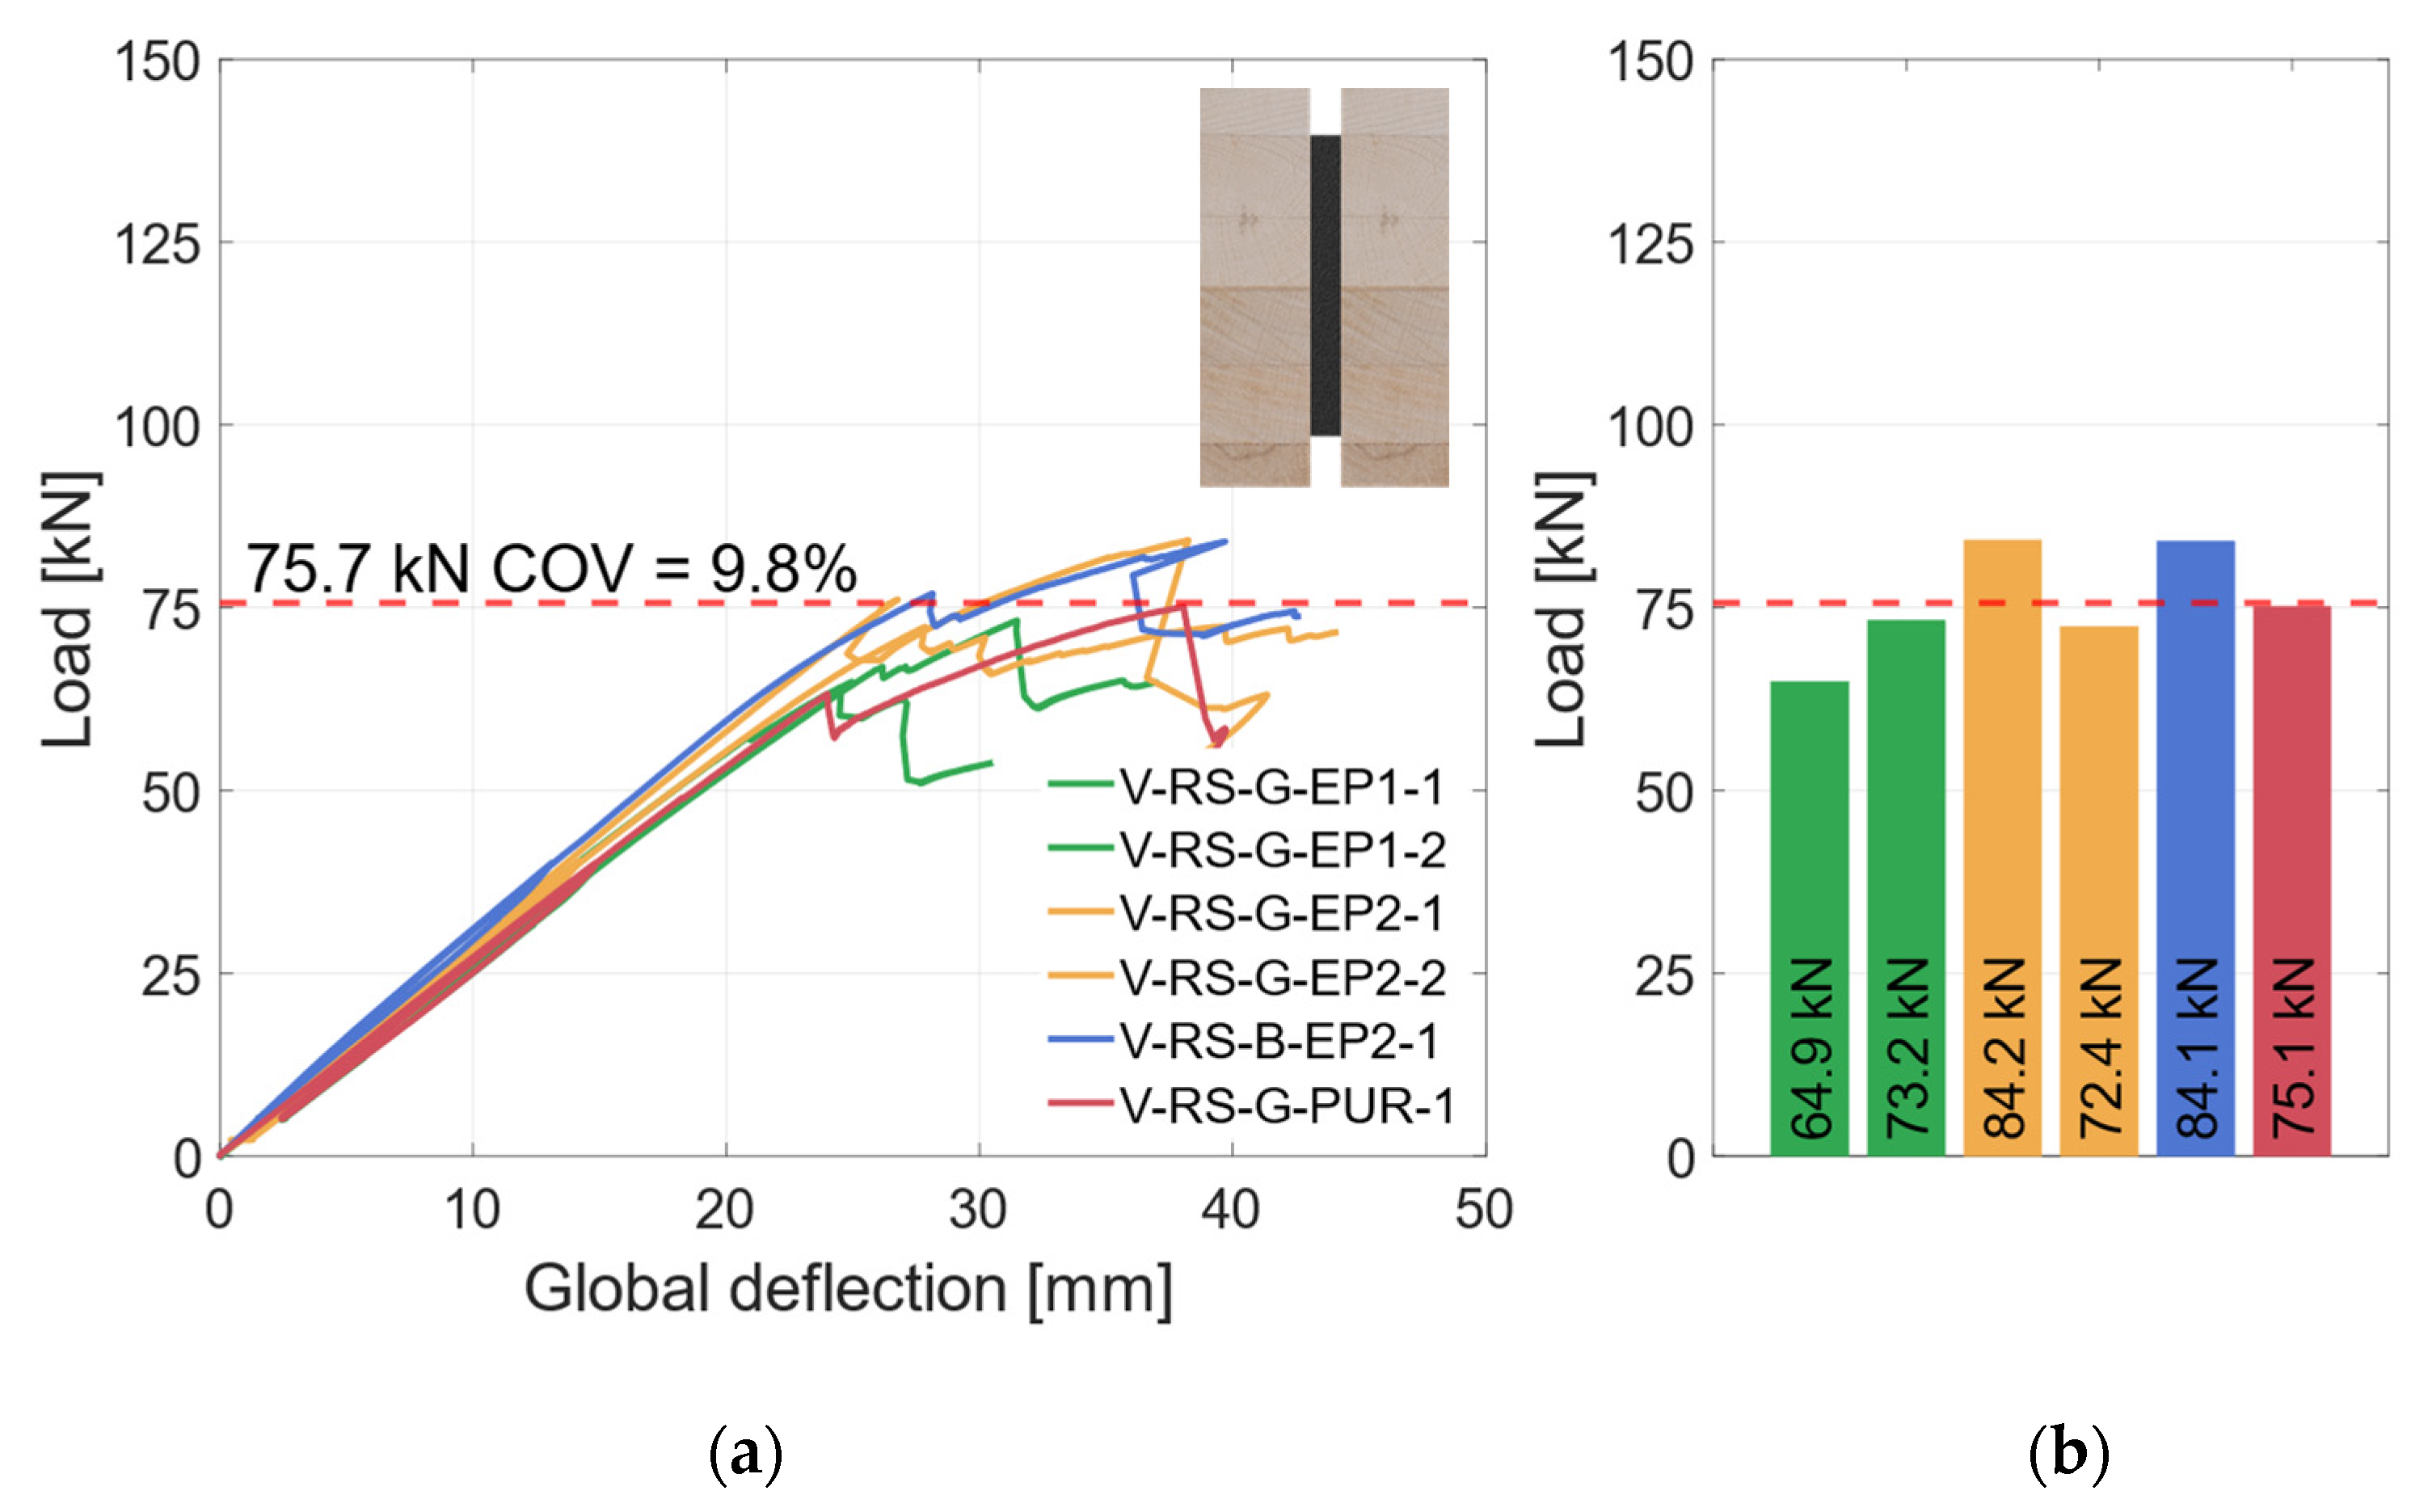
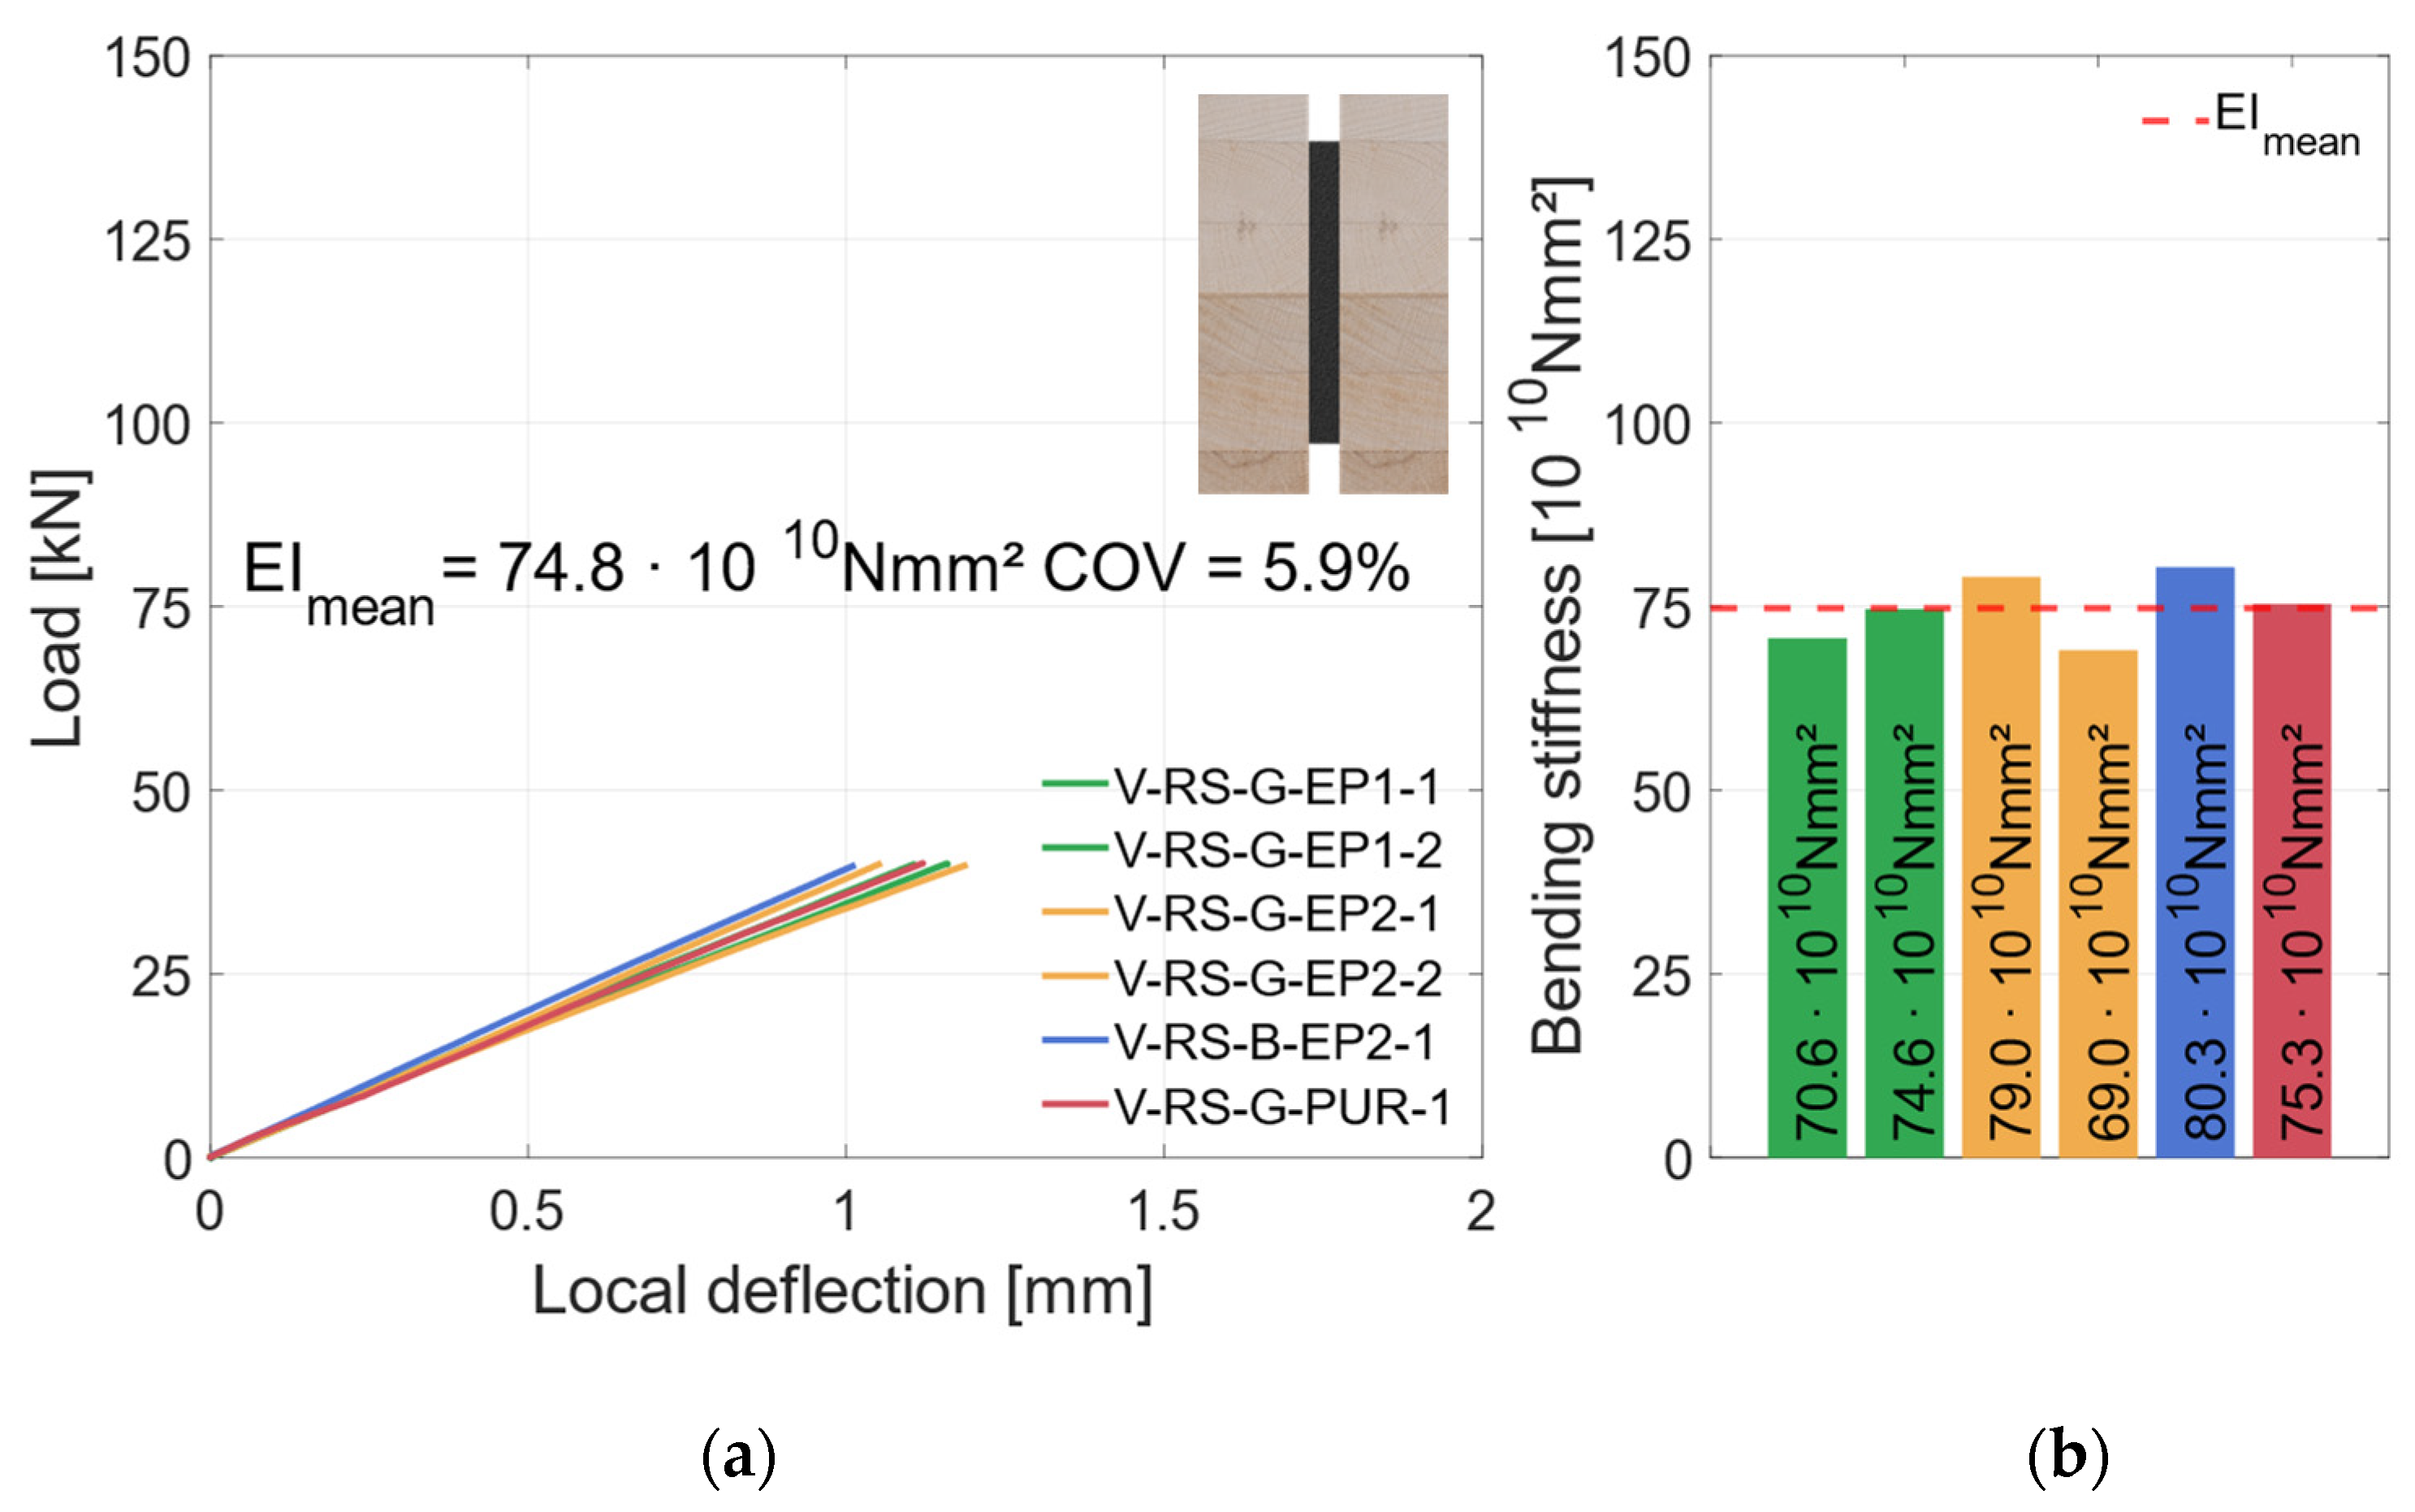
3.2.1. Material Combination: Regular Strength (RS)
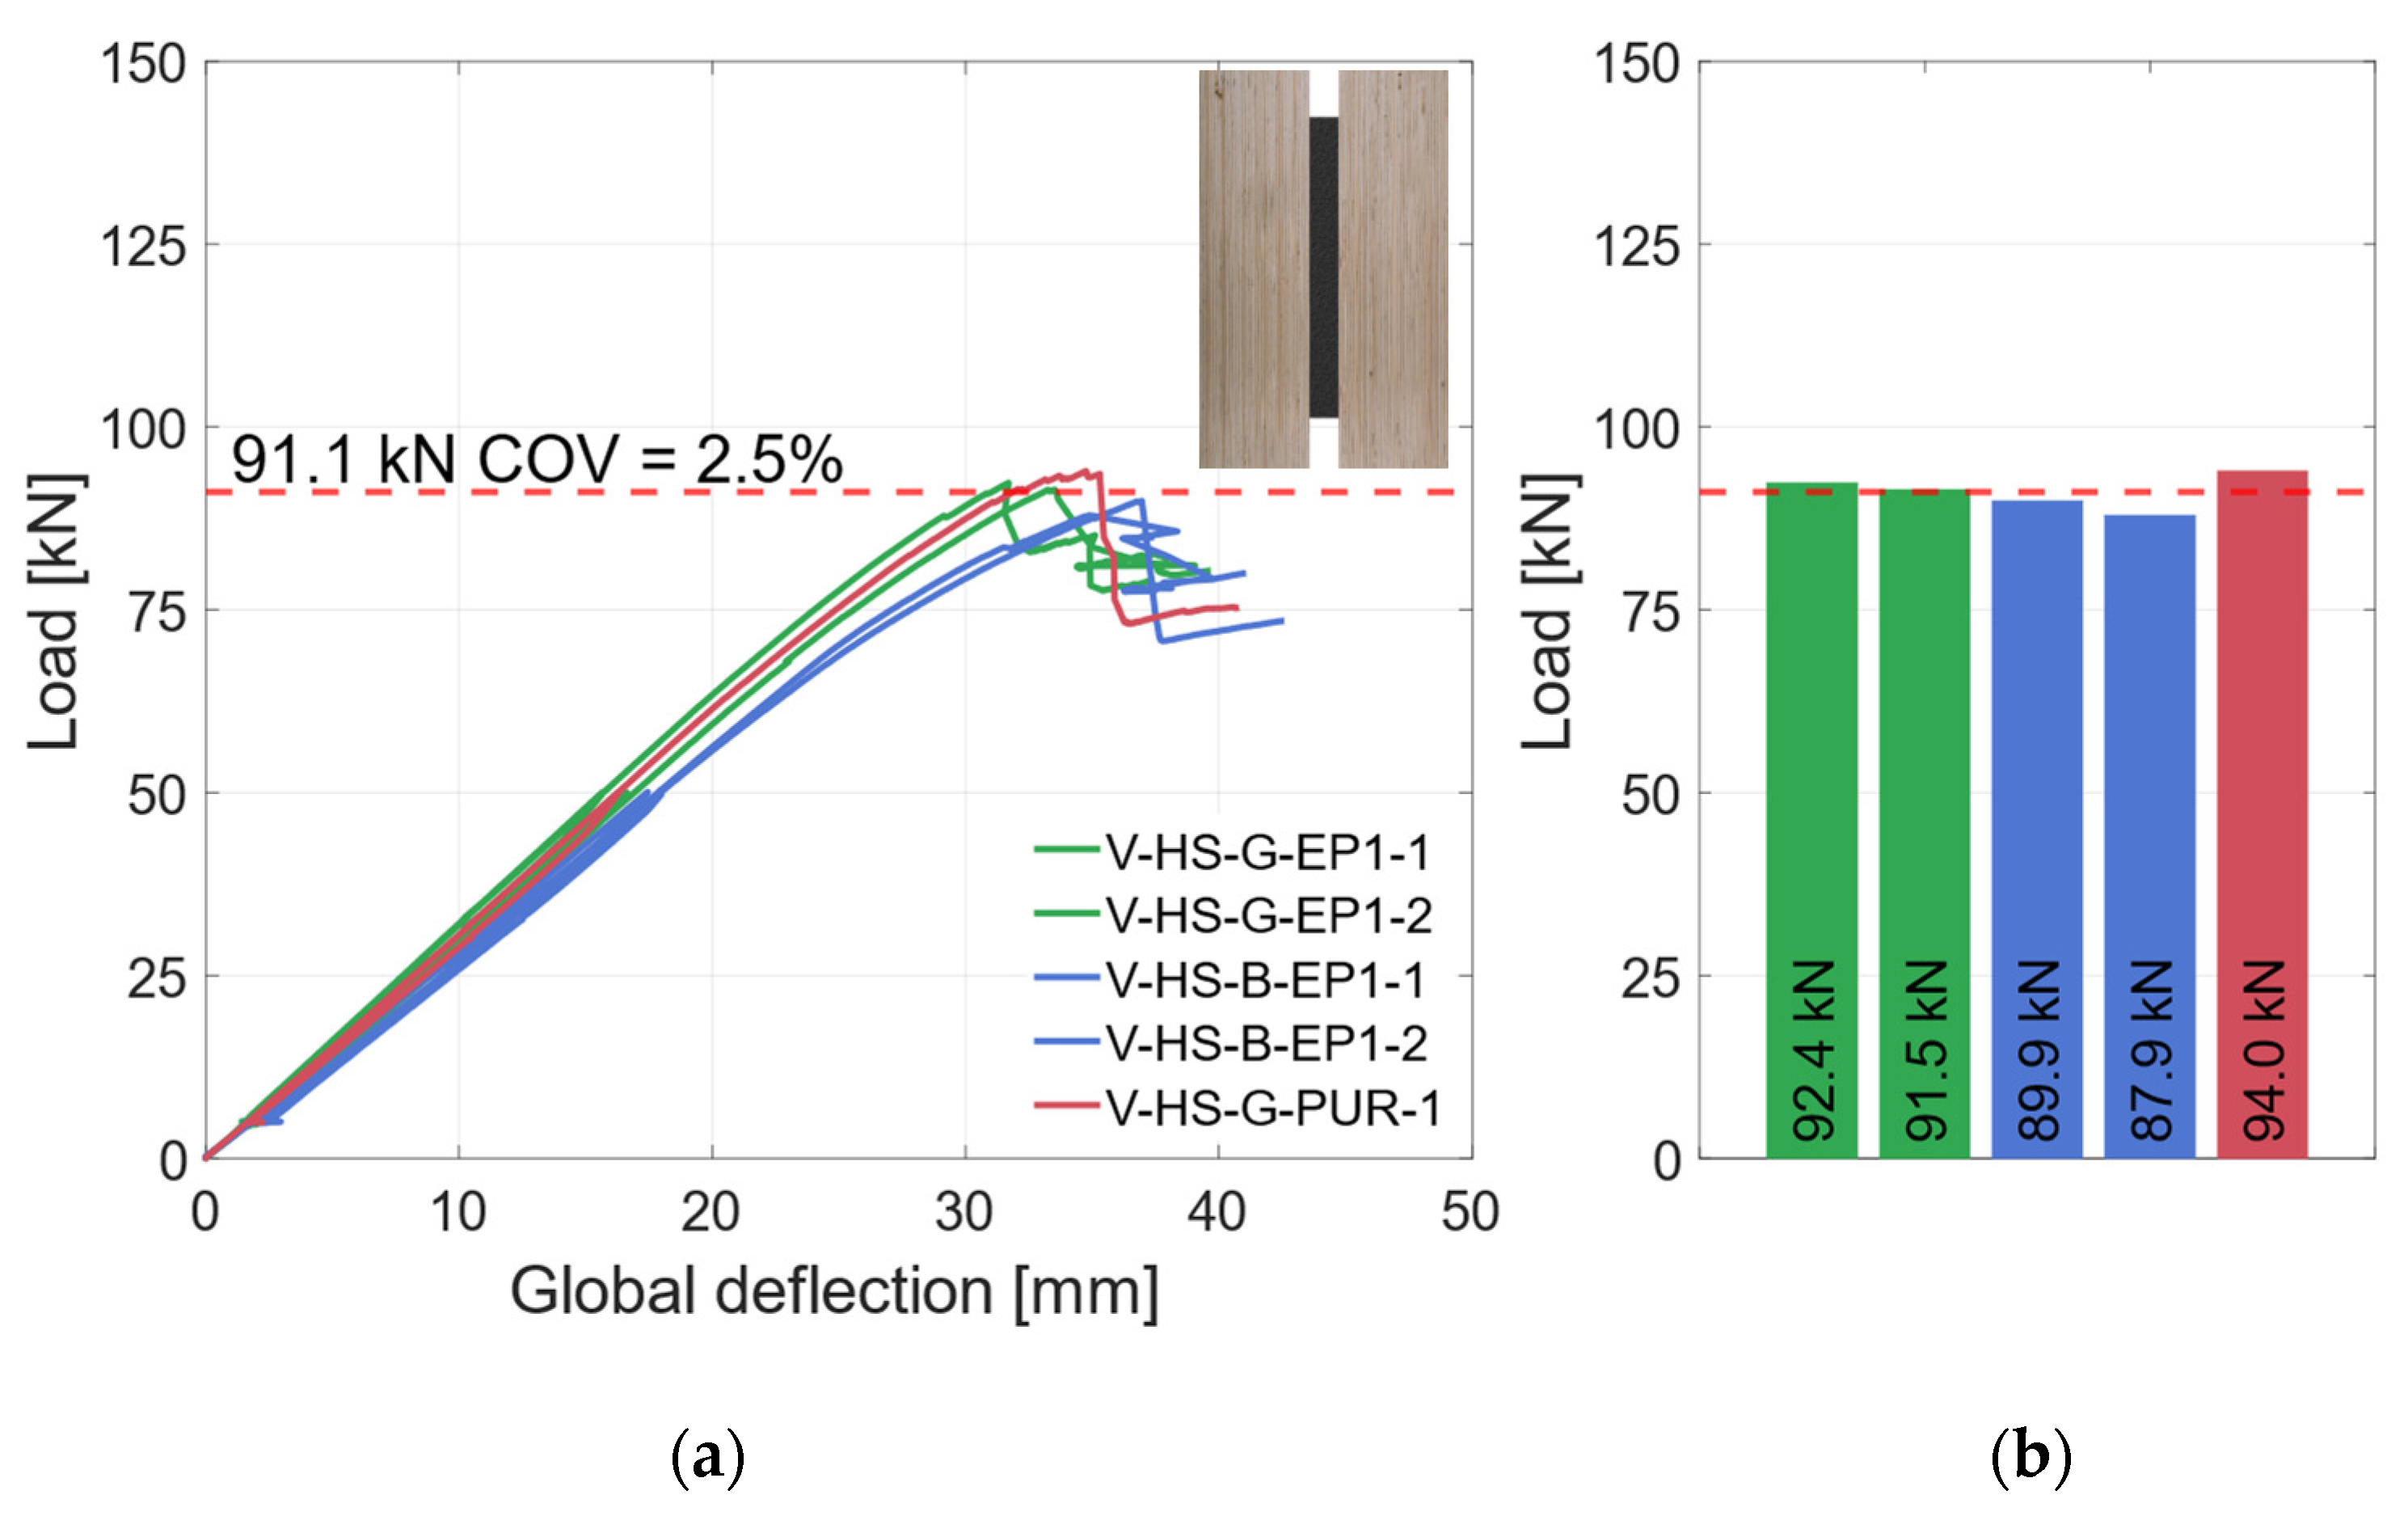
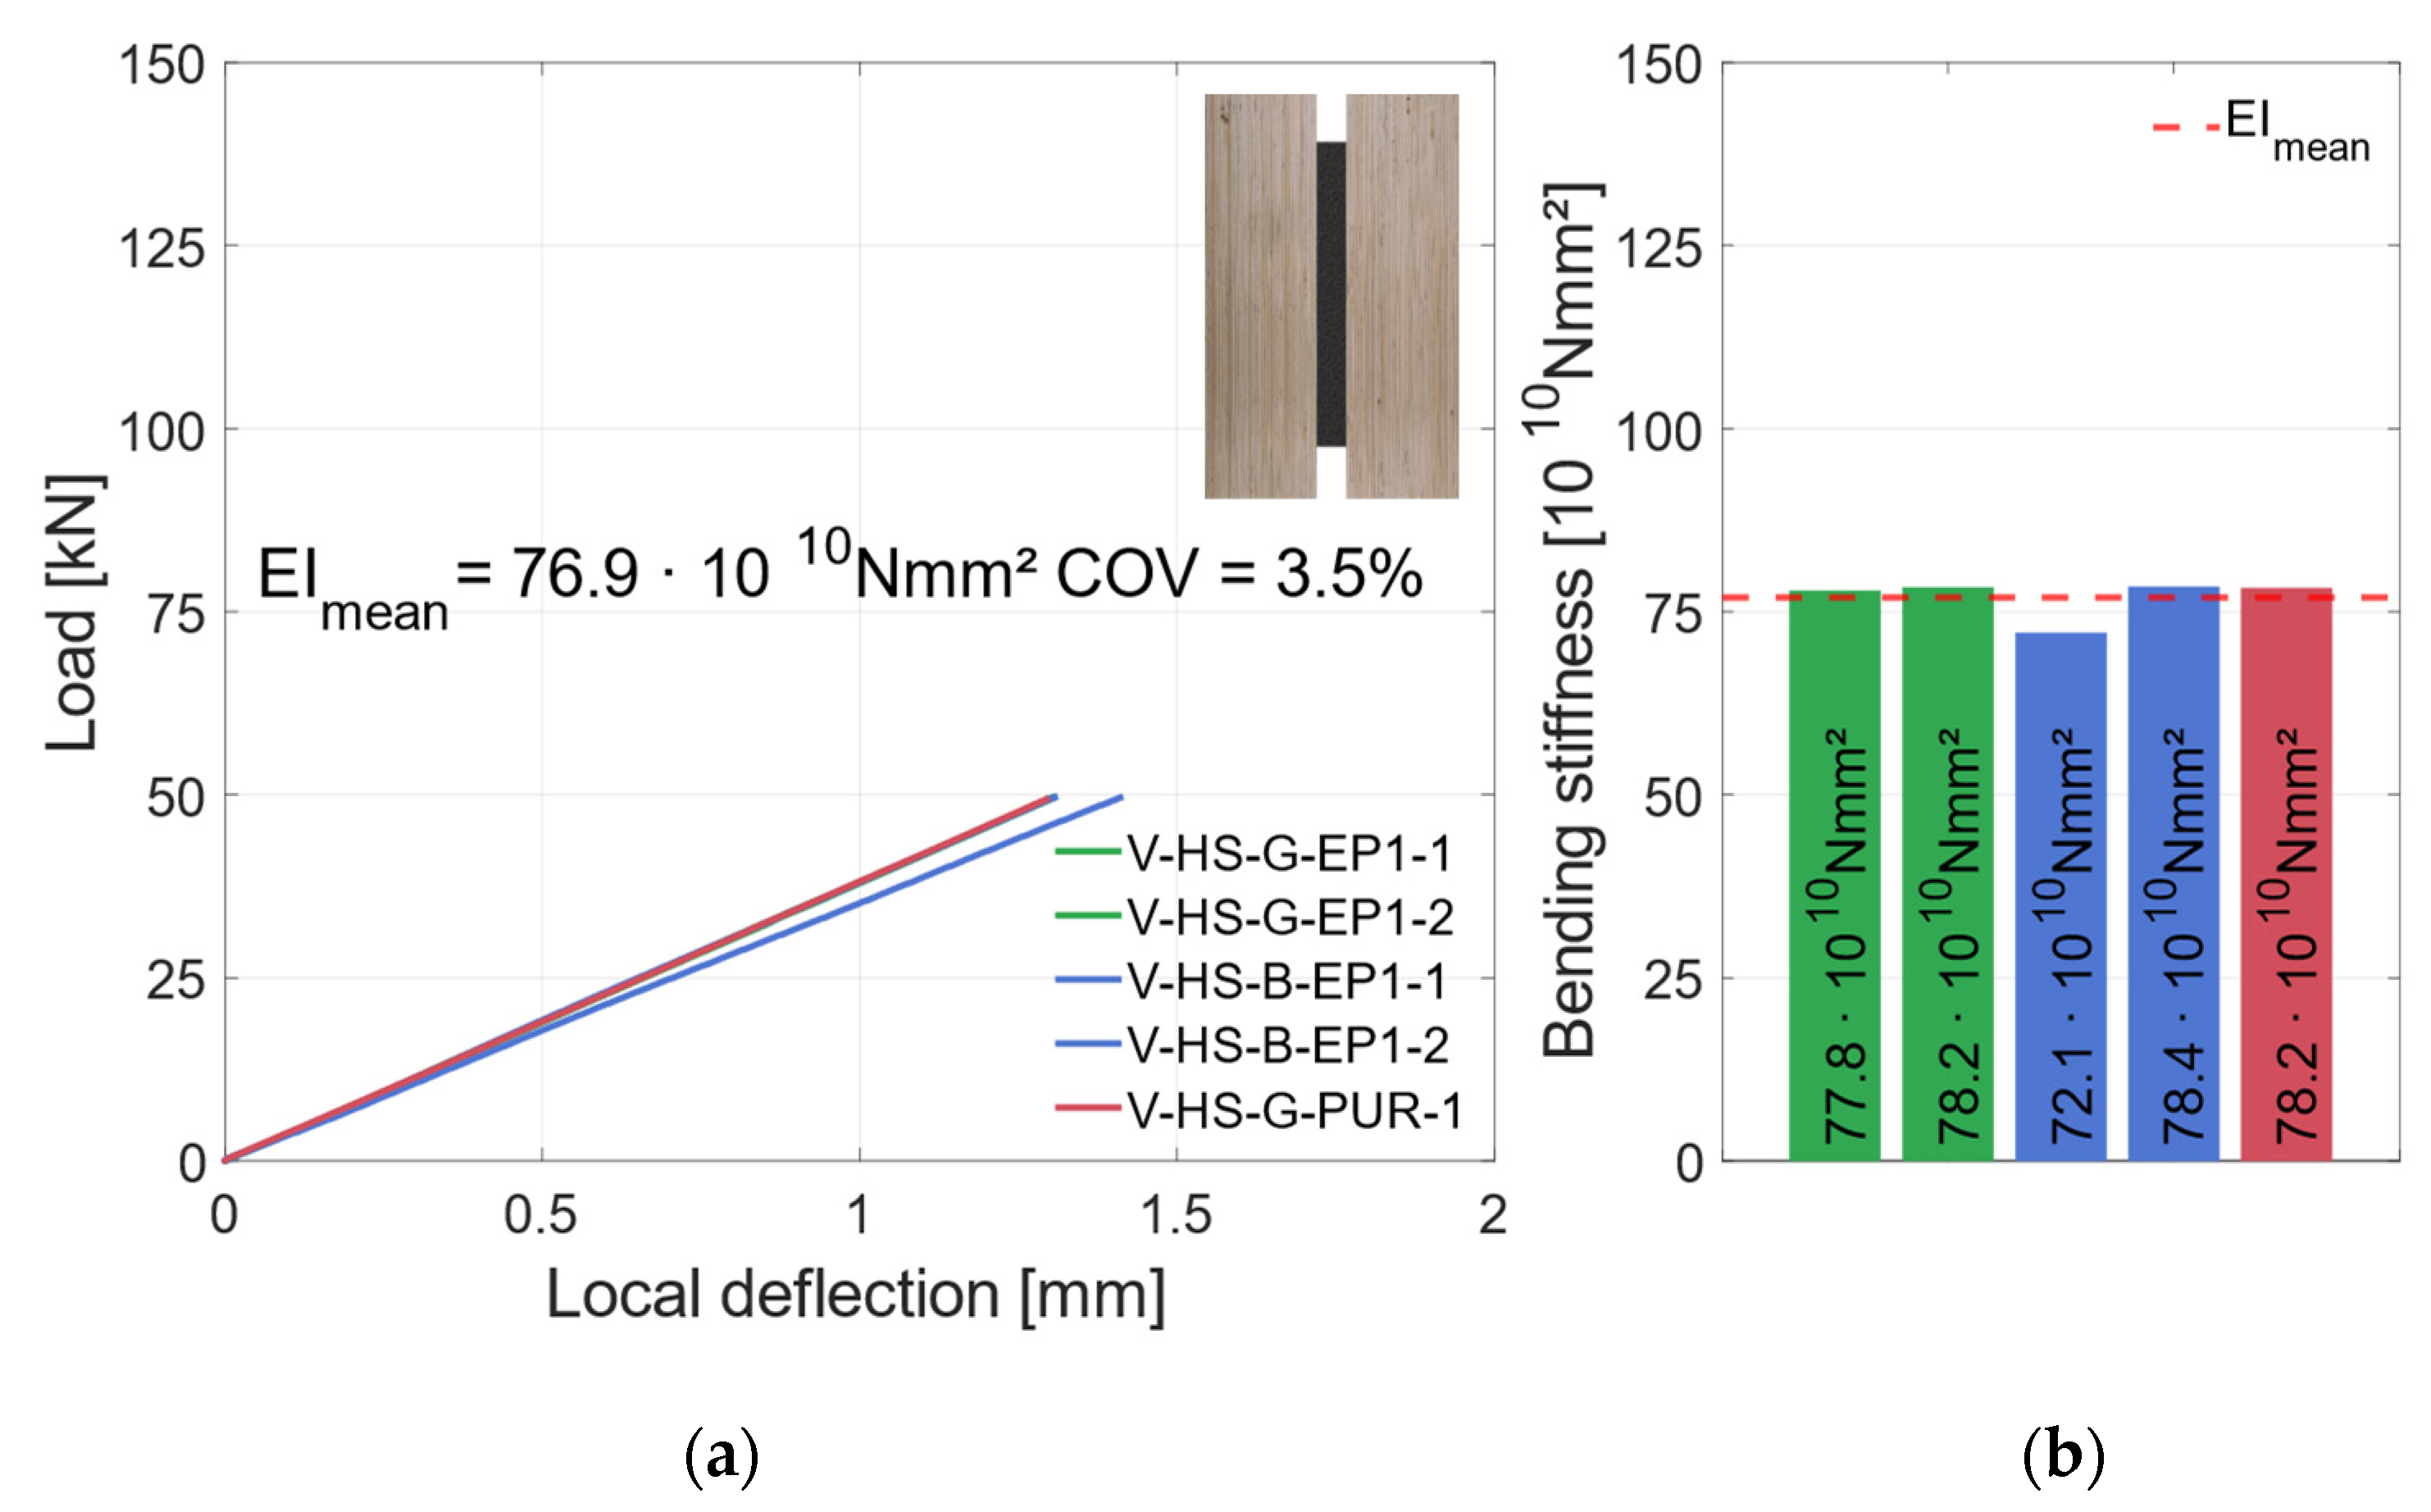
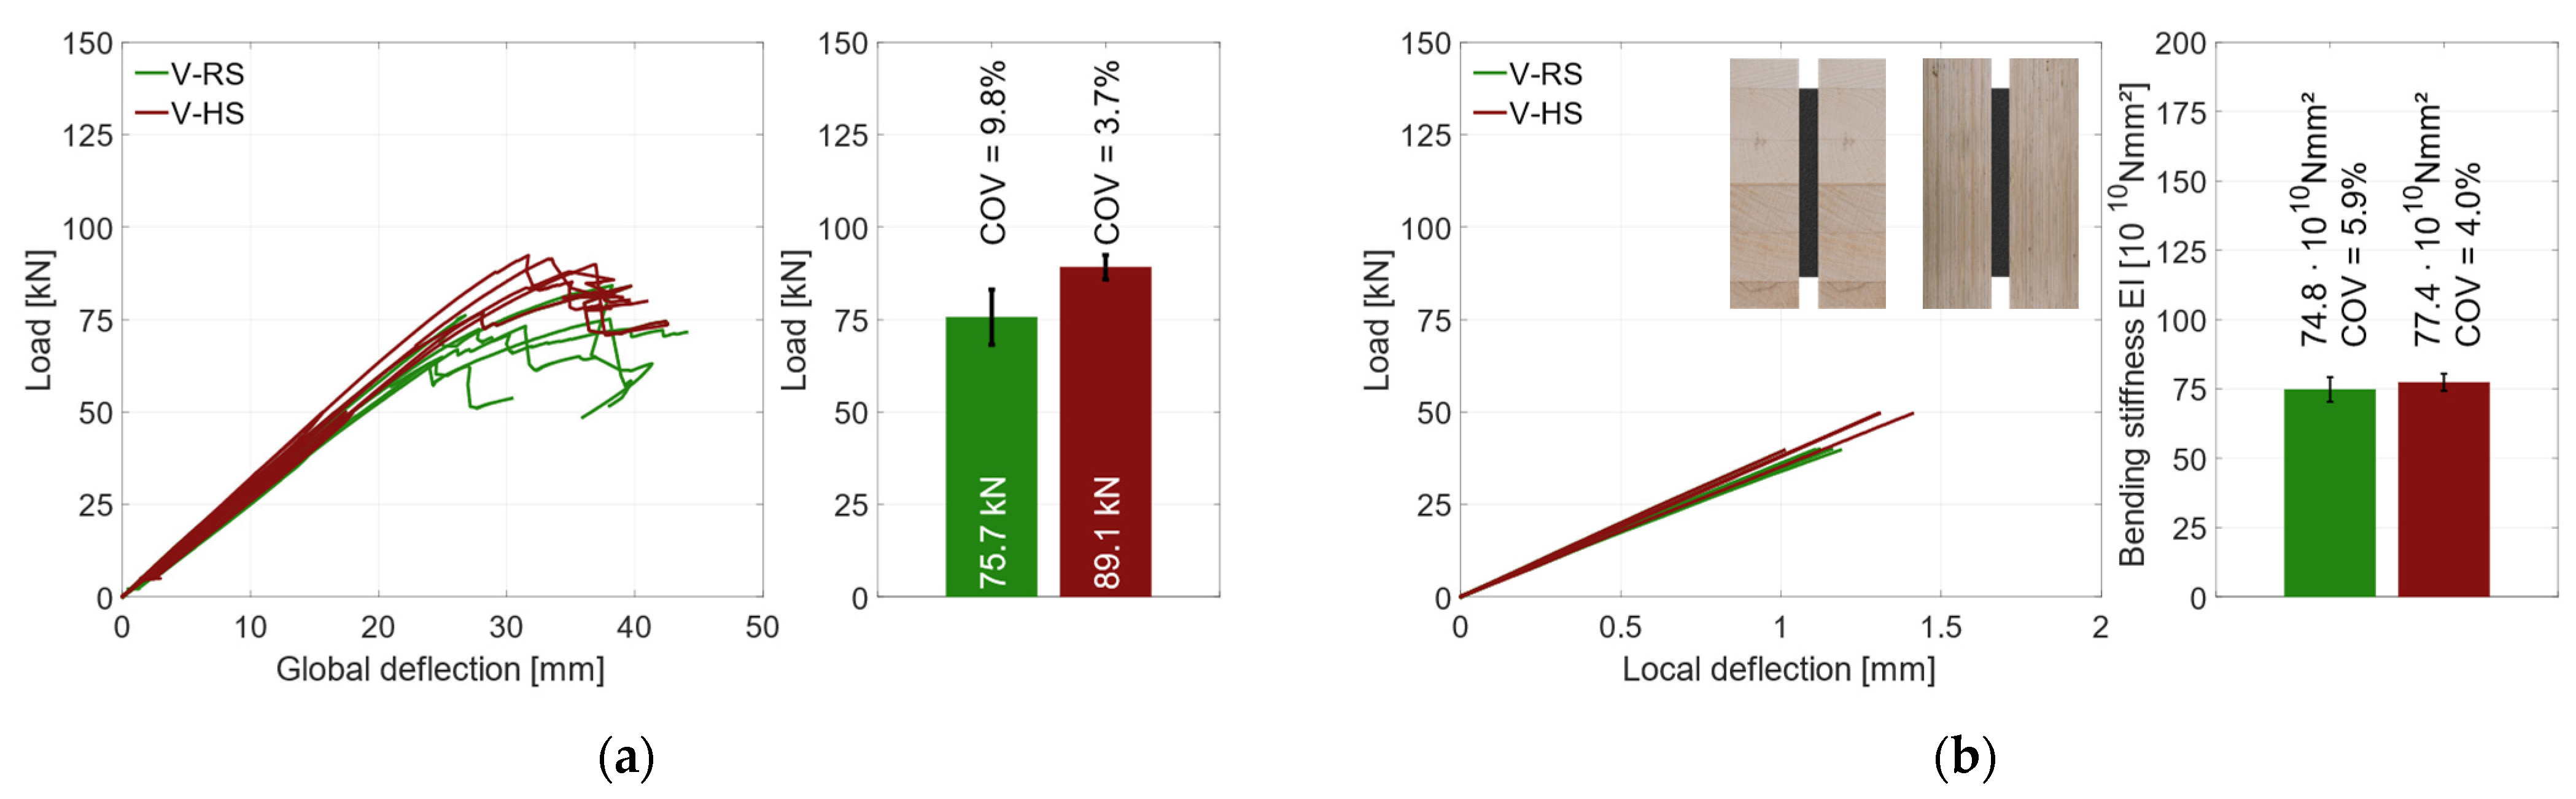
3.2.2. Material Combination: Higher Strength (HS)
3.3. Geometry 2 (Horizontal)
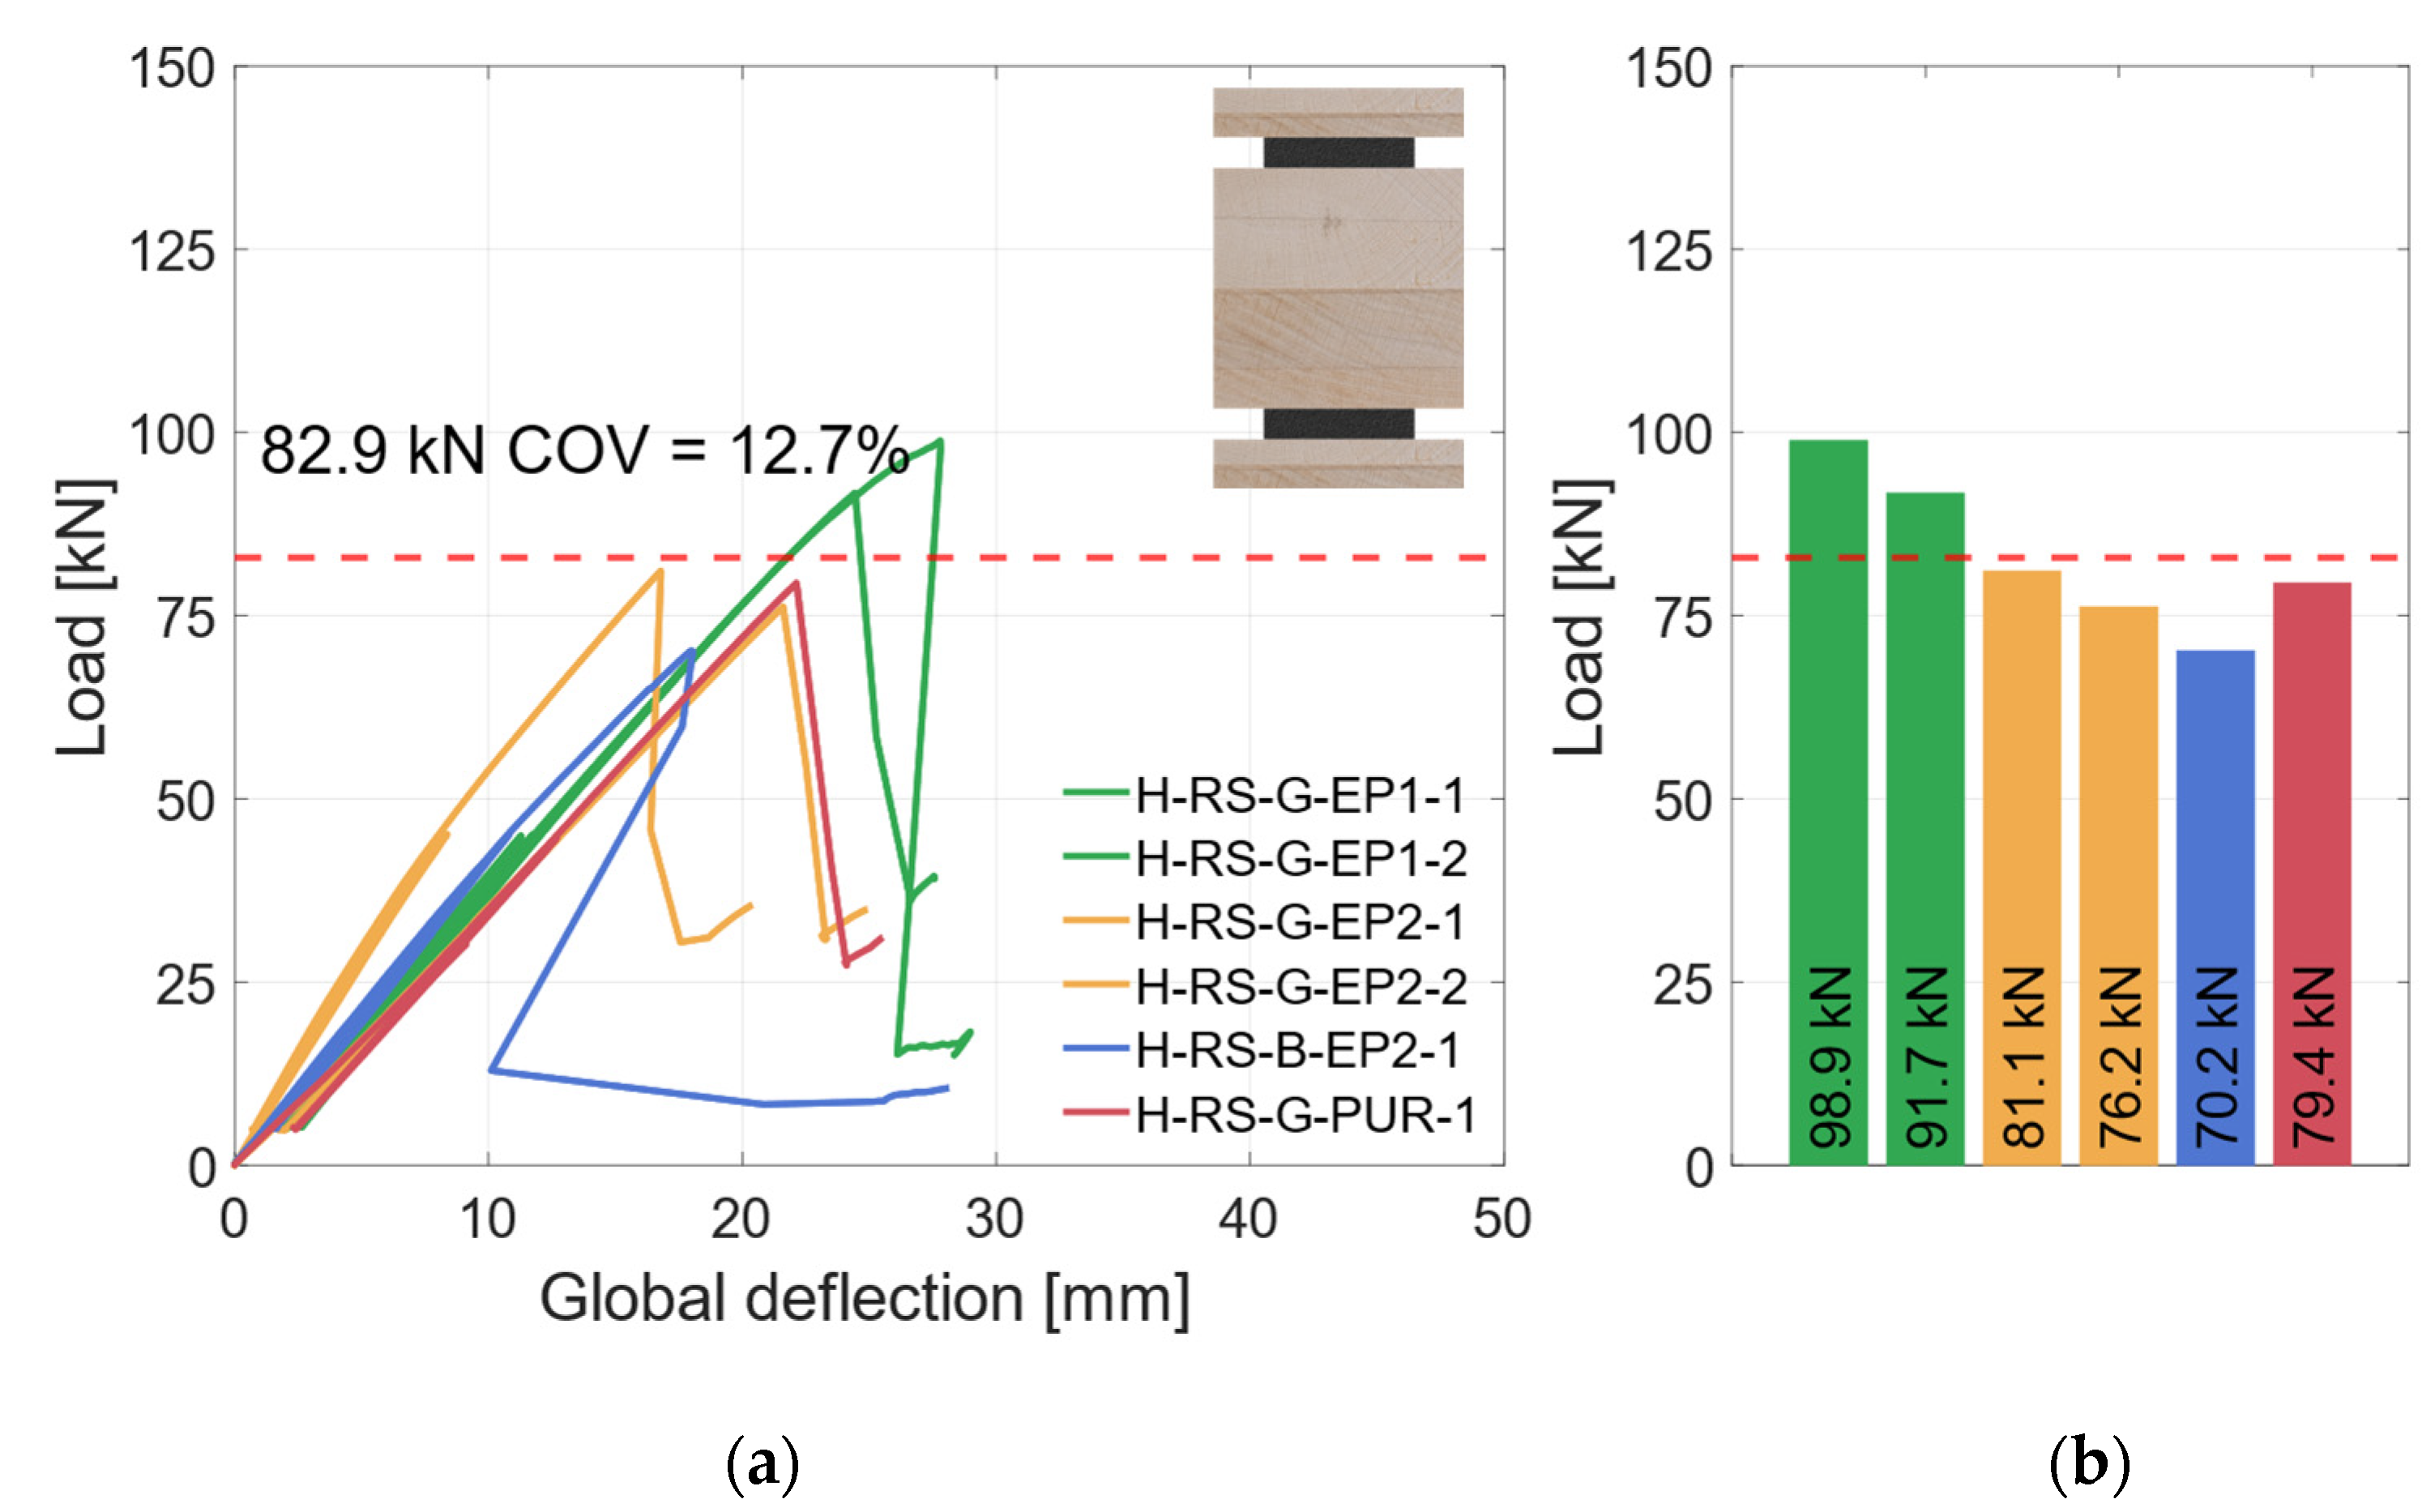
3.3.1. Material Combination: Regular Strength (RS)
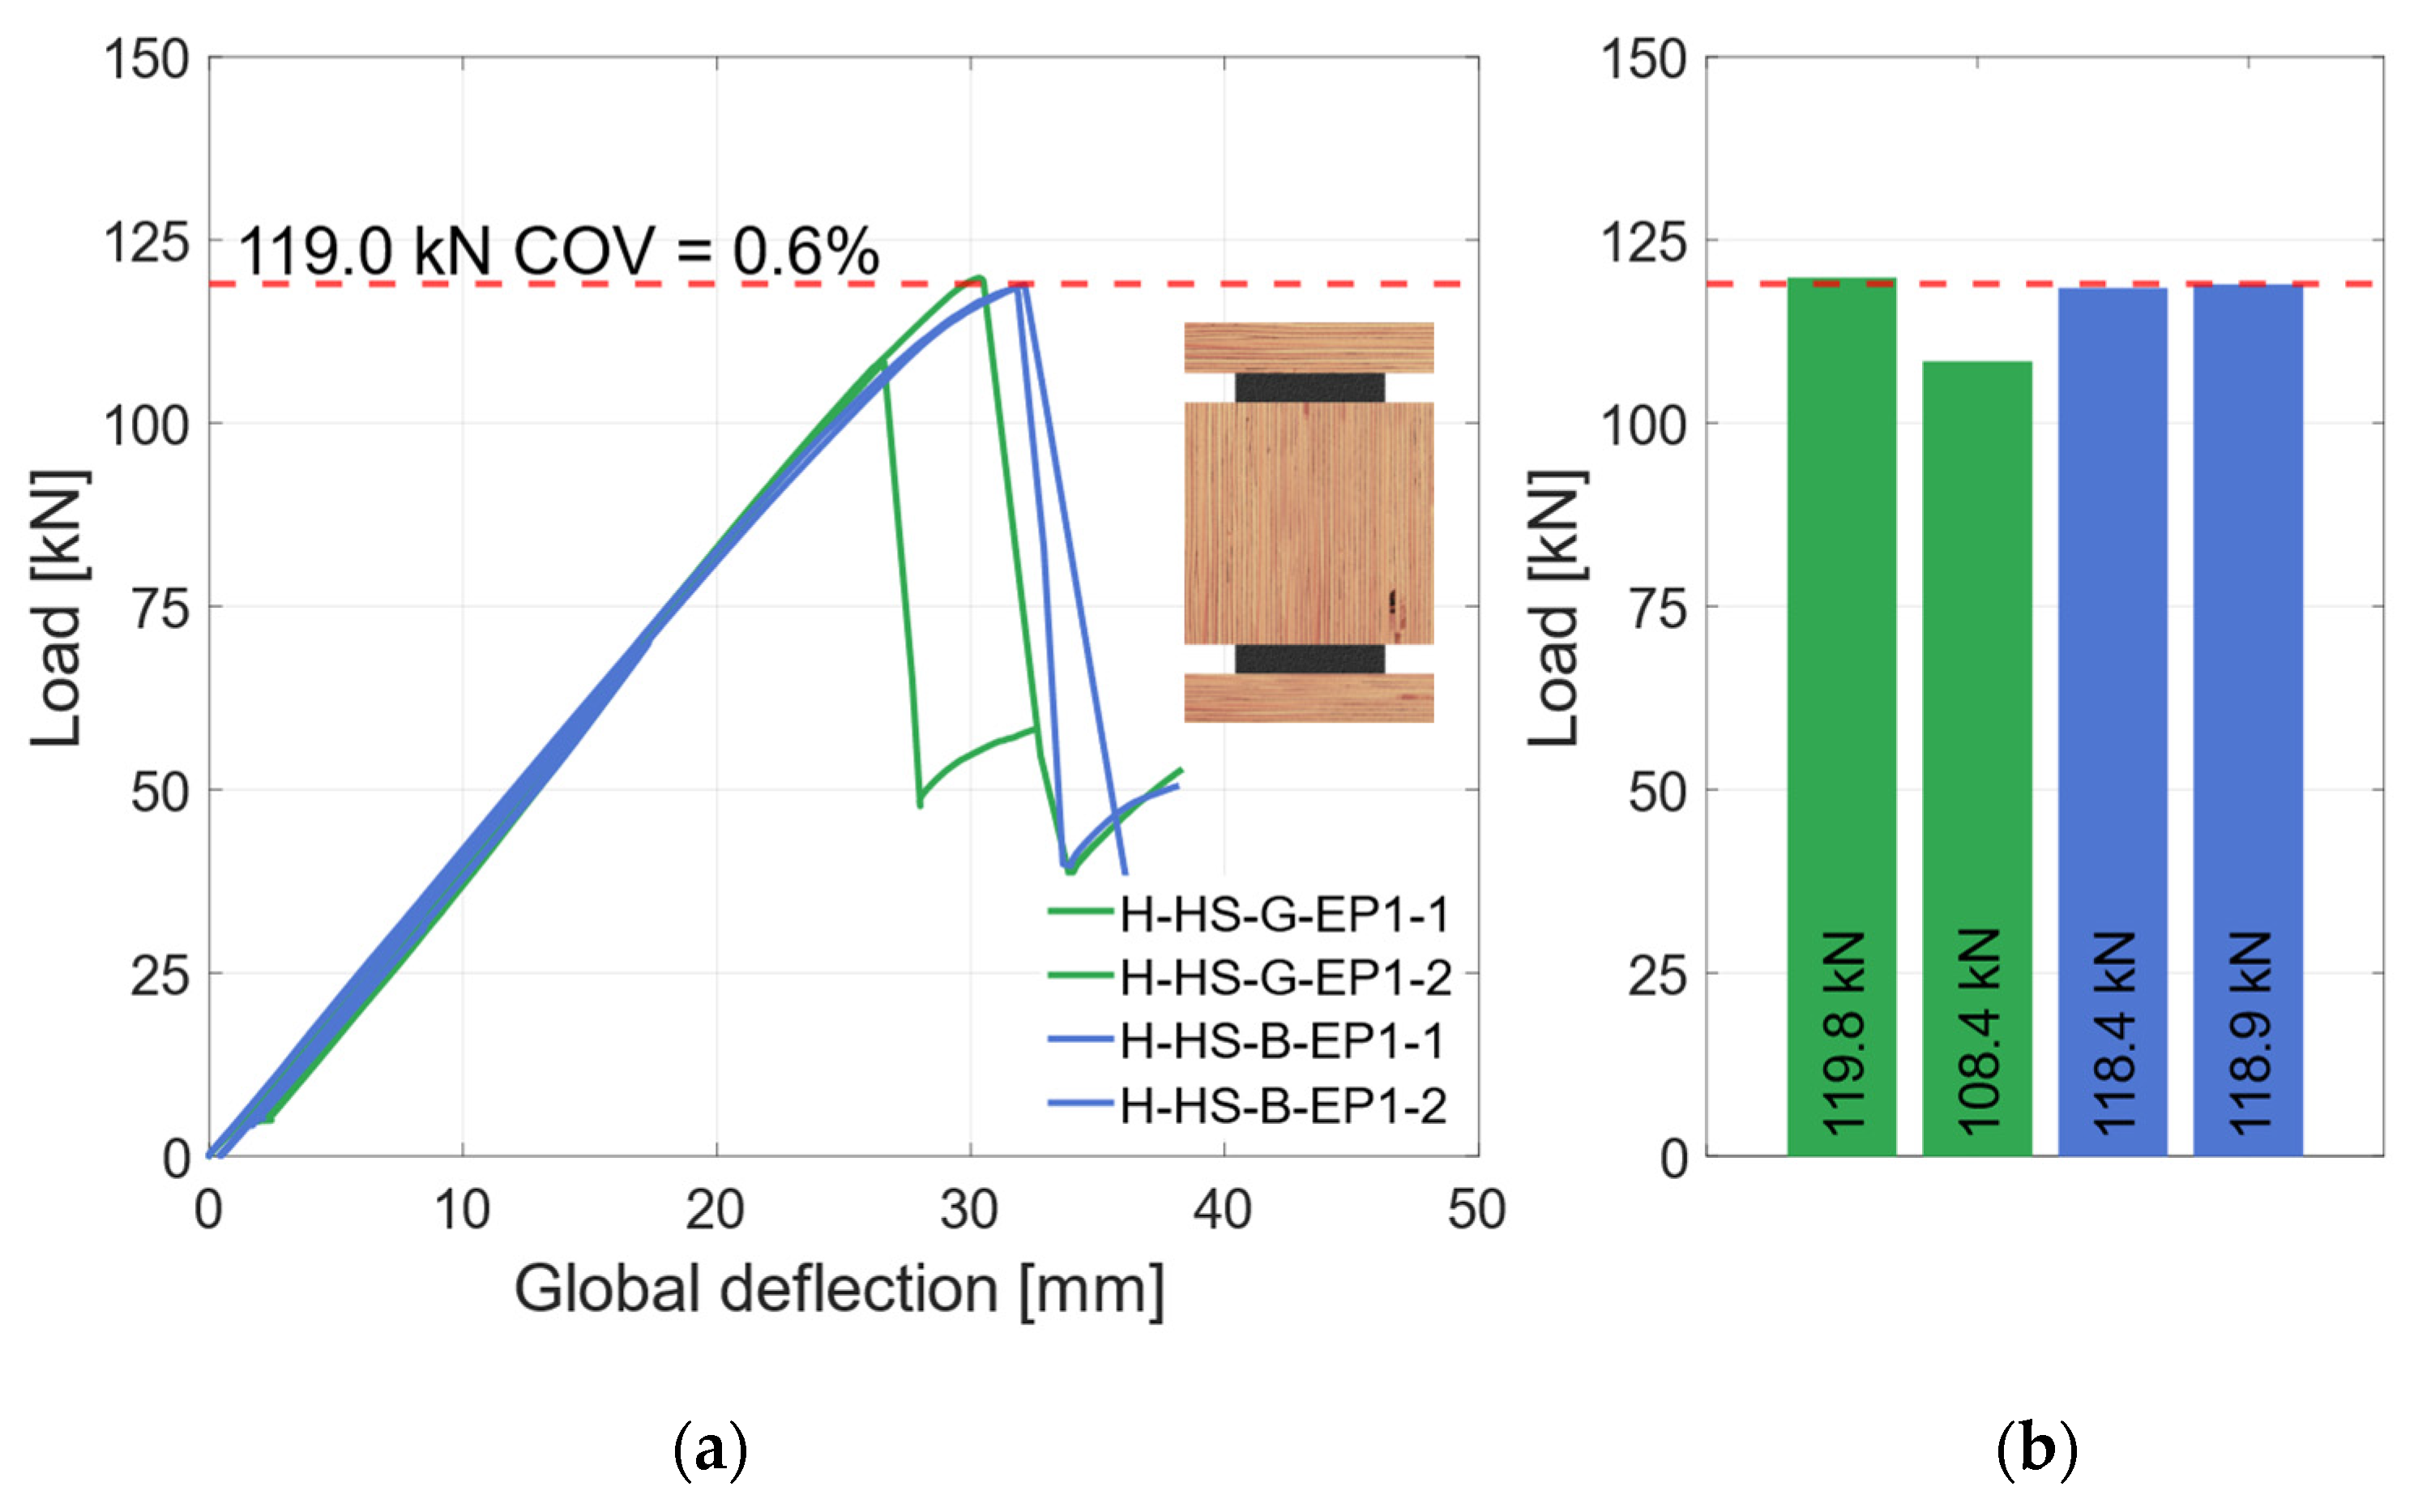
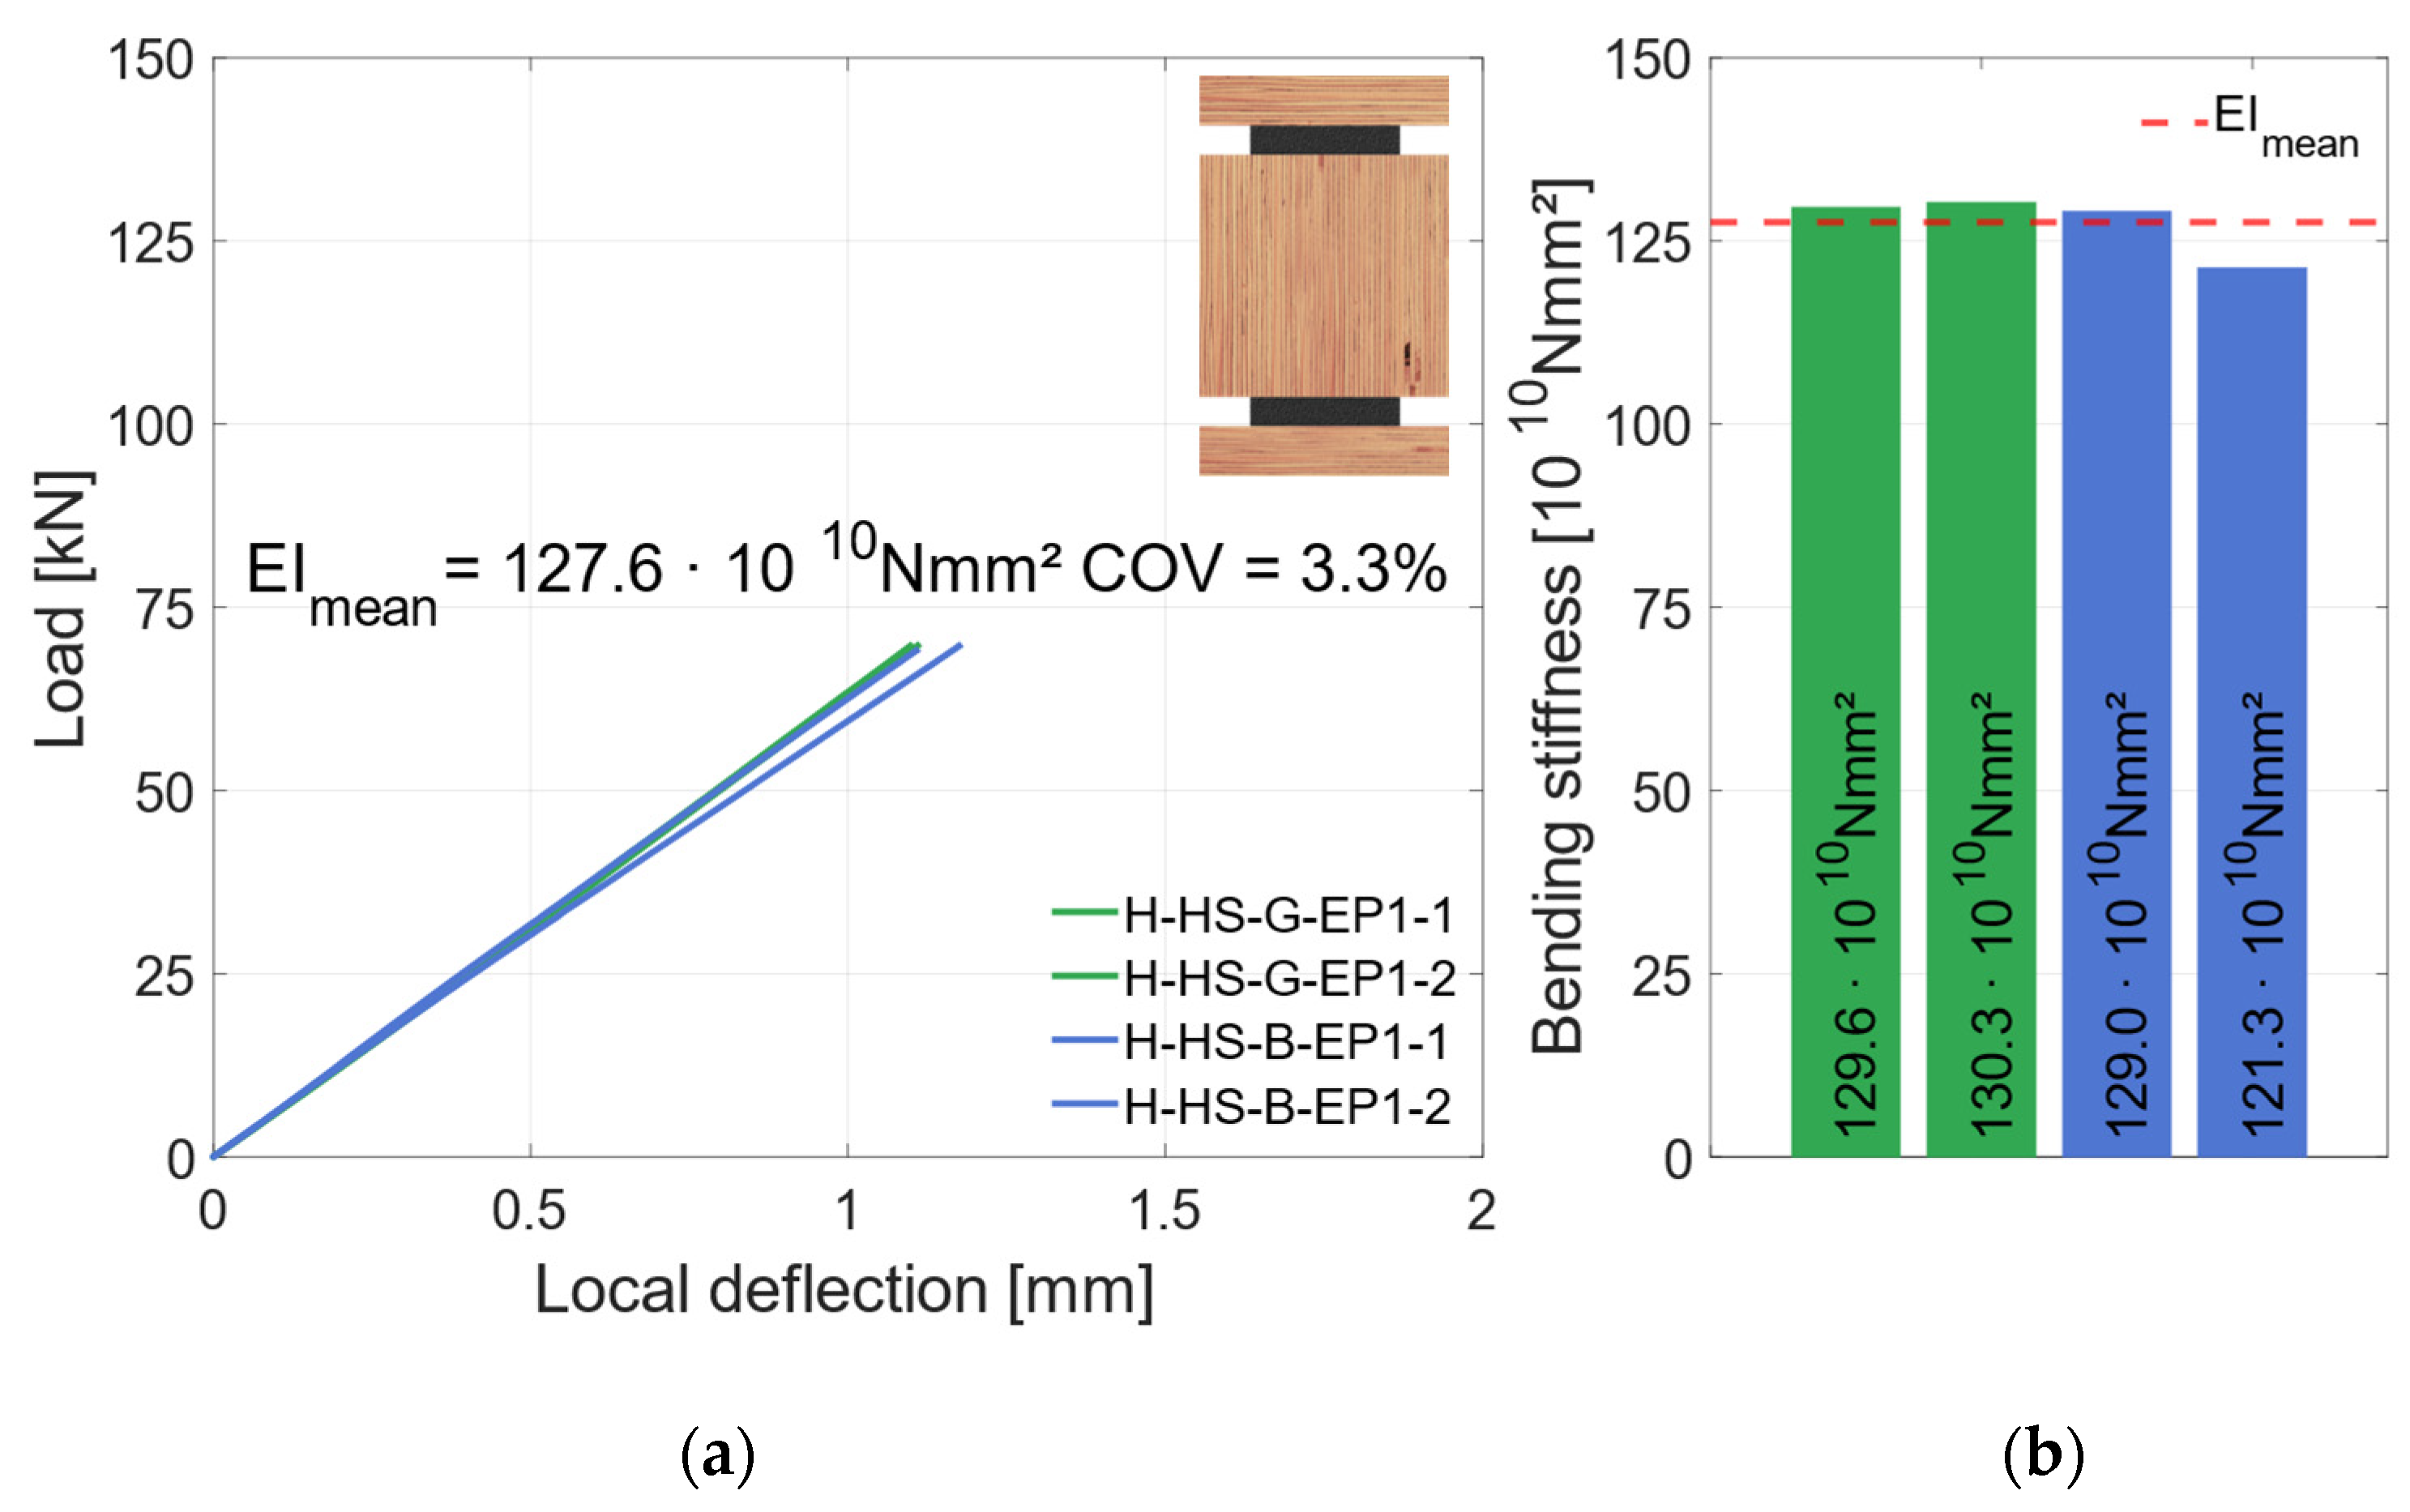
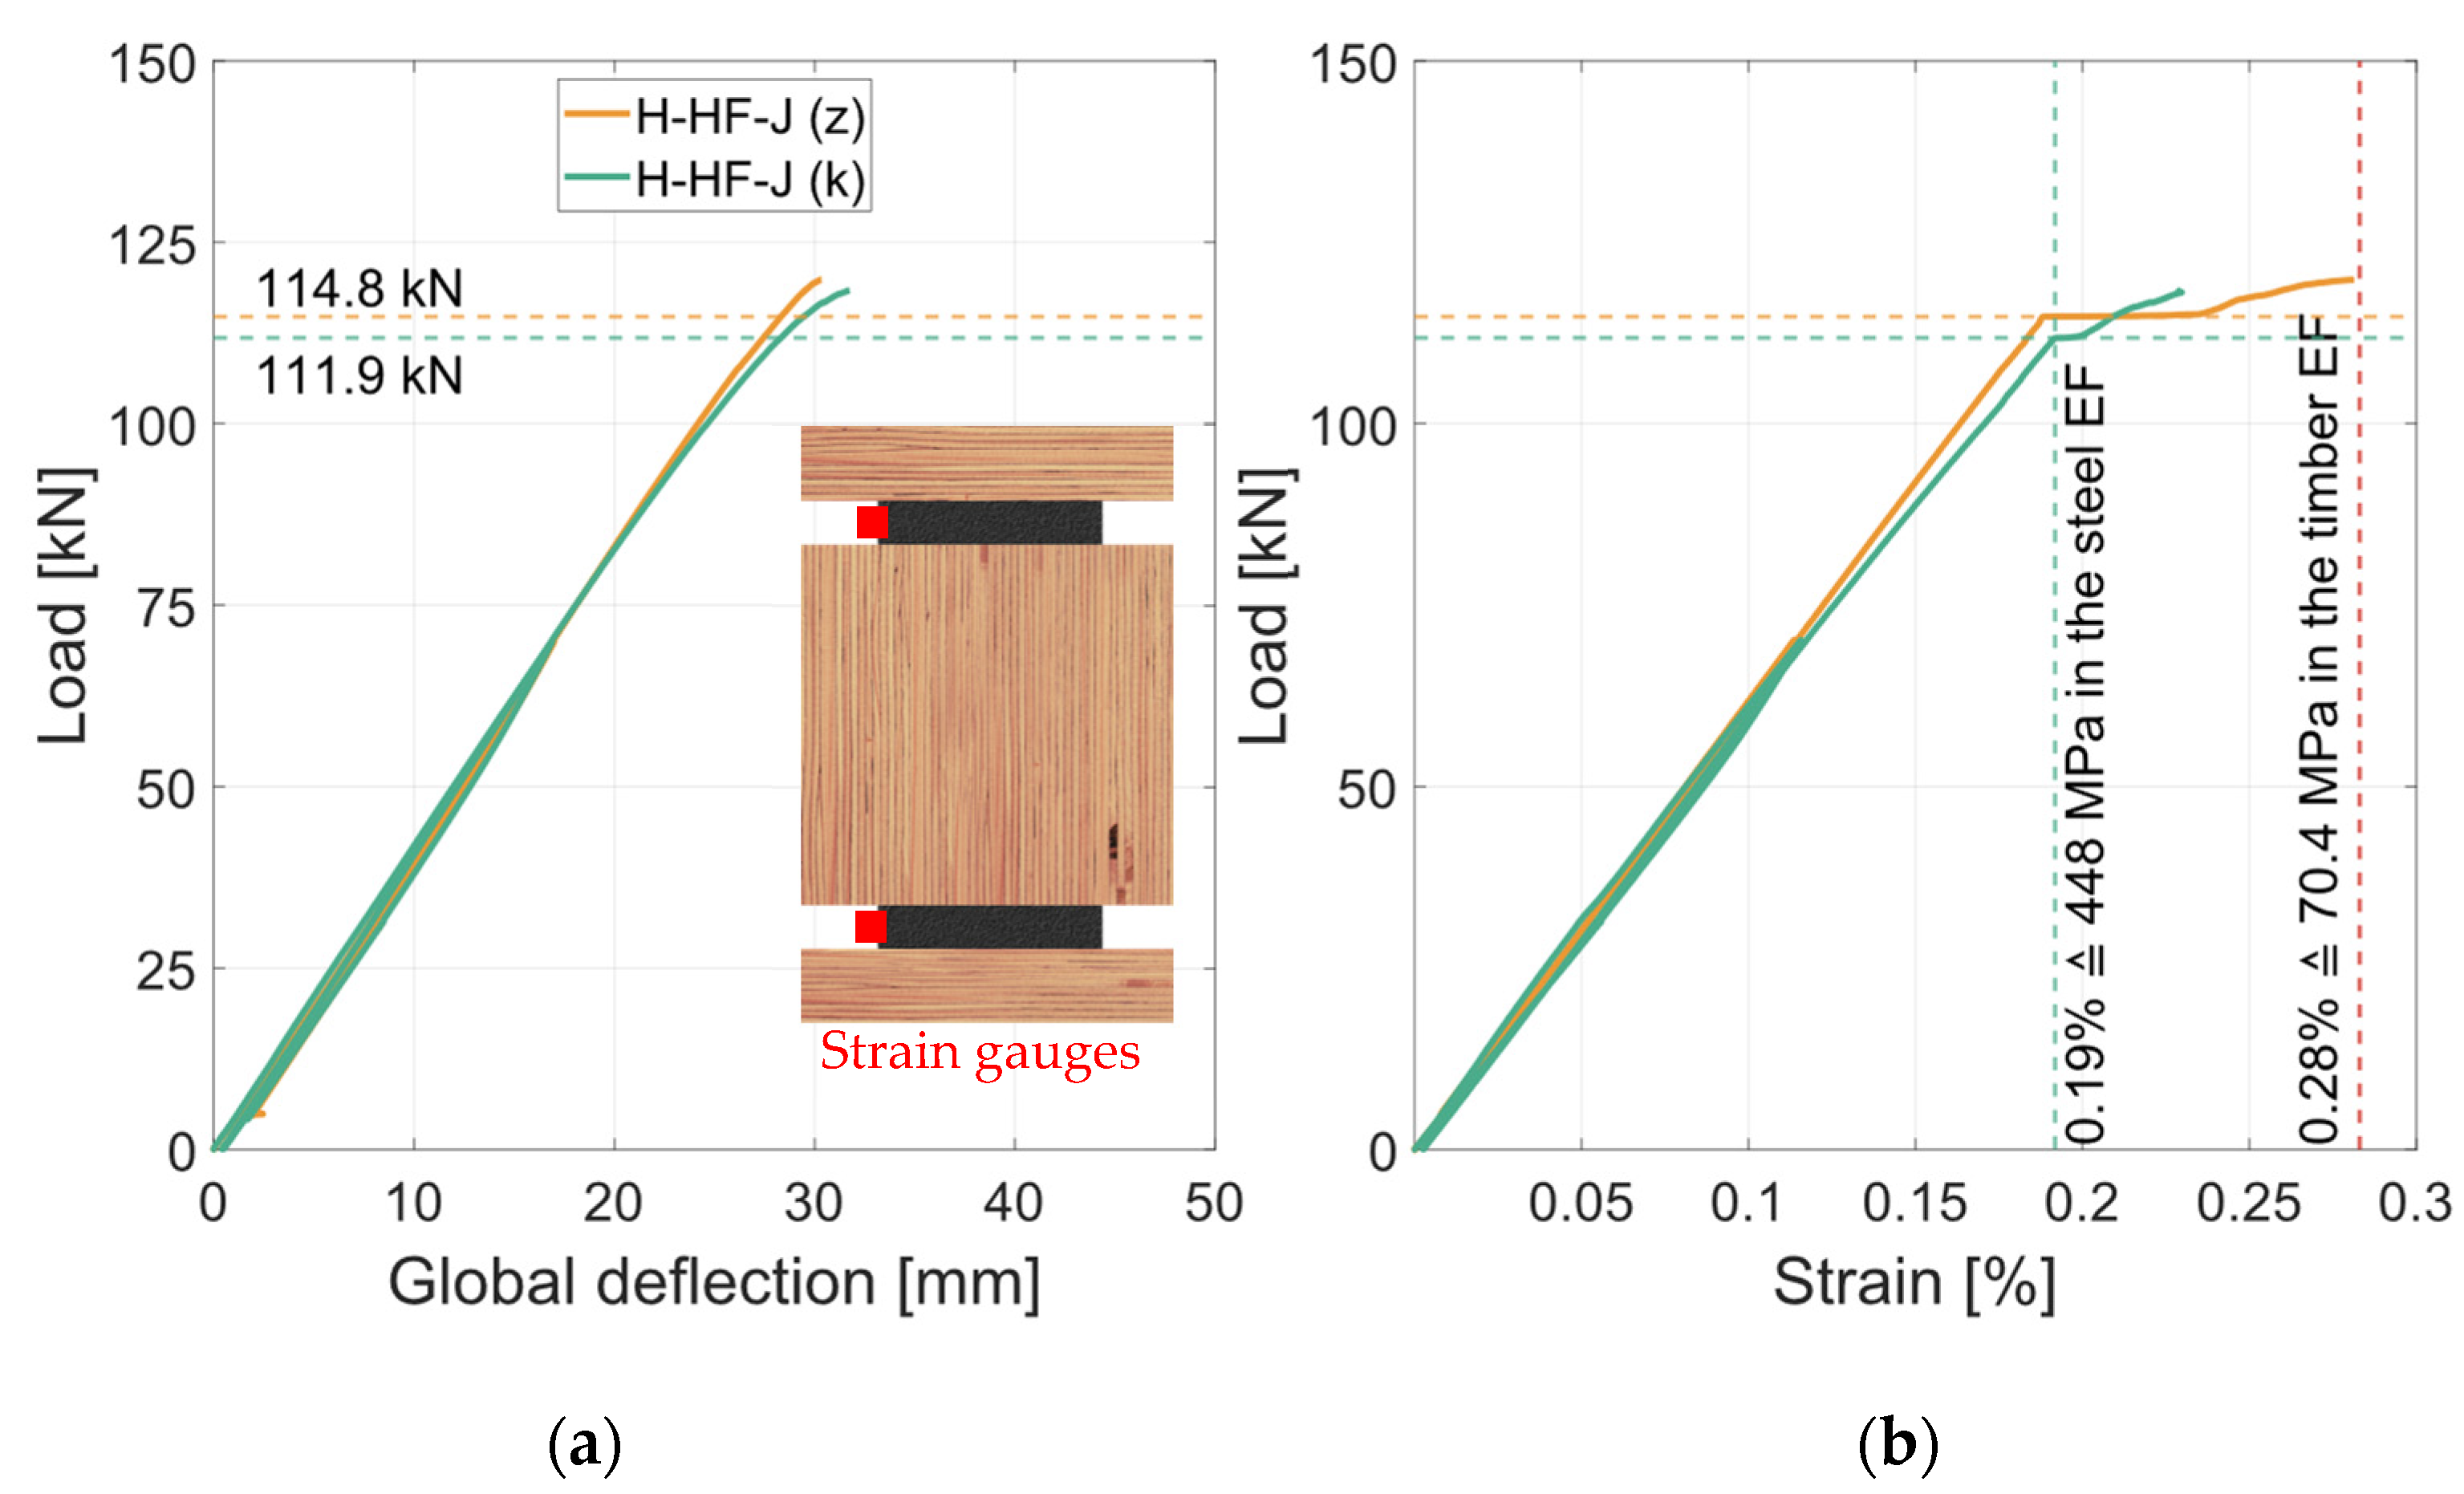
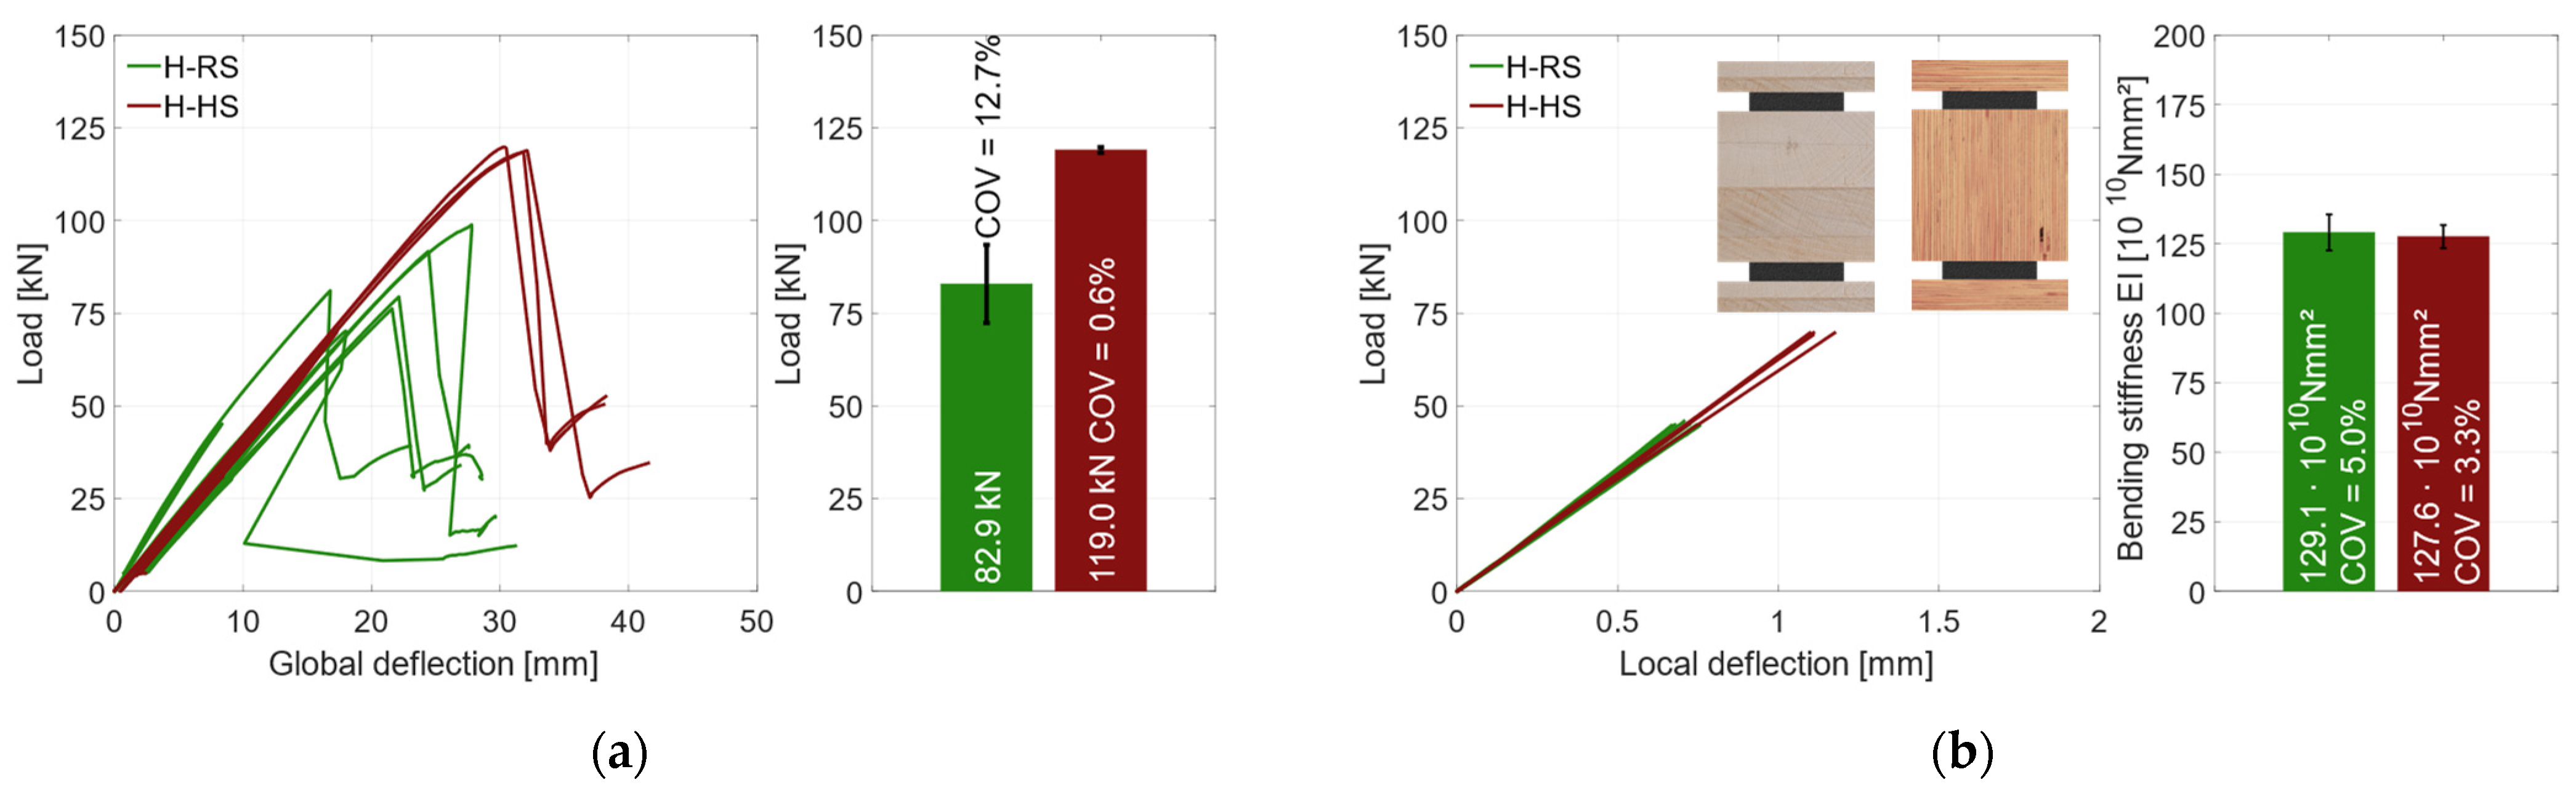
3.3.2. Material Combination: Higher Strength (HS)
4. Discussion
4.1. Influence of the Material Combinations
4.1.1. Vertical Geometry
4.1.2. Horizontal Geometry
4.2. Influence of the Geometries
4.2.1. Regular-Strength Materials
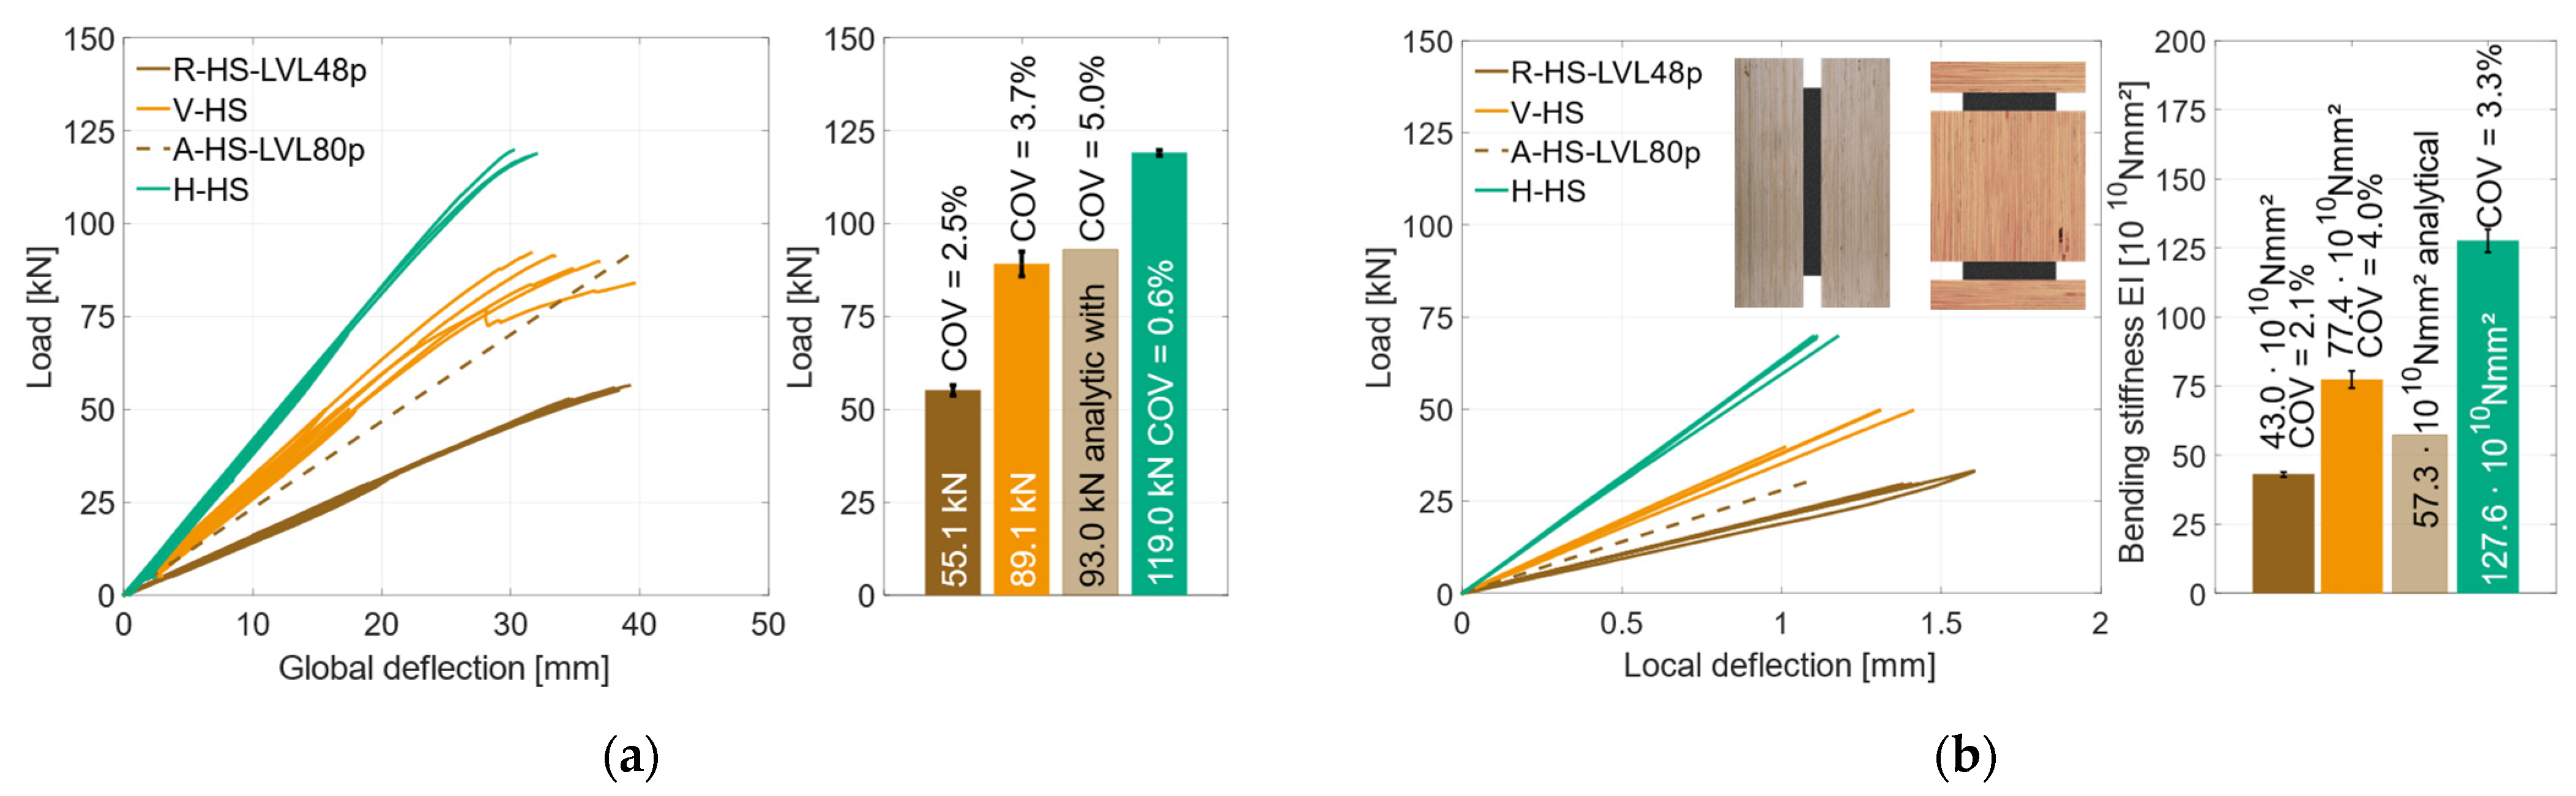
4.2.2. Higher-Strength Materials
4.3. Comparison of Experimental and Analytical Results
5. Conclusions
- An extensive analytical parameter study showed that the materials timber and steel can be combined beneficially, but that the corresponding material grades must be matched as best as possible in order to utilize the full potential of both materials.
- The vertical combination with regular-strength (RS) materials could increase the bending stiffness by 100%; with higher-strength (HS) materials, the additional steel increased the bending stiffness by 80%.
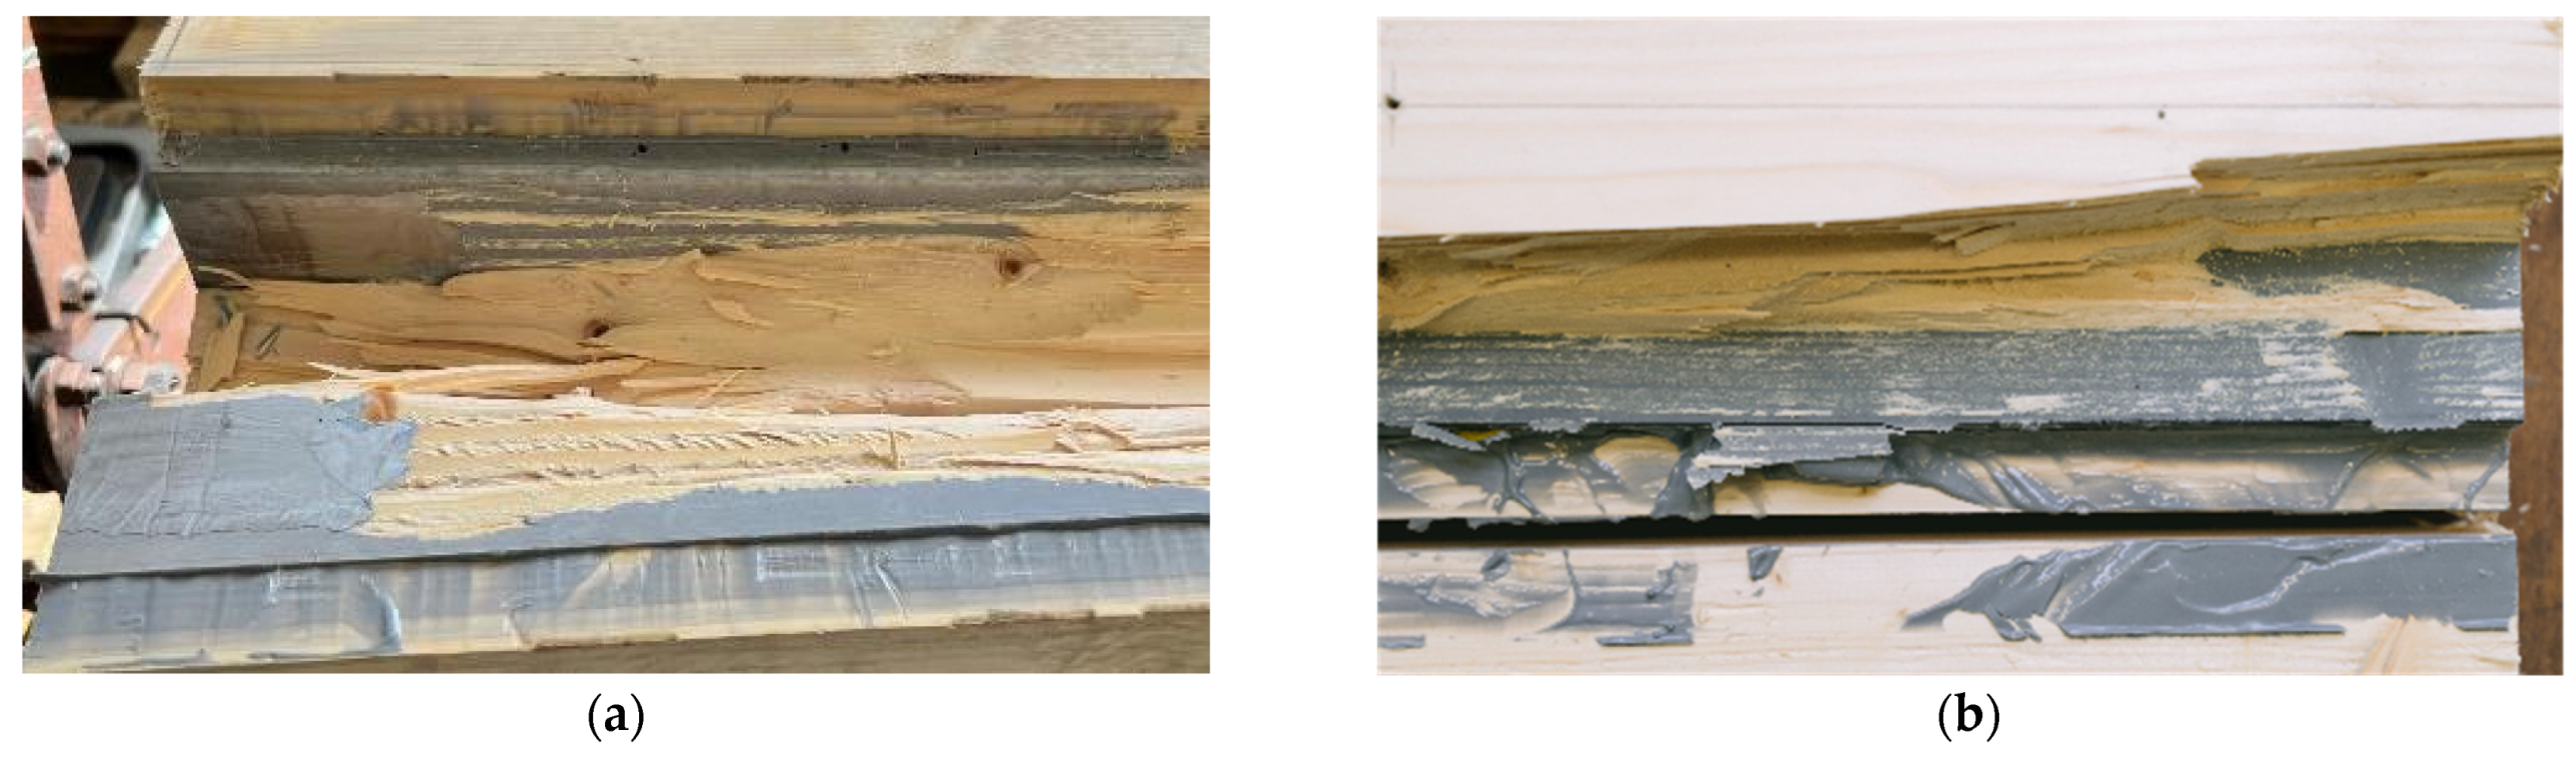
- All specimens with the vertical geometry combination failed by tensile bending failure in the timber element with a ductile residual behavior. The steel elements could be partially stressed plastically.
- In terms of load-carrying capacity, the specimens with vertical steel and RS materials showed an increase of 100%, and with HS materials, the load-carrying capacity was increased by 60%.
- The horizontal combination with RS materials could increase the bending stiffness by 250%; with HS materials, the additional steel increased the bending stiffness by 120%.
- All specimens with the horizontal combination failed due to shear in the middle timber element. The RS material specimens could not reach the yield strength of the steel. With HS materials, the steel was used fully plastically before shear failure occurred.
- Due to the hybridization, the load-carrying capacity of the horizontal combination was increased by 120% with RS materials and by 30% with HS materials.
- For both geometry combinations, the bending stiffness could not be further increased when using HS materials, compared to using RS materials (see Figure 27b).
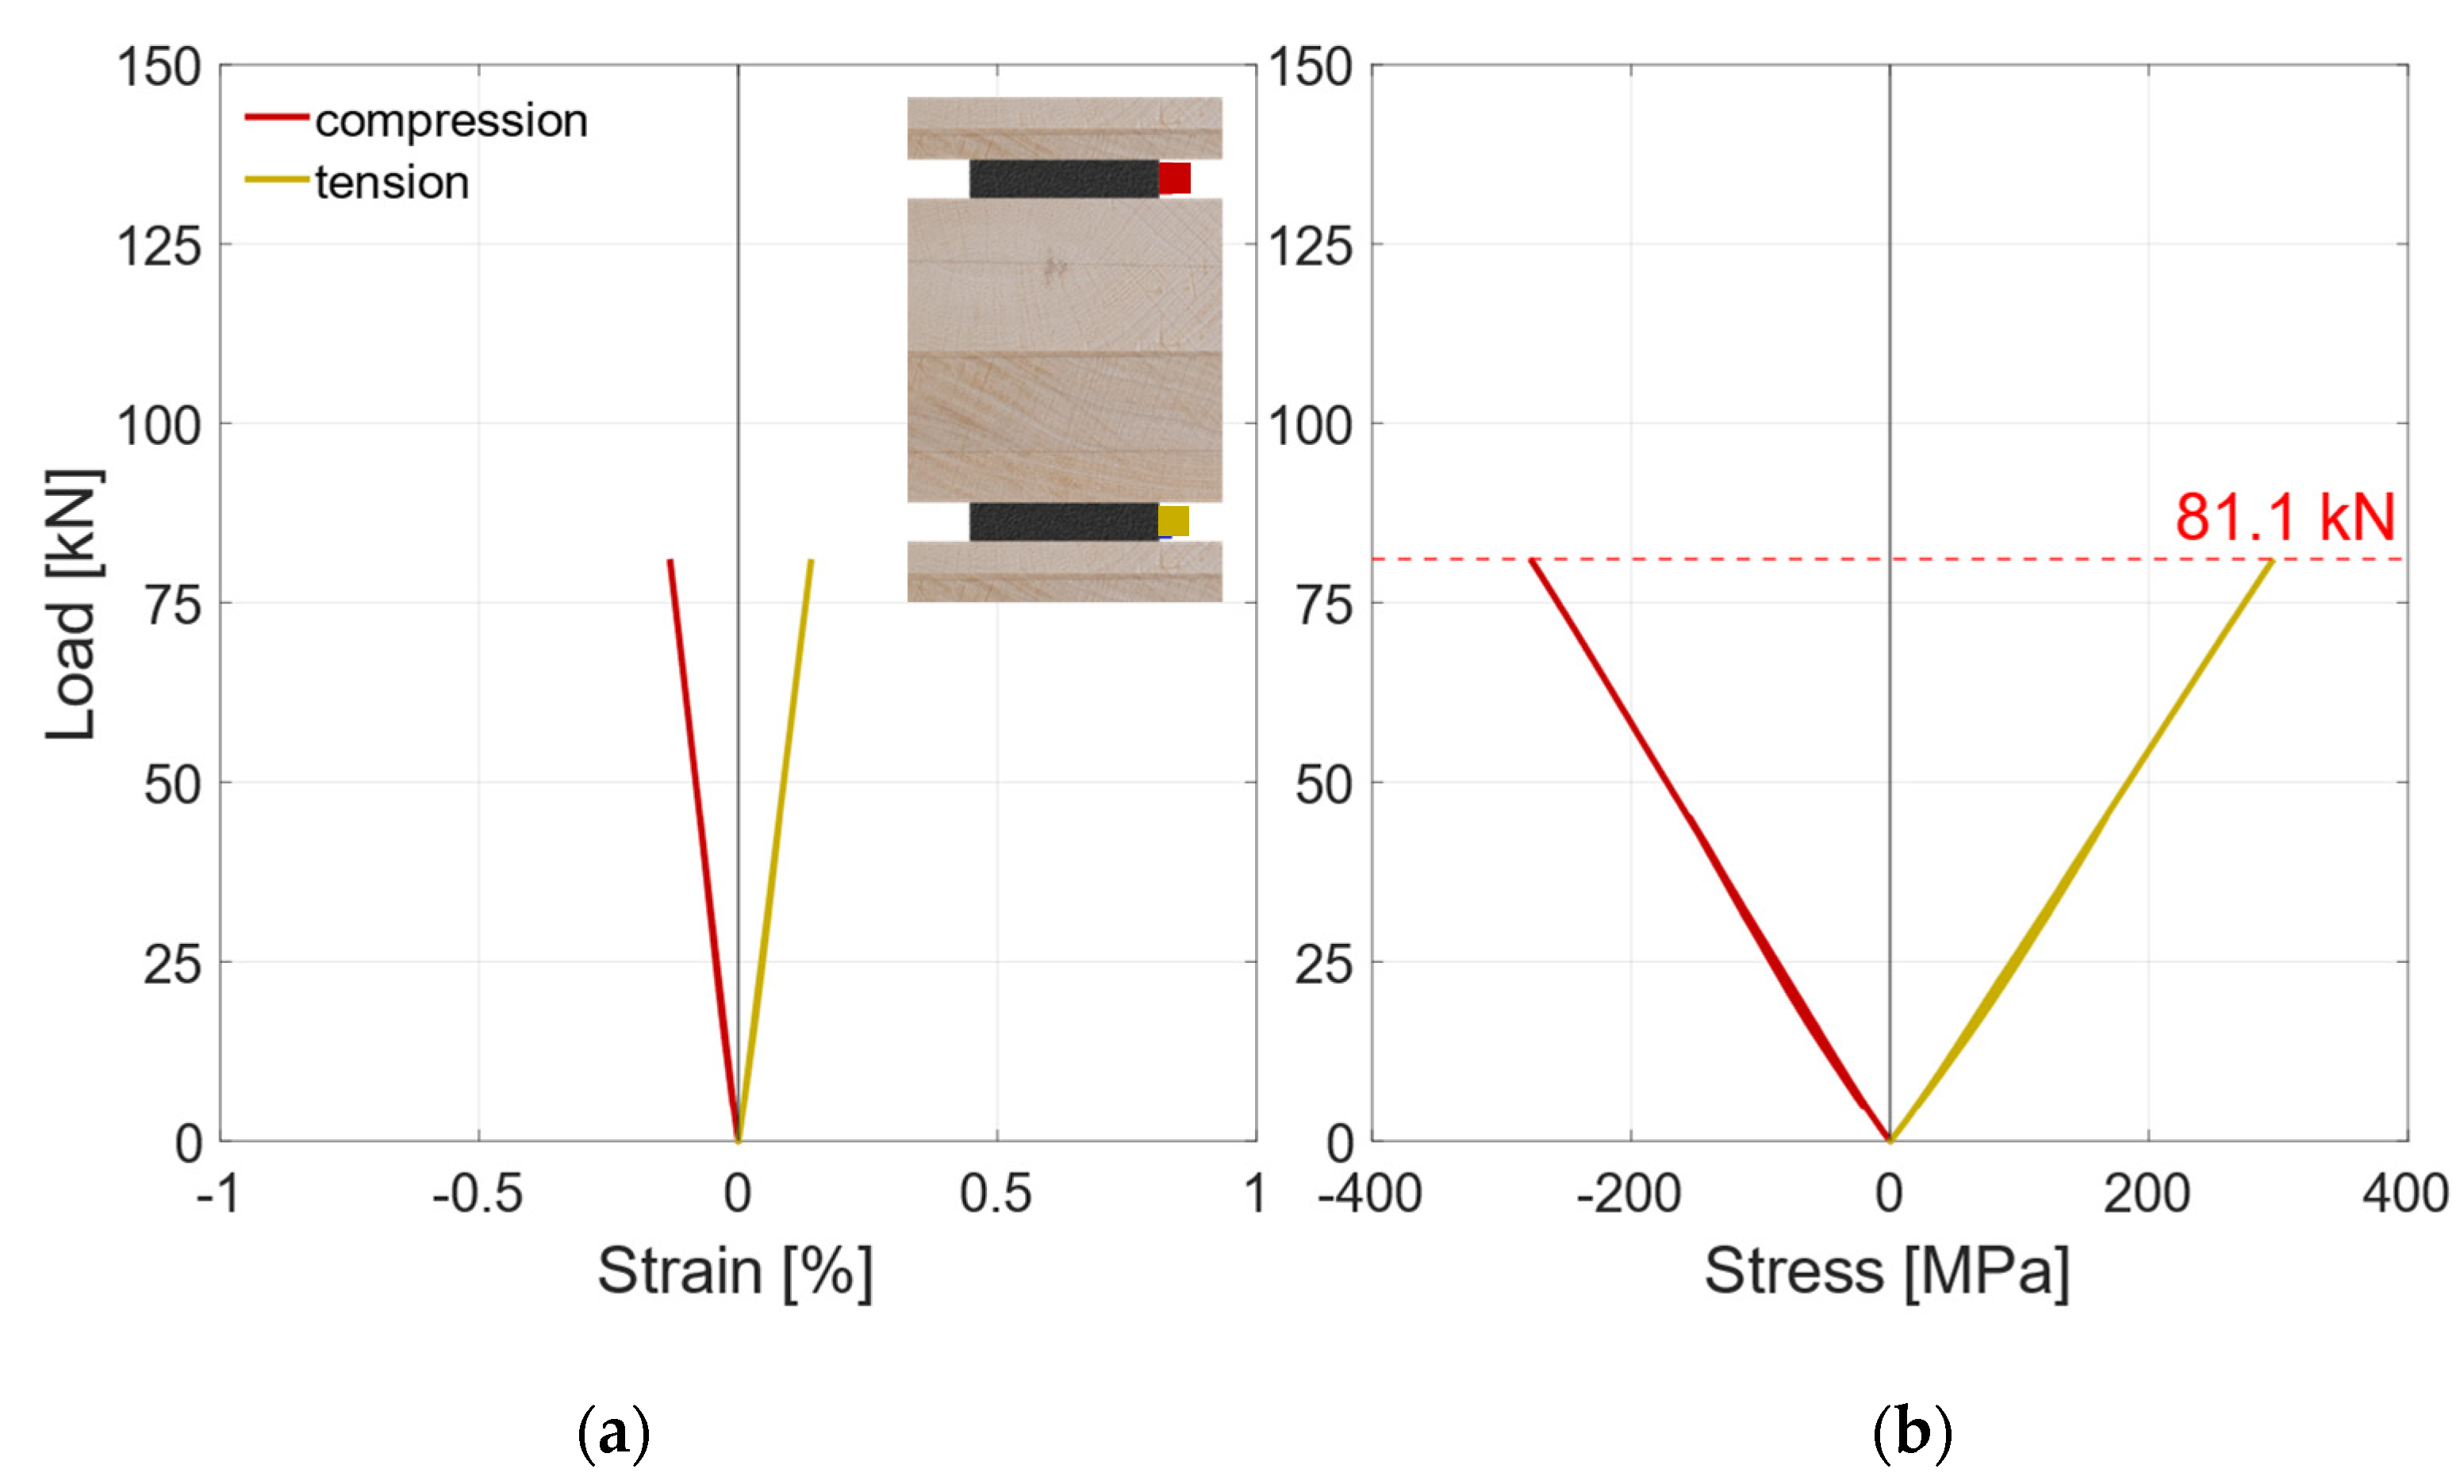
- The comparison between the analytical calculations and the experimental investigations confirmed the assumption of a full bond between the materials. Both the bending stiffness and the stress distribution in the cross-section could reliably be calculated analytically.
Author Contributions
Funding
Institutional Review Board Statement
Informed Consent Statement
Data Availability Statement
Conflicts of Interest
References
- Abrahamsen, R. Mjøstårnet—Construction of an 81 m tall timber building. In Proceedings of the 23. Internationales Holzbau-Forum IHF 2017, Garmisch Partenkirchen, Germany, 6–8 December 2017. [Google Scholar]
- Haase, P.; Boretzki, J.; Albiez, M.; Aurand, S.; Sandhaas, C.; Ummenhofer, T.; Dietsch, P. Influence of the Joining Technique on the Structural Behaviour of Hybrid Timber-Steel Cross-Sections. J. Adhes. 2024. submitted. [Google Scholar]
- Blaß, H.J.; Frese, M. Biegefestigkeit von Brettschichtholz-Hybridträgern mit Randlamellen aus Buchenholz und Kernlamellen aus Nadelholz; Karlsruher Berichte zum Ingenieurholzbau, Band 6; Universitätsverlag Karlsruhe: Karlsruhe, Germany, 2006. [Google Scholar]
- Frese, M. Hybrid glulam beams made of beech LVL and spruce laminations. In Proceedings of the International Network on Timber Engineering Research, INTER, Meeting 47, Bath, UK, 1–4 September 2014. [Google Scholar]
- Ceccotti, A. Composite concrete-timber structures. Prog. Struct. Eng. Mater. 2002, 4, 264–275. [Google Scholar] [CrossRef]
- Martins, C.; Santos, P.; Almeida, P.G.; Godinho, L.; Dias, A.M. Acoustic performance of timber and timber-concrete floors. Constr. Build. Mater. 2015, 101, 684–691. [Google Scholar] [CrossRef]
- Dias, A.; Schänzlin, J.; Dietsch, P. (Eds.) Design of Timber-Concrete Composite Structures—A State-of-the-Art Report by COST Action FP1402/ WG 4; COST Action FP1402; Shaker Verlag: Aachen, Germany, 2018. [Google Scholar]
- Bulleit, W.M. Reinforcement of wood materials: A review. Wood Fiber Sci. 1984, 16, 391–397. [Google Scholar]
- Riola Parada, F. Timber-Steel Hybrid Beams for Multi-Storey Buildings. Ph.D. Thesis, Technische Universität Wien, Vienna, Austria, 2016. [Google Scholar]
- Kia, L.; Valipour, H.R. Radiata Pine and Douglas Fir Timber Steel Encased Columns Subjected to Concentric and Eccentric Loading. J. Struct. Eng. 2022, 148, 04021272. [Google Scholar] [CrossRef]
- Stiemer, S.; Tesfamariam, S.; Karacabeyli, E.; Popovski, M. Development of steel-wood hybrid systems for buildings under dynamic loads. In Proceedings of the 7th International Specialty Conference on Behavior of Steel Structures in Seismic Areas (STESSA), Santiago, Chile, 9–11 January 2012. [Google Scholar]
- Kato, K.; Narihara, H.; Morita, K.; Michikoshi, S.; Kato, M.; Shimamura, K.; Sakaguchi, Y. Development of hybrid column member combining wood and steel. In Proceedings of the World Conference on Timber Engineering, WCTE 2021, Santiago, Chile, 9–12 August 2021. [Google Scholar]
- Sroka, K.; Palma, P.; Steiger, R.; Ehrhart, T.; Frangi, A.; Strahm, T.; Gehri, E. Unreinforced and steel-reinforced columns made of european beech glued-laminated timber. In Proceedings of the World Conference on Timber Engineering, WCTE 2023, Oslo, Norway, 19–22 June 2023. [Google Scholar] [CrossRef]
- Kia, L.; Valipour, H.R.; Ghanbari-Ghazijahani, T. Experimental and numerical investigation of concentric axial loading on bar-reinforced composite timber columns at a large scale. Structures 2024, 60, 105920. [Google Scholar] [CrossRef]
- Kia, L.; Valipour, H.R. Composite timber-steel encased columns subjected to concentric loading. Eng. Struct. 2021, 232, 111825. [Google Scholar] [CrossRef]
- Kiyoto, S.; Shioya, S. Long-term testing of timber-steel bar hybrid beams. In Proceedings of the World Conference on Timber Engineering, WCTE 2018, Seoul, Republic of Korea, 20–23 August 2018. [Google Scholar]
- Aspila, A.; Heinisuo, M.; Mela, K.; Malaska, M.; Pajunen, S. Elastic design of steel-timber composite beams. Wood Mater. Sci. Eng. 2022, 17, 243–252. [Google Scholar] [CrossRef]
- Strzelecka, J.; Polus, L.; Chybiński, M. Theoretical and Numerical Analyses of Steel-timber Composite Beams with LVL Slabs. Civ. Environ. Eng. Rep. 2023, 33, 64–84. [Google Scholar] [CrossRef]
- Vallée, T.; Tannert, T.; Fecht, S. Adhesively bonded connections in the context of timber engineering—A Review. J. Adhes. 2017, 93, 257–287. [Google Scholar] [CrossRef]
- Albiez, M.; Damm, J.; Ummenhofer, T.; Kaufmann, M.; Vallée, T.; Myslicki, S. Hybrid joining of jacket structures for offshore wind turbines—Determination of requirements and adhesive characterisation. Eng. Struct. 2022, 259, 114186. [Google Scholar] [CrossRef]
- Albiez, M.; Damm, J.; Ummenhofer, T.; Ehard, H.; Schuler, C.; Kaufmann, M.; Vallée, T.; Myslicki, S. Hybrid joining of jacket structures for offshore wind turbines—Validation under static and dynamic loading at medium and large scale. Eng. Struct. 2022, 252, 113595. [Google Scholar] [CrossRef]
- Ummenhofer, T.; Boretzki, J.; Albiez, M. Hybrid connection technologies for hollow sections in steel construction. Steel Constr. 2022, 15, 37–50. [Google Scholar] [CrossRef]
- Myslicki, S.; Vallée, T.; Fricke, H.; Ummenhofer, T.; Boretzki, J.; Albiez, M. Hybrid grouted steel connections using adhesively bonded granules in the steel grout interface: Development and validation of an innovative joining technique. Constr. Build. Mater. 2024, 414, 134765. [Google Scholar] [CrossRef]
- Boretzki, J.; Albiez, M.; Myslicki, S.; Vallée, T.; Ummenhofer, T. Hybrid grouted joints: Load bearing and failure behaviour under static, axial loading. Constr. Build. Mater. 2024, 413, 134691. [Google Scholar] [CrossRef]
- Yokozeki, K.; Hisazumi, K.; Vallée, T.; Evers, T.; Ummenhofer, T.; Boretzki, J.; Albiez, M. Hybrid joints consisting of pre-tensioned bolts and a bonded connection, Part II: Large-scale experiments. Int. J. Adhes. Adhes. 2024, 128, 103523. [Google Scholar] [CrossRef]
- Boretzki, J.; Albiez, M. Static strength and load bearing behaviour of hybrid bonded bolted joints: Experimental and numerical investigations. J. Adhes. 2023, 99, 606–631. [Google Scholar] [CrossRef]
- DIN EN 408:2010; Holzbauwerke—Bauholz für Tragende Zwecke und Brettschichtholz—Bestimmung Einiger Physikalischer und Mechanischer Eigenschaften. DIN: Berlin, Germany, 2010.
- DIN EN 26891:1991; Holzbauwerke—Verbindungen mit Mechanischen Verbindungsmitteln Allgemeine Grundsätze für die Ermittlung der Tragfähigkeit und des Verformungsverhaltens. DIN: Berlin, Germany, 1991.
- Studiengemeinschaft Holzleimbau e.V. Furnierschichtholz-Merkblatt (LVL). Neue Europäische Festigkeitsklassen; Studiengemeinschaft Holzleimbau e.V.: Wuppertal, Germany, 2020. [Google Scholar]
- DIN EN 10025-2:2019; Warmgewalzte Erzeugnisse aus Baustählen. DIN: Berlin, Germany, 2019.
- DIN EN 1993-1-1:2010; Eurocode 3: Bemessung und Konstruktion von Stahlbauten. DIN: Berlin, Germany, 2010.
- DIN EN ISO 6892-1:2020; Metallische Werkstoffe—Zugversuch. DIN: Berlin, Germany, 2020.
- Grunwald, C.; Vallée, T.; Fecht, S.; Bletz-Mühldorfer, O.; Diehl, F.; Bathon, L.; Myslicki, S.; Scholz, R.; Walther, F. Rods glued in engineered hardwood products part I: Experimental results under quasi-static loading. Int. J. Adhes. Adhes. 2019, 90, 163–181. [Google Scholar] [CrossRef]
- DIN EN ISO 527-2:2012; Kunststoffe—Bestimmung der Zugeigenschaften—Teil 2: Prüfbedingungen für Form- und Extrusionsmassen. DIN: Berlin, Germany, 2012.
- DIN EN ISO 8501-1:2007-12; Vorbereitung von Stahloberflächen vor dem Auftragen von Beschichtungsstoffen—Visuelle Beurteilung der Oberflächenreinheit—Teil 1. DIN: Berlin, Germany, 2017.
- DIN EN 14080:2013; Holzbauwerke—Brettschichtholz und Balkenschichtholz. DIN: Berlin, Germany, 2013.
- Dietsch, P. Einsatz und Berechnung von Schubverstärkungen für Brettschichtholzbauteile. Ph.D. Thesis, Technische Universität München, München, Germany, 2012. [Google Scholar]
- Joint Committee on Structural Safety (JCSS). Probabilistic Model Code. Part 3: Material Properties; JCSS: Zurich, Switzerland, 2002. [Google Scholar]
- DIN EN 14358:2016; Holzbauwerke–Berechnung und Kontrolle Charakteristischer Werte. DIN: Berlin, Germany, 2016.


| Material | E-Modulus [MPa] | Bending Strength fm,0,flat,m [MPa] | Shear Strength fv,m [MPa] | Density ρ [kg/m³] | Moisture Content u [%] | Tensile Strength ft [MPa] | |
|---|---|---|---|---|---|---|---|
| Timber | GL24h | 11,100 ± 1400 (n = 8) | 35.0 ± 5.2 | 4.86 ± 0.7 | 443 ± 23 | 11.5 ± 0.7 | - |
| LVL48p | 12,600 ± 260 (n = 5) | 51.7 ± 1.3 | 5.99 ± 0.2 | 493 ± 5.3 | 9.6 ± 0.2 | - | |
| LVL80p | 16,800 * | 81.7 * | 8.72 * | 841 ± 17 | 7.2 ± 0.6 | - | |
| Adhesive | EP1 | 6300 | - | - | - | 24.6 ± 6.8 | |
| EP2 | 5400 ± 110 | - | - | - | - | 45.0 ± 1.4 | |
| PUR | 5000 ± 490 | - | - | - | - | 45.5 ± 0.7 |
| Material | Surface | EP1 | EP2 | PUR | |
|---|---|---|---|---|---|
| Geometry 1 (vertical steel plate) | GL24h + S355 | galvanized | V-RS-G-EP1 n = 2 | V-RS-G-EP2 2 | V-RS-G-PUR 1 |
| blasted | - | V-RS-B-EP2 1 | - | ||
| LVL48p + S420 | galvanized | V-HS-G-EP1 2 | - | V-HS-G-PUR 1 | |
| blasted | V-HS-B-EP1 2 | - | - | ||
| Geometry 2 (horizontal steel plates) | GL24h + S355 | galvanized | H-RS-G-EP1 2 | H-RS-G-EP2 2 | H-RS-G-PUR 1 |
| blasted | - | H-RS-B-EP2 1 | - | ||
| LVL80p + S420 | galvanized | H-HS-G-EP1 2 | - | - | |
| blasted | H-HS-B-EP1 2 | - | - |
| Material | Referred Second Moment of Inertia [×106 mm4] | [×1010 Nmm²] | ||
|---|---|---|---|---|
| Iy,ref,T | Iy,ref,S | |||
| Geometry 1 (vertical steel plate) | GL24h + S355 | 62.9 | 3.31 | 69.5 |
| LVL48p + S420 | 58.8 | 3.53 | 74.1 | |
| Geometry 2 (horizontal steel plates) | GL24h + S355 | 107 | 5.64 | 118 |
| LVL80p + S420 | 79.6 | 6.38 | 134 | |
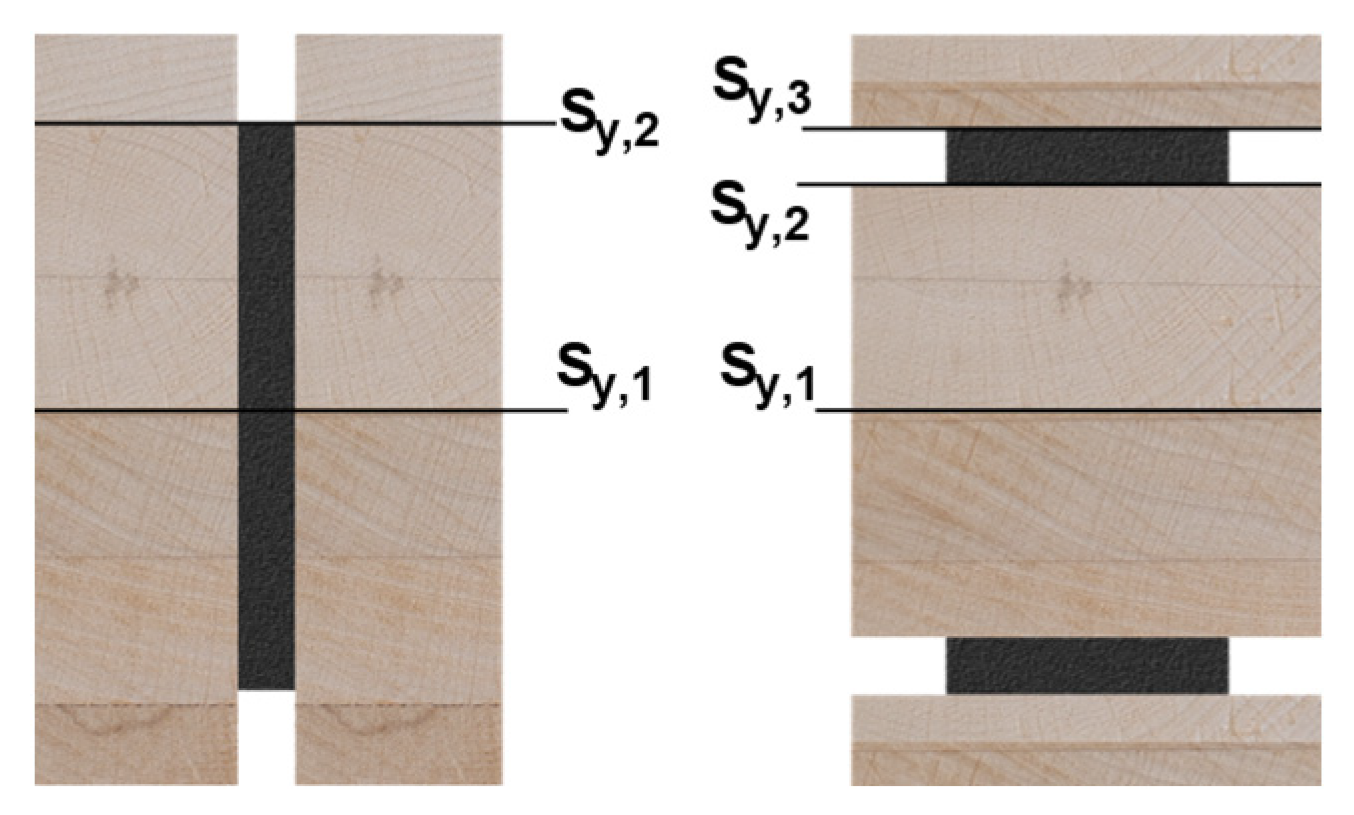
| Material | Referred First Moment of Inertia [×104 mm3] | |||
|---|---|---|---|---|
| Sy,ref,1,T | Sy,ref,2,T | Sy,ref,3,T | ||
| Geometry 1 (vertical steel plate) | GL24h + S355 | 69.2 | 12.3 | - |
| LVL48p + S420 | 64.2 | 12.3 | - | |
| Geometry 2 (horizontal steel plates) | GL24h + S355 | 99.4 | 87.8 | 14 |
| LVL80p + S420 | 74.1 | 62.6 | 14 | |
Disclaimer/Publisher’s Note: The statements, opinions and data contained in all publications are solely those of the individual author(s) and contributor(s) and not of MDPI and/or the editor(s). MDPI and/or the editor(s) disclaim responsibility for any injury to people or property resulting from any ideas, methods, instructions or products referred to in the content. |
© 2024 by the authors. Licensee MDPI, Basel, Switzerland. This article is an open access article distributed under the terms and conditions of the Creative Commons Attribution (CC BY) license (https://creativecommons.org/licenses/by/4.0/).
Share and Cite
Haase, P.; Aurand, S.; Boretzki, J.; Albiez, M.; Sandhaas, C.; Ummenhofer, T.; Dietsch, P. Bending Behavior of Hybrid Timber–Steel Beams. Materials 2024, 17, 1164. https://doi.org/10.3390/ma17051164
Haase P, Aurand S, Boretzki J, Albiez M, Sandhaas C, Ummenhofer T, Dietsch P. Bending Behavior of Hybrid Timber–Steel Beams. Materials. 2024; 17(5):1164. https://doi.org/10.3390/ma17051164
Chicago/Turabian StyleHaase, Peter, Simon Aurand, Jakob Boretzki, Matthias Albiez, Carmen Sandhaas, Thomas Ummenhofer, and Philipp Dietsch. 2024. "Bending Behavior of Hybrid Timber–Steel Beams" Materials 17, no. 5: 1164. https://doi.org/10.3390/ma17051164
APA StyleHaase, P., Aurand, S., Boretzki, J., Albiez, M., Sandhaas, C., Ummenhofer, T., & Dietsch, P. (2024). Bending Behavior of Hybrid Timber–Steel Beams. Materials, 17(5), 1164. https://doi.org/10.3390/ma17051164