Abstract
We present an extensive study of the luminescence characteristics of Mn impurity ions in a YAl3(BO3)4:Mn crystal, in combination with X-ray fluorescence analysis and determination of the valence state of Mn by XANES (X-ray absorption near-edge structure) spectroscopy. The valences of manganese Mn2+(d5) and Mn3+(d4) were determined by the XANES and high-resolution optical spectroscopy methods shown to be complementary. We observe the R1 and R2 luminescence and absorption lines characteristic of the 2E ↔ 4A2 transitions in d3 ions (such as Mn4+ and Cr3+) and show that they arise due to uncontrolled admixture of Cr3+ ions. A broad luminescent band in the green part of the spectrum is attributed to transitions in Mn2+. Narrow zero-phonon infrared luminescence lines near 1060 nm (9400 cm−1) and 760 nm (13,160 cm−1) are associated with spin-forbidden transitions in Mn3+: 1T2 → 3T1 (between excited triplets) and 1T2 → 5E (to the ground state). Spin-allowed 5T2 → 5E Mn3+ transitions show up as a broad band in the orange region of the spectrum. Using the data of optical spectroscopy and Tanabe–Sugano diagrams we estimated the crystal-field parameter Dq and Racah parameter B for Mn3+ in YAB:Mn as Dq = 1785 cm−1 and B = 800 cm−1. Our work can serve as a basis for further study of YAB:Mn for the purposes of luminescent thermometry, as well as other applications.
1. Introduction
Crystals of yttrium-aluminum borate YAl3(BO3)4 (YAB) have the structure of the mineral huntite CaMg3(CO3)4 with the non-centrosymmetric space group R32 of the trigonal system [1]. Figure 1 shows different projections of the YAB unit cell. The crystal structure is formed by layers that are perpendicular to the crystallographic c axis and consist of distorted YO6 prisms, AlO6 octahedra, and BO3 groups of two types (B1O3 and B2O3). Y3+ ions in YO6 prisms are surrounded by six oxygen atoms of one type and occupy sites with the D3 point symmetry group. The point group of AlO6 octahedra is C2. AlO6 octahedra linked together by their edges form spiral chains running along the c axis. The Y3+ ions are situated between three such chains and link the chains together. YO6 prisms are isolated from each other, having no oxygen atoms in common, which, in the case of a substitution of the Y3+ ions by rare-earth or transition metal ions, results in low luminescence quenching [2]. This property, together with high optical nonlinearity and excellent physical characteristics and chemical stability, make YAB extremely interesting for many applications. Doped with various rare-earth and transition metal ions, YAB crystals are well-known phosphors, promising for use as materials for display panels, lasers, scintillators, LEDs, luminescent thermometers, and in medical imaging [3,4,5,6,7,8,9,10,11,12,13,14,15,16,17,18]. YAB crystals doped with Nd3+ [8,13], Yb3+ [11,12,14], Er3+/Yb3+ [10], and Yb3+/Tm3+ [16] are well-known media for self-frequency doubling, self-frequency summing, and up-conversion lasers. Tunable anti-Stokes ultraviolet–blue light generation was demonstrated using a random laser based on Nd0.10Y0.90Al3(BO3)4 [3]. YAB:Eu3+/Tb3+ phosphors were proposed for eye-friendly white LEDs [6]. In addition, YAB:Cr is being investigated as a material for LEDs [17]—in particular, as a phosphor for plant growth LEDs—with excellent thermal stability and high luminescent yield [5]. Recently, impressive applications of YAB:Pr3+/Gd3+ and YAB:Cr3+ in luminescent thermometry were reported [4,15]. In Ref. [15], it was proposed to use several excited levels of the Gd3+ ion in YAB doped with Pr3+ and Gd3+ ions in the UV region of the spectrum to implement a Boltzmann thermometer operating from 30 to 800 K. The UV region allowed detuning from background thermal radiation even at the highest temperatures. In this case, excitation was carried out at a wavelength of 450 nm using an inexpensive commercial LED into the absorption band of the Pr3+ ion, followed by the up-conversion energy transfer Pr3+ → Gd3+. In Ref. [4], a combination of optical heating and luminescent thermometry in YAB:Cr3+ was realized. Here, the temperature-dependent ratio of emission intensities for the 4T2→ 4A2 and 2E→ 4A2 transitions of Cr3+ was used to measure the temperature.
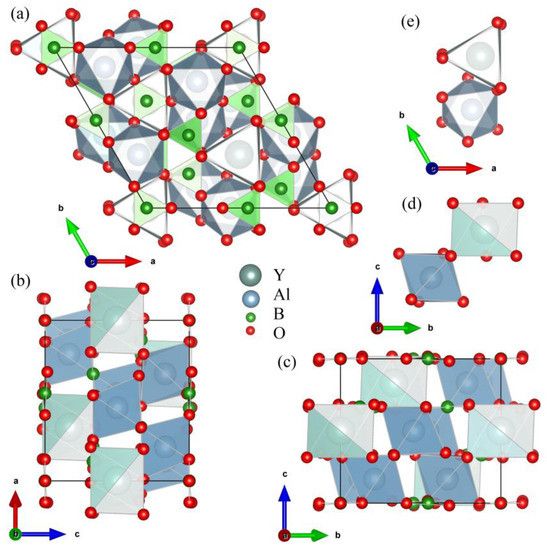
Figure 1.
Projections of the YAl3(BO3)4 unit cell along the c axis (a), the b axis (b), and the a axis (c). Projections of the YO6 trigonal prism and AlO6 distorted octahedron in the YAl3(BO3)4 unit cell, along a axis (d) and the c axis (e).
We note that the Mn4+ ion has the same valence electron shell as the Cr3+ ion (d3) and is also used for luminescent thermometry [19]. Compounds with Mn3+(d4) exhibit broadband, extremely temperature-sensitive luminescence in the near-IR and visible spectral ranges [20,21], due to which compounds with Mn3+ are also topical materials for thermoluminescent sensors. Cryogenic luminescence ratiometric thermometry based on the diverse thermal quenching behaviors of Mn3+ and Mn4+ in manganese-doped garnet-type Ca3Ga2Ge3O12 single crystals was explored [22]. Tb3+ and Mn3+ co-doped La2Zr2O7 nanoparticles were recently suggested as a promising material for dual-activator ratiometric optical thermometry [23]. Mn2+(d5)-containing phosphors exhibit bright broadband luminescence with a maximum from the red to green region of the spectrum, depending on the particular matrix [24,25,26]. In light of all of the above, it is of interest to study the luminescent properties of YAB doped with manganese.
We are aware of only one work on YAB:Mn spectroscopy ([27]). Only the room-temperature spectra were measured in Ref. [27]. Three lines characteristic of 2E → 4A2 emission of ions with a d3 electronic configuration were detected in the YAB:Mn room-temperature luminescence spectra [27]. The authors assigned these lines to Mn4+(d3). The results of electron paramagnetic resonance (EPR) showed that Mn introduced into YAB at low concentrations predominantly occupied the yttrium-ion sites in the crystal structure, its valence in this case being 2+ [28]. Two broad bands peaked at 544 and 637 nm were observed in the room-temperature luminescence spectrum of YAB:Mn and assigned to the transition from the 4T1 state of the Mn2+ ion, split by a low-symmetry component of the crystal field, to the ground state 6A1 [27]. Since the Mn2+ and Mn4+ ions presumably replace the trivalent Y3+ and Al3+ cations, respectively, the question of charge-compensation arises. The formation of charge-compensating Mn2+–Mn4+ dimers was suggested in [27]. In this work, we continue the study of the valence states of manganese in YAB:Mn using XANES spectroscopy and high-resolution broadband temperature-dependent optical spectroscopy, and obtain extensive data on the luminescence of Mn impurity centers of various valences in YAl3(BO3)4.
2. Materials and Methods
YAl3(BO3)4:Mn crystals were obtained by the flux method of crystal growth in the laboratory of L.N. Bezmaternykh at the Kirensky Institute of Physics of the Siberian Branch of the Russian Academy of Sciences in Krasnoyarsk. They were grown on seeds in platinum crucibles with a volume of 50 mL. The composition of the system during the flux crystal growth was 85 wt.% (Bi2Mo3O12 + 2B2O3 + 0.5Li2MoO4) + 15 wt.% YAl3(BO3)4 with the addition of Mn2O3. The temperature regime consisted of heating the solution-melt to 1100 °C and then slowly cooling at a rate of 0.5 °C/h for 48 h. Note that manganese oxide Mn2O3 decomposes in air at temperatures above 800 °C to form Mn3O4 (Mn2+Mn3+2O4) [29]. High-purity reagents were used in flux crystal growth. Cr (0.001%) and Pb (0.0005%) impurities in Al2O3 as well as Nd2O3 and Sm2O3 (<0.0001%) in Y2O3 have been reported on certificates and are of interest for further discussion.
Powder X-ray diffraction on the grown crystals at room temperature was performed on a Thermo Fisher Scientific ARL X’tra diffractometer (Basel, Switzerland) equipped with a Dectris MYTHEN2 R 1D detector (Cu Kα1,2 radiation). The operational voltage and current were 40 kV and 40 mA, respectively. Powder diffraction patterns were obtained in continuous mode at a rate of 2°/min in Bragg–Brentano geometry over an angle range of 10° ≤ 2θ ≤ 90°. The unit cell parameters of YAl3(BO3)4:Mn were refined by the Le Bail method using the JANA2006 program [30]. All parameters were refined by the least-squares method. The pseudo-Voigt function was used as the peak profile function. The structural data for YAl3(BO3)4 (sp. gr. R32, a = 9.295(3) Å, c = 7.243(2) Å, α = β = 90°, γ = 120°) were used as the initial structural parameters [31].
X-ray fluorescence analysis was carried out on a Bruker M4 Tornado analyzer. Absorption and luminescence spectra in the near-IR and visible ranges (5000–16,000 cm−1) with a spectral resolution up to 0.2 cm−1 were recorded on a spectrometer Bruker IFS 125HR (Bruker Optik GmbH, Ettlingen, Germany). Luminescence spectra in the visible and UV ranges (9000–20,500 cm−1) with a spectral resolution up to 3 cm−1 were registered using a OceanInside HDX spectrometer. The sample was cooled down to 5 K using a Cryomech ST403 closed-cycle helium cryostat (Syracuse, NY, USA). X-ray absorption spectra near the manganese K-edge were measured at the “Structural Materials Science” beamline at the Kurchatov Synchrotron Radiation Source [32] by X-ray fluorescence yield. Luminescence excitation spectra were recorded at a liquid nitrogen temperature (77 K) on a Fluorolog®-3 spectrofluorometer at the Institute of Photonic Technologies of the Federal Research Center “Crystallography and Photonics” of the Russian Academy of Sciences.
3. Results and Discussion
3.1. X-ray Diffraction (XRD) Analysis
XRD was used for the fingerprint characterization and investigation of the structural phases in the crystalline state. XRD patterns were analyzed by the Le Bail method in order to extract the parameters of the unit cell. The refined unit cell parameters were a = 9.274(7) Å, c = 7.223(3) Å, α = β = 90°, and γ = 120°. The convergence of the Le Bail approximation is shown in Figure 2. It can be seen that the diffraction pattern is well described, as indicated by the low R-factor values and small difference between the calculated and experimental diffraction patterns. The figure shows additional reflections of the Al2O3 phase. Their presence is explained by the fact that a corundum mortar was used in the preparation of the powder samples.
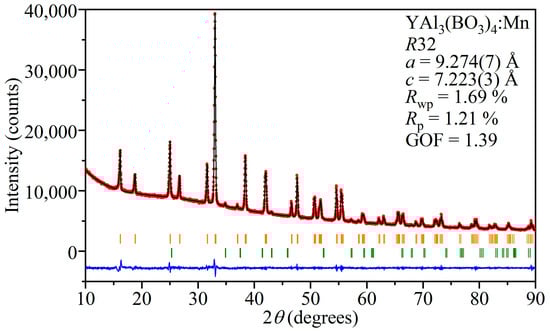
Figure 2.
Final convergence of the Le Bail refinement for YAl3(BO3)4:Mn. The experimental diffraction pattern is shown by red circles (Iobs); the black line (Icalc) is the calculated diffraction pattern and the residual intensities (Iobs-Icalc) are shown as the blue line. The orange bars indicate the YAl3(BO3)4 reflections, and the green bars indicate the Al2O3 reflections.
3.2. X-ray Fluorescence Analysis
The concentration of manganese ions was determined by X-ray fluorescence analysis to be 0.87 at.%. In addition, the presence of 1.18 at.% Bi was found, which is explained by its presence in the composition of the solvent. Insignificant amounts of potassium, calcium, titanium, and iron impurities were also found (see Table 1).

Table 1.
Composition of YAB:Mn determined by X-ray fluorescence analysis. AN—atomic number.
3.3. X-ray Absorption Spectroscopy
To address Mn ion oxidation state and position in the crystal structure, the fine structure of the X-ray absorption spectrum at the K-edge of manganese was measured. The EXAFS (Extended X-ray Absorption Fine Structure) spectrum was processed and analyzed using the software package IFEFFIT, version 1.2.11c [33,34]. The measured XAFS data were first processed by the ATHENA program of this package to merge four independently measured spectra, normalize the spectrum to a unity-height jump, and obtain the oscillating part of the spectrum. The fine structure of the X-ray absorption spectrum obtained in this manner after the K-jump was then used for the structural analysis (Figure 3). The local structure of manganese ions in the crystal was analyzed by fitting the EXAFS spectra at the K-edge of Mn to the model of the local structure based on the crystal structure of YAB [31]. Two distinct models were used for the fitting. The first model includes a manganese atom in the yttrium position. The second model takes into account the partial occupation of aluminum positions by manganese atoms. Since the positions of yttrium and aluminum differ significantly in metal–oxygen distances in the first coordination sphere—2.3 and 2.0 Å, respectively—this was taken into account by introducing an additional Mn-O scattering path of shorter length. To estimate the occupancy of the aluminum position, the coordination numbers for the two nearest oxygen coordination spheres were chosen so that their sum was fixed equal to six (Table 2). The distance for this shorter path was set to 2.052 Å to obtain a stable fit. Other parameters determined by fitting the EXAFS spectra are the distances between the absorbing and neighboring atoms Rj and the Debye–Waller factors σj2 common to atoms of the same type. The errors for the Debye–Waller factors are quite large, since we can only use the spectrum up to k = 10 Å−1 due to the relatively high noise levels at large k. This leads to a significant correlation of the Debye–Waller factors with the overall amplitude of the EXAFS oscillations and to high uncertainty values. The refinement also included the Fermi energy shift ΔE0 and the attenuation coefficient of the signal amplitude S02. The fitting ranges in k space and in R space were 2–10 Å−1 and 1–4 Å, respectively. The quality of the fit is characterized by the factor Rf, which indicates the percentage mismatch between the data and the model.
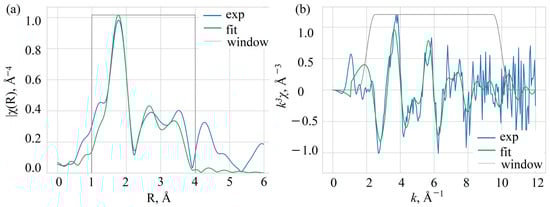
Figure 3.
Fourier transform (a) and the oscillating part (b) of the EXAFS spectrum of Mn in YAB:Mn.
Table 2.
Parameters of the nearest environment of Mn obtained from EXAFS data.
Table 2 shows that the two models do not differ in Rf, i.e., manganese in aluminum positions does not contribute much to the EXAFS signal. Thus, one can conclude that the occupation of aluminum sites by manganese atoms is rather small. To estimate this occupation, the coordination numbers for the split coordination sphere of oxygen can be used. For a shorter distance, it was determined to be 0.7, so occupancy can be estimated as no more than 10%. It should be noted that this estimate shows the sensitivity of the EXAFS method for this quantity, since the error bars are also of the same order. The distances determined by the EXAFS fit correspond to the local structure of the yttrium site. The distance to oxygen in the first coordination sphere was determined to be 2.26 ± 0.03 Å, which is slightly smaller than the Y-O distance in the YAB structure (2.313 Å) [31].
The XANES part of the spectrum also provides valuable information. The position of the K-edge can be used to obtain the oxidation state of Mn [35]. Comparing the spectrum with manganese references Mn(BO2)2, Mn2O3, and MnO2 with the oxidation states Mn2+, Mn3+, and Mn4+, respectively, measured on the same beamline, we can see that the edge position coincides with the Mn2+ reference (Figure 4a), which means that most manganese atoms are in the Mn2+ state. We cannot decompose the spectrum into a linear combination of references, since they are irrelevant to the local structure of the YAB specimen; the admixture of manganese in higher oxidation states can be roughly estimated as 10%. In addition, we calculated the XANES spectrum using the FDMNES code [36] with two structural models, corresponding to the manganese atom at the Y and Al sites in the YAB crystal structure, respectively (Figure 4b). The experimental data are reproduced only for Mn at the Y position, which confirms the conclusions of the EXAFS data analysis and is consistent with the EPR data [28]. From this point of view, a smaller Y-O distance than in YAB can be explained by a smaller ionic radius of Mn2+ (0.83 Å) as compared to Y3+ (0.90 Å) [37].
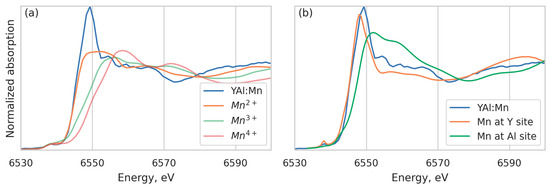
Figure 4.
K-edge absorption spectra of Mn in YAB:Mn compared with the “reference” Mn2+, Mn3+, and Mn4+ spectra (a); calculated XANES spectra for Mn at the Y3+ and Al3+ sites in YAB crystal structure compared with experimental spectrum (b).
3.4. Optical Spectroscopy
Figure 5 shows the photoluminescence (PL) spectrum of YAB:Mn in a broad spectral range. The near-IR luminescence was recorded with the Bruker 125 HR Fourier spectrometer, while for the visible part of the PL spectrum an OceanInside HDX spectrometer was used. Relative intensities of these two parts cannot be compared.
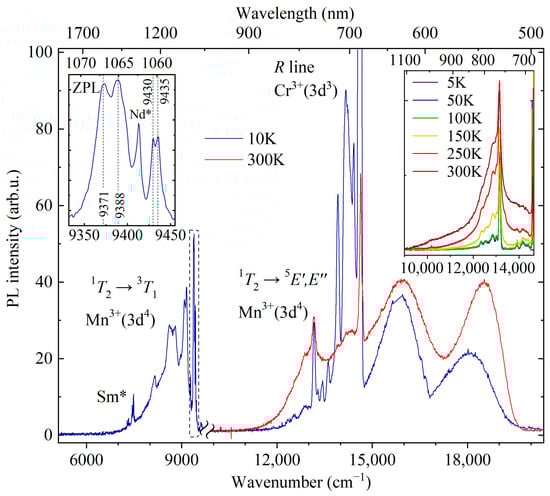
Figure 5.
PL spectrum of YAB:Mn in a broad spectral range. The break separates the parts of the spectrum recorded on the Bruker IFS HR125 spectrometer (5100–9900 cm−1 at 10 K, λex = 450 nm) and on the OceanInside HDX spectrometer (9900–20,500 cm−1 at 10 and 300 K, λex = 488 nm). The left inset shows the region of zero-phonon lines in an enlarged scale. The right inset presents the region around the line 13,160 cm−1 at different temperatures (5–300 K, Bruker IFS HR125 spectrometer). The lines due to uncontrolled Sm3+ and Nd3+ impurities are marked as Sm* and Nd*, respectively.
A strong relatively narrow peak at about 685 nm is observed in the room-temperature low-resolution PL spectrum. Previously, three narrow peaks with maxima at 682, 684, and 686 nm were reported in the room-temperature luminescence spectrum of YAB:Mn, and two of them were attributed to the R1 and R2 lines of Mn4+ [27]. The Mn4+ ion has the same valence electron shell structure as Cr3+(d3). Narrow R lines in the spectra of d3 ions arise due to spin-forbidden transitions from the excited orbital doublet 2E to the ground orbital singlet 4A2. In a low-symmetry crystal field, the 2E level, which is doubly degenerate in the cubic crystal field approximation, splits into two components, so that the R1 and R2 lines can be observed. We were able to observe peaks at the same wavelengths as in [27], both in the luminescence and absorption room-temperature spectra. However, a more detailed study of the temperature-dependent absorption, PL, and PL excitation spectra led us to the conclusion that those are R lines of uncontrolled Cr3+ impurity. Figure 6, Figure 7 and Figure 8 display these spectra.
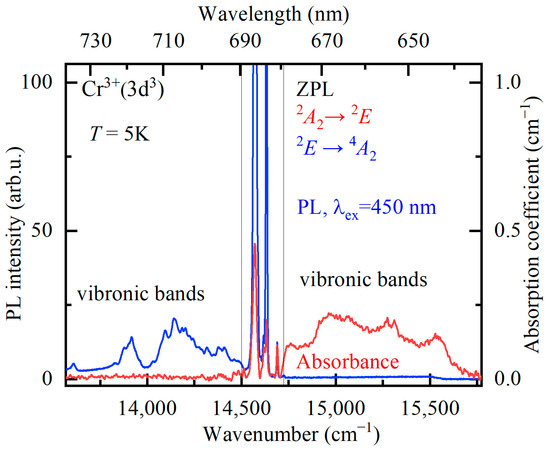
Figure 6.
Absorption (red curve) and luminescence (blue curve, excitation wavelength λex = 450 nm) spectra of YAB:Mn at the temperature T = 5 K in the region (indicated by gray thin vertical lines) of zero-phonon R lines and the region of associated vibronic bands.
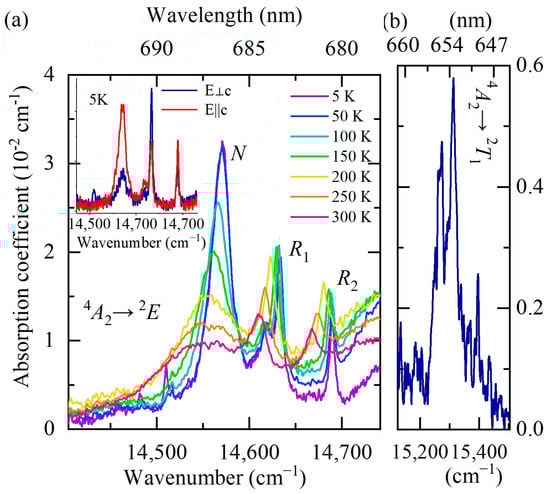
Figure 7.
Unpolarized absorption spectra of YAB:Mn at different temperatures in the spectral range of zero-phonon R lines. The inset shows the spectra at T = 5 K for two polarization directions of the incident light: E||c (red trace) and E⊥c (blue trace) (a). Absorption spectrum at T = 5 K in the region of the 4A2 → 2T1 transition (b).
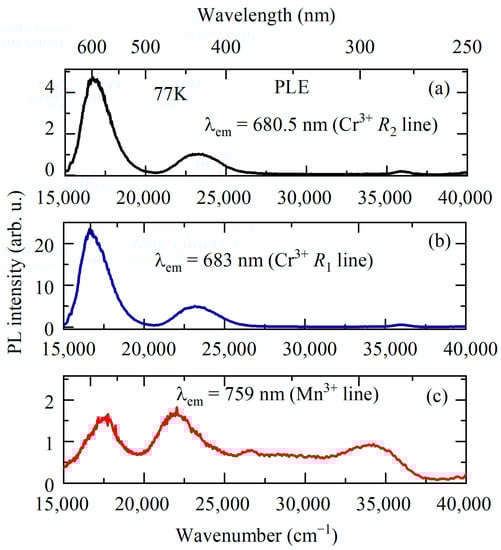
Figure 8.
PL excitation spectra for YAB:Mn at T = 77 K monitored at 680.5 (a), 683 (b), and 759 (c) nm.
Figure 6 shows the absorption and luminescence spectra of YAB:Mn at low temperature (T = 5 K) in the region of the R lines. The spectra have the form of narrow zero-phonon lines (ZPLs) and broad adjacent bands of electron–phonon (vibronic) transitions. Figure 7a demonstrates the evolution of the R absorption lines with temperature. The wavelengths of the R1 and R2 lines at room temperature—684 nm and 682 nm, respectively—coincide with those reported for YAB:Cr3+ [38,39]. Figure 7b shows very weak lines of a spin-forbidden transition from the ground state 4A2 to the next excited (after the 2E doublet) level 2T1 in the absorption spectrum of YAB:Mn at 5 K. The excitation spectra of the R lines are presented in Figure 8. All these experimental data allowed us to determine the energies of the 2E, 2T1, 4T2, and 4T1 levels; they are provided in Table 3. The values in Table 3, within the precision of measurements, coincide with those reported for Cr3+ in YAB [38,39,40]. It is a well-known empirical fact that the strength of the crystal field as well as covalency increases with increased ionic charge [41]. For example, Mn4+ in corundum Al2O3 demonstrates blue shifts of 364, 413, and 2300 cm−1 for the R1, R2, and A1–4T2 transitions, respectively, as compared to Cr3+ in Al2O3 (ruby) [41,42]. Both ions substitute for Al3+. We tried to find the R lines of Mn4+ in the spectra of YAB:Mn but failed. It is worth noting that Mn4+ in Al2O3 was introduced together with charge-compensating Mg2+.
Table 3.
Energy values (cm−1) of the 2E, 2T1 (at 5 K), 4T2, and 4T1 (at 77 K) levels of uncontrolled Cr3+ in YAB:Mn determined from the absorption and excitation spectra.
A broad line at the low-frequency side of the R1 and R2 lines of the uncontrolled Cr3+ impurity (denoted “N” in Figure 7a) noticeably narrows with decreasing temperature and, at low temperatures (T < 100 K), it exceeds in amplitude the R1 and R2 lines. At the temperature T = 5 K, its frequency is 14,571 cm −1. The N line apparently refers to a transition in exchange-coupled Cr3+-containing pairs. A very similar pattern was observed, for example, in the luminescence spectra of isostructural GdAl3(BO3)4 crystals doped with 1% Cr3+ (GAB:Cr3+) [17]. The authors attribute the corresponding transition to the emission from the 2E state of the Cr3+-Cr3+ pairs. In our case, the formation of Cr-Mn pairs could also be possible.
The inset of Figure 7a shows the absorption spectra at the lowest measured temperature (T = 5 K) for two directions of incident light polarization, E||c and E⊥c. The ratio of the amplitudes of the R1 and R2 lines is in agreement with the corresponding ratio for YAB:Cr3+ [38] (namely, I(R1)/I(R2) = 1 for E||c, I(R1)/I(R2) = 2 for E⊥c), which once again confirms the origin of the observed R lines as stemming from the uncontrolled Cr3+ impurity. It is also worth noting that we found the same R lines of approximately the same intensity in “pure” YAB crystals grown from the same chemicals in the same laboratory as the YAB:Mn crystals under study. The rest of the spectrum observed for YAB:Mn is absent in YAB, so it is obviously associated with manganese.
EPR measurements revealed Mn2+ ions occupying yttrium-ion sites in YAB:Mn [28]. Although Mn3+ was introduced into the melt solution in the form of Mn2O3, it must be kept in mind that Mn2O3 decomposes in air at T > 800 °C, losing part of the oxygen—6(Mn3+)2O3 = 4Mn2+(Mn3+)2O4 + O2—so that Mn2+ ions appear. The charge-compensation can be realized by uncontrolled impurities such as Ti4+ (see Table 1). Optical spectra of Mn2+ in oxide crystals consist, as a rule, of a single broad band corresponding to the 4T1 → 6A1 transition, which for Mn2+ in the Y3+ position is in the green region of the spectrum [43]. We attribute a broad band peaking at 531 nm (T = 10 K, see Figure 5) to the 4T1 → 6A1 transition of Mn2+ in YAB:Mn.
Mn3+ was not found in the EPR studies of YAB:Mn [28]. Note, however, that Mn3+ is a non-Kramers ion and can be studied in some cases only by a special high-frequency EPR technique. Such studies on SrTiO3:Mn have shown that Mn3+ substitutes for the octahedrally coordinated Ti4+ and forms three distinct types of Jahn–Teller centers that differ by charge-compensation mode [44]. The Mn3+ ion in octahedral coordination replacing Al3+ was found in Al2O3 (corundum) [45] and Y3Al5O12 (YAG) [20,21]. Below, we discuss the features observed in our spectra of the YAl3(BO3)4:Mn crystal, which we attribute to the transitions in the octahedrally coordinated Mn3+ at the Al3+ site.
Low-temperature luminescence of YAB:Mn in the IR range (9500–6500 cm −1 or 1055–1500 nm, see Figure 5) consists of relatively narrow (<10 cm−1) ZPLs at 9371, 9388, 9430, and 9435 cm−1 and an adjacent vibronic band. In addition, narrow lines of uncontrolled impurities of Nd and Sm ions known from the YAB:Nd [3] and YAB:Sm [46] spectra are observed in the spectrum. A similar spectral pattern with narrow ZPLs with frequencies of about 9400 cm−1 and a phonon sideband was observed in a number of Mn3+-doped garnets and was associated by the authors with 1T2 → 3T1 transitions between excited triplets [20,21,22]. According to the Tanabe–Sugano diagrams [47], levels 1T2 and 3T1 have the same dependence on the crystal field, so the energy position of the corresponding transition band is practically independent of the strength of the crystal field. The multiple ZPLs observed in this region of the spectrum are most likely due to both the spin-orbit splitting of the 3T1 level and the orbital splitting of excited triplets caused by the low-symmetry component of the crystal field.
One more relatively narrow (~80 cm−1) line associated with manganese is observed in the red part of the low-temperature spectrum at 13,160 cm−1 (759 nm) (see Figure 5). It is accompanied by a Stokes vibronic sideband which grows in intensity with rising temperature; simultaneously, an anti-Stokes part appears (see, e.g., [48]). We tentatively assign this line to a transition from the excited orbital triplet 1T2 to the ground Jahn–Teller-split doublet 5E′, 5E″ in Mn3+ [23]. A similar transition (though not as rich in structure) with a peak at 13,700 cm−1 was observed in the low-temperature emission spectrum of Y3Al5O12 (YAG) doped with Mn3+ [20]. The excitation spectrum of the PL line 759 nm is presented in Figure 8c. It shows four bands peaking at 17,450, 22,000, 26,750, and 34,326 cm−1. Bands at 17,450 and 22,000 cm−1 can be related to the spin-allowed transition from the 5E ground state to the excited 5T2 triplet of Mn3+, split by the low-symmetry crystal field, whereas the bands at 26,750 and 34,326 cm−1 are apparently associated with the Mn3+ transitions to the higher-lying states (3E, 3T1) [23].
The strongest PL band of Mn3+-doped crystals has the maximum in the region of wavelengths 620–670 nm [20,21,22,23] and is associated with the spin-allowed transition 5T2 → 5E. We assign a broad strong emission band peaked at 15,853 cm−1 (631 nm) to the 5T2 → 5E transition of Mn3+. Taking into account positions of the corresponding PLE bands, we find the mean value of 17,725 cm−1 as the energy of the 5T2 state.
Based on the experimental values 17,725 cm−1 (5T2) and 13,160 cm−1 (1T2), as well as the Tanabe–Sugano diagram for the d4 configuration [47], we estimate the crystal-field parameter Dq and Racah parameter B for Mn3+ in YAB:Mn as Dq = 1785 cm−1 and B = 800 cm−1. The energy difference of ~9400 cm−1 between the 1T2 and 3T1 triplets, found from the IR spectra of the 1T2 → 3T1 transition, agrees with these estimates in the framework of the Tanabe–Sugano diagram, which provides additional verification. The value Dq/B = 2.23 is very close to Dq/B = 2.25 found for Mn3+ in garnet-type Ca3Ga2Ge3O12 single crystals [22].
4. Conclusions
Using XANES and high-resolution optical spectroscopy, the valence composition of Mn ions in YAB:Mn was determined. According to the EXAFS data, manganese is contained in the crystal mainly in the divalent state Mn2+(d5), and substitutes for Y3+. This conclusion is in agreement with the EPR results [28]. Luminescence of the Mn2+ ions at the 4T1 → 6A1 transition (near 630 nm) was detected. For charge-compensation reasons, it would be natural to assume that Mn4+ is present in a neighborhood of Mn2+ [27,49]. It was previously shown for a number of aluminates that Mn4+ replaces octahedrally coordinated Al3+ [41,49], which is consistent with the proximity of their ionic radii (0.535 Å for Al3+ and 0.53 Å for Mn4+ [37]). We show that the R lines characteristic of the d3 configuration (Mn4+, Cr3+), observed both in the absorption spectra (4A1 → 2E) and in the luminescence spectra (2E → 4A1) of YAB:Mn, arise not from Mn4+ but from the uncontrolled Cr3+ impurity. We failed to find the spectra of Mn4+.
During crystal growth, Mn3+ was introduced in the form of Mn2O3, so the presence of the Mn3+ ions could be anticipated. In the IR range of the luminescence spectra of YAB:Mn at low temperatures, the spin-forbidden transitions 1T2 → 3T1 and 1T2 → 5E′, 5E″ of Mn3+(d4) were observed. A broad emission band in the orange spectral range (near 630 nm) is associated with the spin-allowed 5T2 → 5E transition of Mn3+. Using the experimental spectroscopic data and the Tanabe–Sugano diagram for the d4 configuration, we estimated the crystal-field parameter Dq and Racah parameter B for Mn3+ in YAB:Mn.
Further studies are needed to evaluate the application potential of YAB singly doped with manganese or co-doped with chromium. Our work can serve as a basis for these studies.
Author Contributions
Conceptualization, A.M. and M.P.; formal analysis, A.M., N.K., A.V. and E.K.; funding acquisition, A.M. and M.P.; investigation, A.M., K.B., A.V., K.K., E.K., O.K. and E.M.; methodology, K.B. and M.P.; resources, I.G.; validation, A.M., K.B., N.K., E.M., K.K., E.K., A.V. and O.K.; writing—original draft preparation, A.M.; writing—review and editing, M.P.; visualization, A.M. All authors have read and agreed to the published version of the manuscript.
Funding
This work was supported in part by the Russian Science Foundation under Grant No. 21-72-00134. K.B. and M.P. acknowledge financial support from the Ministry of Science and Higher Education of Russia under Grant 0039-2019-0004.
Institutional Review Board Statement
Not applicable.
Informed Consent Statement
Not applicable.
Data Availability Statement
Data can be obtained from the corresponding author upon reasonable request.
Acknowledgments
The authors thank A.A. Aleksandrovsky for important discussions.
Conflicts of Interest
The authors declare no conflict of interest.
References
- Leonyuk, N.I.; Leonyuk, L.I. Growth and Characterization of RM3(BO3)4 Crystals. Prog. Cryst. Growth Charact. Mater. 1995, 31, 179–278. [Google Scholar] [CrossRef]
- Cavalli, E.; Leonyuk, N. Comparative Investigation on the Emission Properties of RAl3(BO3)4 (R = Pr, Eu, Tb, Dy, Tm, Yb) Crystals with the Huntite Structure. Crystals 2019, 9, 44. [Google Scholar] [CrossRef]
- Moura, A.L.; Carreño, S.J.M.; Pincheira, P.I.R.; Fabris, Z.V.; Maia, L.J.Q.; Gomes, A.S.L.; de Araújo, C.B. Tunable Ultraviolet and Blue Light Generation from Nd:YAB Random Laser Bolstered by Second-Order Nonlinear Processes. Sci. Rep. 2016, 6, 27107. [Google Scholar] [CrossRef] [PubMed]
- Elzbieciak-Piecka, K.; Marciniak, L. Optical Heating and Luminescence Thermometry Combined in a Cr3+-Doped YAl3(BO3)4. Sci. Rep. 2022, 12, 16364. [Google Scholar] [CrossRef] [PubMed]
- Shi, M.; Yao, L.; Xu, J.; Liang, C.; Dong, Y.; Shao, Q. Far-red-emitting YAl3(BO3)4:Cr3+ Phosphors with Excellent Thermal Stability and High Luminescent Yield for Plant Growth LEDs. J. Am. Ceram. Soc. 2021, 104, 3279–3288. [Google Scholar] [CrossRef]
- Reddy, G.V.L.; Moorthy, L.R.; Chengaiah, T.; Jamalaiah, B.C. Multi-Color Emission Tunability and Energy Transfer Studies of YAl3(BO3)4:Eu3+/Tb3+ Phosphors. Ceram. Int. 2014, 40, 3399–3410. [Google Scholar] [CrossRef]
- Bajaj, N.S.; Koparkar, K.A.; Nagpure, P.A.; Omanwar, S.K. Red and Blue Emitting Borate Phosphor Excited by near Ultraviolet Light. J. Opt. 2017, 46, 91–94. [Google Scholar] [CrossRef]
- Jaque, D. Self-Frequency-Sum Mixing in Nd Doped Nonlinear Crystals for Laser Generation in the Three Fundamental Colours. J. Alloys Compd. 2001, 323–324, 204–209. [Google Scholar] [CrossRef]
- Jamalaiah, B.C.; Jayasimhadri, M.; Reddy, G.V.L. Blue Emitting YAl3(BO3)4:Tm3+ Single-Phase Phosphors under UV Excitation. Phys. Chem. Glas. Eur. J. Glass Sci. Technol. Part B 2016, 57, 68–70. [Google Scholar] [CrossRef]
- Tolstik, N.A.; Kisel, V.E.; Kuleshov, N.V.; Maltsev, V.V.; Leonyuk, N.I. Er,Yb:YAl3(BO3)4—Efficient 1.5 µm Laser Crystal. Appl. Phys. B 2009, 97, 357–362. [Google Scholar] [CrossRef]
- Dekker, P.; Dawes, J.M.; Piper, J.A.; Liu, Y.; Wang, J. 1.1 W CW Self-Frequency-Doubled Diode-Pumped Yb:YAl3(BO3)4 Laser. Opt. Commun. 2001, 195, 431–436. [Google Scholar] [CrossRef]
- Burns, P.A.; Dawes, J.M.; Dekker, P.; Piper, J.A.; Li, J.; Wang, J. Coupled-Cavity, Single-Frequency, Tunable CW Yb:YAB Yellow Microchip Laser. Opt. Commun. 2002, 207, 315–320. [Google Scholar] [CrossRef]
- Bartschke, J.; Knappe, R.; Boller, K.-J.; Wallenstein, R. Investigation of Efficient Self-Frequency-Doubling Nd:YAB Lasers. IEEE J. Quantum Electron. 1997, 33, 2295–2300. [Google Scholar] [CrossRef]
- Jiang, H.; Li, J.; Wang, J.; Hu, X.-B.; Liu, H.; Teng, B.; Zhang, C.-Q.; Dekker, P.; Wang, P. Growth of Yb:YAl3(BO3)4 Crystals and Their Optical and Self-Frequency-Doubling Properties. J. Cryst. Growth 2001, 233, 248–252. [Google Scholar] [CrossRef]
- Yu, D.; Li, H.; Zhang, D.; Zhang, Q.; Meijerink, A.; Suta, M. One Ion to Catch Them All: Targeted High-Precision Boltzmann Thermometry over a Wide Temperature Range with Gd3+. Light Sci. Appl. 2021, 10, 236. [Google Scholar] [CrossRef]
- Dominiak-Dzik, G.; Ryba-Romanowski, W.; Lisiecki, R.; Főldvári, I.; Beregi, E. YAl3(BO3)4:Yb&Tm a Nonlinear Crystal: Up- and Down-Conversion Phenomena and Excited State Relaxations. Opt. Mater. 2009, 31, 989–994. [Google Scholar] [CrossRef]
- Malysa, B.; Meijerink, A.; Jüstel, T. Temperature Dependent Luminescence Cr3+-Doped GdAl3(BO3)4 and YAl3(BO3)4. J. Lumin. 2016, 171, 246–253. [Google Scholar] [CrossRef]
- Du, J.; De Clercq, O.Q.; Korthout, K.; Poelman, D. LaAlO3:Mn4+ as Near-Infrared Emitting Persistent Luminescence Phosphor for Medical Imaging: A Charge Compensation Study. Materials 2017, 10, 1422. [Google Scholar] [CrossRef]
- Glais, E.; Đorđević, V.; Papan, J.; Viana, B.; Dramićanin, M.D. MgTiO3:Mn4+ a Multi-Reading Temperature Nanoprobe. RSC Adv. 2018, 8, 18341–18346. [Google Scholar] [CrossRef]
- Kück, S.; Hartung, S.; Hurling, S.; Petermann, K.; Huber, G. Emission of Octahedrally Coordinated Mn3+ in Garnets. Spectrochim. Acta. A. Mol. Biomol. Spectrosc. 1998, 54, 1741–1749. [Google Scholar] [CrossRef]
- Kück, S.; Hartung, S.; Hurling, S.; Petermann, K.; Huber, G. Optical Transitions in Mn3+-Doped Garnets. Phys. Rev. B 1998, 57, 2203–2216. [Google Scholar] [CrossRef]
- Wang, Y.; Włodarczyk, D.; Brik, M.G.; Barzowska, J.; Shekhovtsov, A.N.; Belikov, K.N.; Paszkowicz, W.; Li, L.; Zhou, X.; Suchocki, A. Effect of Temperature and High Pressure on Luminescence Properties of Mn3+ Ions in Ca3Ga2Ge3O12 Single Crystals. J. Phys. Chem. C 2021, 125, 5146–5157. [Google Scholar] [CrossRef]
- Jahanbazi, F.; Wang, X.; Mao, Y. Tb3+, Mn3+ Co-Doped La2Zr2O7 Nanoparticles for Self-Referencing Optical Thermometry. J. Lumin. 2021, 240, 118412. [Google Scholar] [CrossRef]
- Stevels, A.L.N. Red Mn2+-Luminescence in Hexagonal Aluminates. J. Lumin. 1979, 20, 99–109. [Google Scholar] [CrossRef]
- Costa, G.K.B.; Pedro, S.S.; Carvalho, I.C.S.; Sosman, L.P. Preparation, Structure Analysis and Photoluminescence Properties of MgGa2O4:Mn2+. Opt. Mater. 2009, 31, 1620–1627. [Google Scholar] [CrossRef]
- Majher, J.D.; Gray, M.B.; Strom, T.A.; Woodward, P.M. Cs2NaBiCl6:Mn2+—A New Orange-Red Halide Double Perovskite Phosphor. Chem. Mater. 2019, 31, 1738–1744. [Google Scholar] [CrossRef]
- Aleksandrovsky, A.S.; Gudim, I.A.; Krylov, A.S.; Temerov, V.L. Luminescence of Yttrium Aluminum Borate Single Crystals Doped with Manganese. Phys. Solid State 2007, 49, 1695–1699. [Google Scholar] [CrossRef]
- Vorotynov, A.M.; Petrakovskiĭ, G.A.; Shiyan, Y.G.; Bezmaternykh, L.N.; Temerov, V.E.; Bovina, A.F.; Aleshkevych, P. Electron Paramagnetic Resonance of Mn2+ Ions in Single Crystals of Yttrium Aluminum Borate YAl3(BO3)4. Phys. Solid State 2007, 49, 463–466. [Google Scholar] [CrossRef]
- Terayama, K.; Ikeda, M. Study on Thermal Decomposition of MnO2 and Mn2O3 by Thermal Analysis. Trans. JIM 1983, 24, 754–758. [Google Scholar] [CrossRef]
- Petříček, V.; Dušek, M.; Palatinus, L. Crystallographic Computing System JANA2006: General Features. Z. Für Krist. Cryst. Mater. 2014, 229, 345–352. [Google Scholar] [CrossRef]
- Belokoneva, E.L.; Timchenko, T.I. Polytypic relationships in borate structures with the general formula RAl3(BO3)4, (R = Y, Nd, Gd). Kristallografiya 1983, 28, 1118–1123. [Google Scholar]
- Chernyshov, A.A.; Veligzhanin, A.A.; Zubavichus, Y.V. Structural Materials Science End-Station at the Kurchatov Synchrotron Radiation Source: Recent Instrumentation Upgrades and Experimental Results. Nucl. Instrum. Methods Phys. Res. Sect. Accel. Spectrometers Detect. Assoc. Equip. 2009, 603, 95–98. [Google Scholar] [CrossRef]
- Newville, M. IFEFFIT: Interactive XAFS Analysis and FEFF Fitting. J. Synchrotron Radiat. 2001, 8, 322–324. [Google Scholar] [CrossRef] [PubMed]
- Ravel, B.; Newville, M. ATHENA, ARTEMIS, HEPHAESTUS: Data Analysis for X-Ray Absorption Spectroscopy Using IFEFFIT. J. Synchrotron Radiat. 2005, 12, 537–541. [Google Scholar] [CrossRef] [PubMed]
- Manceau, A.; Marcus, M.A.; Grangeon, S. Determination of Mn Valence States in Mixed-Valent Manganates by XANES Spectroscopy. Am. Mineral. 2012, 97, 816–827. [Google Scholar] [CrossRef]
- Bunău, O.; Joly, Y. Self-Consistent Aspects of x-Ray Absorption Calculations. J. Phys. Condens. Matter 2009, 21, 345501. [Google Scholar] [CrossRef]
- Shannon, R.D. Revised Effective Ionic Radii and Systematic Studies of Interatomic Distances in Halides and Chalcogenides. Acta Crystallogr. Sect. A 1976, 32, 751–767. [Google Scholar] [CrossRef]
- Wang, G.; Gallagher, H.G.; Han, T.P.J.; Henderson, B. Crystal Growth and Optical Characterisation of Cr3+-Doped YAl3(BO3)4. J. Cryst. Growth 1995, 153, 169–174. [Google Scholar] [CrossRef]
- Dominiak-Dzik, G.; Ryba-Romanowski, W.; Grinberg, M.; Beregi, E.; Kovacs, L. Excited-State Relaxation Dynamics of Cr3+ in YAl3(BO3)4. J. Phys. Condens. Matter 2002, 14, 5229–5237. [Google Scholar] [CrossRef]
- Wells, J.-P.R.; Yamaga, M.; Han, T.P.J.; Honda, M. Electron Paramagnetic Resonance and Optical Properties of Cr3+ Doped YAl3(BO3)4. J. Phys. Condens. Matter 2003, 15, 539–547. [Google Scholar] [CrossRef]
- Geschwind, S.; Kisliuk, P.; Klein, M.P.; Remeika, J.P.; Wood, D.L. Sharp-Line Fluorescence, Electron Paramagnetic Resonance, and Thermoluminescence of Mn4+ in α-Al2O3. Phys. Rev. 1962, 126, 1684–1686. [Google Scholar] [CrossRef]
- Tanabe, Y.; Sugano, S. The Absorption Spectra of Ruby. J. Phys. Soc. Jpn. 1957, 12, 556. [Google Scholar] [CrossRef]
- Noginov, M.A.; Loutts, G.B.; Warren, M. Spectroscopic Studies of Mn3+ and Mn2+ Ions in YAlO3. J. Opt. Soc. Am. B 1999, 16, 475. [Google Scholar] [CrossRef]
- Azamat, D.V.; Dejneka, A.; Lancok, J.; Trepakov, V.A.; Jastrabik, L.; Badalyan, A.G. Electron Paramagnetic Resonance Studies of Manganese Centers in SrTiO3: Non-Kramers Mn3+ Ions and Spin-Spin Coupled Mn4+ Dimers. J. Appl. Phys. 2012, 111, 104119. [Google Scholar] [CrossRef]
- McClure, D.S. Optical Spectra of Transition-Metal Ions in Corundum. J. Chem. Phys. 1962, 36, 2757–2779. [Google Scholar] [CrossRef]
- Kebaïli, I.; Dammak, M. Spectra Energy Levels and Symmetry Assignments of Sm3+ Doped in YAl3(BO3)4 Single Crystal. J. Lumin. 2012, 132, 2092–2097. [Google Scholar] [CrossRef]
- Tanabe, Y.; Sugano, S. On the Absorption Spectra of Complex Ions II. J. Phys. Soc. Jpn. 1954, 9, 766–779. [Google Scholar] [CrossRef]
- Adachi, S. Review—Temperature Dependence of Transition-Metal and Rare-Earth Ion Luminescence (Mn4+, Cr3+, Mn2+, Eu2+, Eu3+, Tb3+, Etc.) II: Experimental Data Analyses. ECS J. Solid State Sci. Technol. 2022, 11, 106002. [Google Scholar] [CrossRef]
- Noginov, M.A.; Loutts, G.B. Spectroscopic Studies of Mn4+ Ions in Yttrium Orthoaluminate. J. Opt. Soc. Am. B 1999, 16, 3. [Google Scholar] [CrossRef]
Disclaimer/Publisher’s Note: The statements, opinions and data contained in all publications are solely those of the individual author(s) and contributor(s) and not of MDPI and/or the editor(s). MDPI and/or the editor(s) disclaim responsibility for any injury to people or property resulting from any ideas, methods, instructions or products referred to in the content. |
© 2023 by the authors. Licensee MDPI, Basel, Switzerland. This article is an open access article distributed under the terms and conditions of the Creative Commons Attribution (CC BY) license (https://creativecommons.org/licenses/by/4.0/).