Abstract
An interlayer existed between the ballast layer and subgrade in the conventional railway substructure. Considering that the shear strength τ of the interlayer soil was influenced by the changes in the ballast grain content and water content, this aspect was explored in the present study. Monotonic triaxial tests were fulfilled, which considered five coarse grain contents fv and three water contents of fine soil wf. The results showed that the growth in fv contributed to an increment in τ of the soil mixture under both saturation and unsaturation. Conversely, in previous studies, the growth of fv induced an increment in τ under saturation, but a decline in that under unsaturation. This was explained by the competing influences of fv and suction ψ: in previous studies, increasing fv induced a decline in the dry density of the fine soil fraction ρd–f, which contributed to a decline in ψ. When the negative influence of declining ψ outweighed the positive influence of the incrementing fv, the τ of the soil mixture decreased. Meanwhile, modelling of the τ–ψ relationship in the soil mixture with varying fv was performed. This proposed model was examined using the test results from both the present and previous studies, which shows its reasonably good performance.
1. Introduction
Over the years of trains moving loads, interpenetration between the ballast layer and subgrade occurred, leading to the formation of an interlayer in the conventional railway track (Trinh [1]). This interlayer soil plays an important role for the railway track in (a) spreading the traffic loadings from the ballast layer to the subgrade to avoid failure because of excessive deformation, and (b) eliminating the effect of rainwater seepage in the subgrade (Trinh et al. [2]). Field observation shows a decline in ballast grain content with the incrementing depth of the interlayer. Due to the unstable water content in the field, the water content of the interlayer soil varied frequently. In this circumstance, the shear strength τ of the interlayer soil was significantly affected by the changes in the ballast grain content and water content, which was of great importance for the stability and safety of the railway track. To ensure the good performance of railway track, it appears important to study this aspect in depth.
Numerous studies have examined the influence of water content on τ of the soil mixture (Duong et al. [3]; Qi et al. [4,5]; Wan et al. [6]; Bian et al. [7]). In the saturated state, the pore water pressure was accumulated under the influence of train moving loads, resulting in a decline in τ. With declining water content, the shear strength τ increased owing to an increase in suction. The influence of coarse grain content on the shear strength τ of the mixture was explored in previous studies. Vallejo et al. [8] explored the τ of a fine/coarse soil mixture using two glass beads, with a size of 0.4 and 5 mm. They found that increasing the coarse grain content induced a transition in the soil structure from a fine-grain-supported structure to a coarse-grain-supported structure. Seif EI Dine et al. [9] carried out triaxial tests to explore the τ of a mixture with a gravel and sandy soil matrix. From these tests, an increment in the gravel content from 0% to 35% contributed to a small increment in the τ of the mixture. That is because in this range of gravel content, the τ of the soil mixture was mainly dominated by the sandy matrix. Wang et al. [10] explored the τ of a soil mixture with a wide range of coarse grain content fv (defined by the volumetric proportion of the coarse grains to the mixture), from 0% to 45%. They found a characteristic fv-cha value: τ incremented with the incrementing fv slightly when fv < fv-cha, but largely when fv > fv-cha. Correspondingly, two fabrics in the mixture were identified: a fine-grain-supported fabric when the fv < fv-cha and a coarse-grain-supported fabric when fv > fv-cha. It is noted that the influence of the water content w on the τ of the mixture with these two fabrics was not investigated by Wang et al. [10]. Duong et al. [3] explored the influence of w and fv on the τ of the interlayer soil with varying fv = 50~56% using large-scale triaxial tests. From these tests, the coupling effects of w and fv on the τ were observed: increasing fv resulted in an increment in τ at saturation, while a reverse trend was obtained during unsaturation. One should pay attention to the fact that the interlayer soil with fv = 50~56% only has the coarse-grain-supported fabric, without the fine-soil-supported fabric. Up to now, the influences of w and fv on the τ of a soil mixture with two varying fabrics have not been investigated yet.
Different models were proposed for describing the τ of unsaturated soils. Abramento and Carvalho [11] investigated the τ and suction ψ of residual soil from natural slopes, and developed an exponential function between τ and ψ. Vanapalli et al. [12] predicted the τ of unsaturated soil as a function of suction ψ using the soil water retention curve (SWRC), which was verified by the experimental results on a glacial till. Vilar [13] proposed an empirical hyperbolic formulation for describing the τ–ψ relationship, with one set of measured experimental data required for its application. Han and Vanapalli [14] developed a normalized function to describe the τ–ψ relationship, which incorporated the SWRC. This model was successfully applied to a given soil, such as coarse-grained sands and expansive clays. However, no model describes the τ–ψ relationship for a soil mixture with varying fv values.
This study explored the combined influence of w and fv on the τ of a soil mixture. Monotonic triaxial tests were fulfilled, which considered the fv and water content of fine soil wf values. The experimental results show the variation in the τ of a soil mixture according to the fv and wf. Afterwards, modelling of the shear strength τ of the soil mixture was performed by incorporating the SWRC, which was examined using both the test results from the present study and those from previous studies.
2. Materials and Methods
2.1. Reconstituted Fine Soil and Micro-Ballast
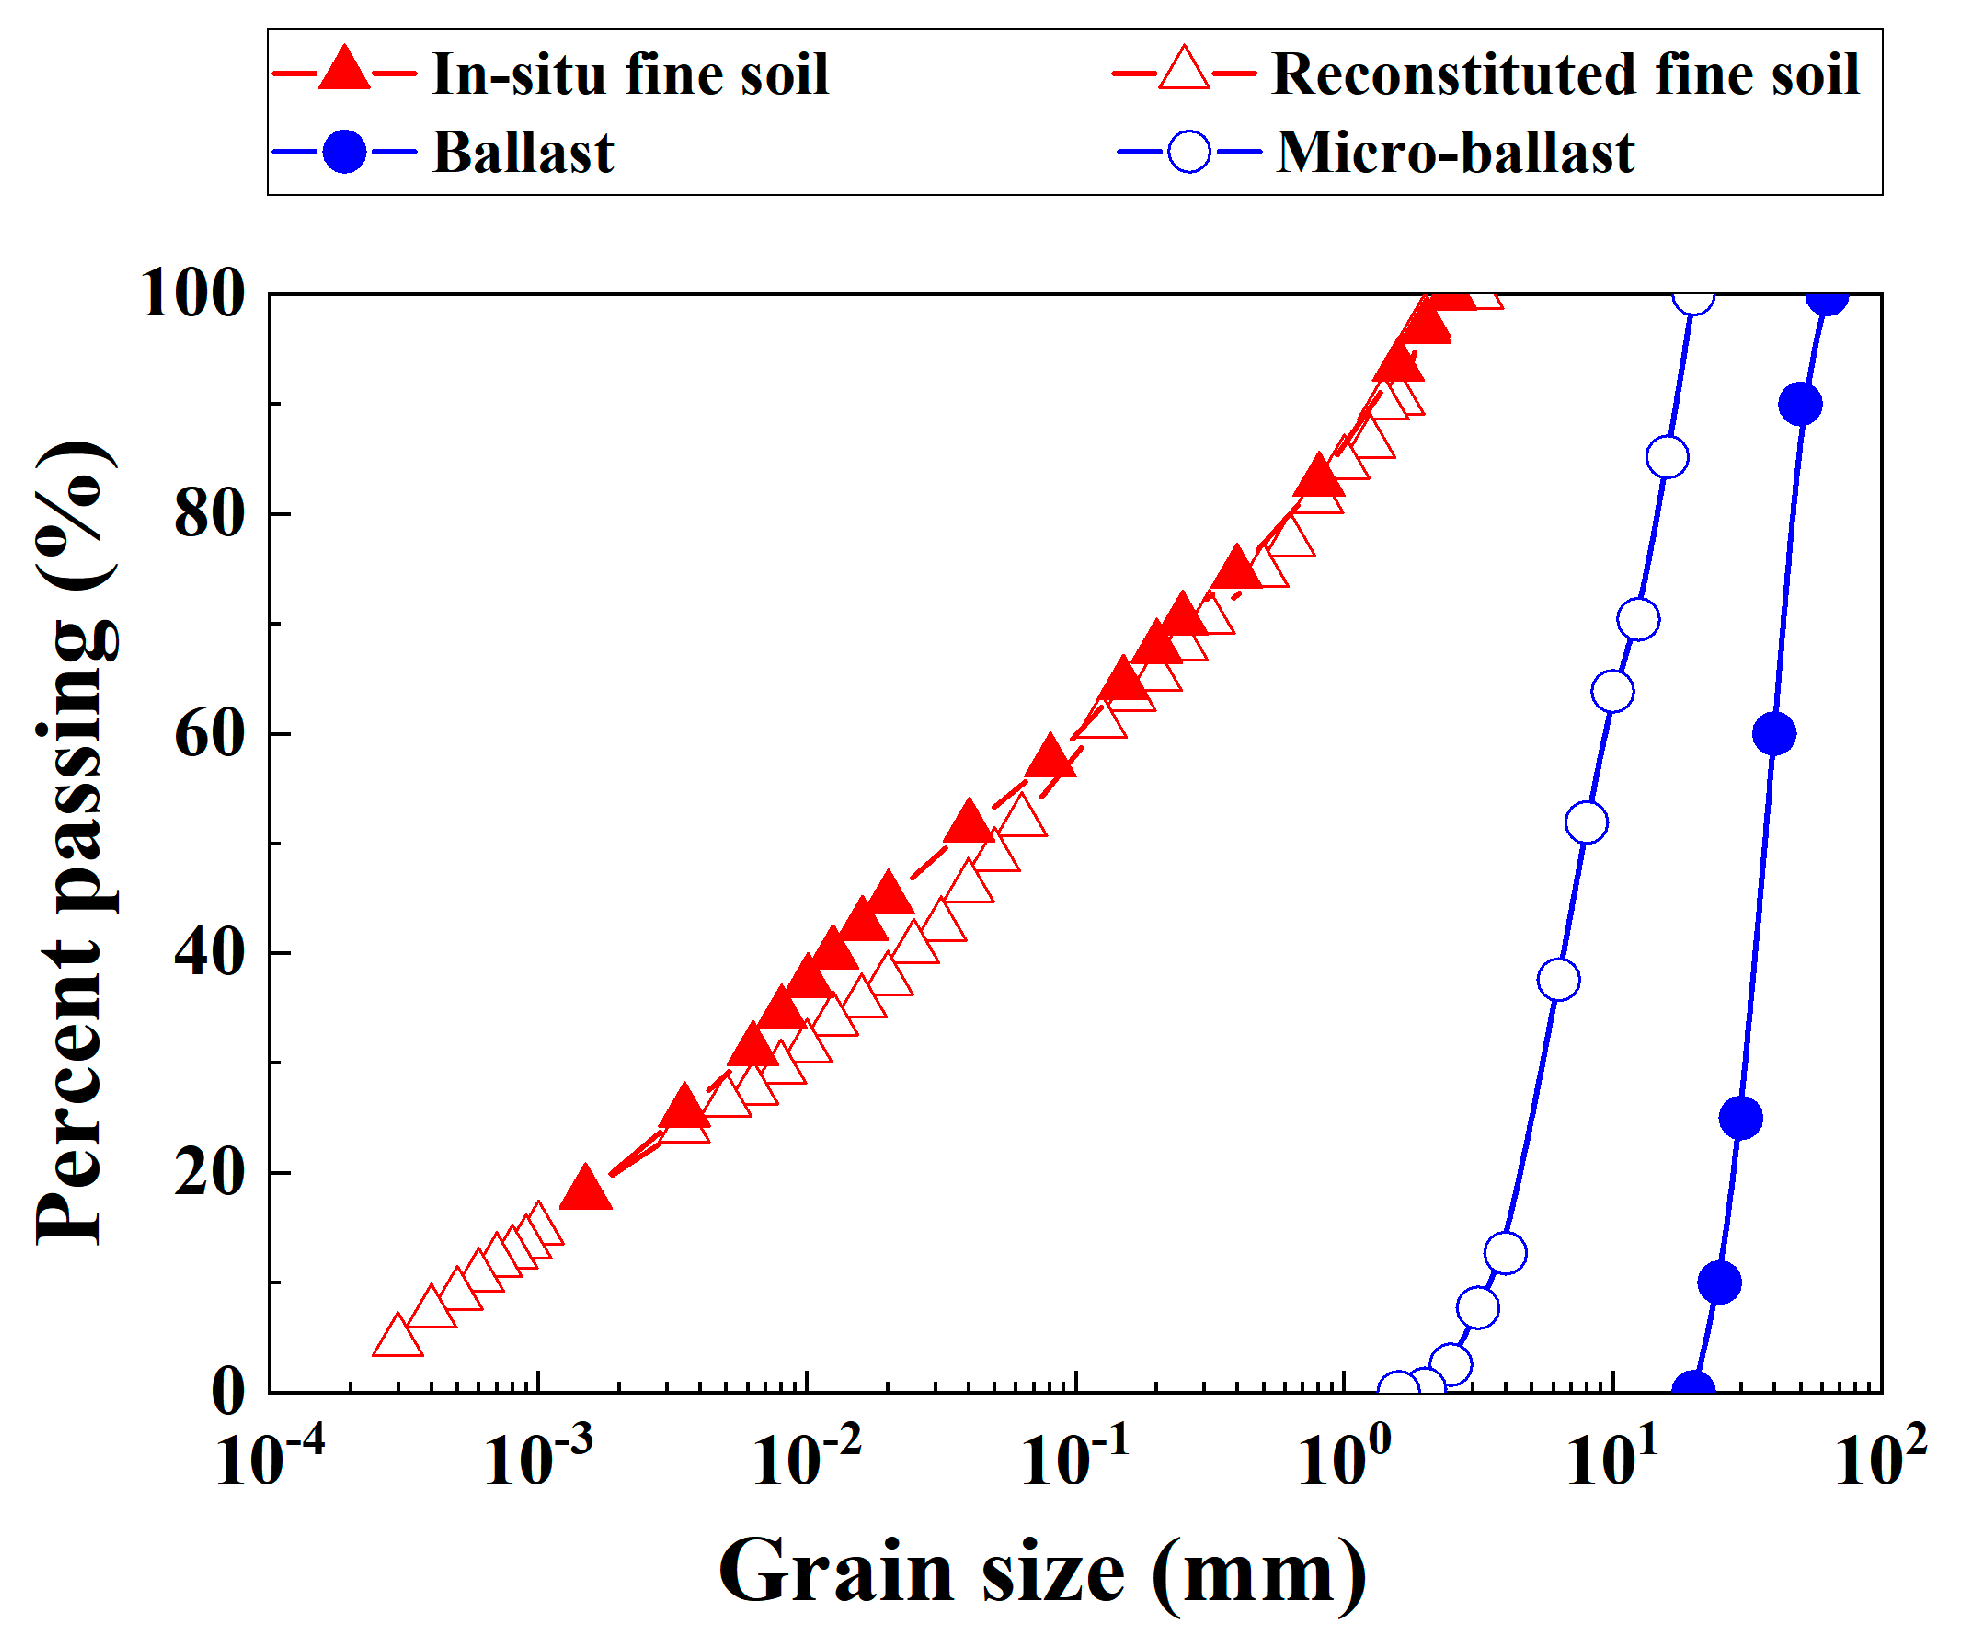
The interlayer soil was substituted by a mixture of reconstituted fine soil and micro-ballast in the laboratory study. Figure 1 presents a comparison of the grain size distribution (GSD) curves between in situ fine soil and reconstituted fine soil, which shows good agreement.
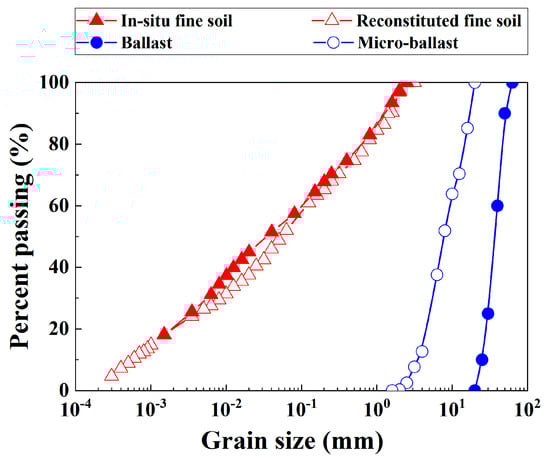
Figure 1.
Grain size distribution curves for fine soil and coarse grains.
The basis soil properties of the reconstituted fine soil are as follows: the specific gravity Gs = 2.68, the liquid limit wL = 32%, the plasticity index Ip = 20%, the optimum water content of the fine soil wopt-f = 13.7% and the maximum dry density of the fine soil ρdmax-f = 1.82 Mg/m3, respectively.
The GSD curve for the micro-ballast was obtained from that of ballast based on the parallel similitude method (Figure 1), which was consistent with Wang et al. [10]. In accordance with Wang et al. [10,15], the parameter fv was employed for quantifying the volume of coarse grains in the soil mixture.
Five fv values (0%, 10%, 20%, 35% and 45%) and three wf values (7.0%, 10.6% and 17.6%) were considered. Note that wf = 7.0%, 10.6% and 17.6% corresponded to the degree of saturation Sr = 40%, 60% and 100%, respectively. The mixture of reconstituted fine soil and micro-ballast with varying fv values was compacted to attain a cylindrical sample (diameter d = 100 mm, height h = 200 mm).
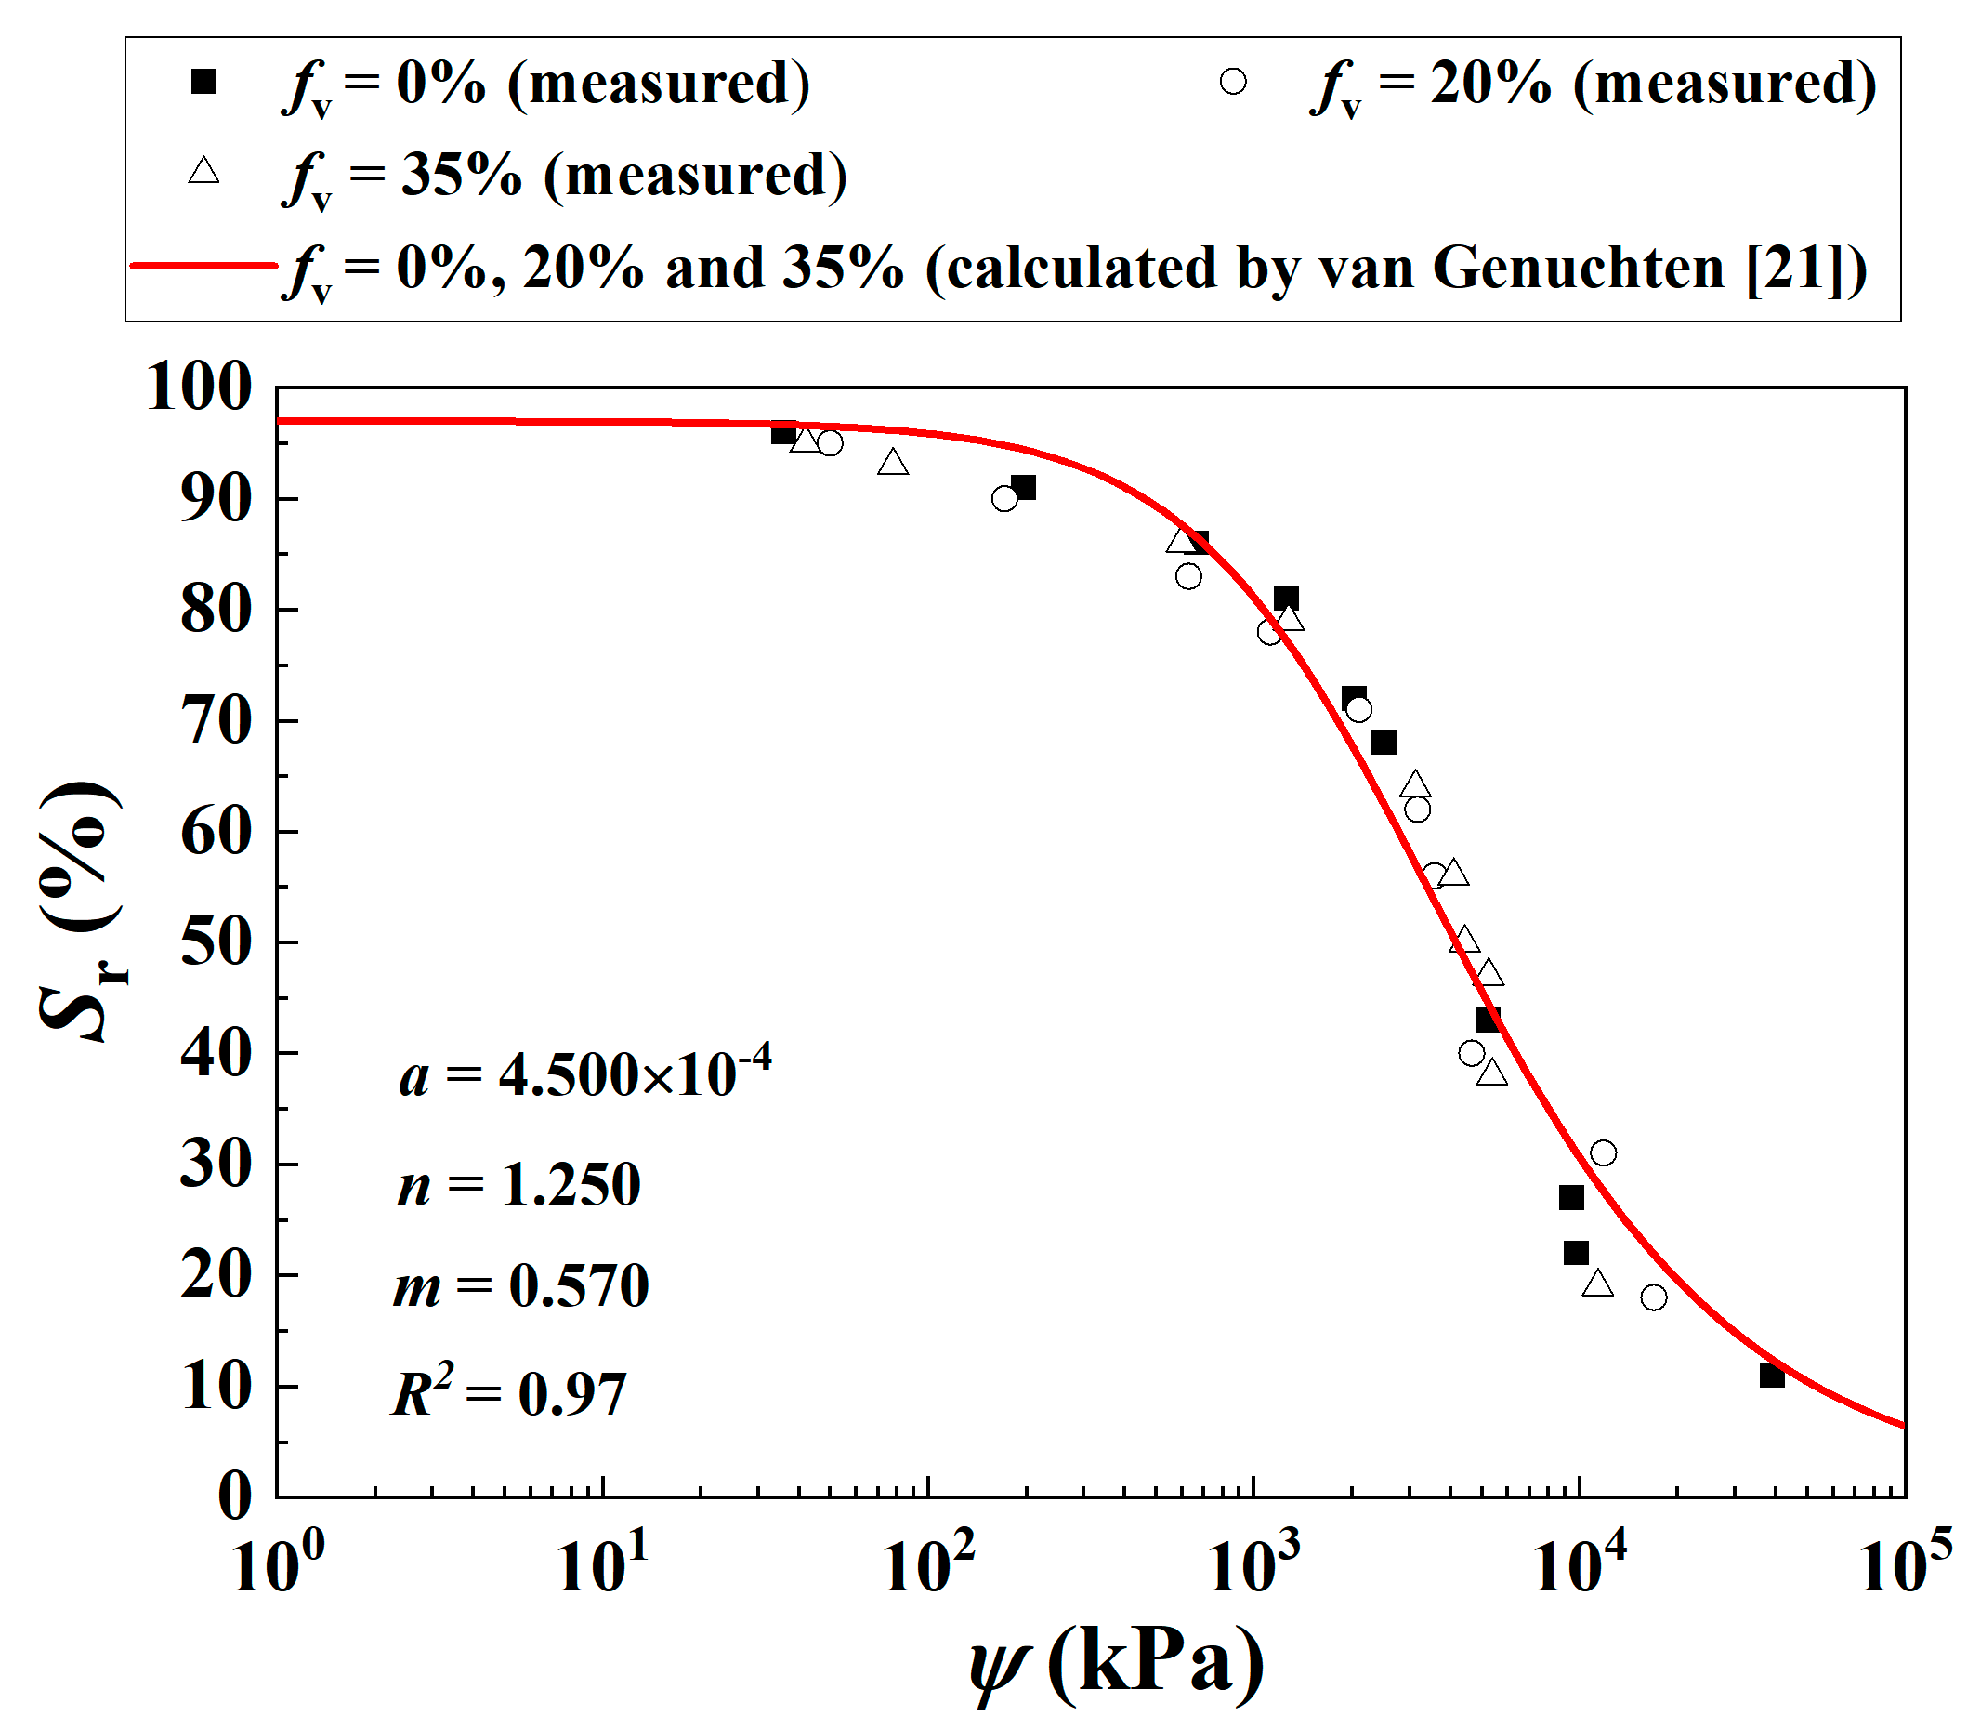
Note that during the compaction, the fine soil fraction was controlled at a constant wopt-f = 13.7% and ρdmax-f = 1.82 Mg/m3. As a result, the target dry density of the mixture ρd increased with increasing fv. The as-compacted samples with a constant wopt-f = 13.7% and varying fv values were then either dried to w1-f = 7.0% and w2-f = 10.6% or wetted to w3-f = 17.6%, with reference to the protocols developed by Su et al. [16] and Han and Vanapalli [17]. In the drying procedure, 1 h of air drying was adopted each time, followed by an equilibration time of at least 7 h, which minimizes the development of cracks and fissures. In the wetting procedure, an increment of 10 g water was employed each time, with the same equilibration time adopted. The drying/wetting procedure adopted was based on the consideration that after compaction at optimum water content, the in situ soil mixture was dried to a lower or wetted to a higher water content and attained an equilibrium state with the external environment (Yang et al. [18,19]). Figure 2 depicts a unique soil water retention curve (SWRC) for a mixture with an unchanged ρdmax-f = 1.82 Mg/m3 and different fv = 0%, 20% and 35% (Su et al. [20]).
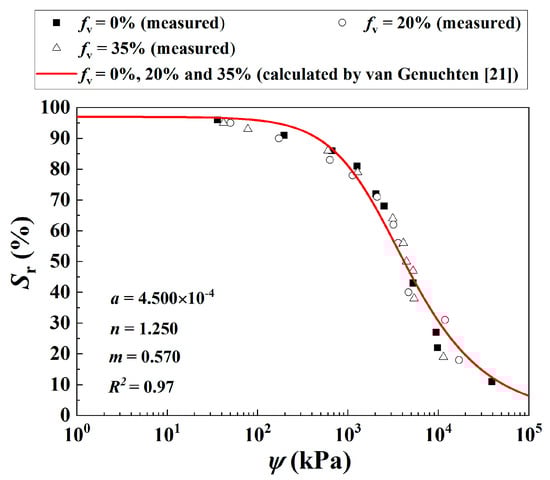
Figure 2.
Measured and calculated SWRC for the soil mixture with different fv values (data from Su et al. [20]).
The SWRC for the mixture was described by the van Genuchten [21] model with the parameters a = 4.500 × 10⁻⁴, n = 1.250, m = 0.570. Note that the parameter a approximates the inverse of the air-entry pressure, the parameter n related to the pore size distribution of the soil and the parameter m controlled the symmetry of the soil water retention curve. More details on the water retention properties of the mixture can be found in Su et al. [20].
2.2. Monotonic Triaxial Tests
Monotonic triaxial tests were fulfilled for the determination of the shear strength τ of the mixture with five fv values (0%, 10%, 20%, 35% and 45%) and three wf values (7.0%, 10.6% and 17.6%). The values of the confining pressure σ3 were 30, 60 and 120 kPa based on the consideration of the traffic loadings and the interlayer soil’s depth, which were consistent with those in Wang et al. [10]. In the case of wf = 17.6% (Sr = 100%), the confining pressure σ3 was applied overnight, allowing the dissipation of the pore water pressure. This was followed by the shearing process until the end of the tests. In the case of wf = 7.0% and 10.6% (Sr = 40% and 60%), the same consolidation time overnight was adopted prior to shearing. All the tests were fulfilled with a low shear rate of 0.1 mm/min. These tests were performed with reference to the protocol adopted by Wang et al. [10]. The test ended with either a peak deviator stress that presented when the axial strain εa < 15%, or when the axial strain εa = 15% (ASTM D7181-11 [22]).
3. Experimental Results
Figure 3 shows the shear behaviors of the soil mixture with different fv and wf values under a constant σ3 = 120 kPa.
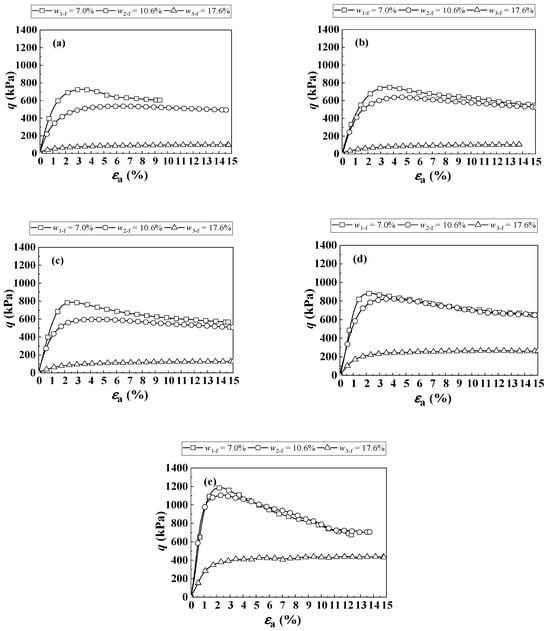
Figure 3.
Shear behaviors of the soil mixture under a constant = 120 kPa: (a) fv = 0%, (b) fv = 10%, (c) fv = 20%, (d) fv = 35% and (e) fv = 45%.
For the deviator stress q-axial strain εa curves at fv = 0% (Figure 3a), under a given wf, the q increased with an increment in the εa until a peak value, prior to its decline. With increasing wf, the q decreased significantly. This could be attributed to the decrease in suction ψ. Similar observations can be made when fv = 10–45% (Figure 3b–e). It was found that under a constant wf, no matter whether the conditions were saturated and unsaturated, an increase in fv from 0% to 45% led to an increase in q (Figure 3a–e), which was due to the reinforcement effect of coarse grains. A similar observation was made by Wang et al. [10].
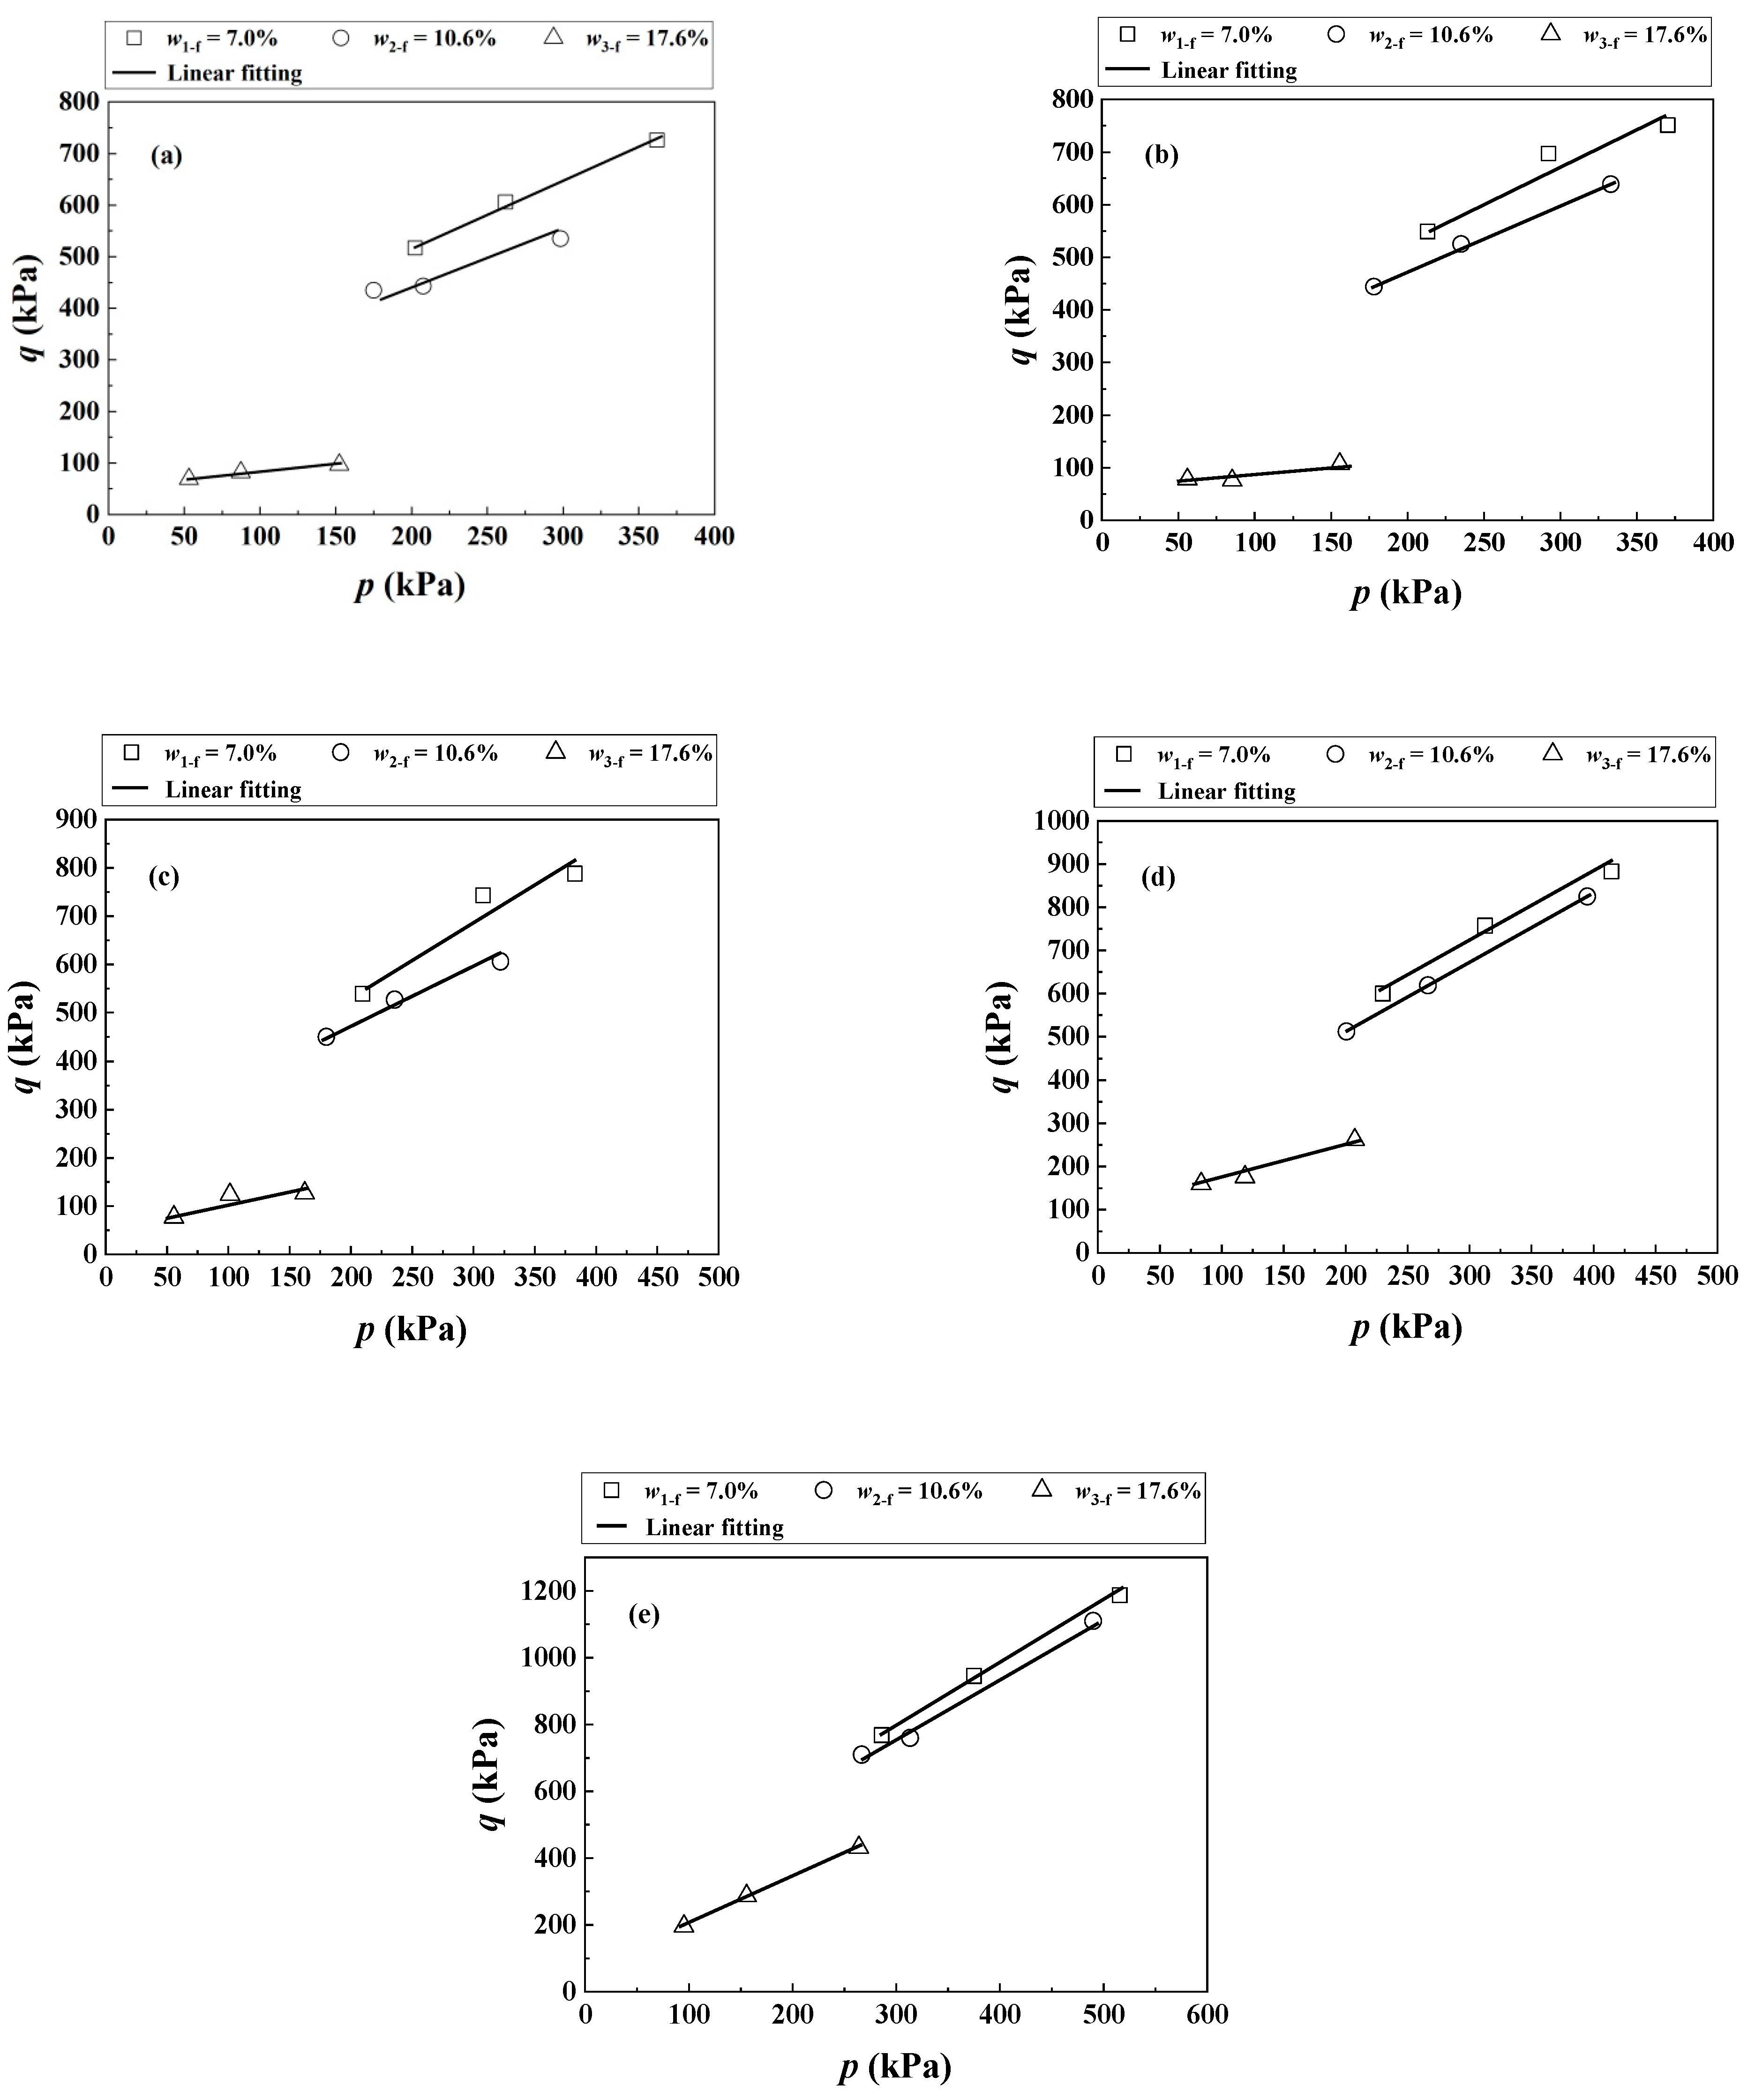
For further analysis, the deviator stress q at failure was selected, which was defined as the peak deviator stress or the deviator stress at εa = 15% (ASTM D7181-11 [22]). Figure 4 shows the failure envelops of the soil mixture with different fv = 0%, 10%, 20%, 35% and 45% in the q-p plane, where p is the mean stress.

Figure 4.
Failure envelopes of the soil mixture under (a) fv = 0%, (b) fv = 10%, (c) fv = 20%, (d) fv = 35% and (e) fv = 45% in the q-p plane.
At fv = 0% (Figure 4a), an increase in the wf induced a decrease in the slope and intercept of the failure envelops. Similar observations were made for fv = 10~45% (Figure 4b–e). Correspondingly, the cohesion c and friction angle φ of the soil mixture with different fv and wf were determined, as conducted by Trinh et al. [2] and Wang et al. [10].
Table 1 presents the cohesion c and friction angle φ of the soil mixture with varying wf and fv values. It can be observed that under a given wf, increasing the fv induced a decline in c, which was owing to the decrease in the fine soil content. With an increase in wf, the c decreased due to the decrease in suction. It was found that under a constant wf, increasing the fv resulted in an increase in φ, due to more coarse grains involved during the shearing. When wf decreased, the φ was observed to increase. That could be explained by the suction-induced aggregation of the fine soil: according to the findings by Delage et al. [23], a fine matrix fabric was formed on the wet side of the optimum (e.g., w3-f = 17.6% > wopt-f = 13.7%), while a fine aggregate fabric was obtained on the dry side (e.g., w1-f = 7.0% and w2-f = 10.6% < wopt-f = 13.7%). The decrease in wf from 17.6% to 10.6% and 7.0% contributed to a change in the fabric of the fine soil fraction from a fine matrix fabric to a fine aggregate fabric. This change in the fabric resulted in an increase in φ. Similarly, suction-induced aggregation of unsaturated loess was observed by Ng et al. [24] using scanning electron microscopy; who reported that an increase in suction up to 40 MPa gave rise to a notable increase in soil stiffness.

Table 1.
Cohesion and friction angle of the soil mixture with varying fv and wf values.
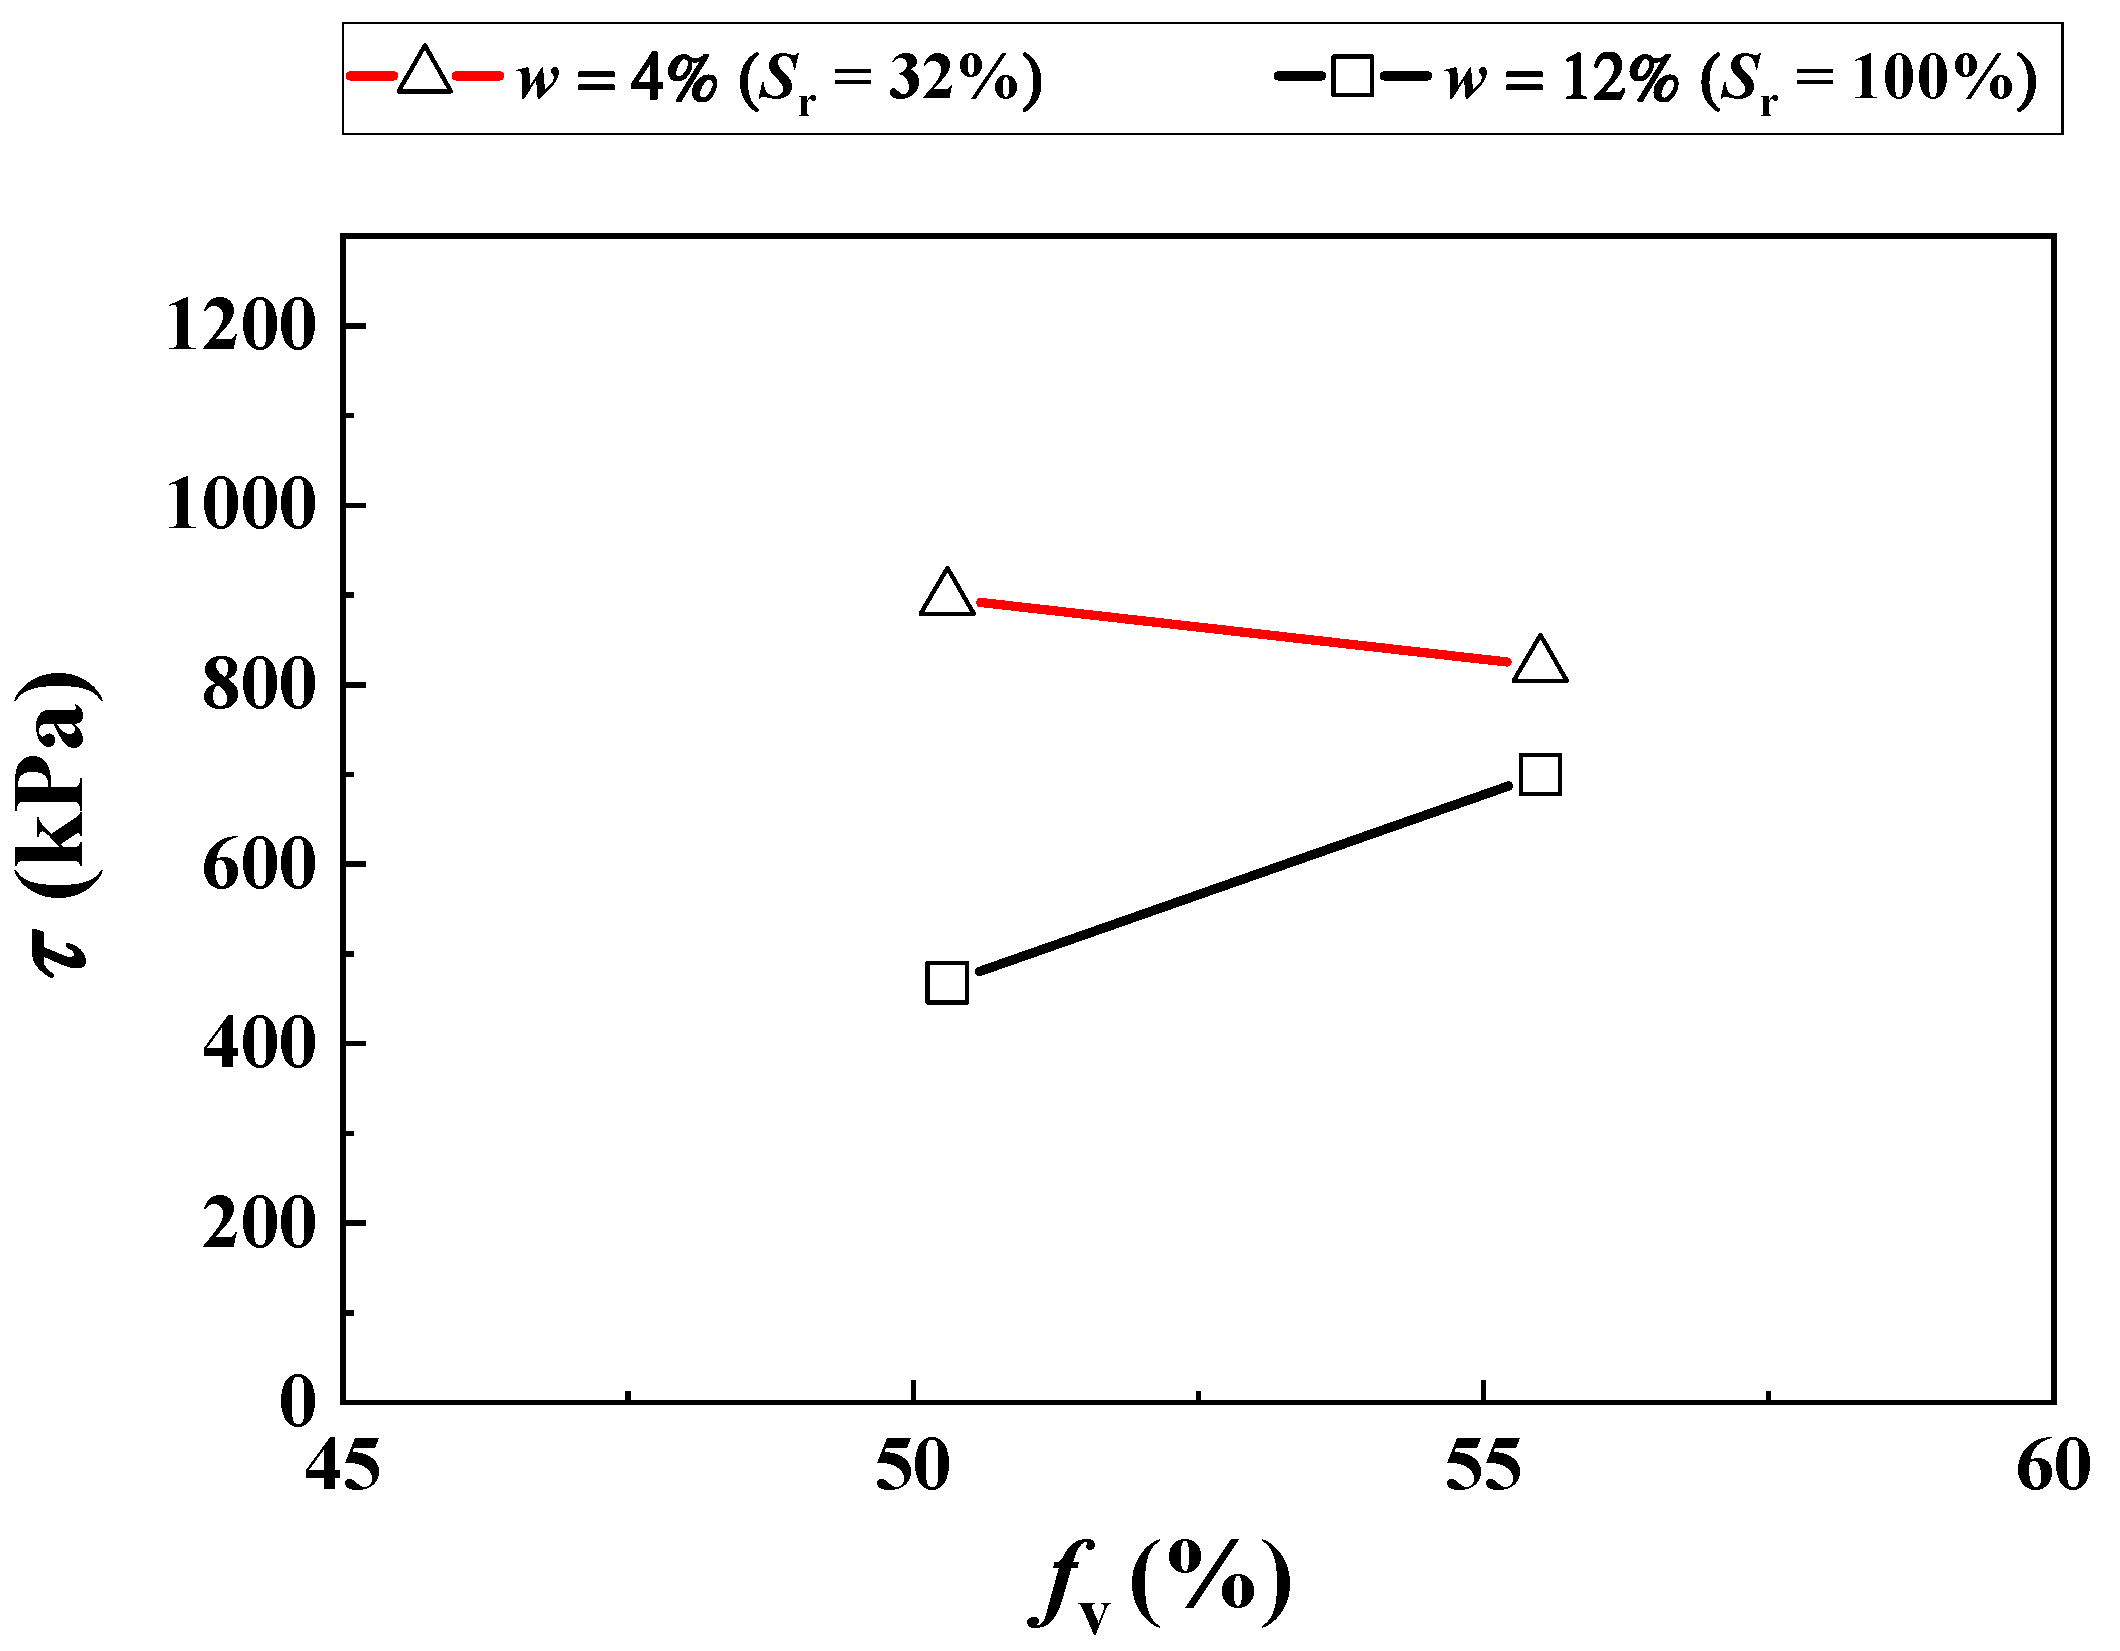
Figure 5 shows the shear strength τ of the soil mixture with various fv = 50% and 56% and a water content of mixture w = 4% and 12%, which were obtained from Duong et al. [3].
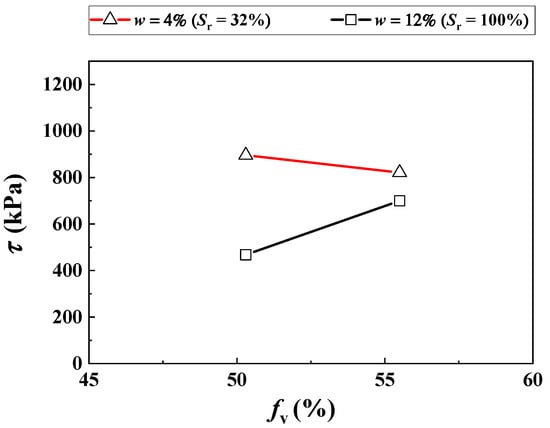
Figure 5.
Variations in the shear strength with fv under different water contents (after Duong et al. [3]).
It is noted that in situ fine soil and ballast were employed by Duong et al. [3], which were different from the reconstituted fine soil and micro-ballast in the present study (Figure 1). For the fine soil fraction, the GSD curve for the reconstituted fine soil was consistent with that of the in situ fine soil (Figure 1). For the coarse grain fraction, according to the findings of Qi et al. [5], micro-ballast can be adopted as a substitute for the ballast when studying the mechanical behaviors of interlayer soil. Figure 5 shows that with increasing fv, the τ decreased under the unsaturated condition (w = 4%, Sr = 32%) but increased under the saturated condition (w = 12%, Sr = 100%). These observations were different from those in the present study, which found that the increasing fv induced an increase in the shear strength τ under both unsaturated and saturated conditions. Note that the τ was taken as the deviator stress at failure in Figure 4. This was explained as follows: in Duong et al. [3], a stable dry density of the mixture ρd = 2.01 Mg/m3 was adopted. In this case, the growth of fv from 50% to 56% induced a decline in the dry density of the fine soil fraction ρd–f from 1.33 to 1.17 Mg/m3, and hence a decline in suction ψ.
While the negative influence of the declining ψ outweighed the positive influence of the incrementing fv, the τ was observed to decrease. On the contrary, a stable ρd–f = 1.82 Mg/m3 was adopted in the present study. This gave rise to a constant suction in the mixture with increasing fv, as shown in Figure 2 (Su et al. [20]). In this case, the increasing fv contributed to an increase in the τ of the soil mixture under both saturation and unsaturation, due to its only positive reinforcement influence.
Comparisons between Duong et al. [3] and the present study show that the τ of the soil mixture was notably influenced by the fv, w and ρd–f. The combined influence of the w and ρd–f on the τ could be reflected by the influence of the ψ. The SWRC was incorporated into different models to describe the effect of the ψ on the τ, such as the models by Vanapalli et al. [12] on glacial till and Han and Vanapalli [14] on cohesionless or cohesive soil. To date, no model describes the τ–ψ relationship of the soil mixture with different fv by incorporating the SWRC.
4. Modelling of Shear Strength
Referencing the existing models (Equations (1)–(6) from Abramento and Carvalho [11], Vanapalli et al. [12], Öberg and Sallfors [25], Xu and Sun [26], Vilar [13] and Han and Vanapalli [14], repectively in Table 2), a general form of unsaturated shear strength τ was obtained, as shown in Equation (7):
Table 2.
Shear strength equations for unsaturated soils in previous studies.
Table 2.
Shear strength equations for unsaturated soils in previous studies.
| Reference | Equation | |
|---|---|---|
| Abramento and Carvalho [11] | (1) | |
| Vanapalli et al. [12] | (2) | |
| Öberg and Sallfors [25] | (3) | |
| Xu and Sun [26] | (4) | |
| Vilar [13] | (5) | |
| Han and Vanapalli [14] | (6) |
Note: : effective cohesion; : effective friction angle; : normal stress; : pore-air pressure; : effective stress parameter; : degree of saturation; and : measured maximum cohesion and the corresponding measured maximum suction; : shear strength under saturated condition; , and : shear strength, suction and degree of saturation under a reference state; , , , and : model parameters. The SWRC was incorporated in Equations (2), (3) and (6).
A factor of χ was widely employed for describing the suction effect on τ (e.g., Equation (2) in Vanapalli et al. [12], Equation (3) in Öberg and Sallfors [25], and Equation (6) in Han and Vanapalli [14], Table 2), where χ is the effective stress parameter. According to the findings of Han and Vanapalli [14], the use of χ can upscale the pore-scale stress to a macroscopic stress χ, contributing to the unsaturated shear strength τ. This factor was modified in the present study, with consideration of the following two aspects: (a) χ was considered as the effective degree of saturation , which was consistent with Alonso et al. [27] and Lu et al. [28]; (b) a power relationship between τ and was reported by Abramento and Carvalho [11] and Xu and Sun [26] (Equations (1) and (4) in Table 2). In this circumstance, a factor of was generated and, thus, Equation (8) was obtained below:
where A and B are constant parameters.
As conducted by Vilar [13] (Equation (5)) and Han and Vanapalli [14] (Equation (6)), one set of referenced experimental data was adopted in the modelling of unsaturated τ. Substituting a referenced shear strength τref, the corresponding effective degree of saturation and suction ref in Equation (8) yields Equation (9):
Equation (10) was derived by dividing Equation (8) with Equation (9), where the parameter A disappears:
The empirical model by van Genuchten [21] was employed for the description of the SWRC:
where the residual degree of saturation is taken as zero in the present study, a is a parameter with respect to the air-entry value, and n and m are constant parameters.
Combining Equation (10) with Equation (11), Equation (12) was deduced:
For the application of the proposed Equation (12), the information on (i) the shear strength under the saturated condition τsat, (ii) a referenced shear strength τref and the corresponding ref and (iii) the parameters a, n and m with respect to the SWRC were required. To verify the validity of the developed Equation (12), the present study, the study by Wang et al. [10] and another three previous studies (Rassam and Williams [29], Khalili et al. [30], Khalili and Zargarbashi [31] in Table 3) were selected.
Table 3.
Soil properties of the soil mixture in previous studies.
Note that Duong et al. [3] were excluded, due to the fact that only two data points were obtained for a given fv (Figure 5). For each study, the experimental results with varying fv were separated into two groups. The first one was employed for the determination of model parameter B in Equation (12) (e.g., fv = 0%, 10% and 35% in the present study and Wang et al. [10]; fv = 37% in Rassam and Williams [29]; fv = 16% in Khalili et al. [30]; fv = 27% in Khalili and Zargarbashi [31]). On the other hand, the second group was employed for examining the performance of the developed Equation (12) with the parameter B previously determined (e.g., fv = 20% and 45% in the present study and Wang et al. [10]; fv = 49% in Rassam and Williams [29]; fv = 25% in Khalili et al. [30]; fv = 51% in Khalili and Zargarbashi [31]).
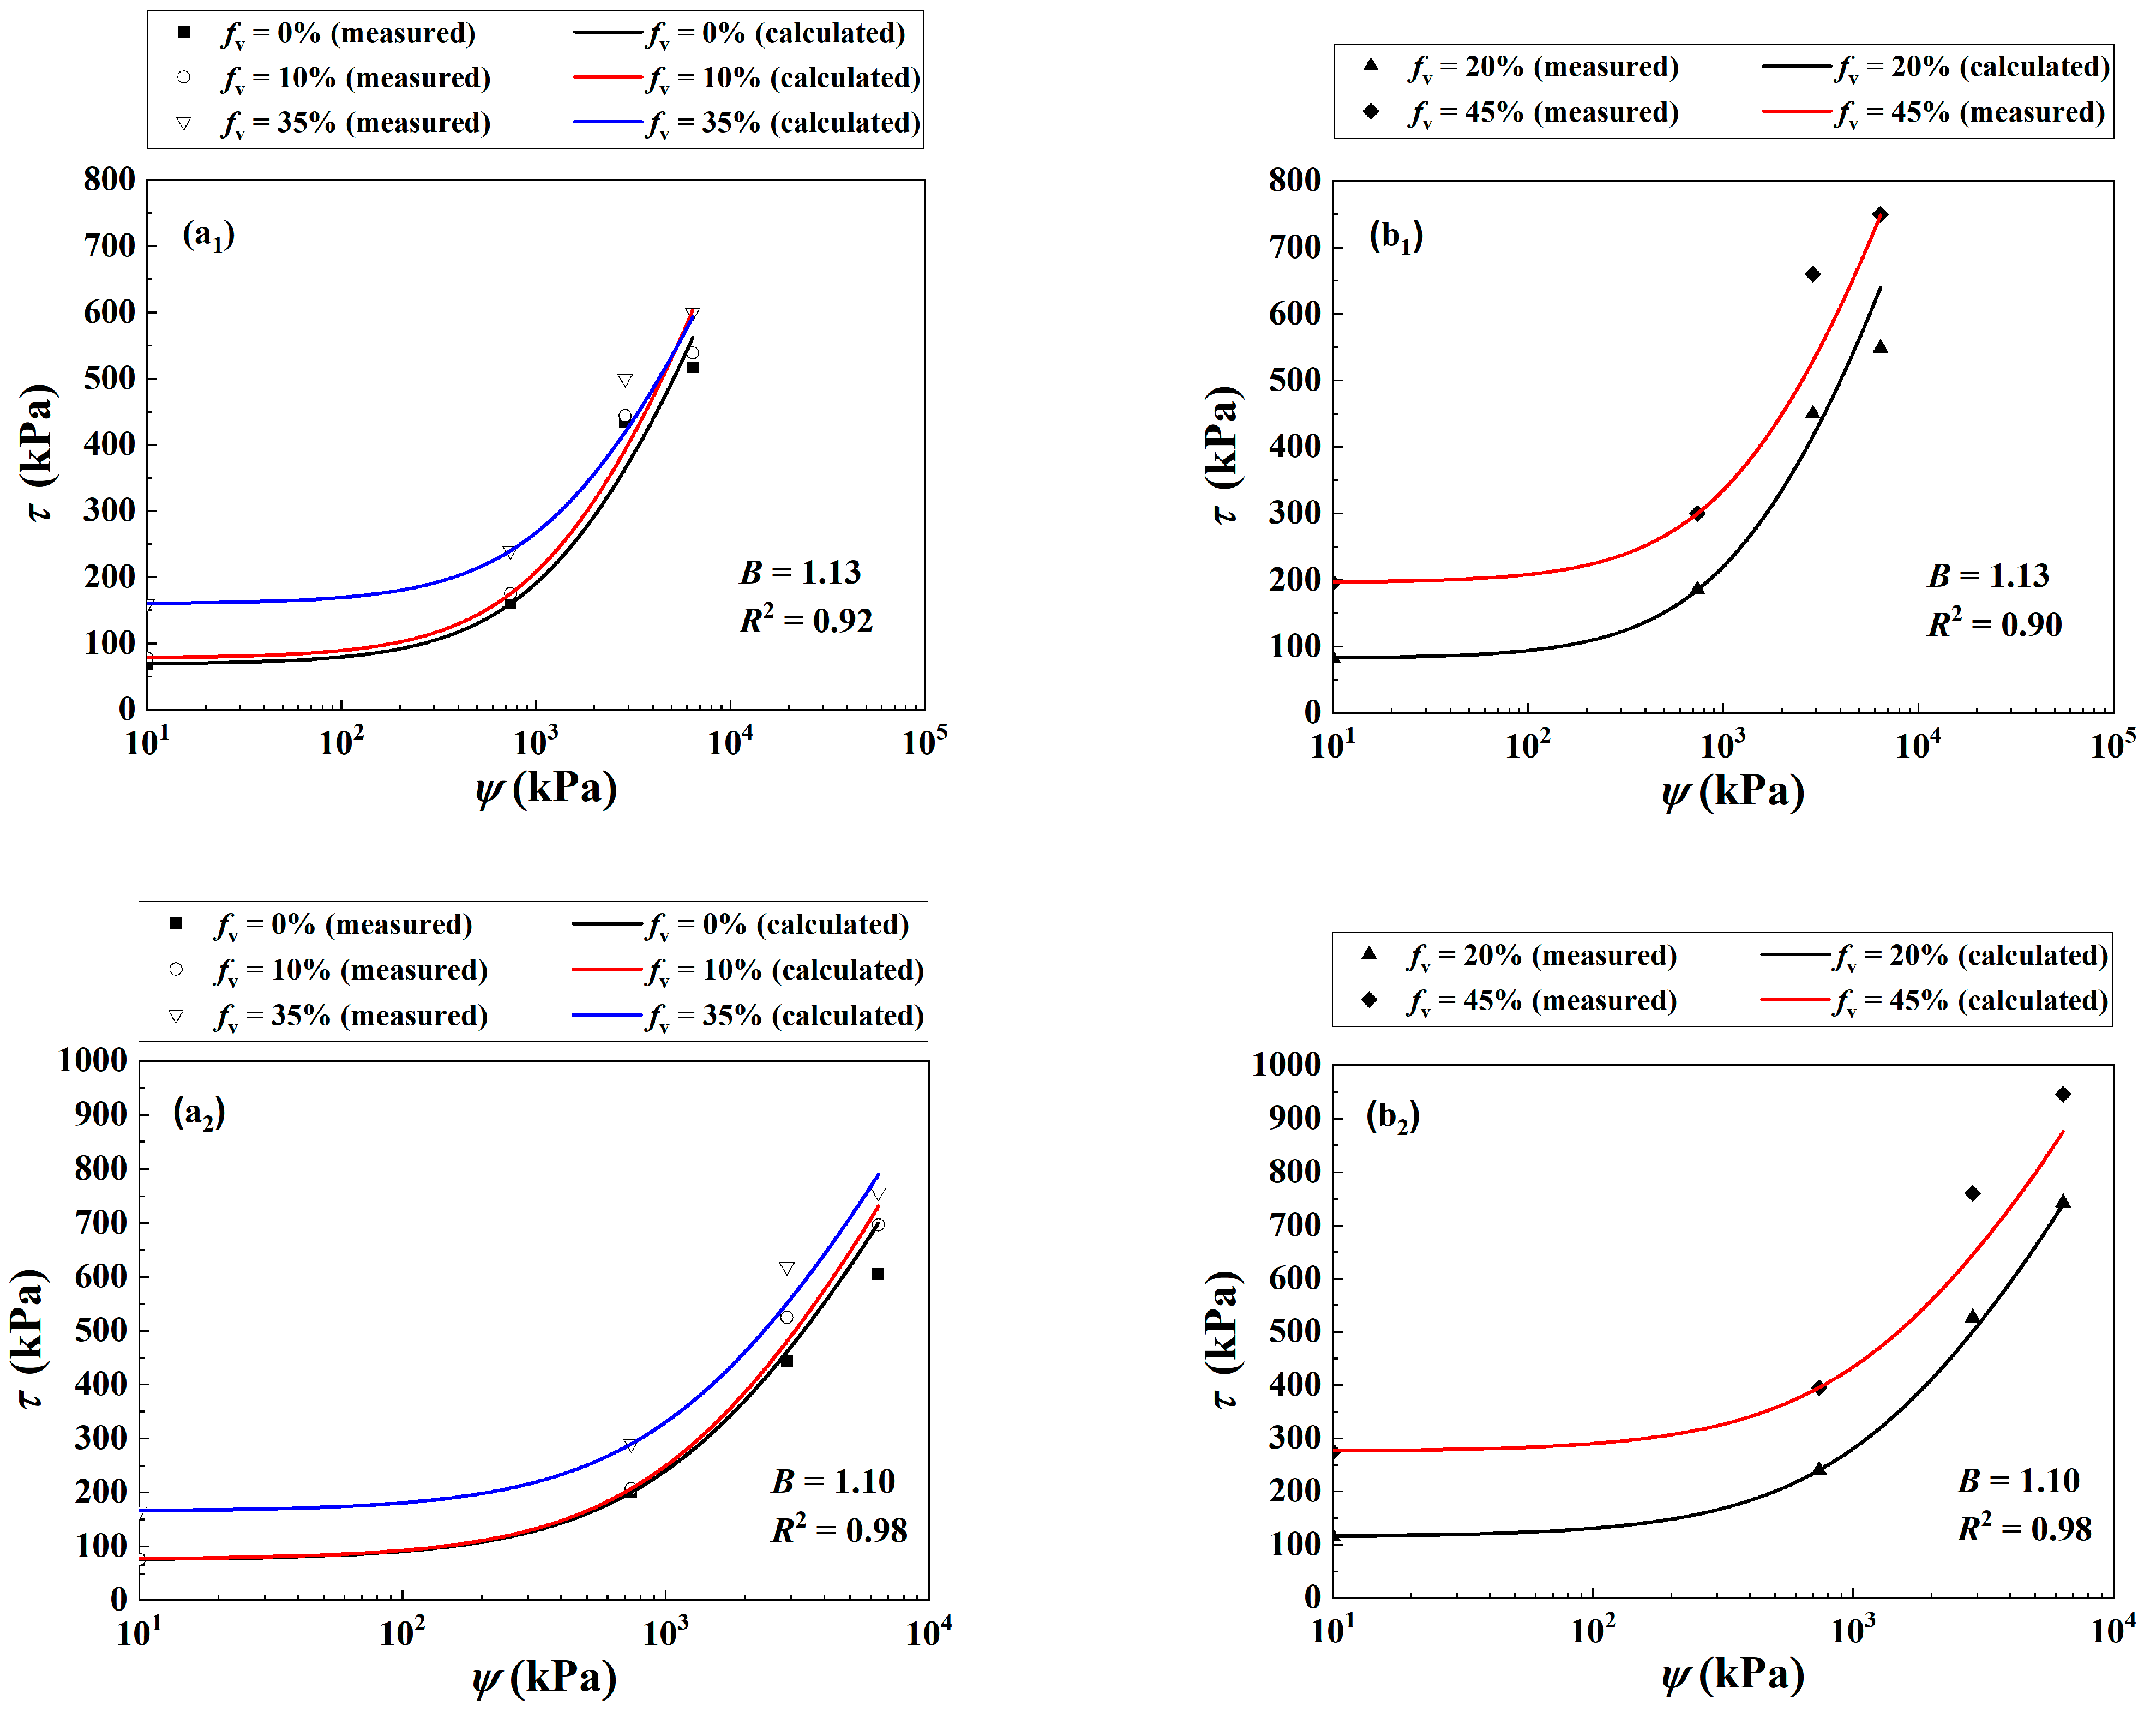
The τ of the soil mixture with varying fv = 0~45% was investigated under different σ3 = 30, 60 and 120 kPa in the present study (Figure 4) and Wang et al. [10]. The experimental results at fv = 0%, 10% and 35% were employed for the determination of parameter B in Equation (12), while those at fv = 20% and 45% were adopted to examine the performance of the proposed Equation (12). Figure 6(a1) compares the measured and the corresponding calculated τ of the mixture with fv = 0%, 10% and 35% under σ3 = 30 kPa. Equation (12) provided satisfactory simulations with the coefficient of determination R2 = 0.92 using the parameter B = 1.13. Figure 6(b1) presents reasonably good agreement for the measured and calculated τ of the soil mixture at fv = 20% and 45% with the previously determined B = 1.13 (R2 = 0.90). Similar observations were reported when σ3 increased to 60 kPa Figure 6(a2,b2) and 120 kPa Figure 6(a3,b3).
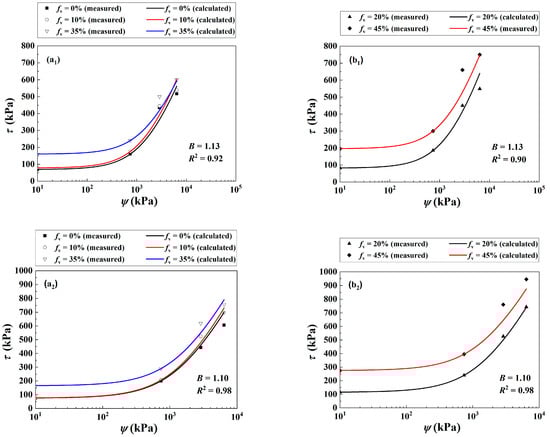
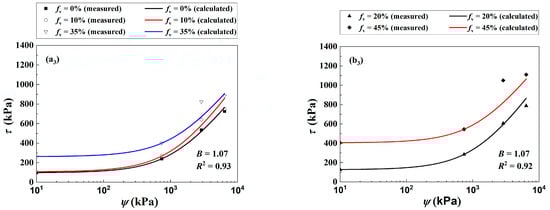
Figure 6.
Comparisons between measured and calculated shear strength of the soil mixture with varying fv and ψ under different σ3 values: (a1,b1) σ3 = 30 kPa, (a2,b2) σ3 = 60 kPa and (a3,b3) σ3 = 120 kPa (data from the present study and Wang et al. [10]).
Equation (12) provided good simulations for the cases where σ3 = 60 and 120 kPa with parameter B = 1.10 and 1.07, respectively. The values of R2 for these two cases are shown in Figure 6(a2,b2) and Figure 6(a3,b3), which were at least larger than 0.92.
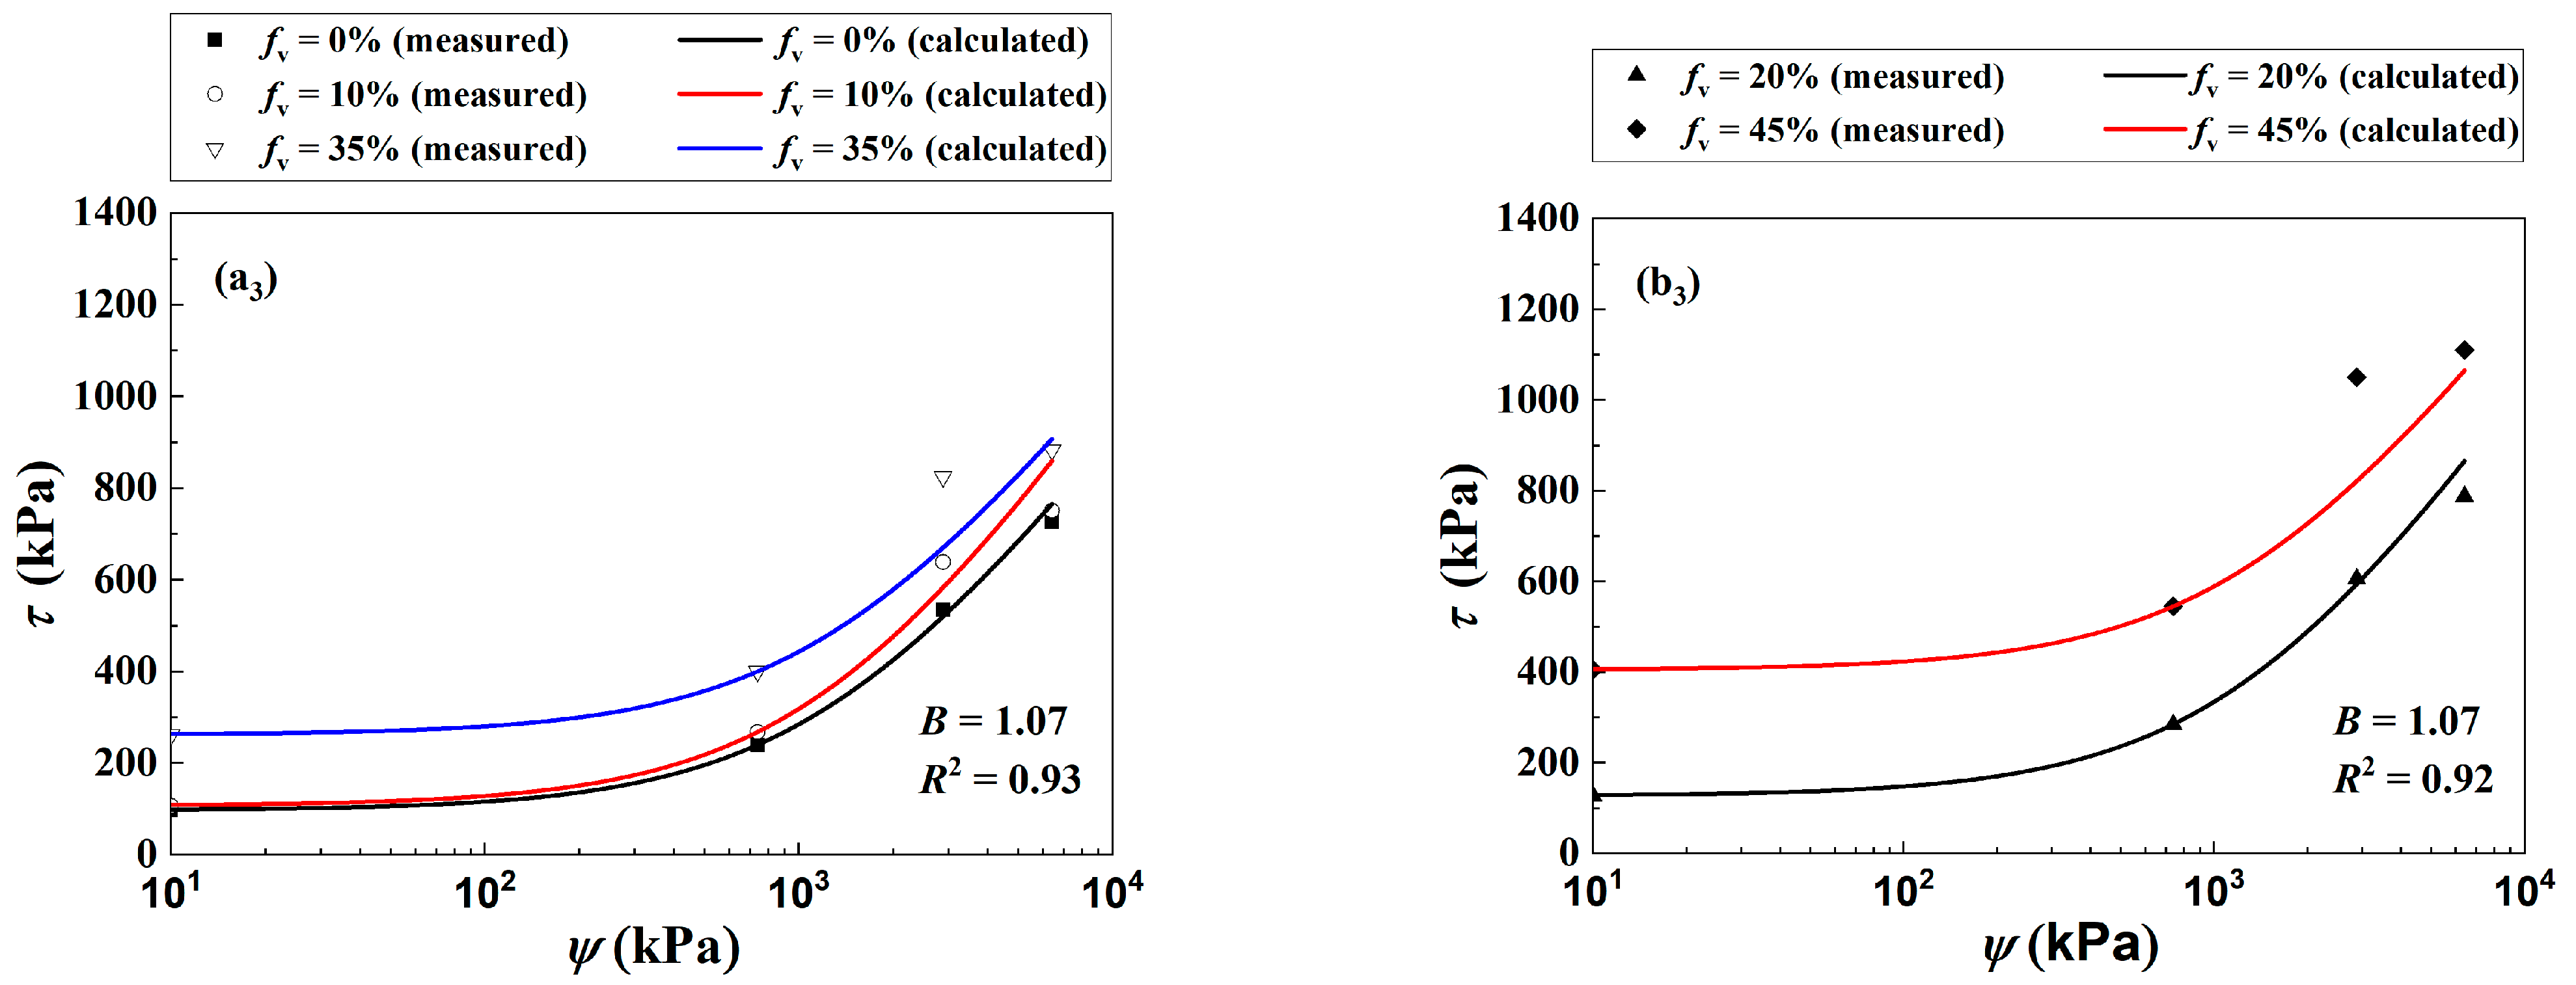
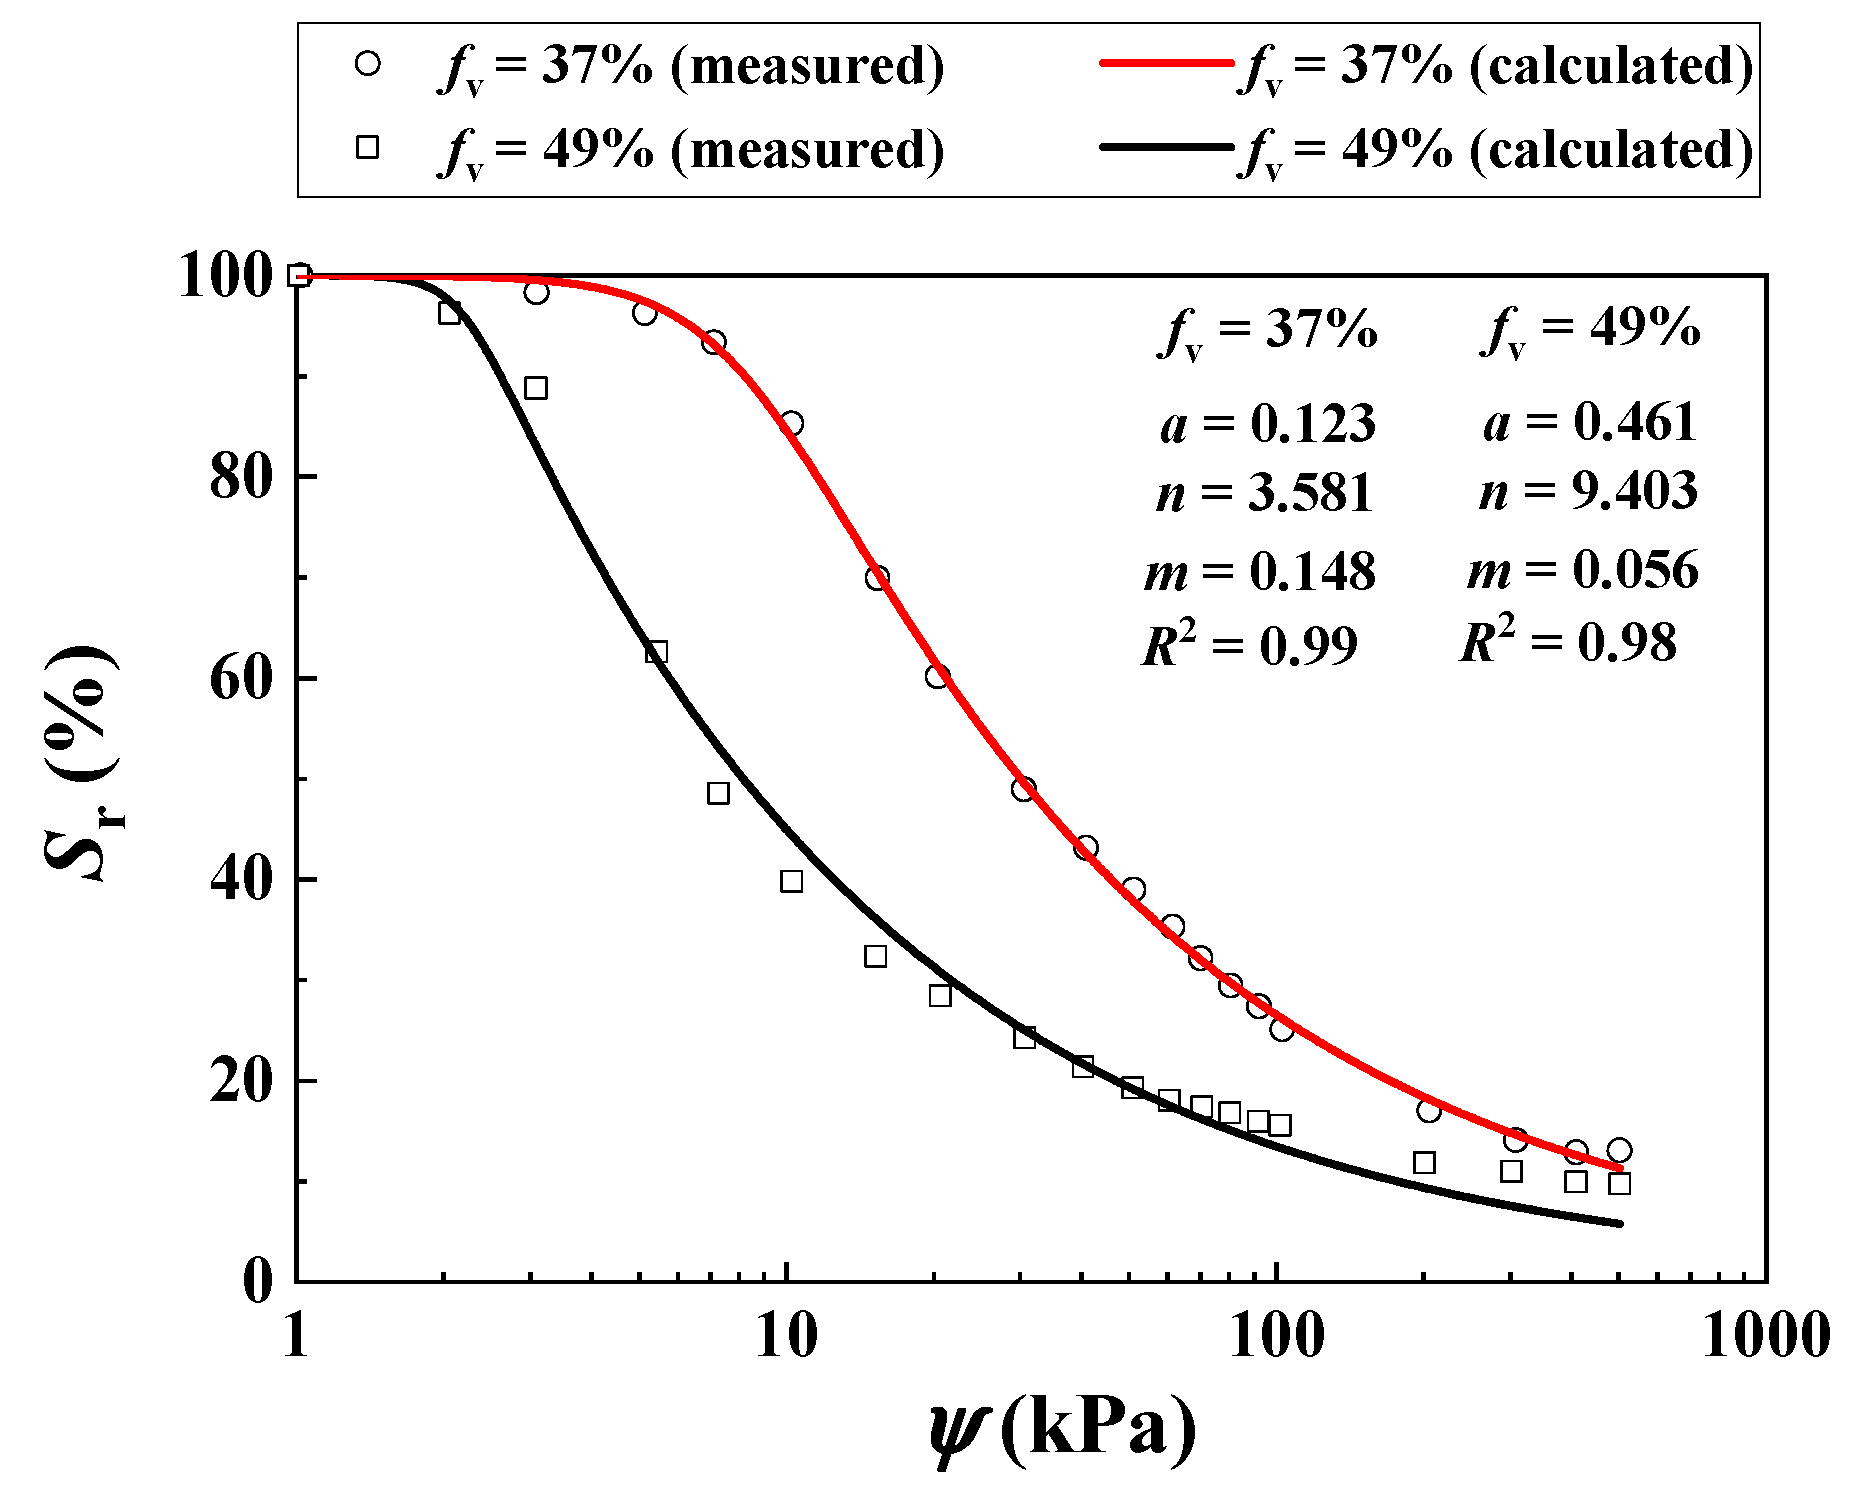
Rassam and Williams [29] investigated the τ of two unsaturated tailing samples with different fv = 37% and 49% under varying σ3 = 30, 125 and 250 kPa using suction-controlled triaxial tests. The values of = 0, 20, 60 and 100 kPa were considered. Figure 7 depicts the SWRCs for fv = 37% and 49%, respectively.
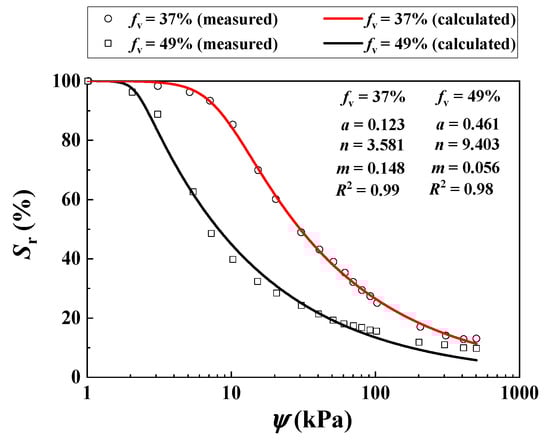
Figure 7.
Measured and calculated SWRCs for the soil mixture with different fv values (data from Rassam and Williams [29]).
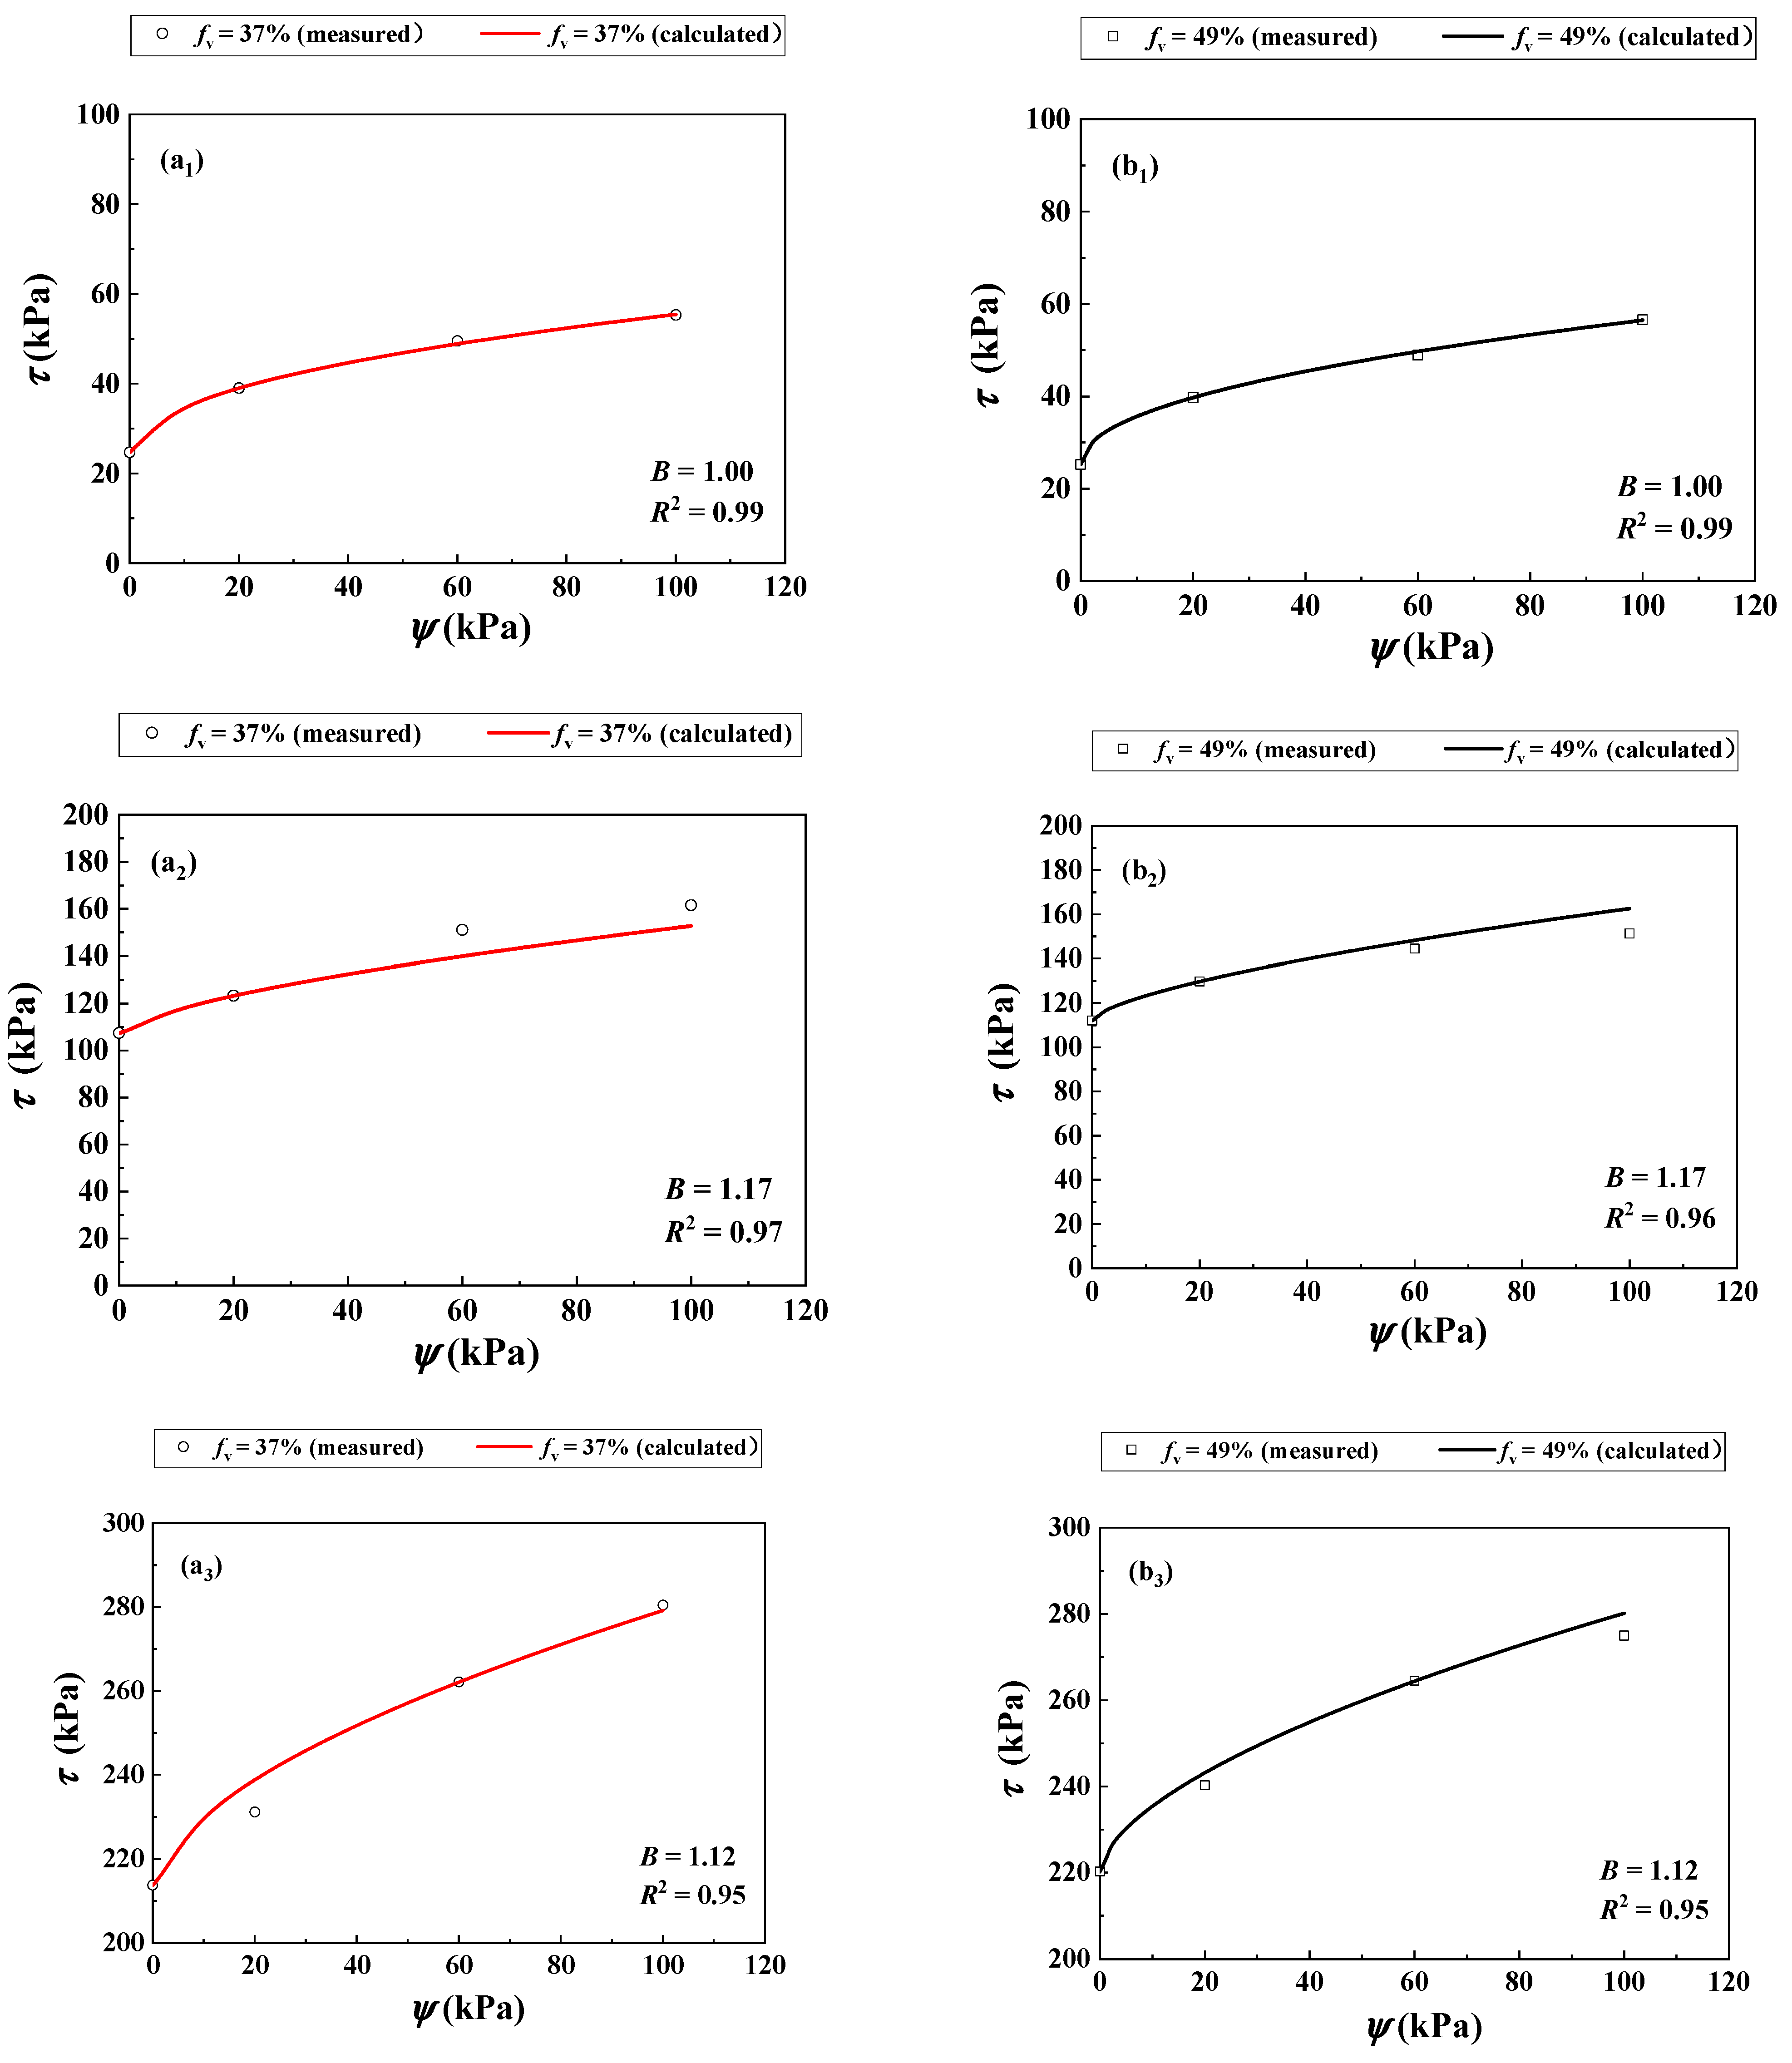
Figure 8(a1) compares the measurements by Rassam and Williams [29] and the calculations using Equation (12) for fv = 37% under σ3 = 30 kPa.
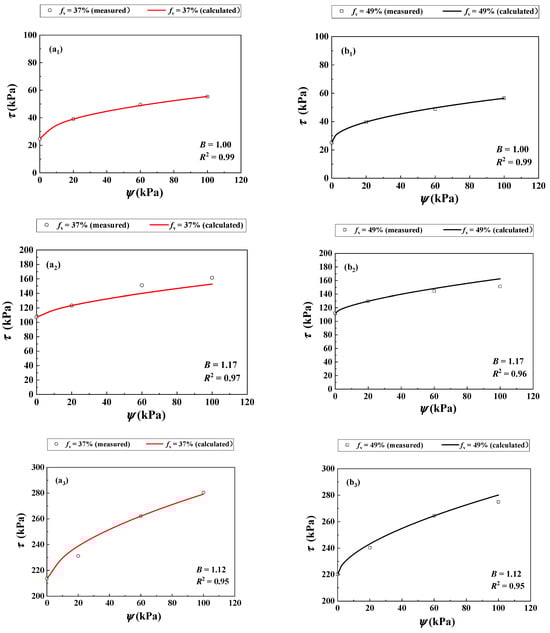
Figure 8.
Comparisons between measured and calculated shear strength of the soil mixture with varying fv and ψ under different σ3 values: (a1,b1) σ3 = 30 kPa, (a2,b2) σ3 = 125 kPa and (a3,b3) σ3 = 250 kPa (data from Rassam and Williams [29]).
Equation (12) provided the calculated results using parameter B = 1.00. Figure 8(b1) compares the measured and calculated τ for fv = 49% using Equation (12) with the previously determined B = 1.00. The comparison shows satisfactory agreement with R2 = 0.99. Similar observations were made for σ3 = 125 kPa Figure 8(a2,b2) and σ3 = 250 kPa Figure 8(a3,b3). Equation (12) provided satisfactory simulations for σ3 = 125 and 250 kPa with parameter B =1.17 and 1.12, respectively. The values of R2 for these two cases were larger than 0.95.
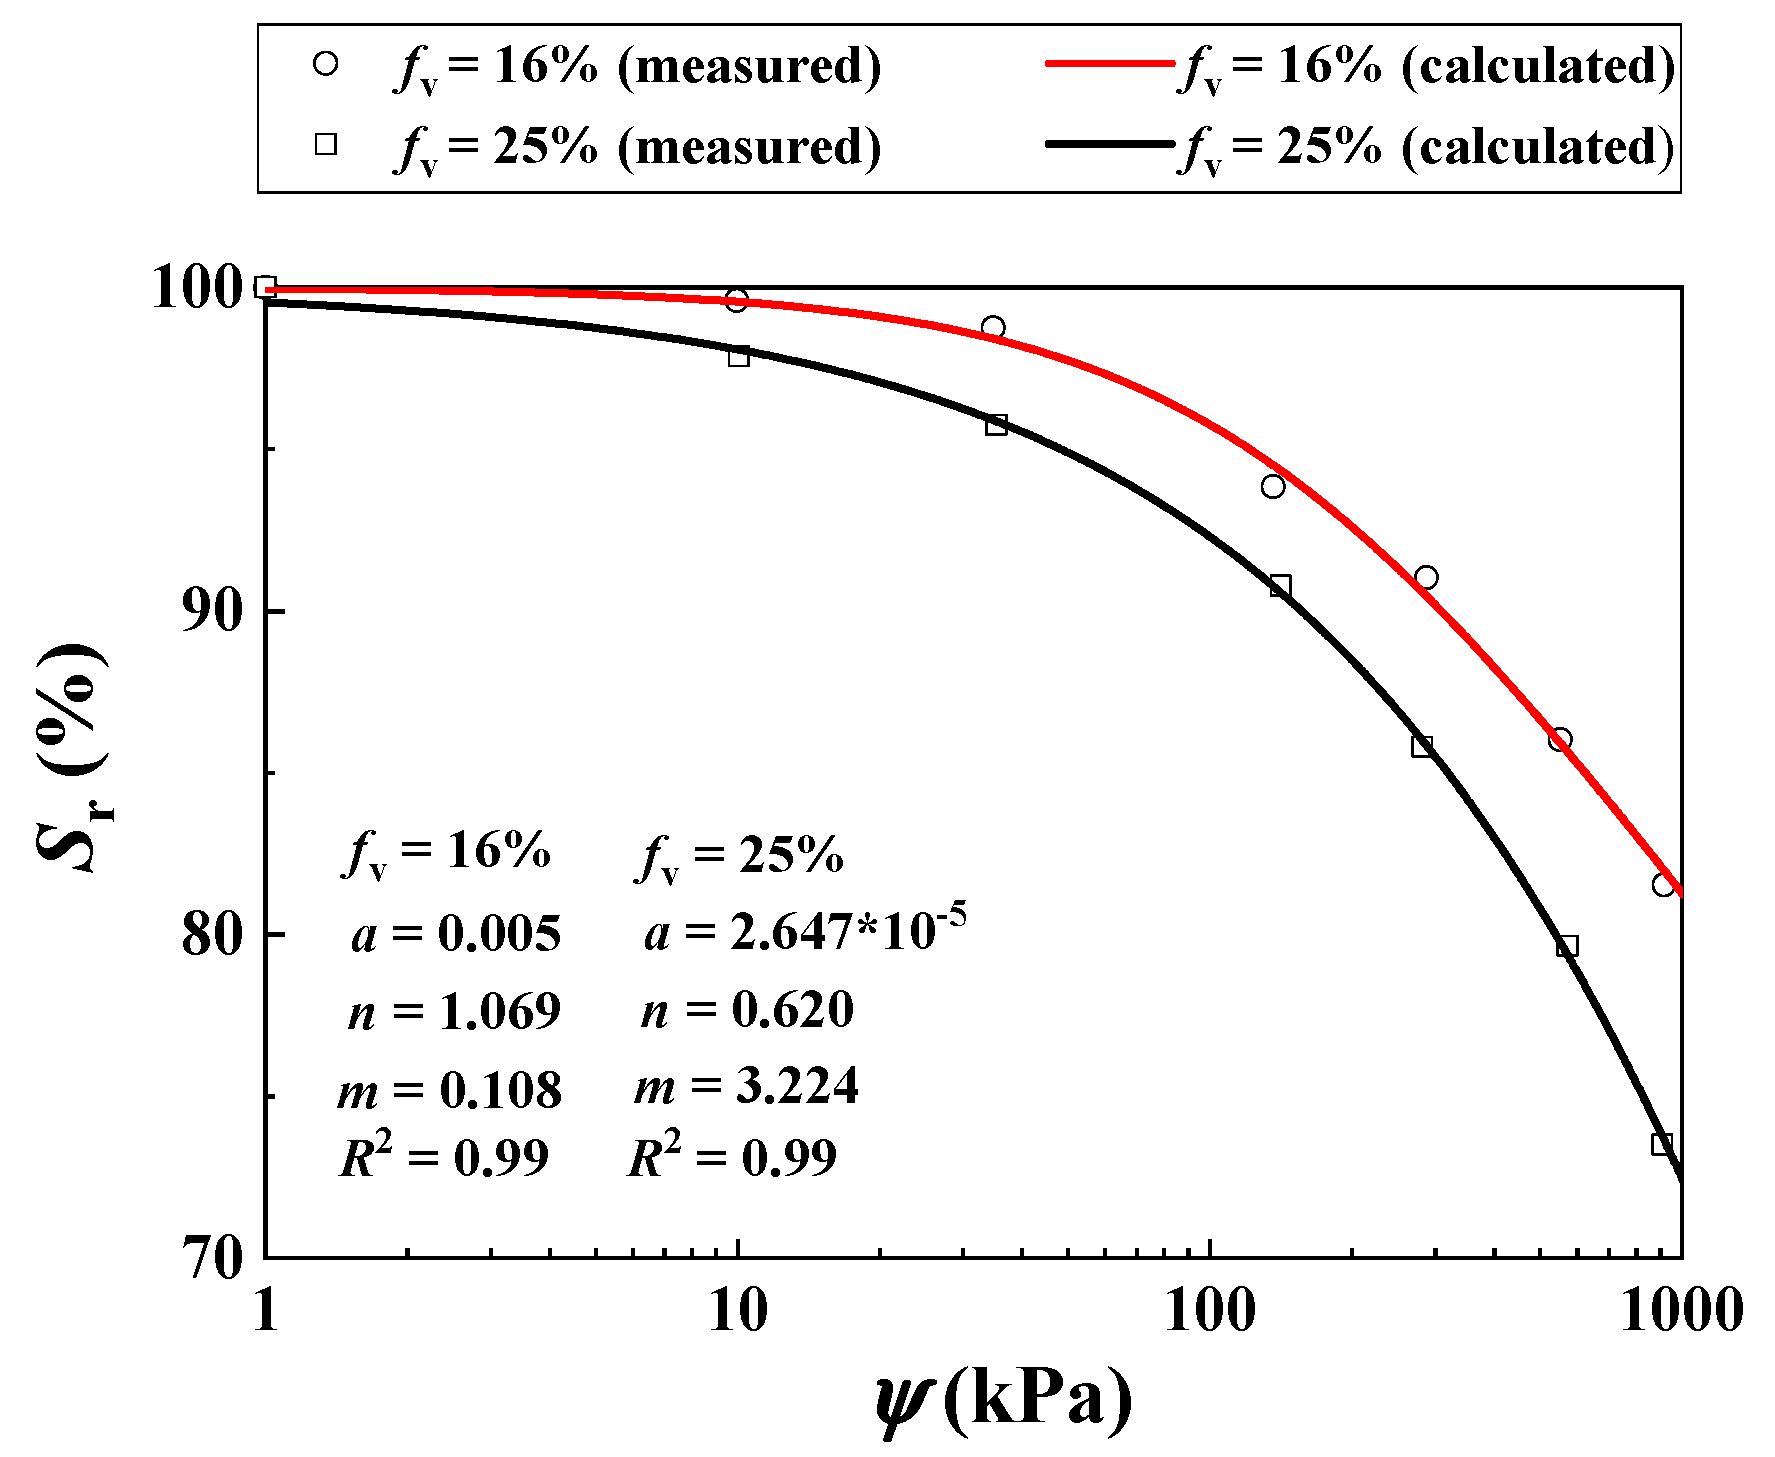
Khalili et al. [30] studied the τ of two unsaturated soil mixtures with varying fv = 16% and 25% using suction-controlled triaxial tests. A constant σ3 = 200 kPa was adopted. The values of = 0, 100, 200 and 400 were considered. When the fv increased from 16% to 25%, the ρd of the mixture increased from 1.69 to 1.91 Mg/m3 (Table 3). Figure 9 compares the measurements and the calculations for the SWRCs for fv = 16% and 25% using Equation (11).
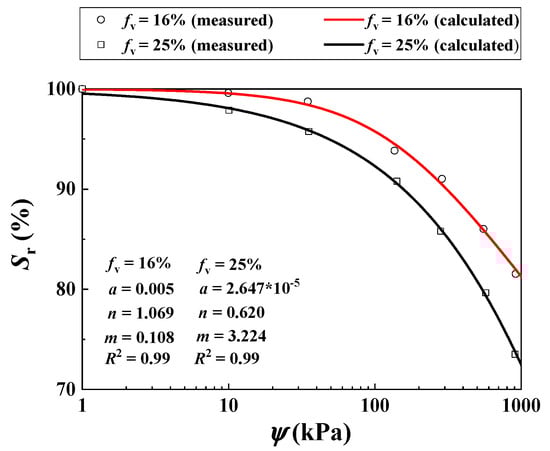
Figure 9.
Measured and calculated SWRCs for the soil mixture with different fv values (data from Khalili et al. [30]).
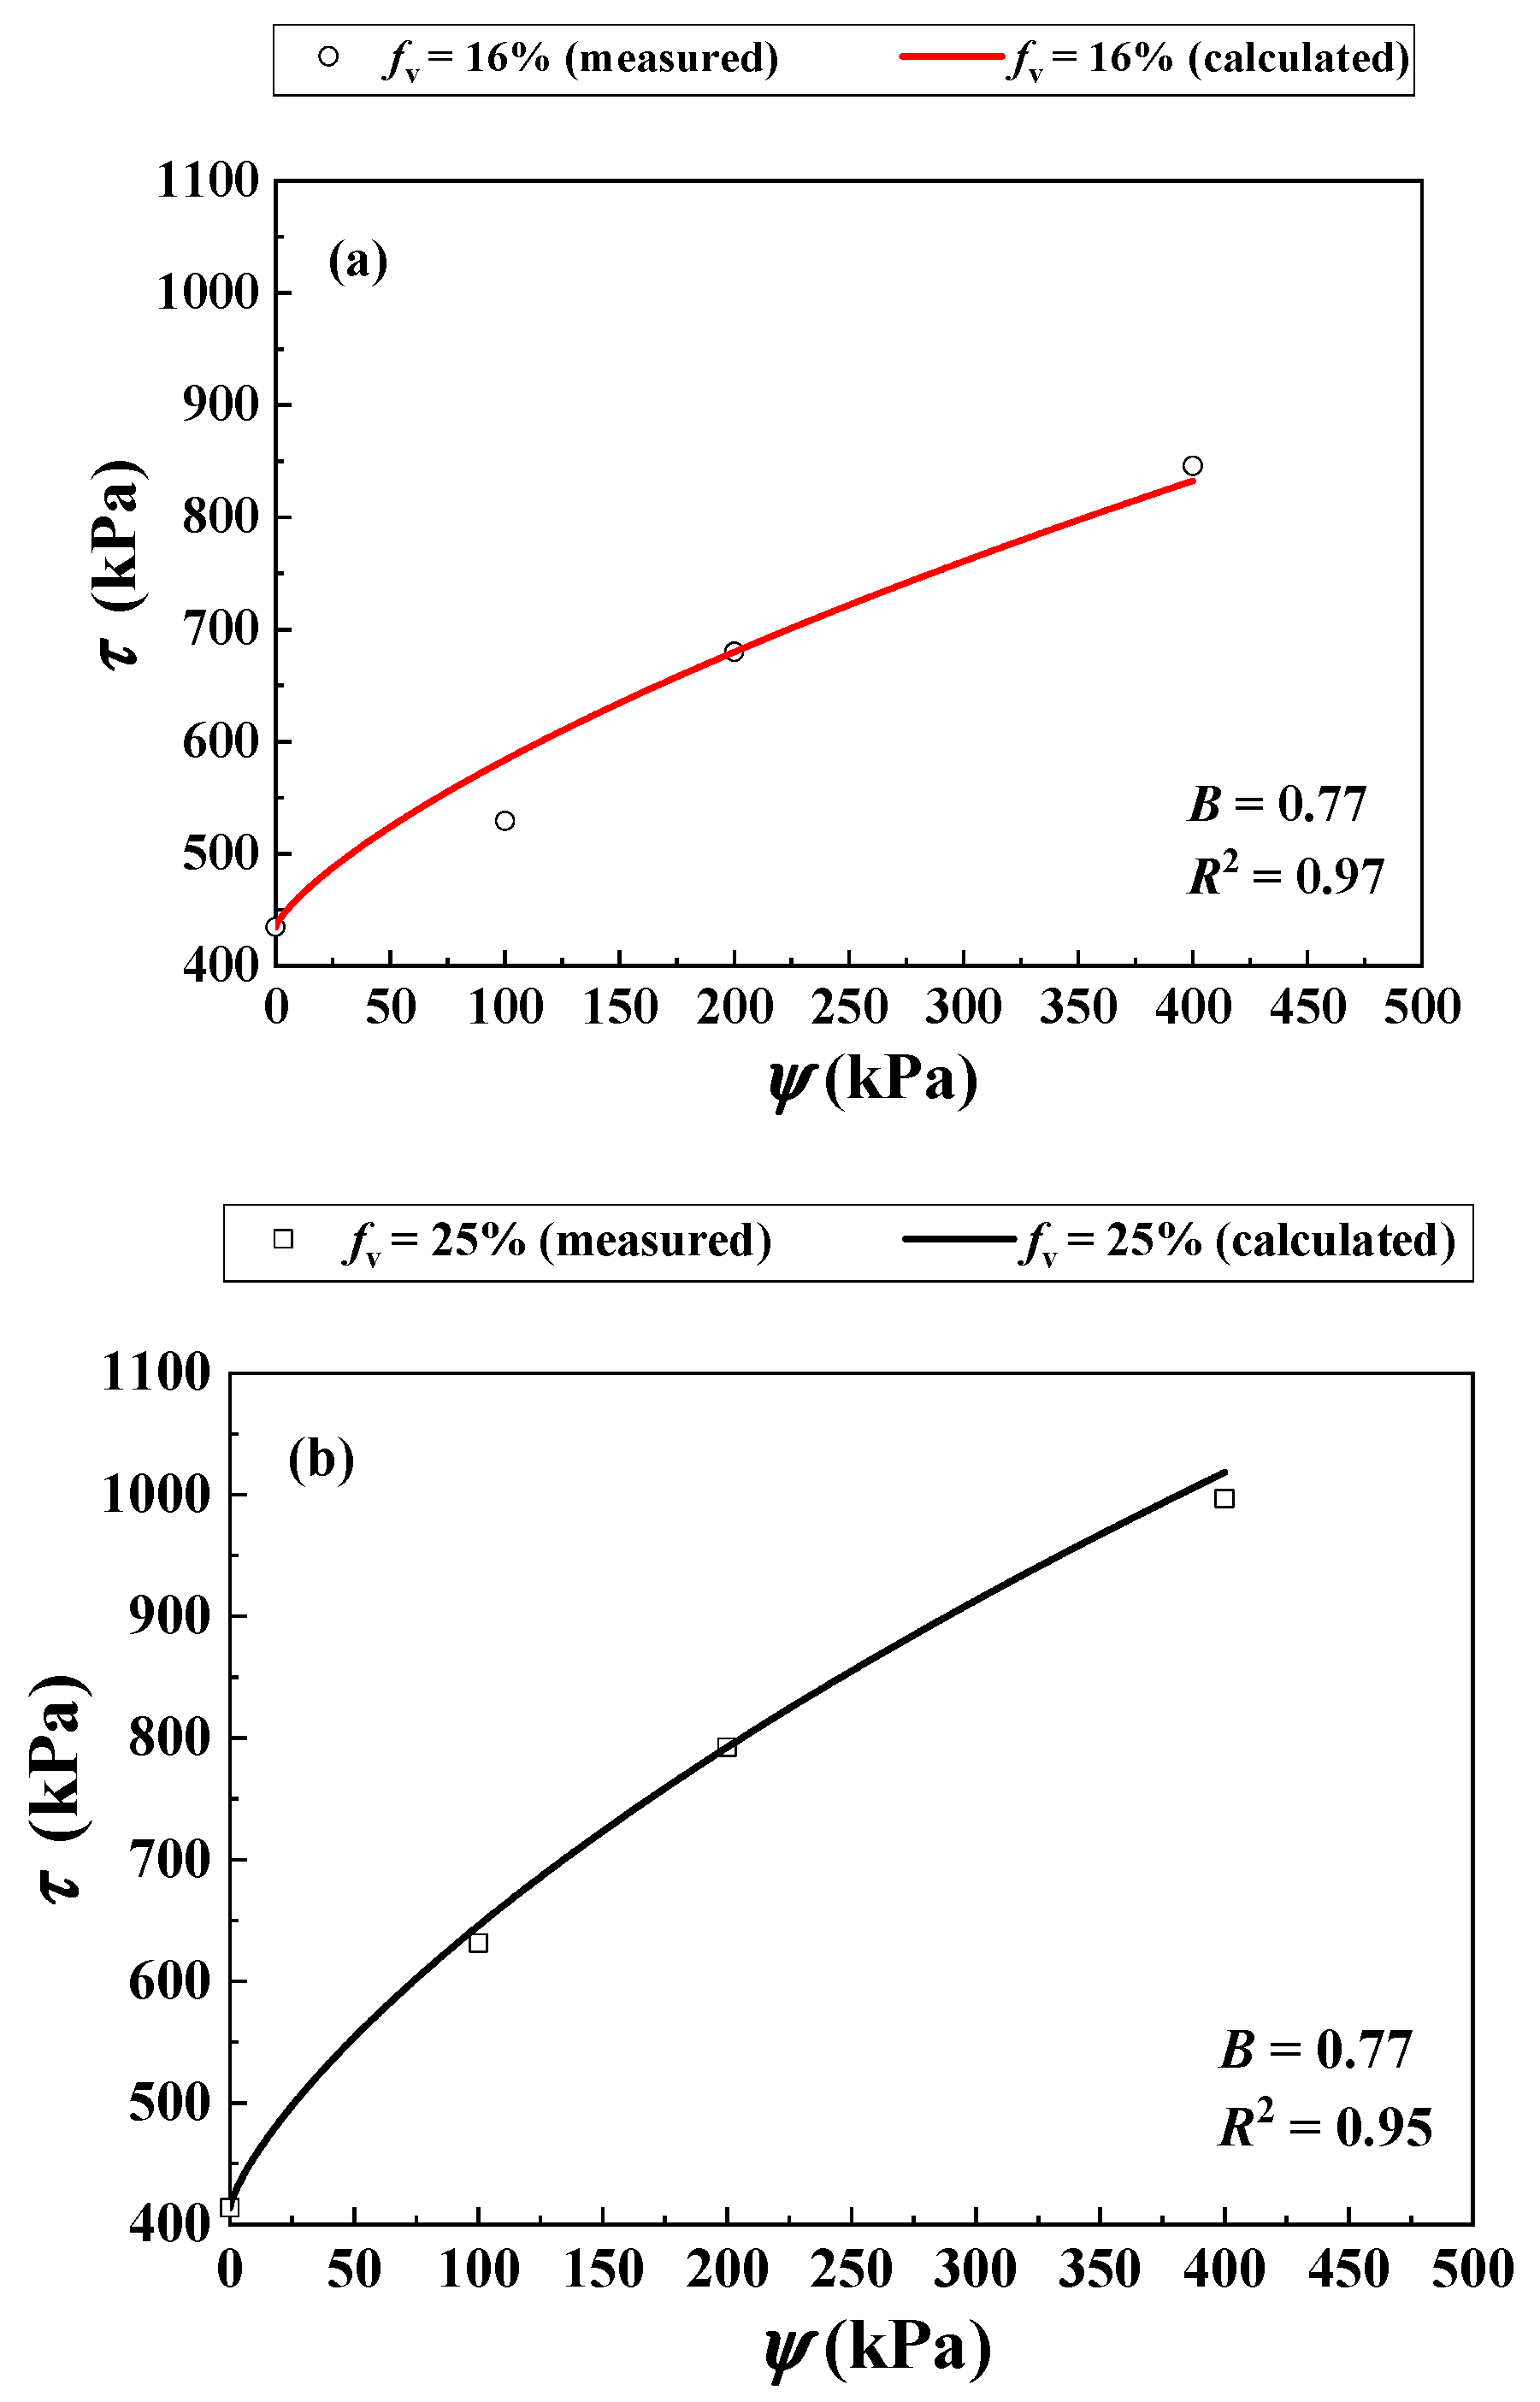
Note that the parameters a, n and m with respect to the SWRC are presented in Table 3. Figure 10a compares the measurements by Khalili et al. [30] and the simulations using the developed Equation (12) for fv = 16%. Equation (12) provided satisfactory simulations using the parameter B = 0.77 with R2 = 0.97.
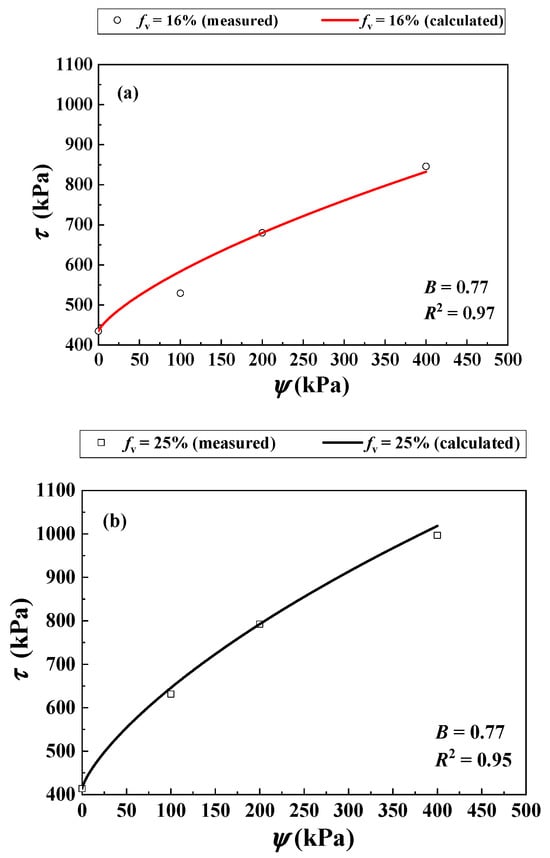
Figure 10.
Comparisons between measured and calculated shear strength of the soil mixture with varying fv and ψ under = 200 kPa: (a) fv = 16%; (b) fv = 25% (data from Khalili et al. [30]).
Figure 10b shows the measured and predicted τ for fv = 25% from Equation (12) using the aforementioned parameter B = 0.77. The comparison shows good agreement (R2 = 0.95).
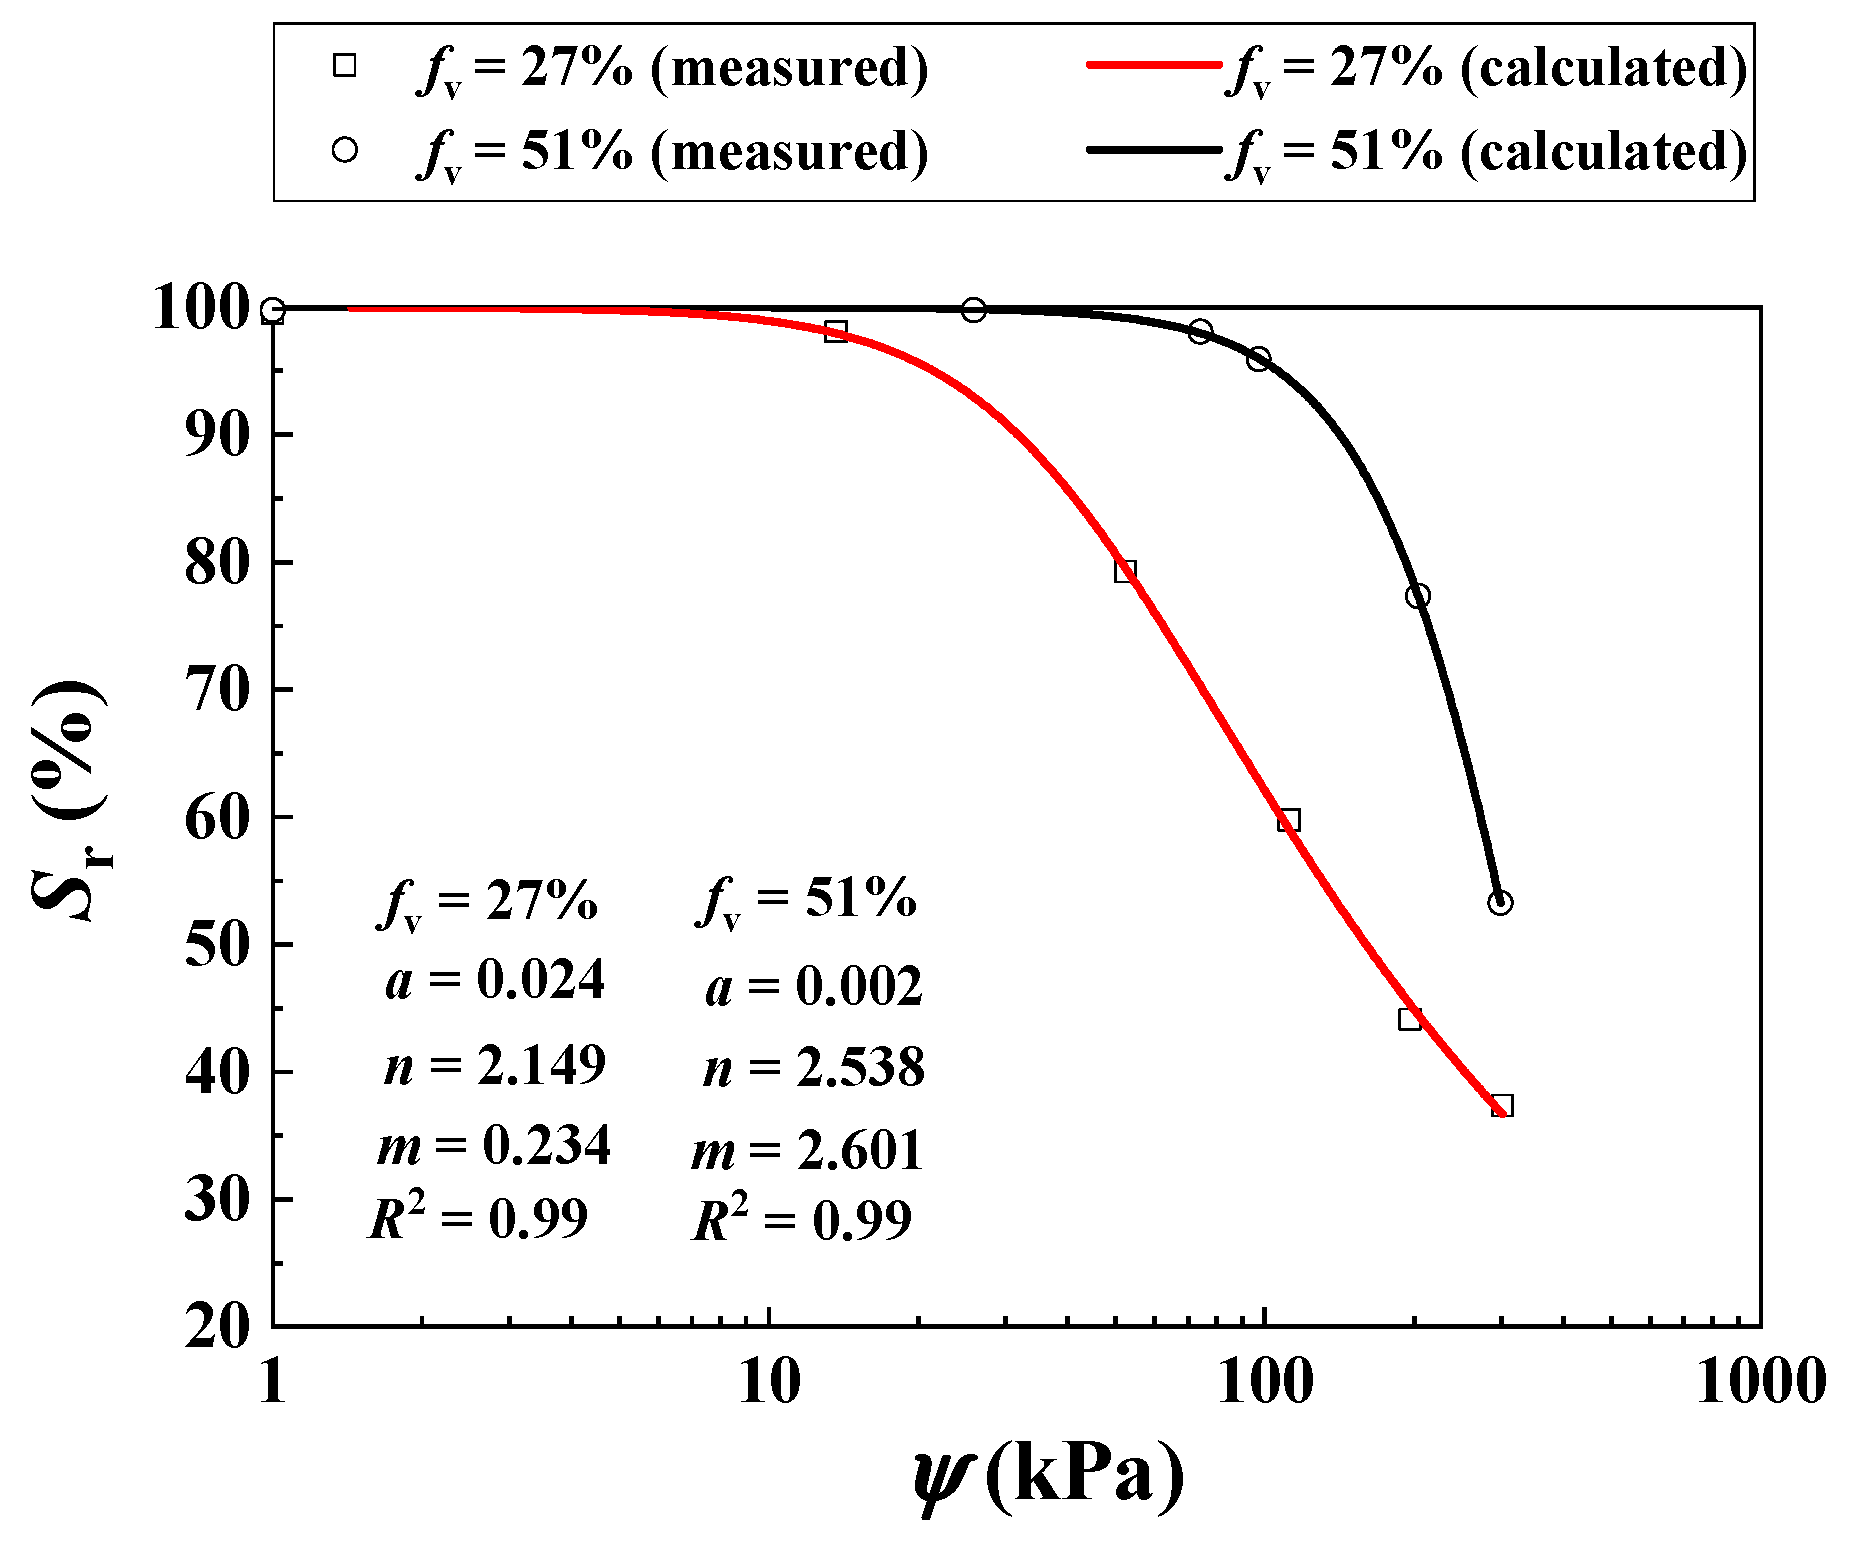
Khalili and Zargarbashi [31] investigated the τ of two unsaturated soil mixtures with varying fv = 27% and 51% using multi-stage shear tests. The σ3 was kept constant at 200 kPa. The values of = 0, 30, 70, 100, 200 and 300 were considered for fv = 27%, while those of = 0, 15, 50, 110, 200 and 300 were considered for fv = 51%. An increment of fv from 27% to 51% induced an increasing ρd of the mixture from 1.53 to 1.63 Mg/m3 (Table 3). Figure 11 presents the SWRCs for fv = 27% and 51%, which was fitted to Equation (11) (see the values of parameters a, n, m in Table 3).
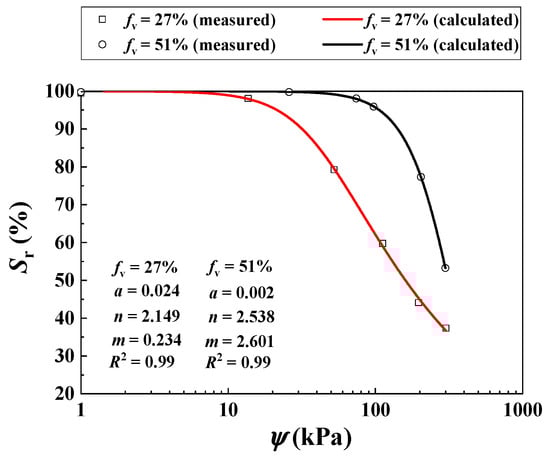
Figure 11.
Measured and calculated SWRCs of the mixture with different fv values (data from Khalili and Zargarbashi [31]).
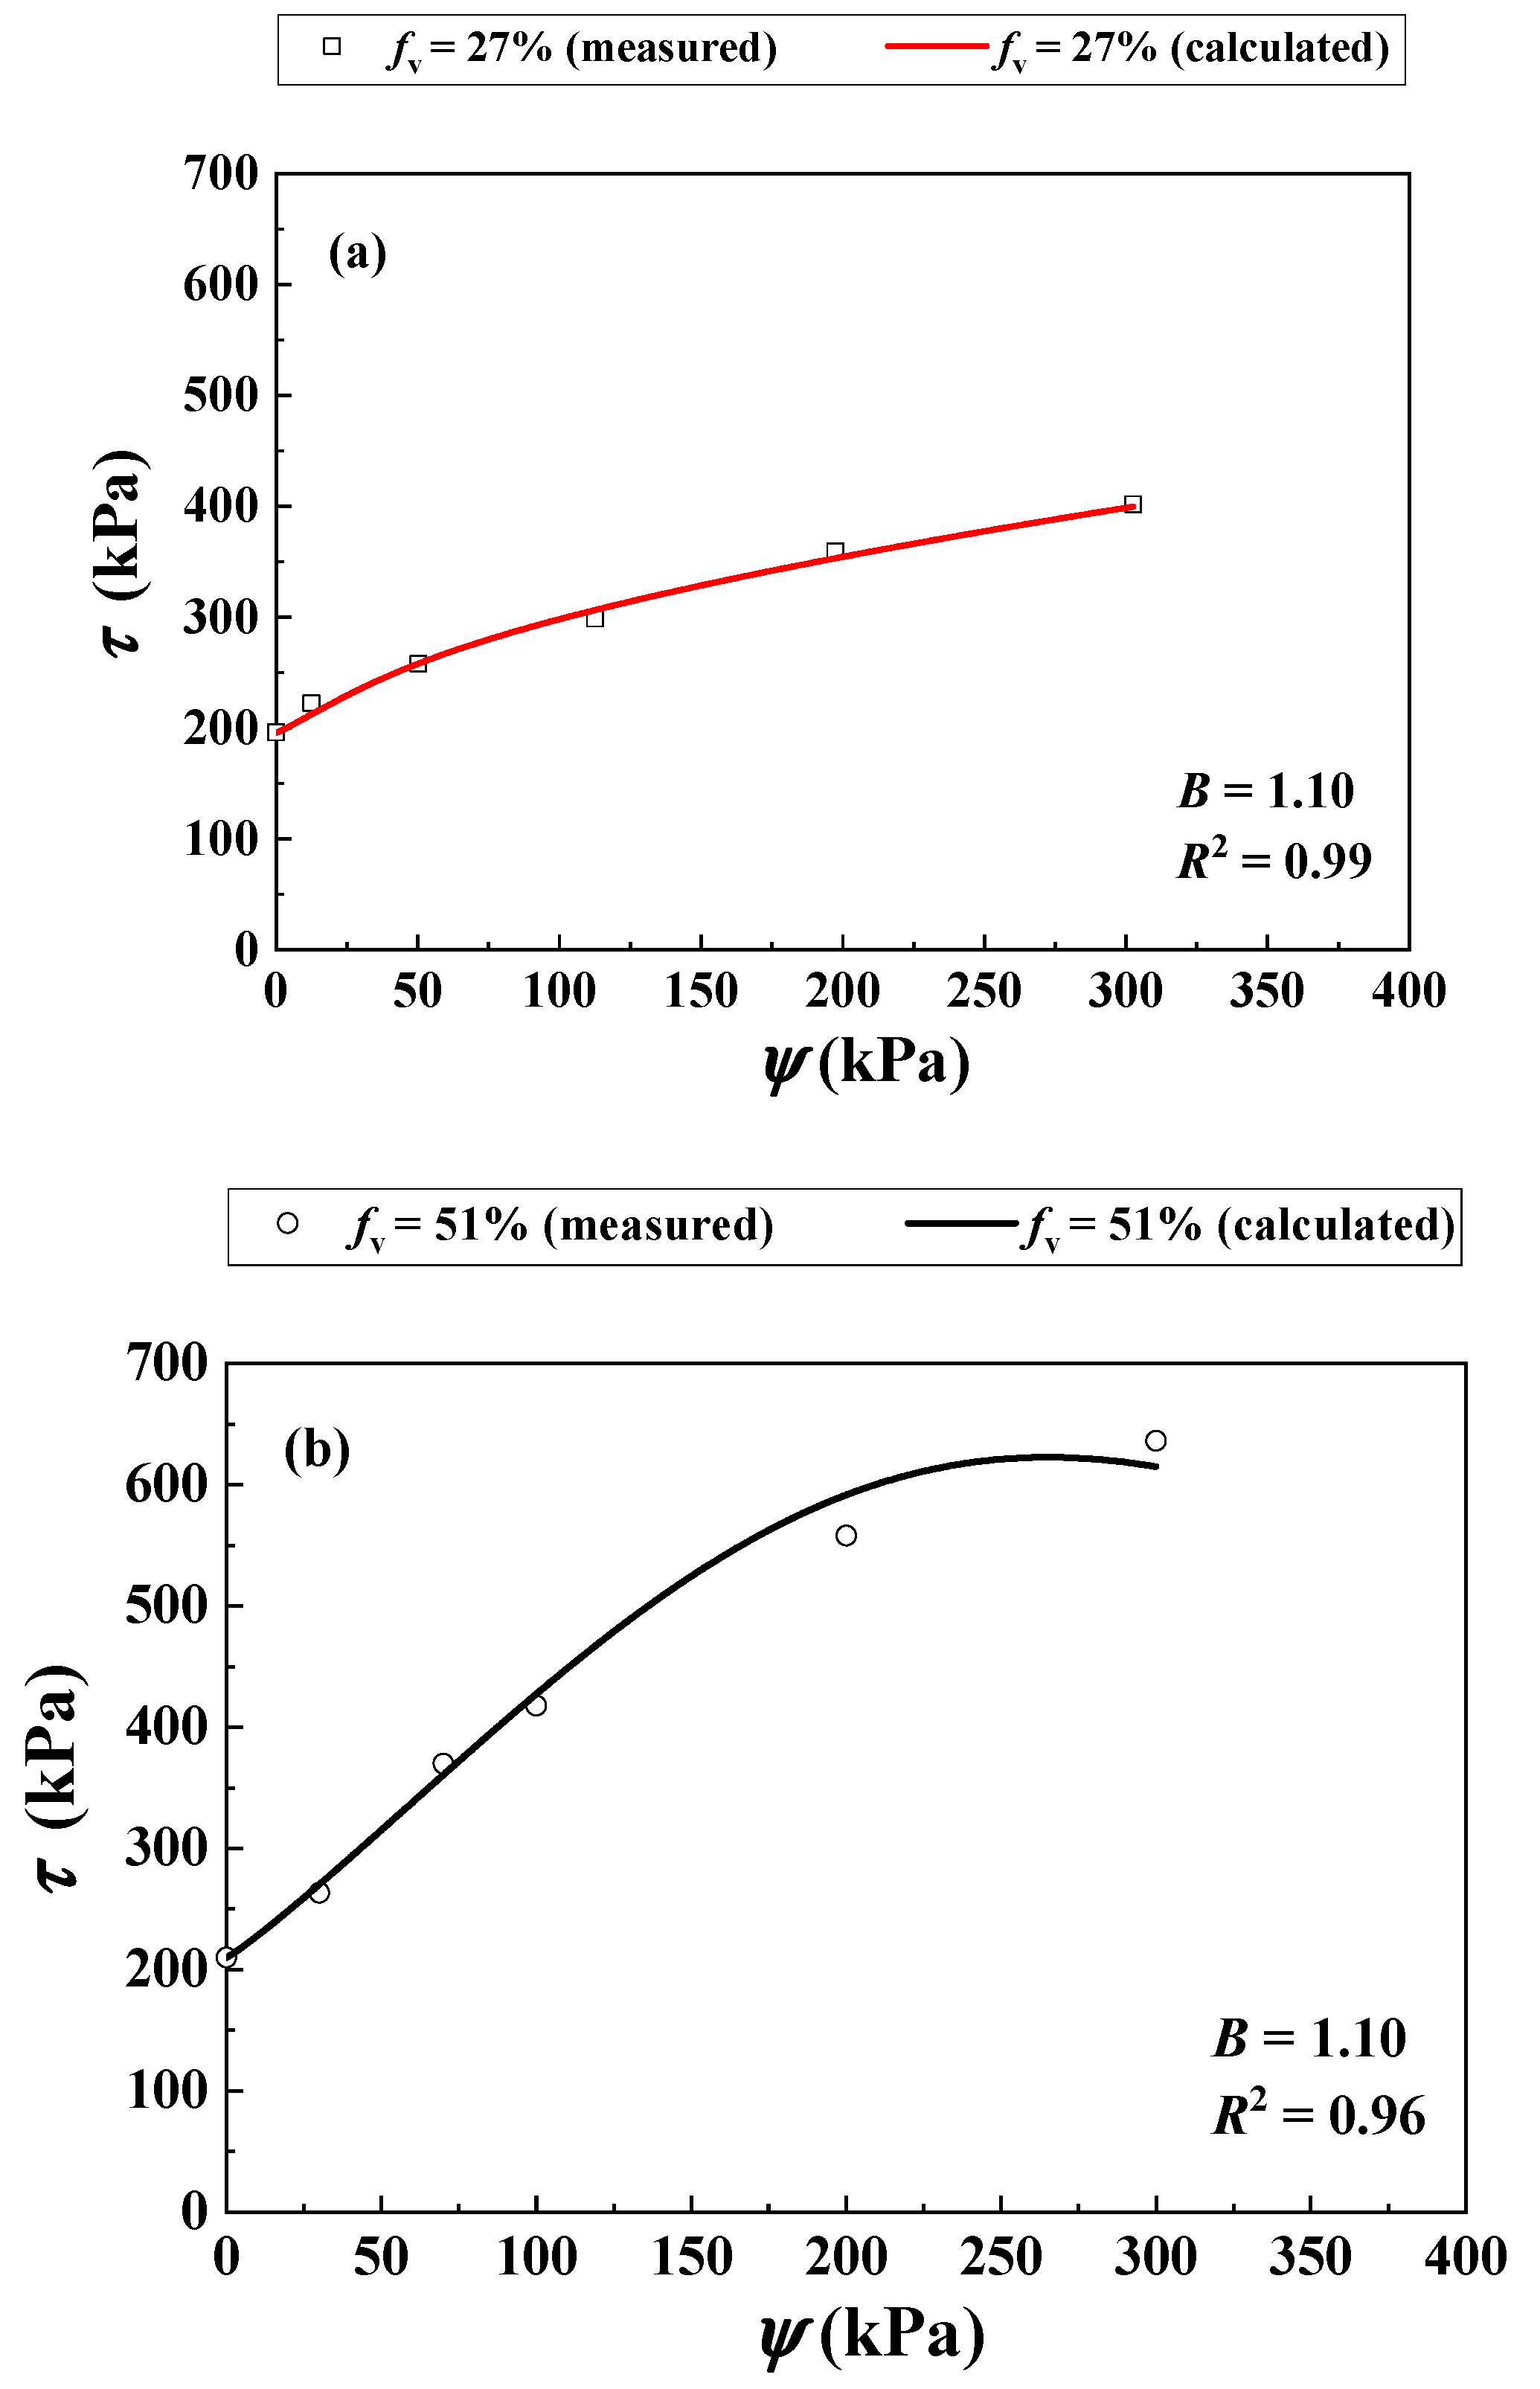
Figure 12a compares the measurements by Khalili and Zargarbashi [30] and the predictions using the developed Equation (12) for fv = 27%. Equation (12) provided a good description using the parameter B = 1.10 (R2 = 0.99).

Figure 12.
Comparisons between measured and calculated shear strength of the soil mixture with varying fv and ψ under = 200 kPa: (a) fv = 27%; (b) fv = 51% (data from Khalili and Zargarbashi [31]).
Figure 12b presents satisfactory agreement between the measured and the calculated τ for fv = 51% using Equation (12) with the aforementioned parameter B = 1.10 (R2 = 0.96).
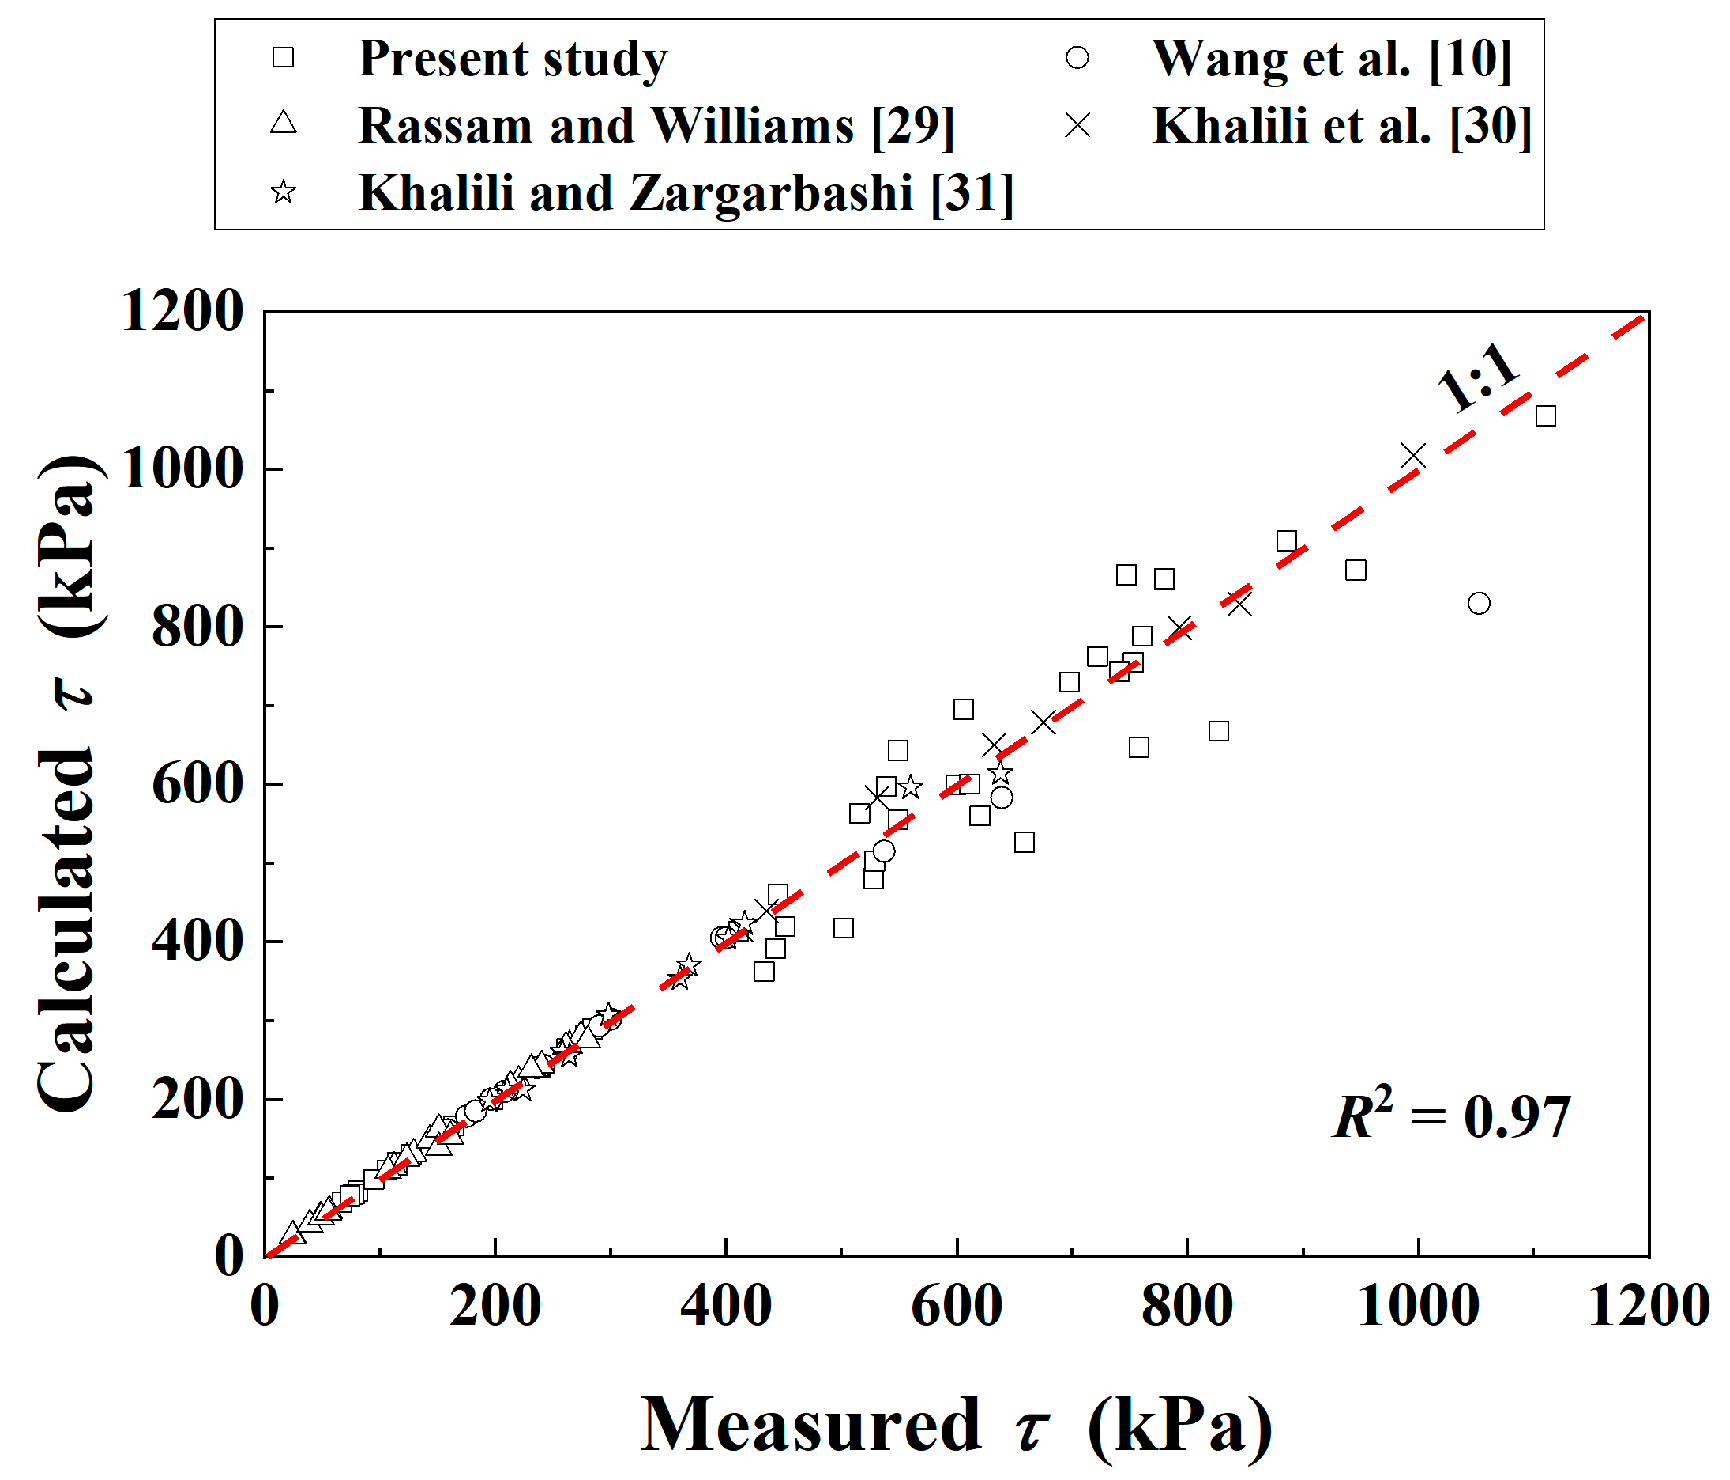
Figure 13 compares the measured and the calculated τ of the soil mixture in all the studies. Good agreement was obtained (R2 = 0.97). The comparisons show the good performance of the developed Equation (12) in describing the τ– relationship of the soil mixture with different fv.
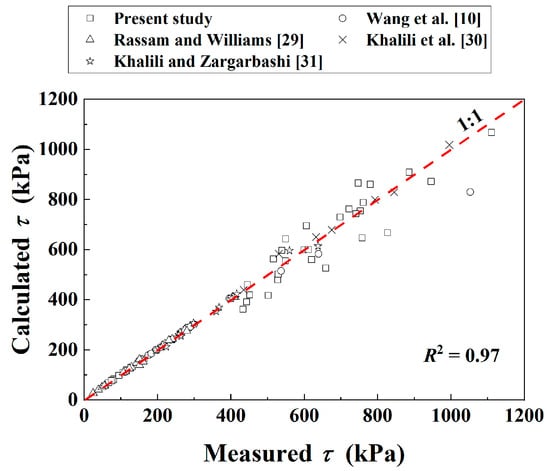
Figure 13.
Comparisons between measured and calculated shear strength of the soil mixture in all studies.
5. Conclusions
Monotonic triaxial tests were fulfilled to investigate the combined influence of fv and w on the τ of the soil mixture. Meanwhile, modelling of the τ of the soil mixture with varying fv was conducted, which was examined using both the experimental results from the present study and those from previous studies. The results allow the following conclusions to be drawn.
It was found that in the present study, increasing the fv led to an increase in the τ of the soil mixture under both saturation and unsaturation. Conversely, Duong et al. [3] reported that incrementally increasing the fv induced an increment in the τ under saturation, but a decline under unsaturation. This was explained by the combined influence of coarse grain content fv and suction : in Duong et al. [3], the increment in fv contributed to a decline in ρd–f and, thus, a decline in . While the negative influence of the declining outweighed the positive influence of the increasing fv, the τ of the soil mixture decreased. However, an unchanged ρd–f = 1.82 Mg/m3 was controlled in the present study. The incrementally increasing fv contributed to an increment in the τ under both saturation and unsaturation, due to its only positive reinforcement influence.
Modelling of the τ of the mixture with various fv was performed by incorporating the SWRC. The combined influence of the ρd–f and w on the τ was reflected by the influence of the . This model was examined using the experimental results from both the present study and previous studies. Comparisons between the measurements and the predictions show the satisfactory performance of the developed model for the description of the τ– relationship of the soil mixture with varying fv.
Author Contributions
Writing—original draft, Y.S.; Writing—review & editing, J.D.; Formal analysis, B.H. and F.Z. All authors have read and agreed to the published version of the manuscript.
Funding
This work was supported by the National Natural Science Foundation of China (Nos. 52208347 and 52208348), Jiangxi Provincial Natural Science Foundation (Nos. 20224BAB214063, 20224BAB214064 and 20232BAB204083) and China Postdoctoral Science Foundation (No. 2023M731436).
Institutional Review Board Statement
Not applicable.
Informed Consent Statement
Not applicable.
Data Availability Statement
Not applicable.
Conflicts of Interest
The authors declare no conflict of interest.
Notations
| c | apparent cohesion |
| effective cohesion | |
| axial strain | |
| volumetric strain | |
| fv | volumetric coarse grain content |
| fv-cha | characteristic volumetric coarse grain content |
| Gs | specific gravity |
| Ip | plasticity index |
| ρd | dry density of sample |
| ρd–f | dry density of fine soil |
| ρdmax-f | maximum dry density of fine soil |
| q | deviator stress |
| τ | shear stress |
| τsat | shear stress under saturated condition |
| τref | shear stress under referenced condition |
| Sr | degree of saturation |
| Sr-r | residual degree of saturation |
| effective degree of saturation | |
| effective degree of saturation under a referenced state | |
| w | water content of soil mixture |
| wf | water content of fine soil |
| wopt-f | optimum water content of fine soil |
| wL | liquid limit |
| χ | effective stress parameter |
| confining pressure | |
| φ | friction angle |
| effective friction angle | |
| suction | |
| ref | suction under referenced state |
References
- Trinh, V.N. Comportement Hydromecanique des Materiaux Constitutifs de Plateformes Ferroviaires Anciennes. Ph.D. Thesis, Ecole Nationale des Ponts et Chaussées, Université Paris-Est, Paris, France, 2011. [Google Scholar]
- Trinh, V.N.; Tang, A.M.; Cui, Y.J.; Dupla, J.C.; Canou, J.; Calon, N.; Lambert, L.; Robinet, A.; Schoen, O. Mechanical characterisation of the fouled ballast in ancient railway track substructure by large-scale triaxial tests. Soils Found. 2012, 52, 511–523. [Google Scholar] [CrossRef]
- Duong, T.V.; Tang, A.M.; Cui, Y.J.; Trinh, V.N.; Dupla, J.C.; Calon, N.; Canou, J.; Robinet, A. Effects of fines and water contents on the mechanical behavior of interlayer soil in ancient railway sub-structure. Soils Found. 2013, 53, 868–878. [Google Scholar] [CrossRef]
- Qi, S.; Cui, Y.J.; Chen, R.P.; Wang, H.L.; Lamas-Lopez, F.; Aimedieu, P.; Dupla, J.C.; Canou, J.; Saussine, G. Influence of grain size distribution of inclusions on the mechanical behaviours of track-bed materials. Géotechnique 2020, 70, 238–247. [Google Scholar] [CrossRef]
- Qi, S.; Cui, Y.J.; Dupla, J.C.; Chen, R.P.; Wang, H.L.; Su, Y.; Lamas-Lopez, F.; Canou, J. Investigation of the parallel gradation method based on the response of track-bed materials under cyclic loadings. Transp. Geotech. 2020, 24, 100360. [Google Scholar] [CrossRef]
- Wan, Z.; Bian, X.; Li, S.; Chen, Y.; Cui, Y. Remediation of mud pumping in ballastless high-speed railway using polyurethane chemical injection. Constr. Build. Mater. 2020, 259, 120401. [Google Scholar] [CrossRef]
- Bian, X.; Wan, Z.; Zhao, C.; Cui, Y.; Chen, Y. Mud pumping in the roadbed of ballastless high-speed railway. Géotechnique 2021, 73, 614–628. [Google Scholar] [CrossRef]
- Vallejo, L.E. Interpretation of the limits in shear strength in binary granular mixtures. Can. Geotech. J. 2001, 38, 1097–1104. [Google Scholar] [CrossRef]
- Seif El Dine, B.; Dupla, J.C.; Frank, R.; Canou, J.; Kazan, Y. Mechanical characterization of matrix coarse-grained soils with a large-sized triaxial device. Can. Geotech. J. 2010, 47, 425–438. [Google Scholar] [CrossRef]
- Wang, H.L.; Cui, Y.J.; Lamas-Lopez, F.; Calon, N.; Saussine, G.; Dupla, J.C.; Canou, J.; Aimedieu, P.; Chen, R.P. Investigation on the mechanical behavior of track-bed materials at various contents of coarse grains. Constr. Build. Mater. 2018, 164, 228–237. [Google Scholar] [CrossRef]
- Abramento, M.; Carvalho, C.S. Geotechnical parameters for the study of natural slopes instabilization at ‘Serra do Mar’, Brazil. In Congrès Intrnational de Mécanique des Sols et des Travaux de Fondations; A.A. Balkema: Rotterdam, The Netherlands, 1989; Volume 12, pp. 1599–1602. [Google Scholar]
- Vanapalli, S.K.; Fredlund, D.G.; Pufahl, D.E.; Clifton, A.W. Model for the prediction of shear strength with respect to soil suction. Can. Geotech. J. 1996, 33, 379–392. [Google Scholar] [CrossRef]
- Vilar, O.M. A simplified procedure to estimate the shear strength envelope of unsaturated soils. Can. Geotech. J. 2006, 43, 1088–1095. [Google Scholar] [CrossRef]
- Han, Z.; Vanapalli, S.K. Stiffness and shear strength of unsaturated soils in relation to soil-water characteristic curve. Géotechnique 2016, 66, 627–647. [Google Scholar] [CrossRef]
- Wang, H.L.; Cui, Y.J.; Lamas-Lopez, F.; Dupla, J.C.; Canou, J.; Calon, N.; Saussine, G.; Aimedieu, P.; Chen, R.P. Permanent deformation of track-bed materials at various inclusion contents under large number of loading cycles. J. Geotech. Geoenviron. Eng. 2018, 144, 04018044. [Google Scholar] [CrossRef]
- Su, Y.; Cui, Y.J.; Dupla, J.C.; Canou, J.; Qi, S. Developing a Sample Preparation Approach to Study the Mechanical Behavior of Unsaturated Fine/Coarse Soil Mixture. Geotech. Test. J. 2021, 44, 20190450. [Google Scholar] [CrossRef]
- Han, Z.; Vanapalli, S.K. Relationship between resilient modulus and suction for compacted subgrade soils. Eng. Geol. 2016, 211, 85–97. [Google Scholar] [CrossRef]
- Yang, S.R.; Huang, W.H.; Tai, Y.T. Variation of resilient modulus with soil suction for compacted subgrade soils. Transp. Res. Rec. 2005, 1913, 99–106. [Google Scholar] [CrossRef]
- Yang, S.R.; Lin, H.D.; Kung, J.H.; Huang, W.H. Suction-controlled laboratory test on resilient modulus of unsaturated compacted subgrade soils. J. Geotech. Geoenviron. Eng. 2008, 134, 1375–1384. [Google Scholar] [CrossRef]
- Su, Y.; Cui, Y.J.; Dupla, J.C.; Canou, J. Soil-water retention behaviour of fine/coarse soil mixture with varying coarse grain contents and fine soil dry densities. Can. Geotech. J. 2022, 59, 291–299. [Google Scholar] [CrossRef]
- Van Genuchten, M.T. A closed-form equation for predicting the hydraulic conductivity of unsaturated soils. Soil Sci. Soc. Am. J. 1980, 44, 892–898. [Google Scholar] [CrossRef]
- ASTM D7181-11; Standard Test Method for Consolidated Drained Triaxial Compression Test for Soils (Superseded). ASTM International: West Conshohocken, PA, USA, 2011. [CrossRef]
- Delage, P.; Audiguier, M.; Cui, Y.J.; Howat, M.D. Microstructure of a compacted silt. Can. Geotech. J. 1996, 33, 150–158. [Google Scholar] [CrossRef]
- Ng, C.W.W.; Baghbanrezvan, S.; Sadeghi, H.; Zhou, C.; Jafarzadeh, F. Effect of specimen preparation techniques on dynamic properties of unsaturated fine-grained soil at high suctions. Can. Geotech. J. 2017, 54, 1310–1319. [Google Scholar] [CrossRef]
- Öberg, A.L.; Sallfors, G. Determination of shear strength parameters of unsaturated silts and sands based on the water retention curve. Geotech. Test. J. 1997, 20, 40–48. [Google Scholar]
- Xu, Y.F.; Sun, D.A. A fractal model for soil pores and its application to determination of water permeability. Phys. A Stat. Mech. Appl. 2002, 316, 56–64. [Google Scholar] [CrossRef]
- Alonso, E.E.; Pereira, J.M.; Vaunat, J.; Olivella, S. A microstructurally based effective stress for unsaturated soils. Géotechnique 2010, 60, 913–925. [Google Scholar] [CrossRef]
- Lu, N.; Godt, J.W.; Wu, D.T. A closed-form equation for effective stress in unsaturated soil. Water Resour. Res. 2010, 46. [Google Scholar] [CrossRef]
- Rassam, D.W.; Williams, D.J. A relationship describing the shear strength of unsaturated soils. Can. Geotech. J. 1999, 36, 363–368. [Google Scholar] [CrossRef]
- Khalili, N.G.F.A.; Geiser, F.; Blight, G.E. Effective stress in unsaturated soils: Review with new evidence. Int. J. Geomech. 2004, 4, 115–126. [Google Scholar] [CrossRef]
- Khalili, N.; Zargarbashi, S. Influence of hydraulic hysteresis on effective stress in unsaturated soils. Géotechnique 2010, 60, 729–734. [Google Scholar] [CrossRef]

Disclaimer/Publisher’s Note: The statements, opinions and data contained in all publications are solely those of the individual author(s) and contributor(s) and not of MDPI and/or the editor(s). MDPI and/or the editor(s) disclaim responsibility for any injury to people or property resulting from any ideas, methods, instructions or products referred to in the content. |
© 2023 by the authors. Licensee MDPI, Basel, Switzerland. This article is an open access article distributed under the terms and conditions of the Creative Commons Attribution (CC BY) license (https://creativecommons.org/licenses/by/4.0/).