Abstract
Many endothermic liquid–liquid transitions, occurring at a temperature Tn+ above the melting temperature Tm, are related to previous exothermic transitions, occurring at a temperature Tx after glass formation below Tg, with or without attached crystallization and predicted by the nonclassical homogenous nucleation equation. A new thermodynamic phase composed of broken bonds (configurons), driven by percolation thresholds, varying from ~0.145 to Δε, is formed at Tx, with a constant enthalpy up to Tn+. The liquid fraction Δε is a liquid glass up to Tn+. The solid phase contains glass and crystals. Molecular dynamics simulations are used to induce, in NiTi2, a reversible first-order transition by varying the temperature between 300 and 1000 K under a pressure of 1000 GPa. Cooling to 300 K, without applied pressure, shows the liquid glass presence with Δε = 0.22335 as memory effect and Tn+ = 2120 K for Tm = 1257 K.
1. Introduction
The classical homogenous nucleation (CHN) equation [1,2,3,4] cannot be applied above the melting temperature Tm because the melt is viewed as being homogenous, excluding the presence of intrinsic nuclei such as superclusters and superatoms, inducing crystallization after undercooling and liquid–liquid transitions above Tm [5]. The liquid–liquid transitions cannot be related to a first-order transition occurring below Tm. The undercooling of liquid elements gradually increases with overheating and reaches an undercooling plateau, which is attributed to heterogenous nucleation from oxide impurities, surface cavities, and growth kinetics dependent with the size instead of homogenous nucleation [6]. Scientists were quasi-unanimous at the end of 20th century, adopting CHN, believing that the glassy state results from liquid freezing instead of homogenous nucleation of phase transition.
The undercooling plateau is defined by the weakest reduced temperature θ = (T − Tm)/Tm where the crystallization occurs for a volume v and a nucleation time t depending on the cooling rate. The product θ2 (1 + θ) for vt = 10−8 ± 1 m3s in the CHN equation is a linear function of α3Sm where α is proportional to the surface energy of the growth nuclei and Sm is the entropy of melting of 38 elements. In fact, this law, deduced from the CHN equation, excludes the heterogenous nucleation and promotes the homogenous nucleation and the presence of intrinsic nuclei in melts [7].
The nonclassical homogenous nucleation (NCHN) equation includes the possible presence of homogeneous nuclei, introducing in the classical equation their contribution to the Gibbs free energy [7]. The homogenous nucleation temperatures (Tn−) are defined by equations of two liquid states, Liquid 1 and Liquid 2 [5,8,9,10,11]. The formation of glassy phases occurs by percolation of bonds at Tg during the first cooling [12,13,14]. After quenching the melt below Tg, the enthalpy of formation of all bonds can relax. There are two homogeneous nucleation temperatures in Liquid 2. The highest is (Tn− = Tg); the lowest is the temperature where this enthalpy excess begins to be recovered using a slow heating rate. The enthalpy excesses and the recovery temperatures are found in several glasses [15,16,17,18,19,20,21,22]. The glass phase is stabilized after relaxation below the percolation threshold of broken bonds named configurons, occurring during the first heating at Tg. The specific heat undergoes a second-order phase transition at Tg with critical exponents during heating which are absent during the first cooling [23,24,25,26]. The formation of the glass phase after relaxation and broken bonds during heating is governed by the presence of a new phase, initially called Phase 3, discovered in supercooled water [27,28], having an enthalpy coefficient Δεlg equal to the difference between those of Liquids 1 and 2 and defining the configuron enthalpy (Δεlg Hm) [29].
The second class of homogenous nucleation reduced temperatures θn+ above θ = 0 respects the relation with the configuron enthalpy coefficient (Δεlg Hm= θn+ Hm) and (Hm) the melting heat of surviving entities and crystals. The configuron phase (Phase 3) undergoes a first-order transition characterized by an endothermic or exothermic latent heat equal to |θn + Hm|. Consequently, the relation (−Δεlg = θn+) is also respected because Δεlg can be positive or negative [11]. The reduced temperature θn+ above θ = 0 is equal to the Scher and Zallen percolation threshold of configurons [15,30].
Exothermic transitions are induced below Tm during heating or cooling, depending on the heating and cooling rates. Undercooling with or without crystallization is observed during the first cooling depending on the cooling rate. The enthalpy coefficient Δεlg, equal to singular values of Phase 3, results from this first-order transition [31]. Heating from the glass state can produce a first-order transition between Tm and Tg with or without crystallization. The fraction Δεlg is involved in the formation of a liquid glass up to Tn+ and the crystallized fraction (1 − Δεlg) melts at Tm [32]. The glass fraction stabilizes nanocrystallization of any material because Tn+ is higher than Tm. For example, volcanic rocks are composed of crystals of various sizes surrounded by glasses containing variable fractions of SiO2.
A liquid glass is created by a first-order transition of the configuron phase to stabilize its enthalpy to a negative singular value (−Δεlg) up to Tn+ with a specific heat equal to zero. The upper limit of Δεlg is defined by T′g/Tm, the glass transition temperature of the liquid glass being equal to (T′g = 2 Tm − Tg) [33,34].
Our project in this paper is to induce a first-order transition under extreme pressures in NiTi2 by molecular dynamics simulations and observe the stabilization of the liquid glass, varying the temperature under constant pressure to induce a memory effect [35]. The choice of NiTi2 is guided by molecular dynamics simulations showing that the glass transition occurs at (Tg = 800 K) at high cooling rate, revealing structural changes via radial distribution functions at (Tg) [36].
2. Predictions of NCHN and Configuron Models
2.1. The Nonclassical Homogeneous Nucleation (NCHN) and the Classical Homogeneous Nucleation (CHN)
In the NCHN equation, the Gibbs free energy change for a nucleus formation in a melt is given by Equation (1) [7]:
where R is the nucleus radius and following Turnbull [1], σls is its surface energy for εls = 0, given by Equation (2), θ is the reduced temperature (T − Tm)/Tm, Hm is the enthalpy of melting at Tm, and Vm is the molar volume:
The complementary enthalpy εls × Hm/Vm, introduced in the classical homogeneous nucleation (CHN) equation, authorizes the presence of growth nuclei above Tm. The prediction of an exothermic or endothermic enthalpy change, at the same temperature Tn+ above Tm, viewed as due to the presence of antibonds or bonds, sets the NCHN equation [33]. The CHN equation is obtained for εls = 0, and leads to a homogeneous liquid above Tm in contradiction with the presence, in the liquid above Tm, of first-order transitions, and single crystal formations by cooling overheated liquid droplets.
The nucleation rate (Jvt) in a melt of volume v, after a time t, and the thermally activated energy barrier ΔG*ls/kBT are given in Equations (3) and (4) [4]:
where Sm is the entropy of melting of crystals and condensed entities [4,7]. The critical parameter () is not infinite at the melting temperature Tm when (εls) is present. In this case, this event now occurs above Tm for θ = εls. The nucleation rate is equal to 1, and Ln(Jvt) = 0 when Equation (5) is respected:
The surface energy coefficient αls in Equation (2) is determined from Equations (3)–(5) and equal to Equation (6):
(Smαls3) is effectively proportional to (1 + θ) θ2 with (θ) being the reduced temperature of undercooling of 38 liquid elements, obtained after overheating the melt, using volumes v and time t with vt = 10−8 ± 1 m3s, Kv = 90, Ln (Kvvt) = 71.9 ± 1 in agreement with the predictions of Equation (6), as shown in Figure 1 [4].
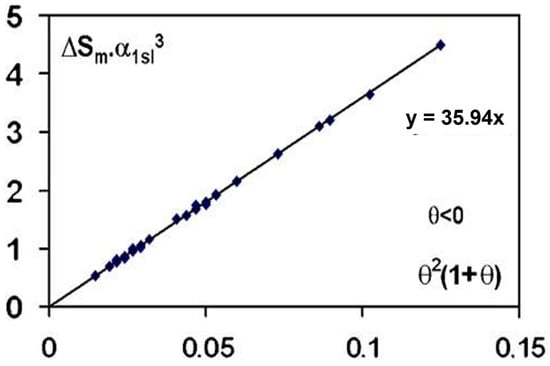
Figure 1.
The quantity α3Sm is plotted as a function of θ2(1 + θ), θ being the algebraic lowest undercooling reduced temperature of 38 elements; α1ls and Sm are, respectively, the dimensionless surface energy and the entropy of melting in JK−1 mole−1. The parameters (θ) have been assembled by [4]. Reproduced from [7], Copyright 2007 Elsevier.
This law is beautifully respected in the two nucleation models and is due to homogeneous nucleation phenomena. The phase diagram of liquid elements predicts these homogenous nucleation temperatures [34]. A first-order transition occurs at the undercooling reduced temperature θ. The exothermic enthalpy is either totally attributed to crystallization with CHN without considering any homogeneous nucleation because the liquid is viewed as being homogenous above Tm, or only partially to the nucleation of a glassy fraction depending on the nucleation temperature of first-order transition with NCHN [29,32,37]. Recent examples of these two approaches are devoted to the undercooling of Pt57Cu23P20 alloy [31,38].
The nucleation temperatures θn− and θn+ in the NCHN model are obtained for d/dθ = 0 and obey Equation (7):
There are two types of homogeneous nucleation temperatures as shown by Equation (7): θn− = (εls − 2)/3 below Tm, and θn+ = εls above Tm. The first one leads to the glass formation temperature, while the second is a nucleation reduced temperature θn+ above Tm obtained in many experiments, observing the undercooling versus the overheating rates of liquid elements, and glass-forming melts [39,40,41,42,43]. These nucleation temperatures predict, for consequence, the existence of second melting temperatures Tn+ of growth nuclei above Tm and their growth below Tm, shown in several publications [11,32,44,45,46,47,48,49,50,51,52,53,54,55,56,57].
2.2. The Enthalpy Coefficients of Two Liquid States Depending on the Glass Transition Temperature at Tg below Tm
The NCHN model describes two liquid states characterized by enthalpy coefficients. The coefficient εls of the initial liquid state called Liquid 1 is a quadratic function of Equation θ in Equation (8) [7]:
where θ0m is the Vogel–Fulcher–Tamann (VFT) reduced temperature leading to εls = 0 for θ = θ0m [8]. (θ20m), minimizing the complementary surface energy, is given in Equation (9) [9]:
with .
The glass transition gives rise to Liquid 2 with a new coefficient εgs, also depending on θ2 in Equation (10) with the second VFT reduced temperature (θ0g) given in Equation (11):
with , as expected with Equation (7), θg is the reduced glass transition temperature, and (εls0) and (εgs0) are values for which the activation energies of Liquids 1 and 2 are equal at Tg, leading to an activation energy equal to zero for the Liquid 3 characterized by Δεlg = (εls − εgs) [29].
2.3. Formation of New Phases through First-Order Transitions below Tm
First-order transitions are observed below Tm, depending on the heating rate. They lead to new glassy phases having a weaker enthalpy than that of the initial glass state, which is equal to zero. The enthalpy coefficient Δεlg is equal to −Δε after the transition, and the first-order transition reduced temperature θx is determined with Equation (12):
where εgs0 is the enthalpy coefficient of Liquid 2 at θ = 0 given in Equation (10). This first-order reduced temperature is called θx, even if it is not accompanied by crystallization.
This equation is used after application of very high temperatures, and the undercooling reduced temperature is directly equal to θx and Δεlg = −Δε (see for example [31]).
2.4. The Glassy State of Phase 3 Up to the Melting Temperature Tn+ above Tm
The difference Δεlg in Equation (13) between the coefficients εls and εgs determines the enthalpy coefficient of Phase 3 during heating and the configuron enthalpies when the quenched liquid has escaped crystallization:
This phase explains the homogenous nucleation of phase transformations in supercooled water [28], and corresponds to the enthalpy coefficients of broken bonds (configurons) at the glass transition [29].
In the absence of first-order transition below Tm during the first heating, Phase 3 undergoes an exothermic transition at a reduced temperature θn+ = Δεlg, respecting Equation (7) above Tm. This transition occurs at Tn+ ~ 1.145 Tm and corresponds to the temperature where the liquid viscosity ceases to respect the Arrhenius law during cooling from high temperature [29,58]. Rapidly quenched glass formers are amorphous and are transformed into glass phases by relaxing enthalpy during the first heating. Two liquids give rise, at first, to an intermediate Phase 3 below T3 < Tg respecting the entropy constraints, and then, the enthalpy increases towards that of the glass phase up to Tg. Phase 3 carries a medium-range order above Tg, which can be superheated above the melting temperature up to Tn+. The configuron model is successfully applied to 54 glasses, explaining the transitions at Tn+ by percolation and the existence of a glassy ‘ordered’ fraction equal to the critical threshold of Scher and Zallen (Φc = 0.15 ± 0.01), producing Tg [25,30]. The temperature Tn+ is the melting temperature of residual bonds involved in this glassy fraction [29].
First-order transitions occur in undercooled liquids at θx below Tm, depending on the heating rate, producing an exothermic heat equal to −Δε Hm for εgs = 0 in Equation (12), without crystallization [11,34,50,59,60,61,62]. The coefficient Δε is equal to singular values of the vitreous state enthalpy coefficient: Δεlg (θ0m), εgs0, εgs0/2, θn+ ≅ 0.145, and 0. This enthalpy is recovered at various reduced temperatures θn+ = Δε, including Δε ≅ 0.145. Two Phase 3 states with opposite enthalpies disappear at the same reduced temperature θn+ 0.145 and could contain clusters-bound colloids with two opposite values of enthalpy corresponding to antibond and bond breaking. All colloid bonds disconnect at Tn+ > Tm and give rise in congruent materials, through a first-order transition at Tn+, forming a liquid, containing tiny superatoms, built by short-range order [33]. This description is compatible with the presence of microheterogeneities in metallic overheated liquids, as already observed by Popel et al. [45,63].
The first-order transition at θx induces either an enthalpy of Phase 3 being constant and equal to −Δε Hm between θx and θn+ at high rates of cooling without crystallization, or with a crystallized (or condensed) fraction (1 − Δε) melted at Tm. For a fully crystallized volume, the enthalpy of crystals is assumed to be −Hm, considering that the denser crystalline phases lead to Δε = 1 [64]. In the second case, the melt above Tm contains a glassy fraction Δε and a homogeneous liquid fraction equal to (1 − Δε). This mixed state leads to the formation of crystals, coexisting with a glass fraction up to Tm with a glass state stable up to Tn+ [11,26,31,32,33].
2.5. The Formation of a Liquid Glass above Tm
The formation of a liquid glass is expected at a temperature (T′g = 2 Tm − Tg) [32]. A glass transition at θg is accompanied at high temperatures by a second glass transition occurring at −θg above Tm. This phenomenon is a consequence of the θ2 dependence of the enthalpy of glass phases. The corresponding VFT temperature squares are negative at high temperatures and the values of εgs0 and εls0 become higher than 2. These glass transitions have been already observed three times without being recognized as liquid glasses by the experimentalists [65,66,67,68]. The two transitions occur at Tg = 715 K and T′g = 1535 K in Cu46Zr46Al8 with Tm = 1125 K, during cooling of the melt, accompanied by an exothermic transition [32,65]. In the second material, the composite (ZIF-62) (Al-rich) (50/50) has a solidus melting temperature at 650 K, Tg = 591 K and T′g = 709 K observed during heating and accompanied by an endothermic latent heat. A glass transition still exists in tin far above Tm, and looks like a partial glassy fraction by [34,68]. A liquid glass is observed in suspensions of ellipsoidal colloids [69].
2.6. Validation of NCHN with Molecular Dynamics Simulations
A phase diagram of ice in single-walled carbon nanotubes at atmospheric pressure is established by numerical simulations, and predicts ice melting points as a function of their diameter up to 1.7 nm [70]. All of these melting points agree with the temperatures Tn+ given by the NCHN equation [37]. A first-order transition from liquid to homogenous glass, denoted L-glass, is predicted with the NCHN equation since 2016, in liquid elements, having a Lindemann constant close to 0.103, accompanied by a latent heat of 10.5% of the melting heat [10]. The transition under pressure of 4He is the first example of this phenomenon [71]. Recent molecular dynamics simulations identify, in addition, a first-order transition at Tx from liquid (L) to a metastable heterogenous solid-like phase, denoted as G-glass, when a supercooled liquid evolves isothermally below its melting temperature Tm at deep undercooling [59,61]. The NCHN model describes the first-order transitions from liquid to L-glass and to G-glass in agreement with these simulations [62,72]. The G-glass is a heterogenous phase consisting of regions fully embedded in a surrounding disordered medium.
Molecular dynamics simulations show full melting at Tn+ = 1.119 Tm for Zr [60], 1.126 Tm for Ag [61], 1.219 Tm for Fe, and 1.354 Tm for Cu [73]. The NCHN model applied to liquid elements is based on the increase of the Lindemann coefficient with the heating rate. The glass transition at Tg and the nucleation temperatures of G-phases at Tx and their melting at Tn+ are predicted. A universal law relating Tn+ and Tx shows that Tx cannot be higher than 1.293 Tm for Tn+ = 1.47 Tm. The enthalpies of G-phases have singular values, corresponding to the increase of percolation thresholds with Tg and Tx above the Scher and Zallen invariant at various heating and cooling rates [62].
As a conclusion of this chapter, the liquid glass states extend far above Tm. Varying pressures and temperatures and formation conditions of liquid glasses could be determined. For that purpose, a study of glass states and liquid glass states of (NiTi2) [36,74] under pressure by molecular dynamics simulations is developed in the next chapter.
3. Numerical Simulations
Molecular dynamics (MD) computer simulation using a open source code – software package for classical molecular dynamics Large-scale Atomic/Molecular Massively Parallel Simulator (LAMMPS, https://www.lammps.org/#gsc.tab=0 accessed on 29 October 2020) at periodic boundary conditions was used for modeling [75]. The simulation was performed at a 1 fs time step using the embedded atom potential derived for Ti–Ni alloys [76]. An atomic cell containing 128,000 atoms was heated to 2500 K to melt, and then cooled down to produce a glass. Melting was confirmed by the radial distribution function and stabilization of the density variation with time. A thermostat was used to control the temperature [77,78], while pressure was maintained by a barostat [79].
Deviations and irreproducibility have been studied using these types of coupling to determine possible deviations in dynamic properties for time constants as low as 0.01 ps. Reliable and thermostable dynamic properties can be derived for coupling time constants above 0.1 ps [80]. The atomic volume is calculated here using coupling time constants much higher than 10−13 s. The weakest time (10−13 s) would correspond to a temperature variation of 1 K without a change of dVat/dT. The highest time used in these simulations is 3 × 10⁻¹⁰ s. The atomic volume variation under a pressure of 1000 GPa is dVat/dp = 1.7881 × 10⁻⁷ with p in bars at a constant temperature of 299.7 K. The typical pressure variation is ~10,000 bars, leading to ΔVat = 1.788 × 10⁻³ Å3. Changing the temperature of 1 K has no influence on dVat/dp. Typical variations (ΔT) at ambient pressure are ~5 K. The reproducibility of the simulation during several cycles of temperature and pressure shows that the limit of ~10−13 s has no influence on the results because the times of coupling are much higher than 0.1 ps.
4. NiTi2, a New Liquid Glass
4.1. The Vitreous States of NiTi2 with Tg = 800 K and 695.5 K
The glass transition of NiTi2 is equal to 800 K with a cooling rate of 1012−1013 K/s and ~700 K [36] for an experimental value obtained on heating [74]. NiTi2 is chosen because its glass transition, at Tg = 800 K, and at high cooling rate, was initially determined by molecular dynamics simulations [36].
The enthalpy coefficients calculated with Equations (7)–(13), representing the enthalpy coefficient of Phase 3 in Figure 2, are given below in Equation (14), and are those of a fragile glass with Tm = 1257 K [80] and Tg = 800 K:
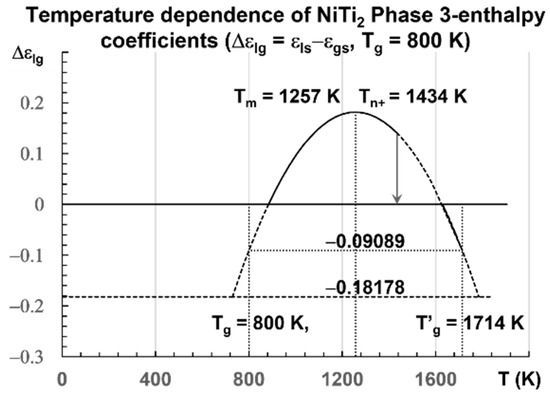
Figure 2.
Temperature dependence of NiTi2 configuron enthalpy for Tg = 800 K. The enthalpy coefficient (Δεlg) of Phase 3 given in Equation (13) is plotted as a function of the temperature in Kelvin for a fragile liquid with Tg = 800 K. The singular values (Δεlg) = −Δεgs0 = −0.18178 of Phase 3 and zero in the glass state are observed. The two others Δεgs0/2 = 0.09089 and Δεlg(θ0m) = 0.36369 are not obtained at room temperature. An exothermic first-order transition is expected at Tn+ = 1434 K with θn+ = Δεlg = 0.14085 at a low heating rate.
The singular values of are calculated with Equation (14) for various values of θ: Δεgso = 0.18178 (θ = 0), Δεgso/2 = 0.09089 (θ = θg), = 0.264422), Δεlg = 0.14085 for θ = 0.14085, and Δεlg = 0 (θ = −0.29685). They are the enthalpy coefficients of the configuron phase which are determined during the first heating after the first cooling from a temperature higher than Tm.
The liquid glass transition would be at the end of the first heating after the formation of broken bonds (configurons).
The enthalpy coefficient (Δεlg) of Phase 3 is −0.18178 for Tg = 800 K [36] with cooling rates of 1012−1013 K/s and −0.22335 for Tg = 695.5 K at a low heating rate [74]. A transition is expected at Tn+ = 1434 K for a liquid with Tg = 800 K, being quenched from temperatures near Tm and heated at 0.3 K/s [32]. Many exothermic or endothermic transitions have already been observed at these temperatures [42,44,45,46,48,52,53,54]. Recent study confirms the existence of these temperatures Tn+ > Tm in all liquids previously vitrified at low temperatures [29]. All these transitions correspond to the temperature below which the Arrhenius law is no longer working, occurring at Tn+ ≅ 1.145 Tm [58]. They are glass transitions of the fraction (≅0.1445) of unbroken bonds, equal to the percolation threshold predicted by the configuron model and the Scherr and Zallen invariant [25,26].
The enthalpy coefficients for Tg = 695.5 K and Tm = 1257 K, used in Figure 3, are given below in Equation (15) [8,32,74]:
=0.396058 [8],
Liquid 1: εls = 1.55330(1 − θ2/0.388381), Liquid 2: εgs = 1.553302(1 −
θ2/0.396058), Phase 3: ∆εlg(θ) = εls − εgs = 0.22335 − 1.679 × θ2; Tg = 695.5 K
[74] and θg = −0.446698 and T′g = 2 Tm − Tg = 1818.5 K and θ′g = 0.446698 [32].
Liquid 1: εls = 1.55330(1 − θ2/0.388381), Liquid 2: εgs = 1.553302(1 −
θ2/0.396058), Phase 3: ∆εlg(θ) = εls − εgs = 0.22335 − 1.679 × θ2; Tg = 695.5 K
[74] and θg = −0.446698 and T′g = 2 Tm − Tg = 1818.5 K and θ′g = 0.446698 [32].
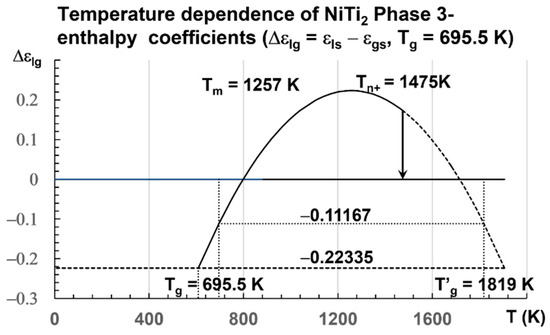
Figure 3.
Temperature dependence of NiTi2 configuron enthalpy for Tg = 695.5 K. The enthalpy coefficient (Δεlg) of Phase 3 given in Equation (15) is plotted as a function of the temperature in Kelvin for a fragile liquid with Tg = 695.5 K. The singular values (Δεlg) = −Δεgs0 = −0.22335 of Phase 3 and zero of the glass state are observed. The two others Δεgs0/2 = 0.11167 and Δεlg(θ0m) = 0.29442 are not obtained at room temperature. An exothermic first-order transition is expected at Tn+ = 1475 K with θn+ = Δεlg = 0.17306 at a low heating rate.
A transition is expected at slow heating at Tn+ = 1475 K for a liquid being quenched from temperatures much closer to Tm. The enthalpy coefficient of Phase 3 is −0.22335. The volume change calculated by numerical simulations is equal to 0.22335 × 1.5661 = 0.3498 ± 2%. The coefficient 1.5661 ± 1% transforms the enthalpy coefficient −0.22335 in a volume change in Å3 at the melting temperature Tm because the enthalpy of melting is equal to the enthalpy variation between Tm and 2 Tm [34]. Simulations of the volume are used to predict this coefficient of 1.5661 ± 1%. The transition at Tn+ is expected at 1475 K, a temperature where θn+ = Δεlg = 0.17306.
4.2. The Atomic Volume Hysteresis above the Melting Temperature Up to 2120 K
The NiTi2 atomic volume Vat in Angström3, represented by the red line in Figure 4, is obtained by cooling the melt from 3000 K to 300 K, and is equal to 15.2829 Å3 at 300 K.
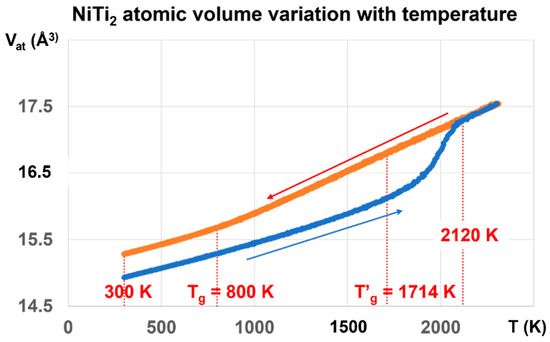
Figure 4.
NiTi2 atomic volume variation with temperature using cooling and heating rates of 1013 K/s. Two values of the atomic volume are observed and fixed by the thermal history under pressure. The red line is obtained by decreasing the temperature from 3000 K down to 300 K under pressures weaker than 700 bars. The first glass transition occurs at 800 K during cooling. The melt is submitted to a glass transition at 2120 K during heating. The atomic volume along the blue line is very stable from 300 to 800 K, whatever the pressure of ±700 bars is, and results from a first-order transition, under a pressure of 1000 GPa at 1000 K, varying the temperature to 300 K, and finally decreasing the pressure to 1 bar. The glass phase totally disappears at 2120 K instead of 1714 K.
The atomic volume represented by the blue line starts at 300 K from Vat = 14.9331 Å3 obtained after applying a pressure of 1000 GPa at 1000 K, lowering the temperature down to 300 K, and finally decreasing the pressure to 1 bar. The hysteresis cycle between 300 and 3000 K is measured under weak pressures P, varying between −660 bar and +700 bar. The line thicknesses include the volume variations with pressure. The atomic volume follows the blue line during reheating up to 2120 K. Above this temperature, the blue and red lines merge, and the volume is reproducible with pressure increase or decrease. The glass transition temperature occurs at 2120 K without volume jump.
The temperature T′g = 1714 K is equal to (2 Tm − Tg) with Tm = 1257 K and Tg = 800 K. The temperature of 2120 K corresponds to θn+ = 0.68632, being equal to the sum of singular enthalpy coefficients (0.14085 + 0.18178 + 0.36369) of Phase 3 with Tg = 800 K, and determining the highest glass transition temperature of Phase 3 and the highest melting temperature of NiTi2, as already observed for several liquid elements [62].
The first-order transition of the glass phase expected at T′g = 1714 K is not observed by heating from low temperatures. Nevertheless, ΔVat, the difference between the red and blue lines, is maximum at this temperature and decreases to zero from 1714 K to 2120 K. In addition, it is constant from 300 K up to the first glass transition at Tg = 800 K where ΔVat begins to increase with the temperature.
The glass transition at 800 K is observed on the red curve by the slope change of Vat at this temperature while a new glass state is induced by a first-order transition, occurring at 1000 GPa by decreasing the temperature from 1000 to 300 K, followed by lowering the pressure down to 1 bar. This new glass state disappears during heating at 2120 K. The NiTi2 melt cooled from 3000 K to 800 K does not undergo liquid glass transformation.
4.3. The First-Order Transition under 1000 GPa
A liquid glass state is revealed in Figure 5 by a first-order transition as expected. An atomic volume change, equal to −0.00979 Å3 under 1000 GPa, is induced by a reduction of temperature from 1000 K to 300 K and by the memory of this transition, as shown in Figure 4.
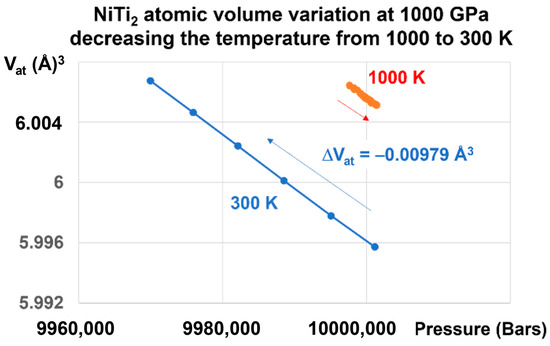
Figure 5.
NiTi2 atomic volume variation at 1000 GPa, decreasing the temperature from 1000 to 300 K. Increasing the pressure at T = 1000 K up to 1000 GPa and lowering the temperature down to 300 K induces a first-order transition in the glass state accompanied by a volume change equal to ΔV = −0.00979 Å3.
A memory effect has been numerically predicted in a three-dimensional model for structural glass when submitted to a temperature cycle [35]. Here, a first-order transition is observed and builds a memory effect.
This transition is reversible, as shown in Figure 6.
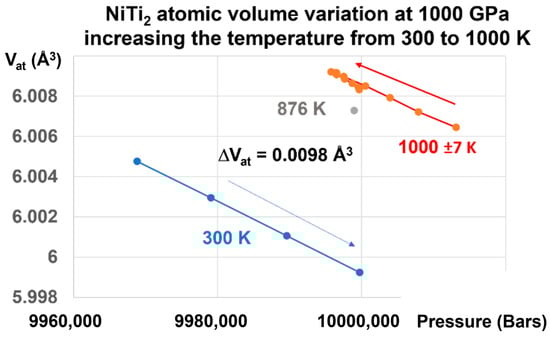
Figure 6.
NiTi2 atomic volume variation at 1000 GPa, increasing the temperature from 300 to 1000 K. Increasing the pressure on the glass state at T = 300 K up to 1000 GPa and increasing the temperature from 300 K to 1000 K induces a first-order transition from the glass to the liquid state, and a volume change of +0.00980 Å3, equal to that observed in Figure 5.
Applying a pressure of 1000 GPa at 300 K and increasing the temperature to 1000 K induces an increase of the atomic volume of 0.0098 Å3, as shown in Figure 6. This transformation reduces the difference (ΔVat) = −0.3498 Å3 at 300 K, as shown in Figure 4, to a value which is 35.69 times weaker. This factor (35.69) is related to the increase of the melting heat under pressure.
4.4. The Phase Diagram of Glass Phases in Fragile Liquids
The phase diagram in Figure 7 is devoted to Phase 3 of fragile liquids, having a melting temperature (Tm) and submitted to first-order transitions induced at Tx/Tm and Tg/Tm at various heating rates from their low temperature glass state. The ratio of Tg/Tm of fragile glasses is always higher than 0.5 (θg > −0.5). This limit corresponds to Vogel–Fulcher–Tamann temperatures higher than Tm/3. The reduced glass transition at θg is varying from −0.5 to 2.581 and Tg/Tm from 0.5 to 3.581. For each value of θg, there are first-order transitions of Phase 3, occurring at θx and θn+, accompanied by enthalpy coefficient changes respectively equal to −Δε and +Δε. For example, Tx/Tm = 0.22335 = Δε leads to two glass transitions at T′g/Tm = 0.5487 and 3 (θg = −0.77665 and 2) at zero pressure and constant melting temperature.
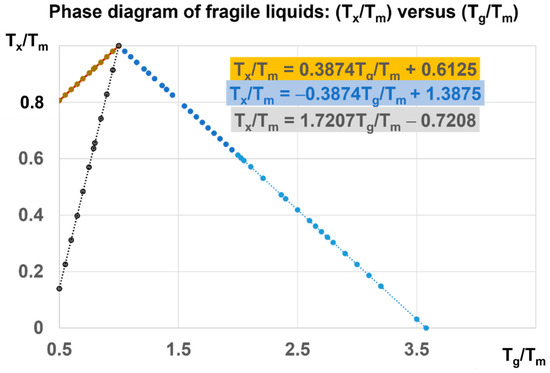
Figure 7.
Phase diagram of fragile liquids: (Tx/Tm) versus (Tg/Tm). For each value of Tx/Tm, higher than 0.8 at zero pressure, there are two glass transitions corresponding to Tg and T′g. For Tx/Tm > 0.13962, there is a unique glass transition T′g/Tm < 3.22076. A pressure has, for consequence, to reduce Tx/Tm and to increase Tg/Tm beyond 3.22076. This ratio tends to the upper limit equal to 3.581 when the pressure tends to infinite.
There are two types of first-order transitions at Tx. In the first case, the Phase 3 enthalpy falls to −Hm at Tx, remains constant up to Tm, and an enthalpy fraction Δε is recovered through a new first-order transition at Tn+ far above Tm. Consequently, the melting enthalpy, recovered at Tm, is reduced and equal to (1 − Δε) Hm. The temperature (Tn+), corresponding to a reduced temperature equal to θn+ = Δε, is the glass transition reduced temperature of the liquid fraction Δε, which is not crystallized or condensed at Tx [31,34]. This diagram is also used to predict the glass transitions under pressure, taking account of the pressure dependence of Tm and Hm.
In the second case, the transition at Tx is not accompanied by a crystallized or a condensed fraction, and is only due to the formation of various Phases 3, having enthalpies equal to −Δε Hm with Δε also equal to singular values of percolation thresholds of configurons in Equation (14): Δεsg0 (θ = 0), Δεsg0/2 (θ = θg), Δεlg (θ = θ0m), Δεlg (θn+), and zero. There is no crystalline phase. The volume difference ΔVat increases with temperature up to T′g = 1714 K. The liquid fraction [Δε = (T′g − Tm)/Tm] participates to the glass state up to T′g.
The enthalpy changes, associated with the first-order transitions at Tn+ = Tg and Tx, are, respectively, equal to ±Δε Hm. The melting heat Hm increases with pressure, while (Δε) decreases as 1/Hm. The value of Δε is divided by 35.69 under a pressure of 1000 GPa because the melting heat is multiplied by 35.69. Consequently, (Δε) = 0.0098 at 1000 GPa leads to Tg/Tm = (3.581 − 0.0098/0.581) = 3.5641 near the upper limit of 3.581, as shown in Figure 7.
4.5. The Melting Temperature Increases with Pressure
The melting entropy is 9.3 J/K/mole in many metals, and the melting heat is quasi-proportional to Tm [4]. The pressure application increases the liquid entropy proportionally to the induced melting temperature. Consequently, the melting heat is expected to be proportional to Tm2 and a linear function of the pressure (P), as shown for NiTi2 in the following equations:
- assuming Δε = 0.22335 for Tg = 695.5 K
At P = 0, Tm is equal to T0 = 1257 K [80]. For P =1000 GPa, (Tm/T0)2 = 35.69 or 29.08, in agreement with the numerical simulations. (Tm) under P = 1000 GPa is 7509 K or 6779 K. The dependence of Tm with P is given in Table 1, using the two values (0.22335) and (0.18178) of Δε. For P = 500 GPa, Δε and ΔVat are multiplied by 1.948 compared to ΔVat at 1000 GPa. The volume change, calculated at 1000 GPa, is 2% or 3.6% weaker than the simulated value (0.00979). The glass transition even increases at pressures much higher than 1000 GPa, with ΔVat tending to zero.

Table 1.
Four first columns on the left are devoted to the liquid having Tg = 695.5 K, while the four last columns on the right to Tg = 800 K. Values of Tm, Δε, and ΔVat are given as a function of pressure in GPa respecting Equations (16) and (17).
This linear law of variation with Tm2 with pressure has never been used. It is then important to apply it to other known metals. Copper and iron are chosen. There are many measurements of copper at low pressures [81,82,83,84,85]. The initial slope varies between 36.4 and 47.7 K/GPa. These measurements lead to the two following laws, Equations (18) and (19) for copper, in good agreement with many experimental and theoretical results:
which are represented in Figure 8, together with those of NiTi2 and Fe. For Cu, our extrapolated values in 500 GPa are 7253 K and 8299 K, in agreement with Tm = 7900 K [82]. From another determination in 100 GPa, Tm = 3900 K [86], and our values are 3463 K and 3905 K.
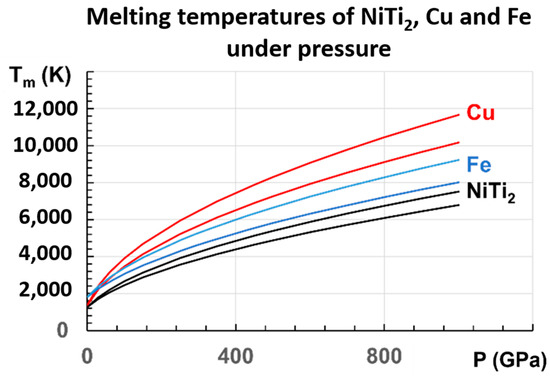
Figure 8.
The melting temperatures of Cu, Fe, and NiTi2 are represented versus P (GPa), following the proposed equations: for Cu: (18,19); for Fe: (20,21); for NiTi2: (16,17).
For Fe, recent measurements up to 103 GPa are determined by X-ray absorption spectroscopy up to 103 GPa, and used to predict a melting temperature of 4850 ± 200 K at the inner core boundary (ICB) of the earth for P = 330 GPa [87]. Another melting temperature of 5500 ± 220 K at the ICB has been extrapolated from a measurement under P = 290 GPa in a resistance-heated diamond-anvil cell [88].
An extrapolation of this experimental result yields a melting point of 5500 ± 220 K at the ICB, higher than the previous reported result. Two laws, Equations (20) and (21) for iron, are deduced from our model, respectively, based on the works of Aquilanti et al. [87] and Sinmyo et al. [88].
Our extrapolation, at 330 GPa from measurements below 103 GPa, leads to Tm = 4834 K, in agreement with the evaluation of 4850 ± 200 K [88].
4.6. Increase of the Enthalpy Difference between Liquid and Glass with Temperature from 300 K to 1734 K
The difference ΔVat is equal to 0.3498 Å3 under pressure variations between ±700 Bars from 300 K to 700–800 K, as shown in Figure 4 and Figure 9.
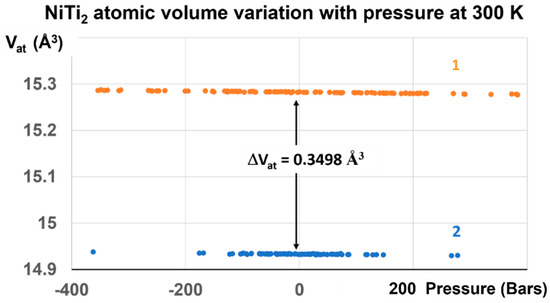
Figure 9.
NiTi2 atomic volume variation with pressure at 300 K. Two stable volumes at room temperature and under atmospheric pressure are obtained after the first-order transition induced at 1000 GPa. The volume difference ΔVat at 300 K between liquid, noted 1, and glass, noted 2, is equal to 0.3498 ± 0.004 Å3, and corresponds to that of configurons for Tg = 695.5 K.
The glass state, induced by the first-order transition, exists up to T′g =1714 K for Tg = 800 K with ΔVat, increasing from 0.3498 to 0.6808 Å3, as shown in Figure 10.
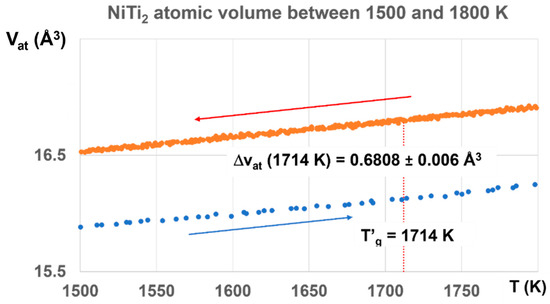
Figure 10.
NiTi2 atomic volumes between 1500 and 1800 K. The atomic volume difference increases with temperature up to ΔVat = 0.6808, corresponding to Δε = 0.6808/1.5661 = 0.4387, a value a little weaker than T′g/Tm = 1818.5/1257 = 0.4467, and much higher than T′g/Tm = 1714/1257 = 0.36356 (q′g = 0.36356). The melt has a glass transition temperature much closer at T′g = 1818.5 K (Tg = 695.5 K) than T′g = 1714 K (Tg = 800 K).
The value of ΔVat at T′g = 1714 K would correspond to a first-order transition under 1000 GPa induced by a temperature increase from 300 to 1724 K with ΔVat = 0.6808/36.73 = 0.0185 ± 0.0016. This continuous increase of ΔVat up to T′g indicates that a high fraction volume of the sample belongs to a glass phase.
The enthalpy coefficient of Phase 3 with ΔVat = 0.6808 corresponds in fact to Δε = 0.6808/1.5661 = 0.4387, a value a little weaker than θ′g = (1818.5 − 1257)/1257 = 0.4467, and much higher than θ′g = (1714 − 1257)/1257 = 0.36356. The melt has a glass transition temperature much closer at T′g = 1818.5 K (Tg = 695.5 K) than T′g = 1714 K (Tg = 800 K). The coefficient Δε tends to decrease toward 0.36356, corresponding to T′g = 1714 K and Tg = 800 K, as shown in Figure 11.
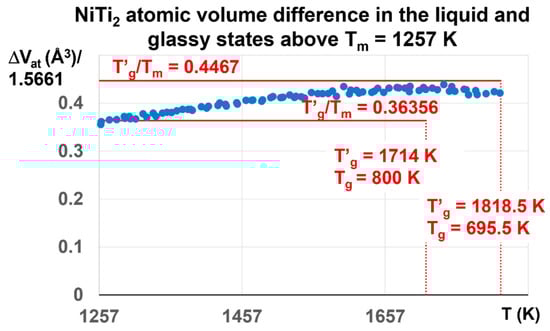
Figure 11.
NiTi2 atomic volume difference between liquid and glass above Tm = 1257 K. The initial liquid glass state at room temperature is characterized by T′g = 1818.5 K and Tg = 695.5 K. Its enthalpy coefficient is expected to be equal 0.4467. The maximum calculated value is 0.4387 ± 0.01 at 1714 K. It begins to decrease and attain 0.36356 at T = 1931 K and zero at 2120 K in Figure 3. The influence of the glass phase with T′g = 1818.5 still exists up to 1931 K. The glass phase disappears without first-order transition at 2120 K due to the prolongation of the glass state.
The atomic volume change at the melting temperature Tm = 1257 K is equal to the volume variation (ΔV = 1.5661 Å3) of the melt between Tm and 2 Tm [34]. A new liquid glass state is stabilized at 300 K. The glass transition temperature Tg becomes equal to 695.5 K instead of 800 K after a cooling rate at 1012−1013 K/s. The Phase 3 enthalpy coefficient Δεlg = εls − εgs is equal to 0.22335 at low temperatures, and corresponds to a volume change of 0.22335 × 1.5661 = 0.35, in agreement with that of Figure 8.
The ratio T′g/Tm in Figure 11 is expected to be equal to 1.4467 for T′g = 1818.5 K and Tg = 695.5 K and 1.36356 for T′g = 1714 K and Tg = 800 K. Its maximum value is 1.4387 at T′g = 1714 K instead of 1.4467. Above Tm = 1257 K, the dominant liquid glass phase with T′g = 1818.5 K is progressively replaced by the liquid glass with T′g = 1714 K and Tg = 800 K, because ΔVat begins to decrease above 1714 K.
These results show that Δε progressively varies between the two maximum values θn+ = Δε = 0.4467 and 0.36356. The first-order transitions expected at 1714 K and 1818.5 K are not observed because the crystal melting in NiTi2 extends up to 2120 K in Figure 3 at 1013 K/s. The glass fraction first increases with temperature from Δε = 0.22335 to 0.4387, and attains 0.36356 at 1931 K.
There is a competition between two glass phases. The first one has a glass transition temperature equal to Tn+ = 2120 K, which is equal to the temperature Tn+ of NiTi2 full melting, as shown in Figure 12, studying the crystal melting temperature dependence with high heating rates at 1012−1013 K/s. The transition is sharp with 1012 K/s, and continuous with 1013 K/s.
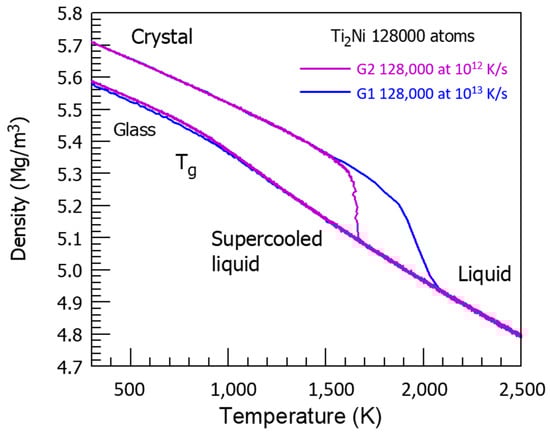
Figure 12.
The NiTi2 crystal density as a function of temperature at high heating rates. As indicated at 1013 K/s, the crystal is completely melted at 2120 K instead of T0 = 1257 K at a low heating rate. The glass transition T′g of a glass fraction equal to 0.68632 occurs at θn+ = 0.68632 and Tn+ = 1.68632 × T0 = 2120 K with 0.68632 = 0.14085 + 0.18178 + 0.36369. The crystal melting starts at Tn+ = 1891 K and θn+ = 0.50454 = 0.14085 + 0.36369. At 1012 K/s, melting occurs at 1650 K, corresponding to θn+ = (1650 − 1257)/1257 = 0.31265. The sum of singular coefficients (0.14085 + 0.18178) leads to (0.32263) and to θn+ = 1663 K.
This temperature Tn+, being the liquid glass transition temperature, corresponds to θn+ = 0.68632 equal to the sum of singular values (0.14085 + 0.18178 + 0.36369) of the enthalpy coefficient of Phase 3. The NiTi2 melting starts earlier at Tn+ = 1891 K and θn+ = 0.50454 = 0.14085 + 0.36369, and is prolongated toward θn+ = 0.68632. The second glass phase results from a first-order transition obeying to the nucleation law in Equation (7) with a weaker and weaker fraction Δε. The maximum difference Δε increases up to 0.4387 without attaining T′g/Tm = 0.4467, and declines toward zero at 2120 K. The first-order transition cannot take place at T′g = 1714 K because the glass phase is prolongated by that of a liquid glass fraction equal to 0.686 with T′g = Tn+ = 2120 K.
The two liquid states found by numerical simulations are already observed in Co–B melts [39]. The temperature-dependent liquid structures are studied in situ, measuring the magnetization. A magnetization anomaly in terms of the non-Curie–Weiss temperature dependence of magnetization was observed in the overheated state, demonstrating a temperature-induced liquid–liquid structure transition. This anomalous behavior was found to be a universal formula for the Co–B binary alloy system. The transition point at Tn+ (called T0 in the publication), above which there is a unique liquid state and below which two paramagnetic Curie temperatures (θp (LI), θp (LII)) corresponding to two distinct kinds of liquids (i.e., high-magnetization liquid (HML)I and low-magnetization liquid (LML)II), are measured. With the increased concentration of Co, Tn+, θp (LI) and θp (LII) shift to higher temperatures, and the Curie constants for the HML and LML decrease. Based on the location of Tn+, a guideline is drawn above the liquidus in the Co–B phase diagram.
As a conclusion of this chapter, the liquid glass states extend far above Tm. Table 2, after ref. [26], illustrates the positioning of liquid glasses in terms of connectivity and ordering increase (e.g., on temperature decrease).
Table 2.
Phases of materials as function of connectivity and ordering of atomic constituents.
The right column of Table 2 is for solid-like matter, which occurs when the degree of connectivity between atomic or molecular constituents is high. Here, we have glasses with a topologically disordered distribution of atoms or molecular species, or crystals. At a medium degree of order, we have composite materials composed of both vitreous, crystalline with periodicity, and even quasi-crystalline (QC) phases with nonperiodic order [29,90]. When the degree of connectivity is low, as shown in the second column of Table 2, we have fluid-like behavior of matter. It starts with melts containing icosahedral superclusters when there is low connectivity between species at a low degree of their ordering. If the degree of ordering becomes high, we have the case of liquid crystals, which is a distinct phase of matter observed between the crystalline (solid) and isotropic (liquid) states. The liquid glass state of matter was missing within classification of matter until recently, because it is a combination of both glassy and liquid fractions, which cannot be readily revealed, e.g., via X-ray diffraction. It is a flowing state of matter placed within a classification scheme at a low degree of connectivity characteristic to liquids, and has a medium degree of ordering because the fraction of glass within liquid adds some degree of ordering, being distinct from the molten state of matter at least by its symmetry signature, i.e., the Hausdorff dimensionality of bonds, which is D = 3 for glasses and D = 2.5 for liquids; see, e.g., Table 2 of Refs. [25,36,91,92,93].
5. Conclusions
The formation of liquid glasses induced by first-order transitions at temperatures Tx < Tm, with glass transition temperatures at Tn+ > Tm has been proposed many times during the last years. Glass transitions have been recently observed above Tm in the composite (ZIF-62) (Al-rich) (50/50), in tin, and in suspensions of ellipsoidal colloids. The existence of such liquid glasses can be extended by molecular dynamics simulations. NiTi2 is chosen because its glass transition, at Tg = 800 K (Tm = 1257 K) and at high cooling rate, was initially determined by MD simulations, revealing structural changes at this glass transition via radial distribution functions. Applying very high pressures attaining 1000 GPa at 1000 K, and abruptly decreasing the temperature from the liquid state to 300 K or increasing the temperature from 300 K to 1000 K from the glass state, induces a weak reversible first-order transition of the atomic volume with ΔVat = 0.0098 Angström3. A new liquid glass state exists at 300 K up to 2120 K after reduction of the pressure to one bar, characterized by an atomic volume difference at 300 K, with the classical glass with Tg = 800 K being 35.69 times higher than under a pressure of 1000 GPa. This decrease of ΔVat with pressure is associated with the strong increase of Tm. [Tm (1000 GPa)/T0]2 is equal to 35.69 because the entropy of melting linearly increases with pressure instead of being constant. The melting temperature Tm of NiTi2 would attain 6779 K for T0 = 1257 K. We control this relation, calculating the melting temperatures of copper and iron as a function of pressure using known experimental values at various low pressures. Our extrapolated values agree with other extrapolations for copper and iron. The observed first-order transitions show that this liquid glass exists up to temperatures Tn+ = 1.686 Tm, and that memory effects are present at ambient pressure by abruptly varying the temperature under extreme high pressures. Liquid glasses are a new class of materials which deeply disrupt the concept of homogenous liquids without memory of their solid and glass transformations below Tm.
The continuous increase of the volume difference ΔVat between the liquid and the glass from 300 K up to T′g = 1714 K shows that the volume fraction involved in this glass fraction attains ~44%.
This finding could lead to a reconsideration of glass formation in volcanic rocks. Up to now, the explanation is based on the high content of SiO2 in amorphous rocks with Tg ≤ 1473 K. A first-order transition at T′g = 2 Tm − Tg ≤ 2519 K could exist during cooling or, in the absence of spontaneous first-order transition at T′g ≤ 2519 K, and depending on the thermal history, a first-order transition could be induced during the simultaneous pressure and temperature decreases at different rates.
Author Contributions
Conceptualization, R.F.T. and M.I.O.; methodology, R.F.T.; software, R.F.T.; validation, R.F.T. and M.I.O.; formal analysis, R.F.T.; investigation, R.F.T. and M.I.O.; data curation, R.F.T.; writing—original draft preparation, R.F.T.; writing—review and editing, R.F.T. and M.I.O. All authors have read and agreed to the published version of the manuscript.
Funding
This research received no external funding.
Institutional Review Board Statement
Not applicable.
Informed Consent Statement
Not applicable.
Data Availability Statement
Data supporting reported results can be found within references provided.
Acknowledgments
MD simulation results for NiTi2 were provided by Dmitri V. Louzguine-Luzgin.
Conflicts of Interest
The authors declare no conflict of interest.
References
- Turnbull, D. Kinetics of solidification of supercooled liquid mercury. J. Chem. Phys. 1952, 20, 411. [Google Scholar] [CrossRef]
- Turnbull, D.; Fisher, J.C. Rate of nucleation in condensed systems. J. Chem. Phys. 1949, 17, 71–73. [Google Scholar] [CrossRef]
- Kelton, K.F. Crystal nucleation in liquids and glasses. Sol. State Phys. 1991, 45, 75–177. [Google Scholar]
- Vinet, P.; Magnusson, L.; Frederikssen, H.; Desré, P.J. Correlations between surface and interface energies with respect to crystal nucleation. J. Colloid Interf. Sci. 2002, 255, 363–374. [Google Scholar] [CrossRef]
- Tournier, R.F. Crystallization of supercooled liquid elements induced by superclusters containing magic atom numbers. Metals 2014, 4, 359–387. [Google Scholar] [CrossRef]
- Yang, B.; Perepezko, J.H.; Schmelzer, J.W.P.; Gao, Y.; Schick, C. Dependence of crystal nucleation on prior liquid overheating by differential fast scanning calorimeter. J. Chem. Phys. 2014, 140, 104513. [Google Scholar] [CrossRef]
- Tournier, R.F. Presence of intrinsic growth nuclei in overheated and undercooled liquid elements. Phys. B Condens. Matter 2007, 392, 79–91. [Google Scholar] [CrossRef]
- Tournier, R.F. Thermodynamic origin of the vitreous transition. Materials 2011, 4, 869–892. [Google Scholar] [CrossRef] [PubMed]
- Tournier, R.F. Thermodynamic and kinetic origin of the vitreous transition. Intermetallics 2012, 30, 104–110. [Google Scholar] [CrossRef]
- Tournier, R.F. Lindemann’s rule applied to the melting of crystals and ultra-stable glasses. Chem. Phys. Lett. 2016, 651, 198–202, Erratum in Chem. Phys. Lett. 2017, 675, 174. [Google Scholar] [CrossRef]
- Tournier, R.F. Glass phase and other multiple liquid-to-liquid transitions resulting from two-liquid competition. Chem. Phys. Lett. 2016, 665, 64–70. [Google Scholar] [CrossRef]
- Wool, R.P. Twinkling fractal theory of the glass transition. J. Polym. Sci. Part B Polym. Phys. 2008, 46, 2765–2778. [Google Scholar] [CrossRef]
- Wool, R.P.; Campanella, A. Twinkling fractal theory of the glass transition: Rate dependence and time-temperature superposition. J. Polym. Sci. Part B Polym. Phys. 2009, 47, 2578–2589. [Google Scholar] [CrossRef]
- Stanzione, J.F., III; Strawhecker, K.E.; Wool, R.P. Observing the twinkling nature of the glass transition. J. Non-Cryst. Sol. 2011, 357, 311. [Google Scholar] [CrossRef]
- Tournier, R.F. First-order transitions in glasses and melts induced by solid superclusters nucleated by homogeneous nucleation instead of surface melting. Chem. Phys. 2019, 524, 40–54. [Google Scholar] [CrossRef]
- Hornboll, L.; Yue, Y. Enthalpy relaxation in hyperquenched glasses of different fragility. J. Non-Cryst. Sol. 2008, 354, 1832–1870. [Google Scholar] [CrossRef]
- Hu, C.; Zhang, C.; Yue, Y. Thermodynamic anomaly of the sub-Tg relaxation in hyperquenched metallic glasses. J. Chem. Phys. 2013, 138, 174508. [Google Scholar] [CrossRef]
- Jian, Q.K.; Wang, X.D.; Nie, X.P.; Zhang, G.Q.; Ma, H.; Fecht, H.J.; Bendnarck, J.; Franz, H.; Liu, Y.G.; Cao, Q.P.; et al. Zr-(Cu,Ag)-Al bulk metallic glasses. Acta Mater. 2008, 56, 1785–1796. [Google Scholar] [CrossRef]
- Inoue, A.; Zhang T: Masumoto, T. The structural relaxation and glass transition of La-Al-Ni and Zr-Al-Cu amorphous alloys with a significant supercooled liquid region. J. Non-Cryst. Sol. 1992, 150, 396. [Google Scholar] [CrossRef]
- Zhou, S.H.; Schmid, J.; Sommer, F. Thermodynamic properties of liquid, undercooled liquid and amorphous Al-Cu-Zr and Al-Cu-Ni-Zr. Thermochim. Acta 1999, 339, 79–91. [Google Scholar] [CrossRef]
- Wang, L.-M.; Borick, S.; Angell, C.A. An electrospray technique for hyperquenched glass calorimetry studies: Propylene glycol and di-n-butylphthalate. J. Non-Cryst. Sol. 2007, 353, 3829–3837. [Google Scholar] [CrossRef]
- Jabrane, S.; Létoffé, J.M.; Claudy, P. Vitrification and crystallization in the R(−)1,2-propanediol-S(+)1,2-propadeniol system. Thermchim. Acta 1995, 258, 33–47. [Google Scholar] [CrossRef]
- Ojovan, M.I.; Travis, K.P.; Hand, R.J. Thermodynamic parameters of bonds in in glassy materials from viscosity temperature relationships. J. Phys. Cond. Matter. 2007, 19, 415107. [Google Scholar] [CrossRef] [PubMed]
- Ojovan, M.I.; Lee, W.E. Connectivity and glass transition in disordered oxide systems. J. Non-Cryst. Sol. 2010, 356, 2534–2540. [Google Scholar] [CrossRef]
- Ojovan, M.I. Ordering and structural changes at the glass-liquid transition. J. Non-Cryst. Sol. 2013, 382, 79. [Google Scholar] [CrossRef]
- Ojovan, M.I. The modified random network model within the configuron percolation theory. Ceramics 2021, 4, 121–134. [Google Scholar] [CrossRef]
- Tournier, R.F. Amorphous ices. In Encyclopedia of Glass Science, Technology, History, and Culture; Richet, P., Conradt, R., Takada, A., Dyon, J., Eds.; Wiley & Sons: Hoboken, NJ, USA, 2021. [Google Scholar]
- Tournier, R.F. Homogeneous nucleation of phase transformations in supercooled water. Phys. B 2020, 579, 411895. [Google Scholar] [CrossRef]
- Tournier, R.F.; Ojovan, M.I. Undercooled phase behind the glass phase with superheated medium-eange order above glass transition temperature. Phys. B 2021, 602, 412542. [Google Scholar] [CrossRef]
- Scher, H.; Zallen, R. Critical density in percolation processes. J. Chem. Phys. 1970, 53, 3759–3761. [Google Scholar] [CrossRef]
- Tournier, R.F. Liquid-liquid transitions due to melting temperatures of residual glassy phases expected in Pt57Cu23P20. Aspects Min. Sci. 2022, 8, 979–989. [Google Scholar] [CrossRef]
- Tournier, R.F.; Ojovan, M.I. Multiple melting temperatures in glass-forming melts. Sustainability 2022, 14, 2351. [Google Scholar] [CrossRef]
- Tournier, R.F.; Ojovan, M.I. Building and breaking bonds by homogenous nucleation in glass-forming melts leading to three liquid states. Materials 2021, 14, 2287. [Google Scholar] [CrossRef] [PubMed]
- Tournier, R.F. Multiple glass transitions in bismuth and tin beyond melting temperatures. Metals 2022, 12, 2085. [Google Scholar] [CrossRef]
- Scaliet, C.; Berthier, L. Rejuvenation and memory effects in a structural glass. Phys. Rev. Lett. 2019, 122, 255502. [Google Scholar] [CrossRef]
- Ojovan, M.I.; Louzguine Luzgin, D.V. Revealing Structural Changes at Glass Transition via Radial Distribution Functions. J. Phys. Chem. 2020, 124, 3186–3194. [Google Scholar] [CrossRef]
- Tournier, R.F.; Ojovan, M.I. Dewetting Temperatures of Prefrozen and Grafted Layers in Ultrathin Films Viewed as Melt-Memory Effects. Phys. B 2021, 611, 412796. [Google Scholar] [CrossRef]
- Na, J.H.; Corona, S.L.; Hoff, A.; Johnson, W.L. Observation of an apparent first-order glass transition in ultrafragile Pt-Cu-P bulk metallic glasses. Proc. Natl. Acad. Sci. USA 2020, 117, 2779–2787. [Google Scholar] [CrossRef]
- He, Y.-X.; Li, J.; Wang, J.; Kou, H.; Beaugnon, E. Liquid-liquid structure transition and nucleation in undercooled Co-B eutectic alloys. Appl. Phys. A 2017, 123, 391. [Google Scholar] [CrossRef]
- Yu, Y.; Lv, L.; Wang, X.-Y.; Zhu, B.; Huang, Z.-Y.; Zu, F.-Q. Influence of melt overheating treatment on solidification behavior of BiTe-based alloys at different cooling rates. Mater. Des. 2015, 88, 743–750. [Google Scholar] [CrossRef]
- Xu, W.; Sandor, M.T.; Yu, Y.; Ke, H.-B.; Zhang, H.P.; Li, M.-Z.; Wang, W.-H.; Liu, L.; Wu, Y. Evidence of liquid-liquid transition in glass-forming La50Al35Ni15 melt above liquidus temperature. Nat. Commun. 2015, 6, 7696. [Google Scholar] [CrossRef]
- Tournier, R.F.; Beaugnon, E. Texturing by cooling a metallic melt in a magnetic field. Sci. Technol. Adv. Mater. 2009, 10, 014501. [Google Scholar] [CrossRef] [PubMed]
- Legrand, B.A.; Chataigner, D.; Perrier de la Bathie, R.; Tournier, R.F. Orientation by solidification in a magnetic field. A new process to texture SmCo compounds used as perrmanent magnets. J. Magn. Magn. Mater. 1997, 173, 20. [Google Scholar] [CrossRef]
- Kim, Y.H.; Kiraga, K.; Inoue, A.; Masumoto, T.; Jo, H.H. Crystallization and high mechanical strengthof Al-based amorphous alloys. Mater. Trans. 1994, 35, 293–302. [Google Scholar] [CrossRef]
- Popel, P.S.; Sidorov, V.E. Microheterogeneity of liquid metallic solutions and its influence on the structure and propertes of rapidly quenched alloys. Mater. Sci. Eng. 1997, 226–228, 237–244. [Google Scholar] [CrossRef]
- Yue, Y. Experimental evidence for the existence of an ordered structure in a silicate liquid above its liquidus temperature. J. Non-Cryst. Sol. 2004, 345–346, 523–527. [Google Scholar] [CrossRef]
- Wang, L.; Bian, X.; Liu, J. Discontinuous structural phase transition of liquid metal and alloys. Phys. Lett. A 2004, 326, 429–435. [Google Scholar] [CrossRef]
- Way, C.; Wadhwa, P.; Busch, R. The influence of shear rate and temperature on the viscosity and fragility of the Zr41.2Ti13.8Cu12.5Ni10.0Be22.5 metallic-glass-forming liquid. Acta Mater. 2007, 55, 2977–2983. [Google Scholar] [CrossRef]
- Bian, X.F.; Sun, B.A.; Hu, L.N.; Jia, Y.B. Fragility of superheated melts and glass-forming ability in Al-based alloys. Phys. Lett. A 2005, 335, 61–67. [Google Scholar] [CrossRef]
- Wei, S.; Yang, F.; Bednarcik, J.; Kaban, I.; Shuleshova, O.; Meyer, A.; Busch, R. Liquid-liquid transition in a strong bulk metallic glass-forming liquid. Nat. Commun. 2013, 4, 2083. [Google Scholar] [CrossRef]
- Lan, S.; Ren, Y.; Wei, X.Y.; Wang, B.; Gilbert, E.P.; Shibayama, T.; Watanabe, S.; Ohnuma, M.; Wang, X.-L. Hidden amorphous phase and reentrant supercooled liquid in Pd-Ni-P metallic glass. Nat. Commun. 2017, 8, 14679. [Google Scholar] [CrossRef]
- Hu, Q.; Sheng, H.C.; Fu, M.W.; Zeng, X.R. Influence of melt temperature on the Invar effect in (Fe71.2B24Y4.8)96Nb4 bulk metallic glasses. J. Mater. Sci. 2019, 48, 6900–6906. [Google Scholar]
- Jiang, H.-R.; Bochtler, B.; Riegler, X.-S.; Wei, S.S.; Neuber, N.; Frey, M.; Gallino, I.; Busch, R.; Shen, J. Thermodynamic and kinetic studies of the Cu-Zr-Al(-Sn) bulk metallic glasses. J. Alloys Comp. 2020, 844, 156126. [Google Scholar] [CrossRef]
- Chen, E.-Y.; Peng, S.-X.; Peng Michiel, M.D.; Vaughan, G.B.M.; Yu, Y.; Yu, H.-B.; Ruta, B.; Wei, S.; Liu, L. Glass-forming ability correlated with the liquid-liquid transition in Pd42.5Ni42.5P15 alloy. Scr. Mater. 2021, 193, 117–121. [Google Scholar] [CrossRef]
- Tournier, R.F.; Ojovan, M.I. Comments about a recent publication entitled entitled “Improving glass forming ability of off-eutectic metallic glass formers by manipulating primary crystallization reactions”. Scr. Mater. 2021, 205, 114039. [Google Scholar] [CrossRef]
- Zeng, Y.Q.; Yu, J.S.; Tian, Y.; Hirata, A.; Fujita, T.; Zhang, X.H.; Nishiyama, N.; Kato, H.; Jiang, J.Q.; Inoue, A.; et al. Response to the commentary by Robert Tournier and Michael Ojovan on our publication entitled “Improving glass forming ability of off-eutectic metallic glass formers by manipulating primary crystallization reactions”. Scr. Mater. 2021, 205, 114035. [Google Scholar] [CrossRef]
- Tariq, M.; Dolynchuk, O.; Thurn-Albrecht, T. Effect of substrate interaction on thermodynamics of prefreezing. Macromolecules 2019, 52, 9140–9148. [Google Scholar] [CrossRef]
- Galymzianov, B.N.; Doronina, M.A.; Mokshin, A.V. Arrhenius cross-over temperature of glass-forming liquids predicted by an articial network. Materials 2023, 16, 1127. [Google Scholar] [CrossRef]
- An, Q.; An QJohnson, W.L.; Samwer, K.; Corona, S.L.; Goddart, W.A., III. Formation of two glass phases in binary Cu-Ag liquid. Acta Mater. 2020, 195, 274–281. [Google Scholar]
- Becker, S.; Devijver, E.; Molinier, R.; Jakse, N. Glass-forming ability of elemental zirconium. Phys. Rev. B 2020, 102, 104205. [Google Scholar] [CrossRef]
- An, Q.; Johnson, W.L.; Samwer, K.; Corona, S.L.; Goddard, W.A., III. First-order transition in liquid Ag to the heterogeneous G-Phase. J. Phys. Chem. Lett. 2020, 11, 632–645. [Google Scholar] [CrossRef] [PubMed]
- Tournier, R.F.; Ojovan, M.I. Prediction of second melting temperatures already observed in pure elements by molecular dynamics simulations. Materials 2021, 14, 6509. [Google Scholar] [CrossRef] [PubMed]
- Popel, P.S.; Chikova, O.A.; Matveev, V.M. Metastable colloidal states of liquid metallic solutions. High Temp. Mater. Proc. 1995, 4, 219–233. [Google Scholar] [CrossRef]
- Louzguine-Luzgin, D.V.; Belosludov, R.; Saito, M.; Kawazoe, Y.; Inoue, A. Glass transition of Ni: Calculation, Prediction, and experiment. J. Appl. Phys. 2008, 104, 123529. [Google Scholar] [CrossRef]
- Zhou, C.; Hu, L.; Sun, Q.; Qin, J.; Brian, X.; Yue, Y. Indication of liquid-liquid phase transition in CuZr-based melts. Appl. Phys. Lett. 2013, 103, 171904. [Google Scholar] [CrossRef]
- Bennett, T.D.; Yue, Y.; Li, P.; Qiao, A.; Tao, H.; Greaves, N.G.; Richards, T.; Lampronti, G.I.; Redfern, S.A.T.; Blanc, F.; et al. Melt-quenched glasses of metal-organic frameworks. J. Am. Chem. Soc. 2016, 138, 3484–3492. [Google Scholar] [CrossRef]
- Longley, L.; Calahoo, C.; Limbach, R.; Xia, Y.; Tuffnell, J.M.; Sapnik, A.F.; Thorne, M.F.; Keeble, D.S.; Keen, D.A.; Wondraczek, L.; et al. Metal-organic framework and inorganic glass composites. Nat. Commun. 2020, 11, 5800. [Google Scholar] [CrossRef] [PubMed]
- Xu, L.; Wang, Z.; Chen, J.; Chen, S.; Yang, W.; Ren, Y.; Zuo, X.; Zeng, J.; Wu, Q.; Sheng, H. Folded network and structural transition in molten tin. Nat. Commun. 2022, 13, 126. [Google Scholar] [CrossRef]
- Roller, J.; Laganopan, A.; Meijer, J.-M.; Fuchs, M.; Zumbusch, A. Observation of liquid glass in suspension of ellipsoidal colloids. Proc. Natl. Acad. Sci. USA 2021, 118, e2018072118. [Google Scholar] [CrossRef] [PubMed]
- Takaiwa, D.; Atano, I.; Koga, K.; Tanaka, H. Phase diagram of water in carbon nanotubes. Proc. Natl. Acad. Sci. USA 2008, 105, 39–43. [Google Scholar] [CrossRef]
- Tournier, R.F.; Bossy, J. 4He glass phase: A model for liquid elements. Chem. Phys. Lett. 2016, 658, 282–286. [Google Scholar] [CrossRef]
- Tournier, R.F. Validation of non-classical homogeneous nucleation model for G-glass and L-glass formations in liquid elements with recent molecular dynamics simulations. Scr. Mater. 2021, 199, 113859. [Google Scholar] [CrossRef]
- Bazlov, A.I.; Louzguine-Luzguin, D.V. Crystallization of FCC and BCC liquid metals studied by molecular dynamics simulation. Metals 2020, 10, 1532. [Google Scholar]
- Buchwitz, M.; Adlwarth-Dieball, R.; Ryder, P.L. Kinetics of crystallization of amorphous Ti2Ni. Act. Met. Mater. 1993, 41, 1885–1892. [Google Scholar] [CrossRef]
- Plimpton, S.J. Fast prallel algorithms for short-range molecular dynamics. J. Comp. Phys. 1995, 117, 1. [Google Scholar] [CrossRef]
- Wang, Z.; Chen, C.L.; Ketov, S.V.; Akagi, K.; Tsarkov, A.A.; Ikuara, Y.; Louzguine-Luzgin, D.V. Local chemical ordering within the incubation period as a trigger for nanocrystallization of a highly supercooled Ti-based liquid. Mater. Design. 2018, 156, 504–513. [Google Scholar] [CrossRef]
- Nose, S. A unified formulation of the constant temperature molecular dynamics methods. J. Chem. Phys. 1984, 81, 511. [Google Scholar] [CrossRef]
- Hoover, W.J. Canonical dynamics, Equilibrium phase-space distributions. Phys. Rev. A 1985, 31, 1965. [Google Scholar] [CrossRef]
- Beredsen, H.J.C.; Postma, J.P.M.; Van Gunsteren, W.F.; DiNola, A.; Haak, J.R. Molecular dynamics with stable coupling to an external bath. J. Chem. Phys. 1984, 81, 3684–3690. [Google Scholar] [CrossRef]
- Otsuka, K.; Ren, X. Martensitic transformations in nonferrous shape memory alloys. Mater. Sci. Eng. 1999, 273–275, 89–105. [Google Scholar] [CrossRef]
- Ezenwa, I.C.; Yoshino, T. Electrical Resistivity of Cu and Au at High Pressure above 5 GPa: Implications for the Constant Electrical Resistivity Theory along the Melting Curve of the Simple Metals. Materials 2021, 14, 5476. [Google Scholar] [CrossRef]
- Ho, K.H.; Nguyen, N.H. High pressure melting curves of silver, gold and coppe. AIP Adv. Pub. 2013, 3, 112125. [Google Scholar]
- Cohen, L.H.; Klement, W., Jr.; Kennedy, G.C. Melting of copper, silver and gold at high pressures. Phys. Rev. 1966, 145, 519. [Google Scholar] [CrossRef]
- Pham, D.T.; Nguyen, Q.H.; Bui, D.T.; Pham, D.T. Melting curve of metals Cu, Ag and Au under pressure. Mod. Phys. Lett. B 2016, 30, 1550273. [Google Scholar]
- Goyal, M. Melting temperature of metal under pressure. Chin. J. Phys. 2020, 66, 453–460. [Google Scholar] [CrossRef]
- Japel, S.; Schwager, B.; Boehler, R.; Ross, M. Melting of copper and nickel at high pressure. Phys. Rev. Lett. 2005, 95, 167801. [Google Scholar] [CrossRef]
- Aquilanti, G.; Rapananti, A.T.; Karandikar, A.; Boehler, R. Melting of iron determined by X-ray absorption spectroscopy to 100 GPa. Proc. Natl. Acad. Sci. USA 2015, 112, 12042–12045. [Google Scholar] [CrossRef] [PubMed]
- Sinmyo, R.; Hirose, K.; Ohishi, Y. Melting curve of iron to 290 GPa determined in a resistance-heated diamond-anvil cell. Earth Planet. Sci. Lett. 2019, 510, 45–52. [Google Scholar] [CrossRef]
- Ojovan, M.I. The Flow of Glasses and Glass–Liquid Transition under Electron Irradiation. Int. J. Mol. Sci. 2023, 24, 12120. [Google Scholar] [CrossRef] [PubMed]
- Kurtuldu, G.; Shamlaye, K.F.; Löffler, J. Metastable quasi-crystal induced nucleation in a bulk glass-forming melt. Proc. Natl. Acad. Sci. USA 2018, 115, 6123–6128. [Google Scholar] [CrossRef]
- Ojovan, M.I. Glass formation. In Encyclopedia of Glass Science, Technology, History, and Culture; Richet, P., Conradt, R., Takada, A., Dyon, J., Eds.; Wiley: Hoboken, NJ, USA, 2021; 1568p, pp. 249–259. [Google Scholar] [CrossRef]
- Ojovan, M.I.; Tournier, R.F. On structural rearrangements near the glass transition temperature in amorphous silica. Materials 2021, 14, 5235. [Google Scholar] [CrossRef] [PubMed]
- Ojovan, M.I.; Louzguine-Luzgin, D.V. On Structural Rearrangements during the Vitrification of Molten Copper. Materials 2022, 15, 1313. [Google Scholar] [CrossRef] [PubMed]


Disclaimer/Publisher’s Note: The statements, opinions and data contained in all publications are solely those of the individual author(s) and contributor(s) and not of MDPI and/or the editor(s). MDPI and/or the editor(s) disclaim responsibility for any injury to people or property resulting from any ideas, methods, instructions or products referred to in the content. |
© 2023 by the authors. Licensee MDPI, Basel, Switzerland. This article is an open access article distributed under the terms and conditions of the Creative Commons Attribution (CC BY) license (https://creativecommons.org/licenses/by/4.0/).