


Numerical Study of the Plastic Zone at the Crack Front in Cylindrical Aluminum Specimens Subjected to Tensile Loads

 , , and
Abstract
:1. Introduction
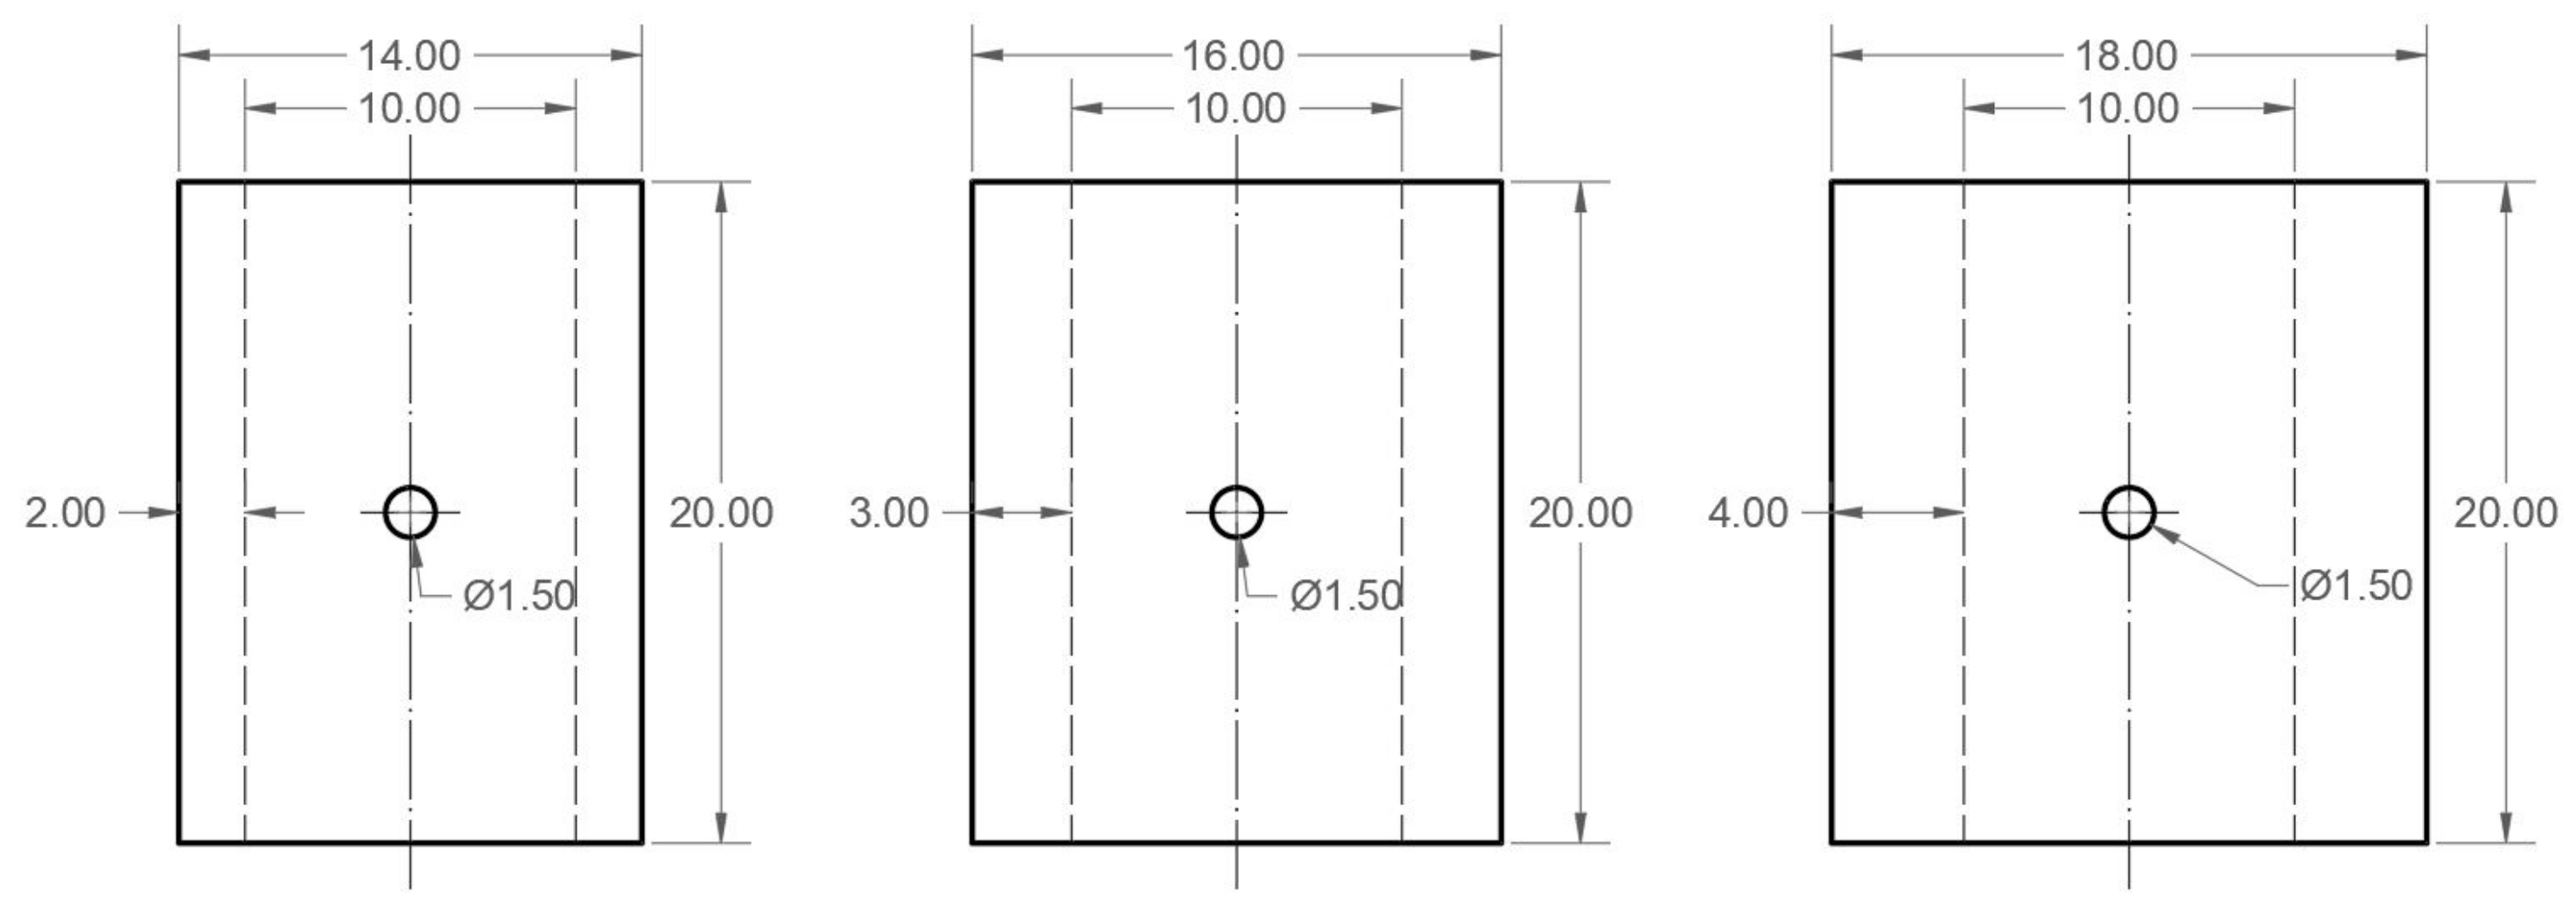
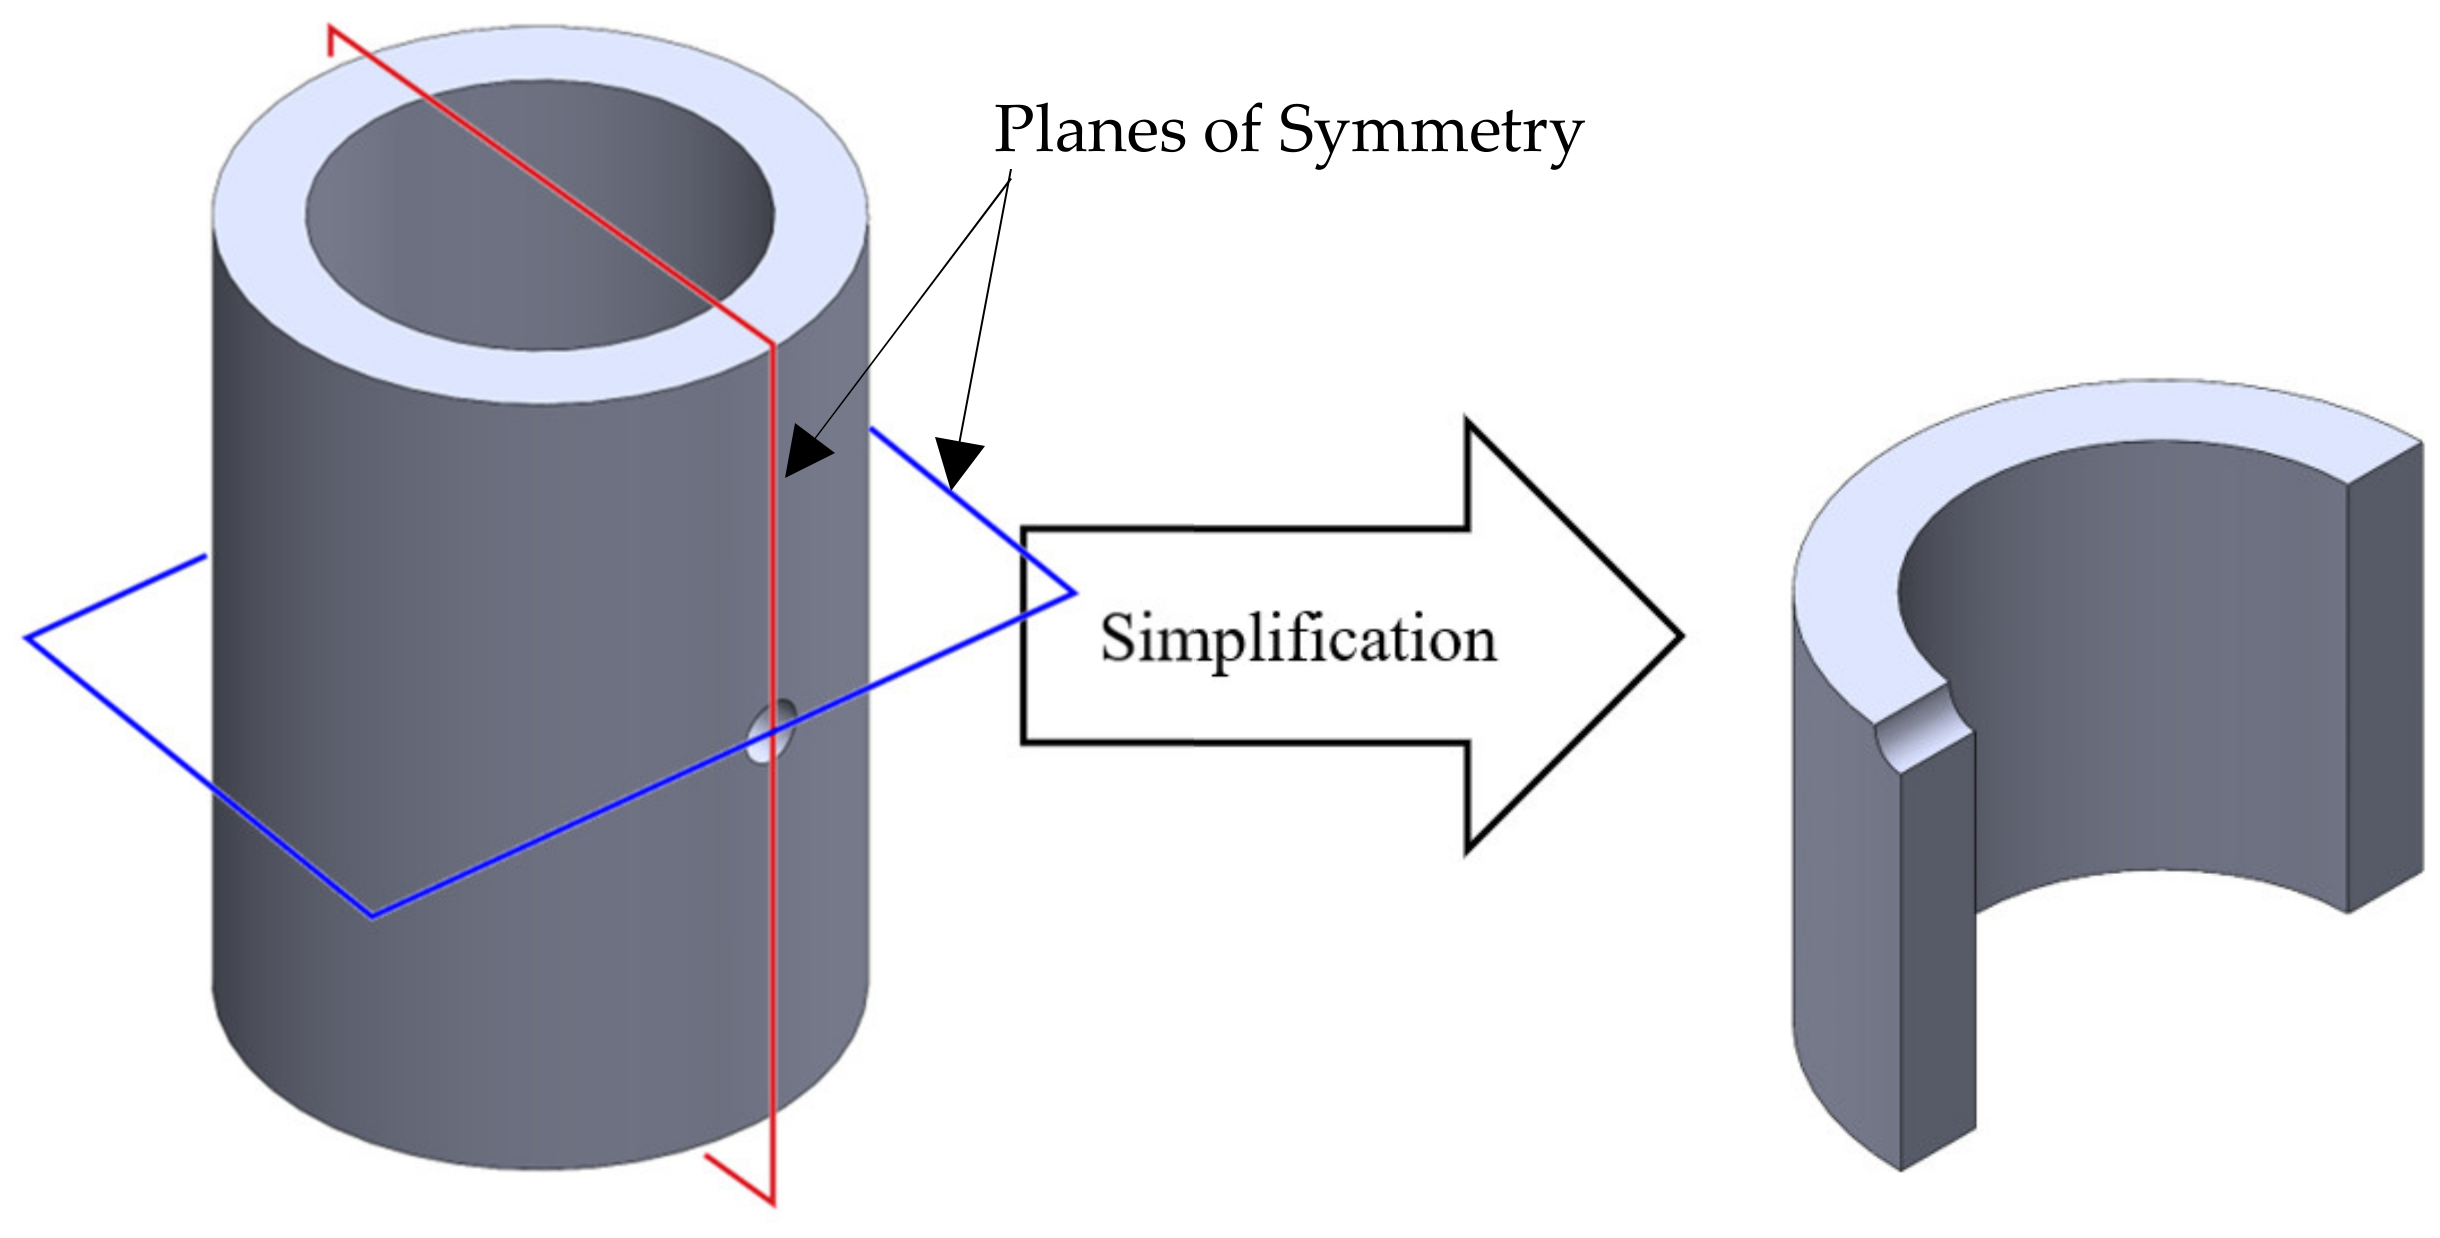
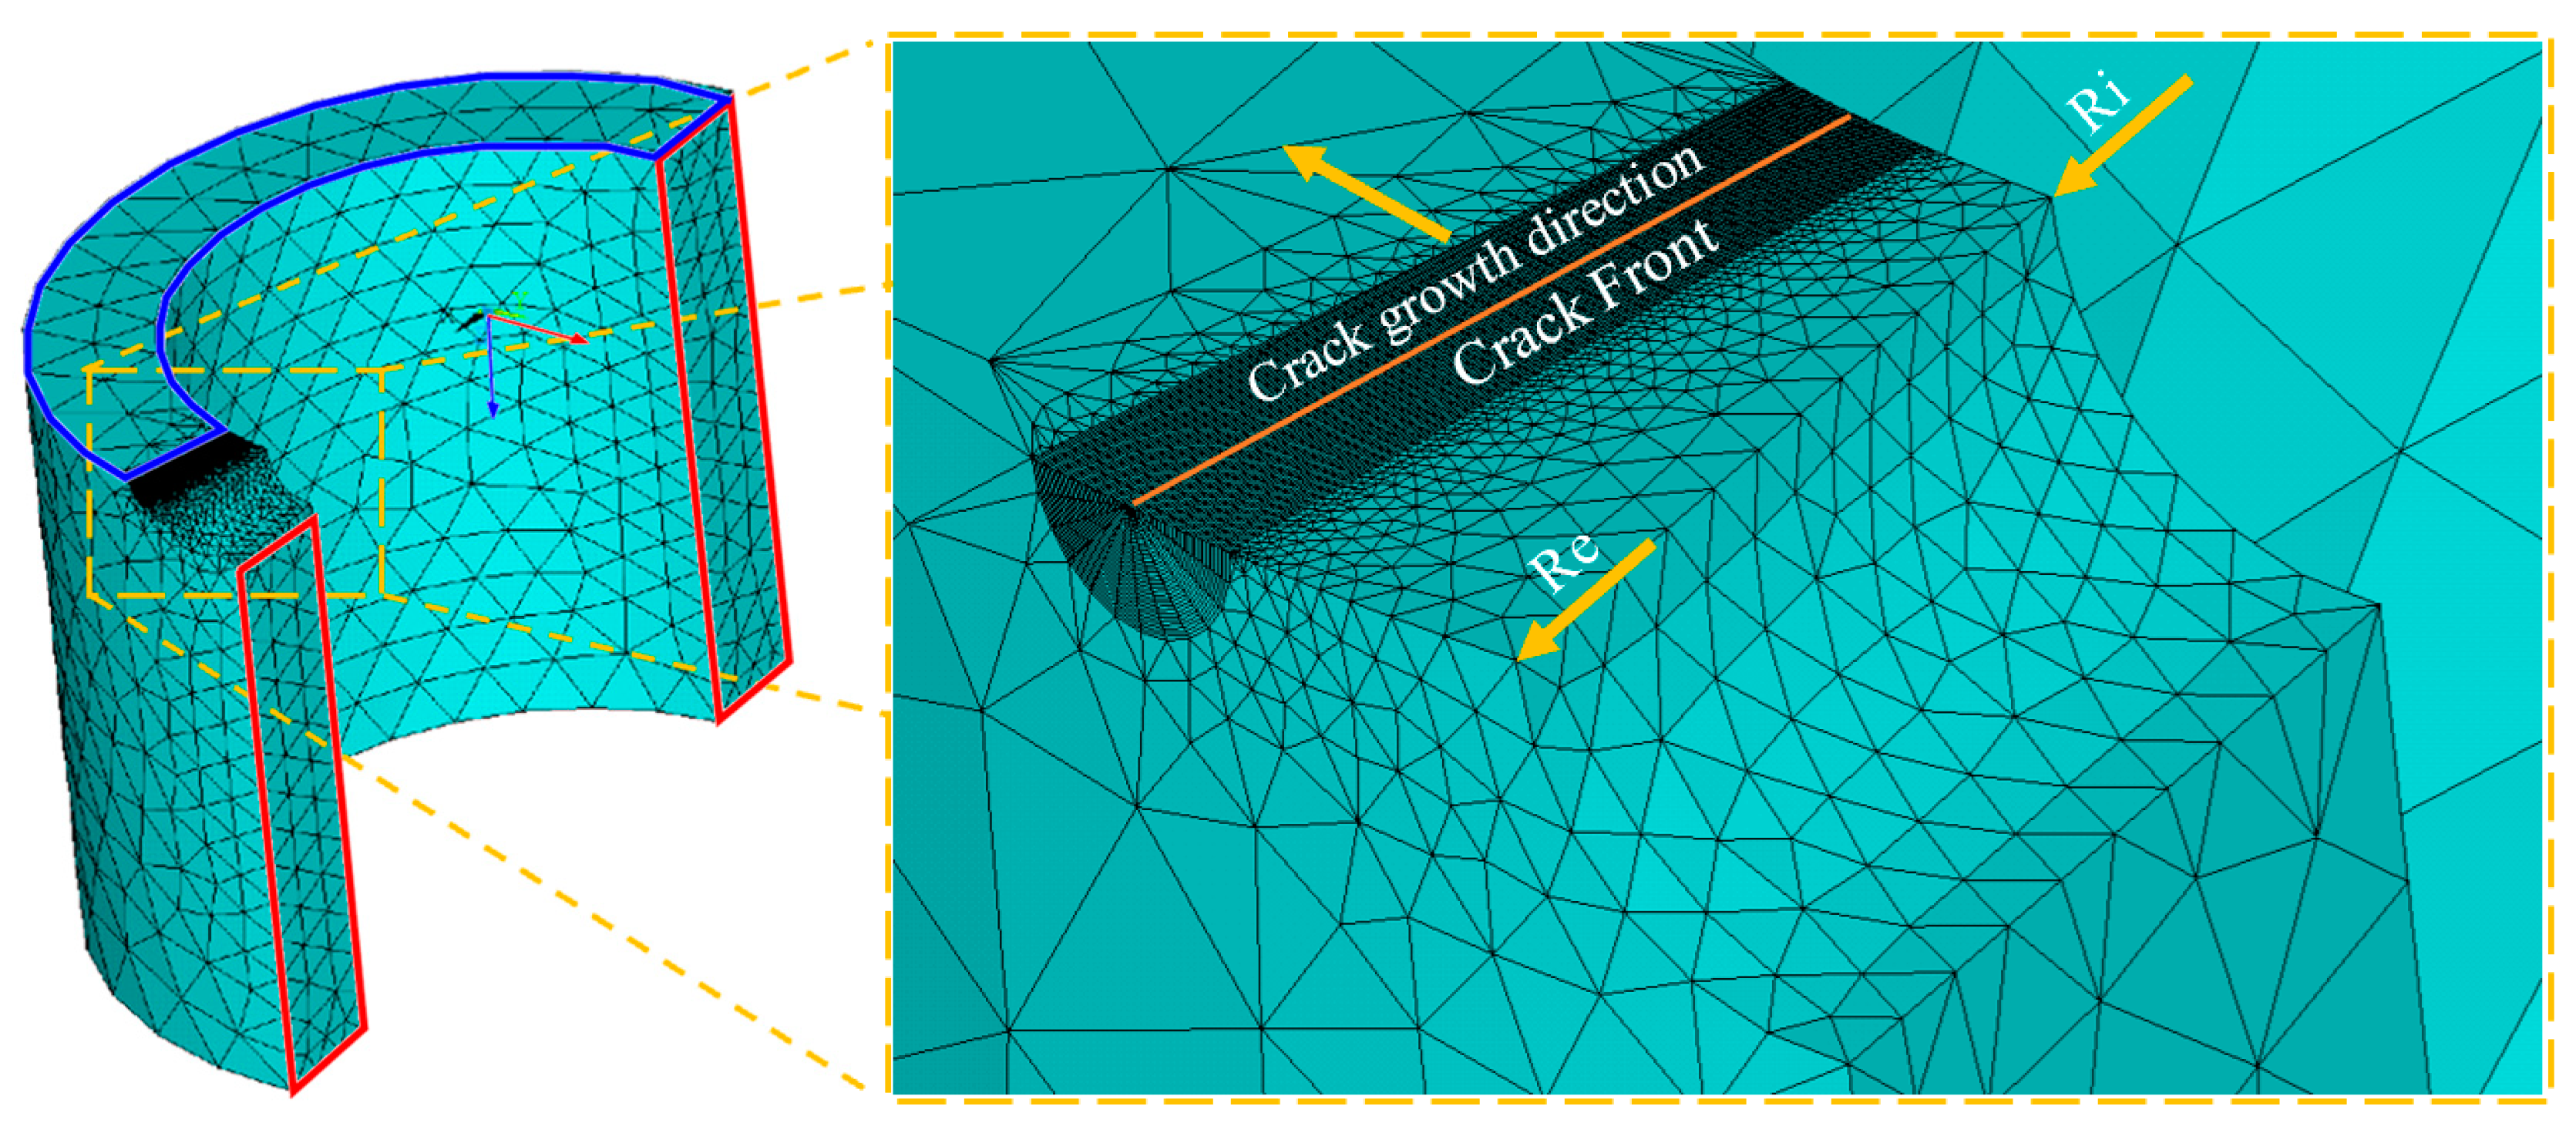
2. Materials and Methods
3. Results and Discussion
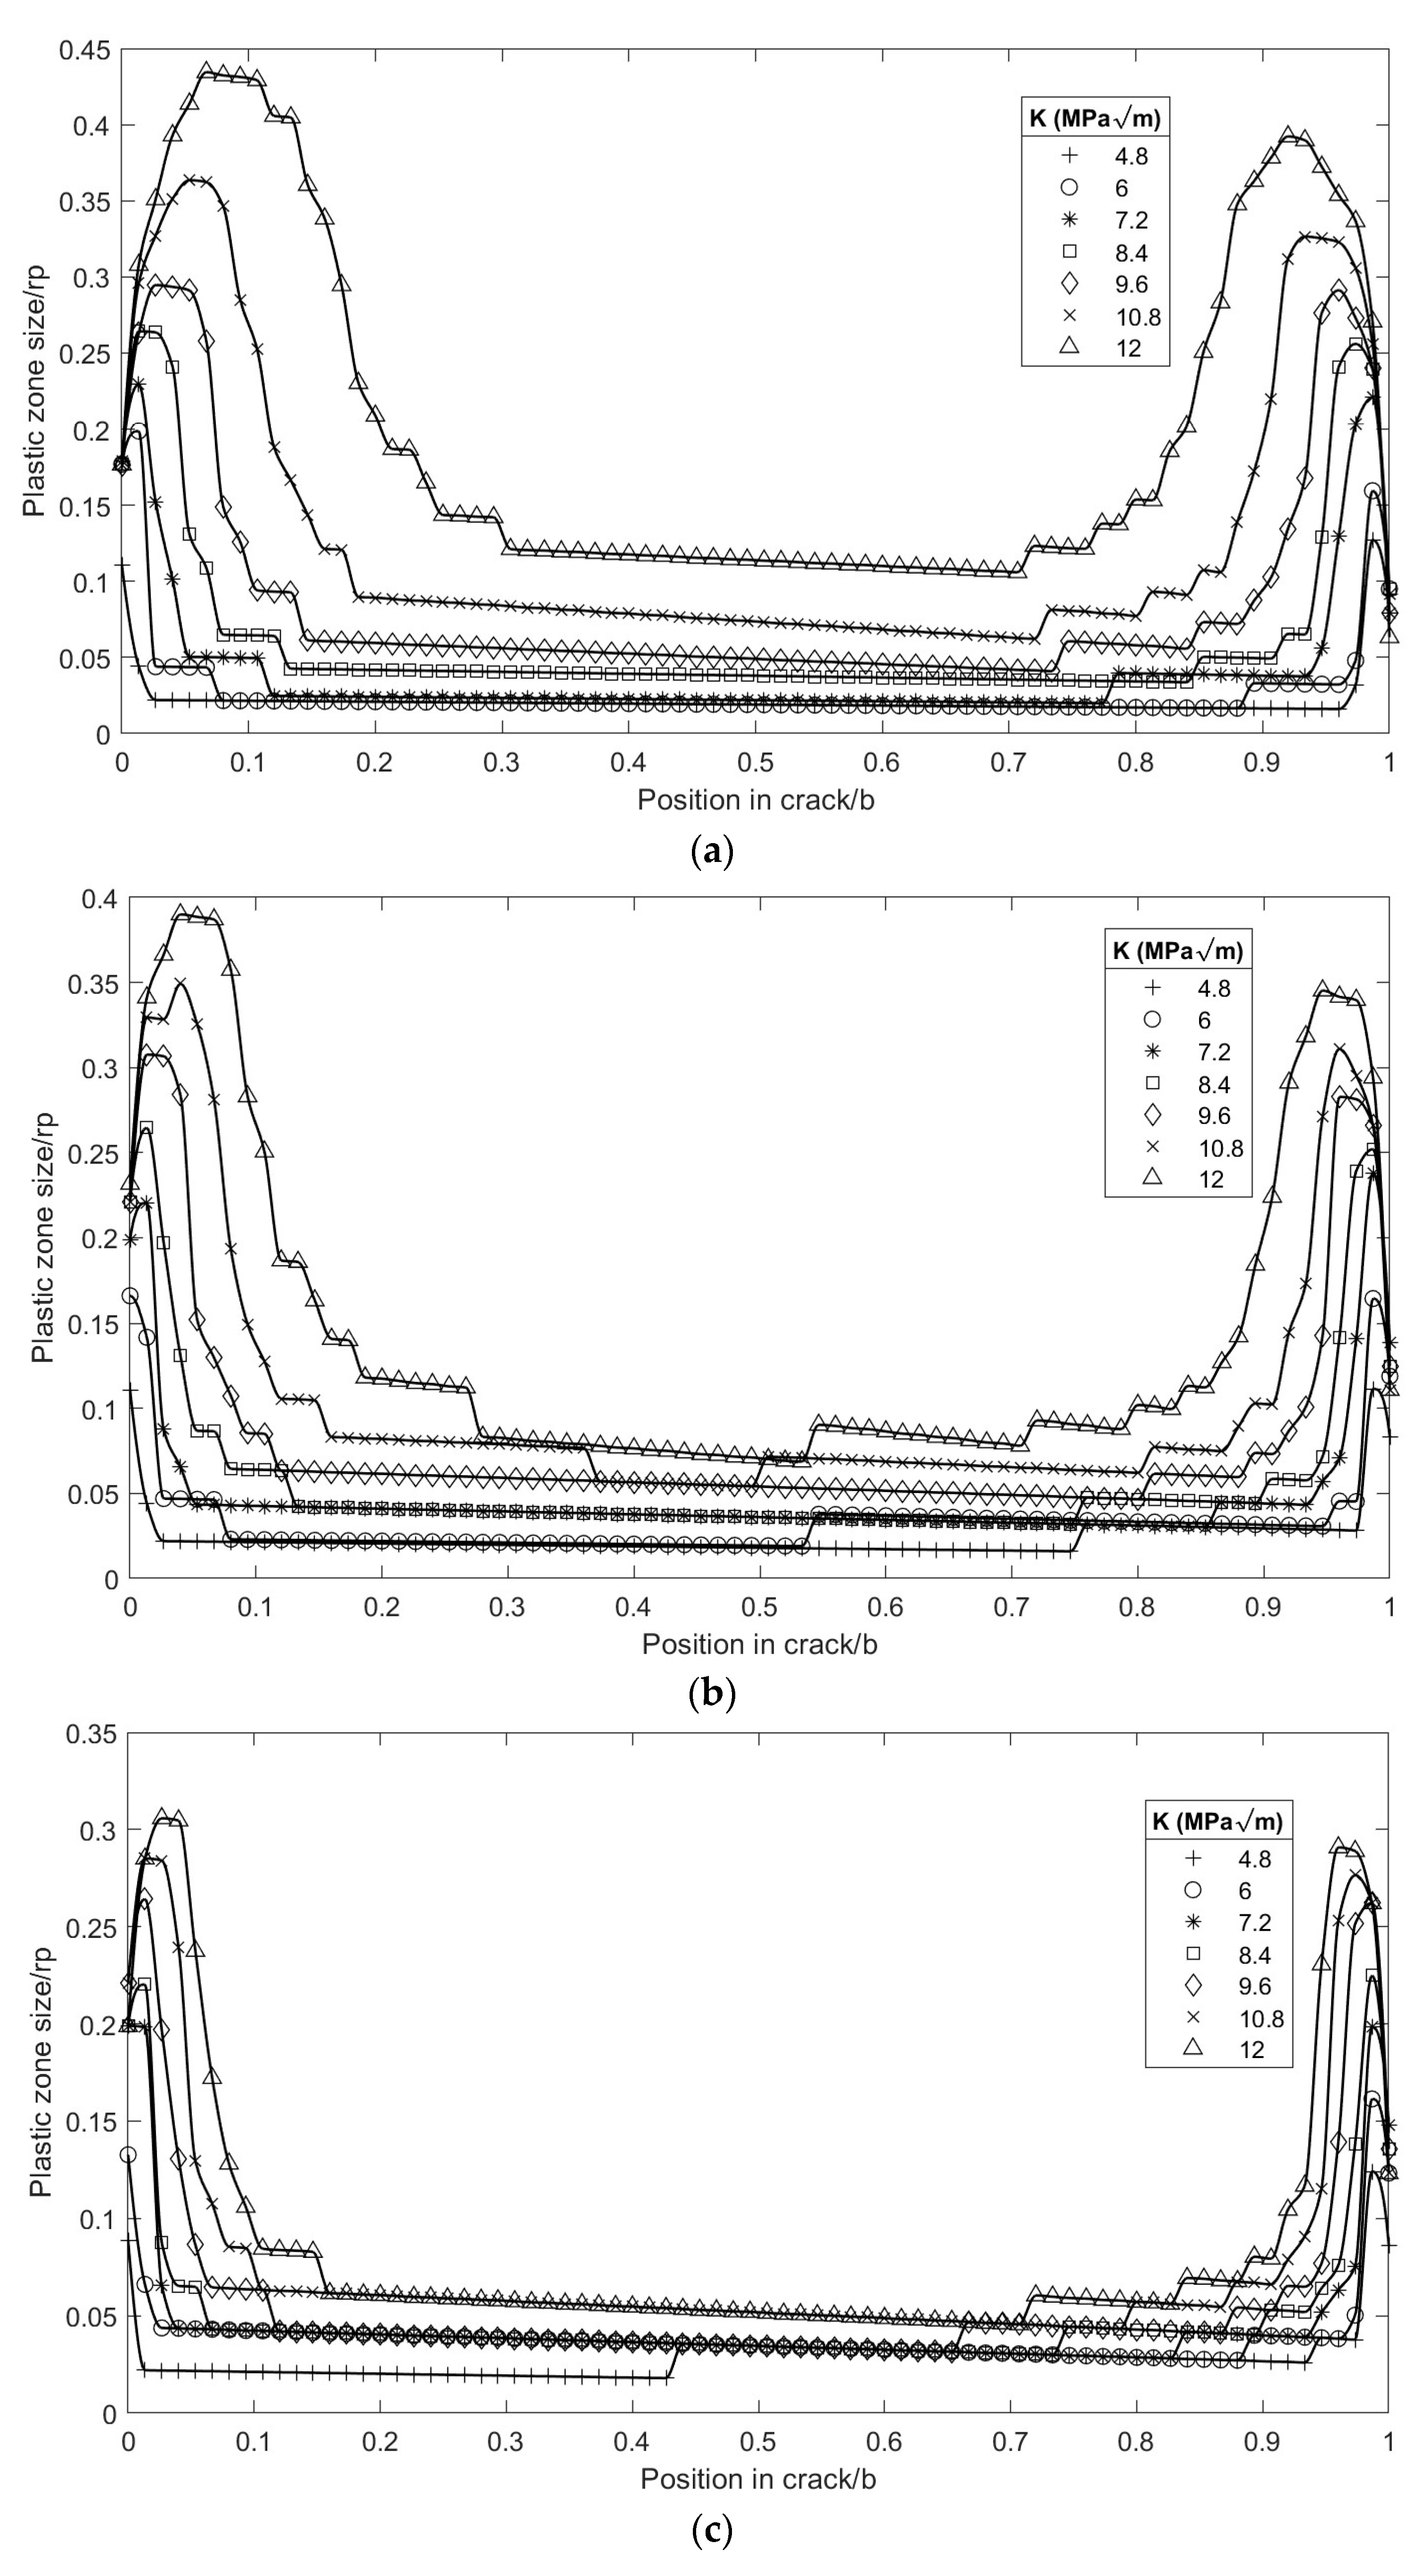
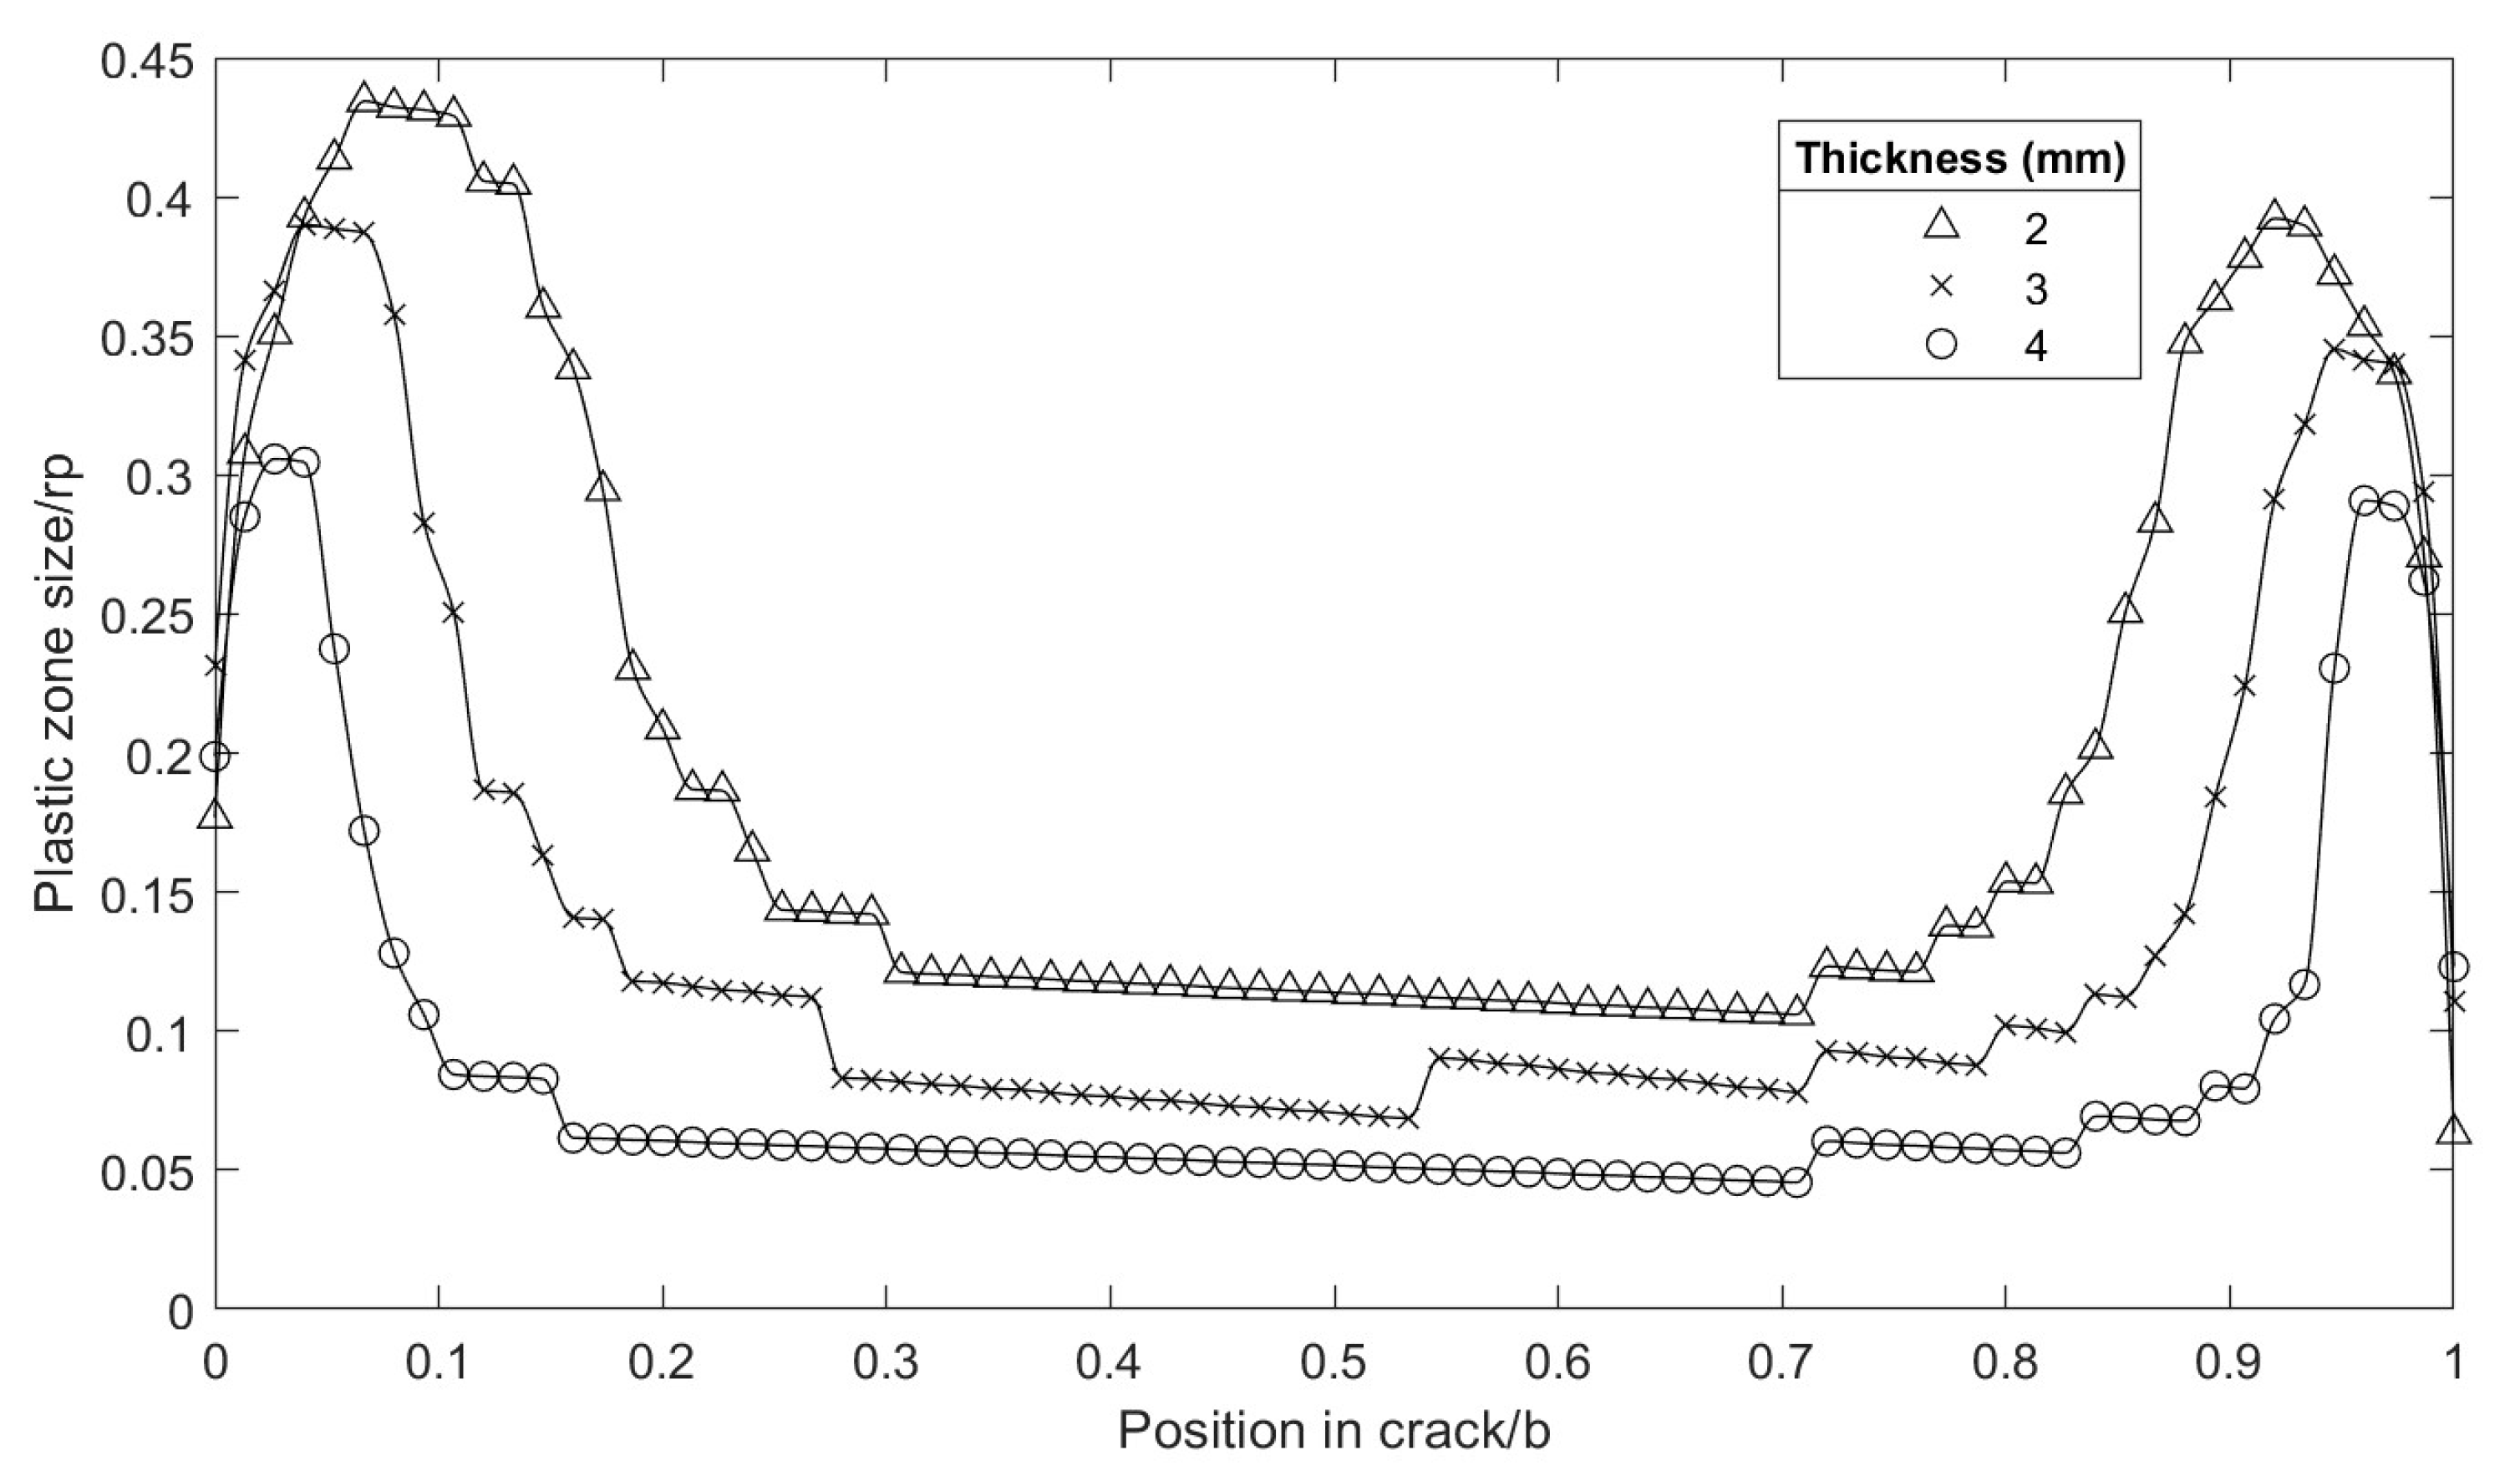
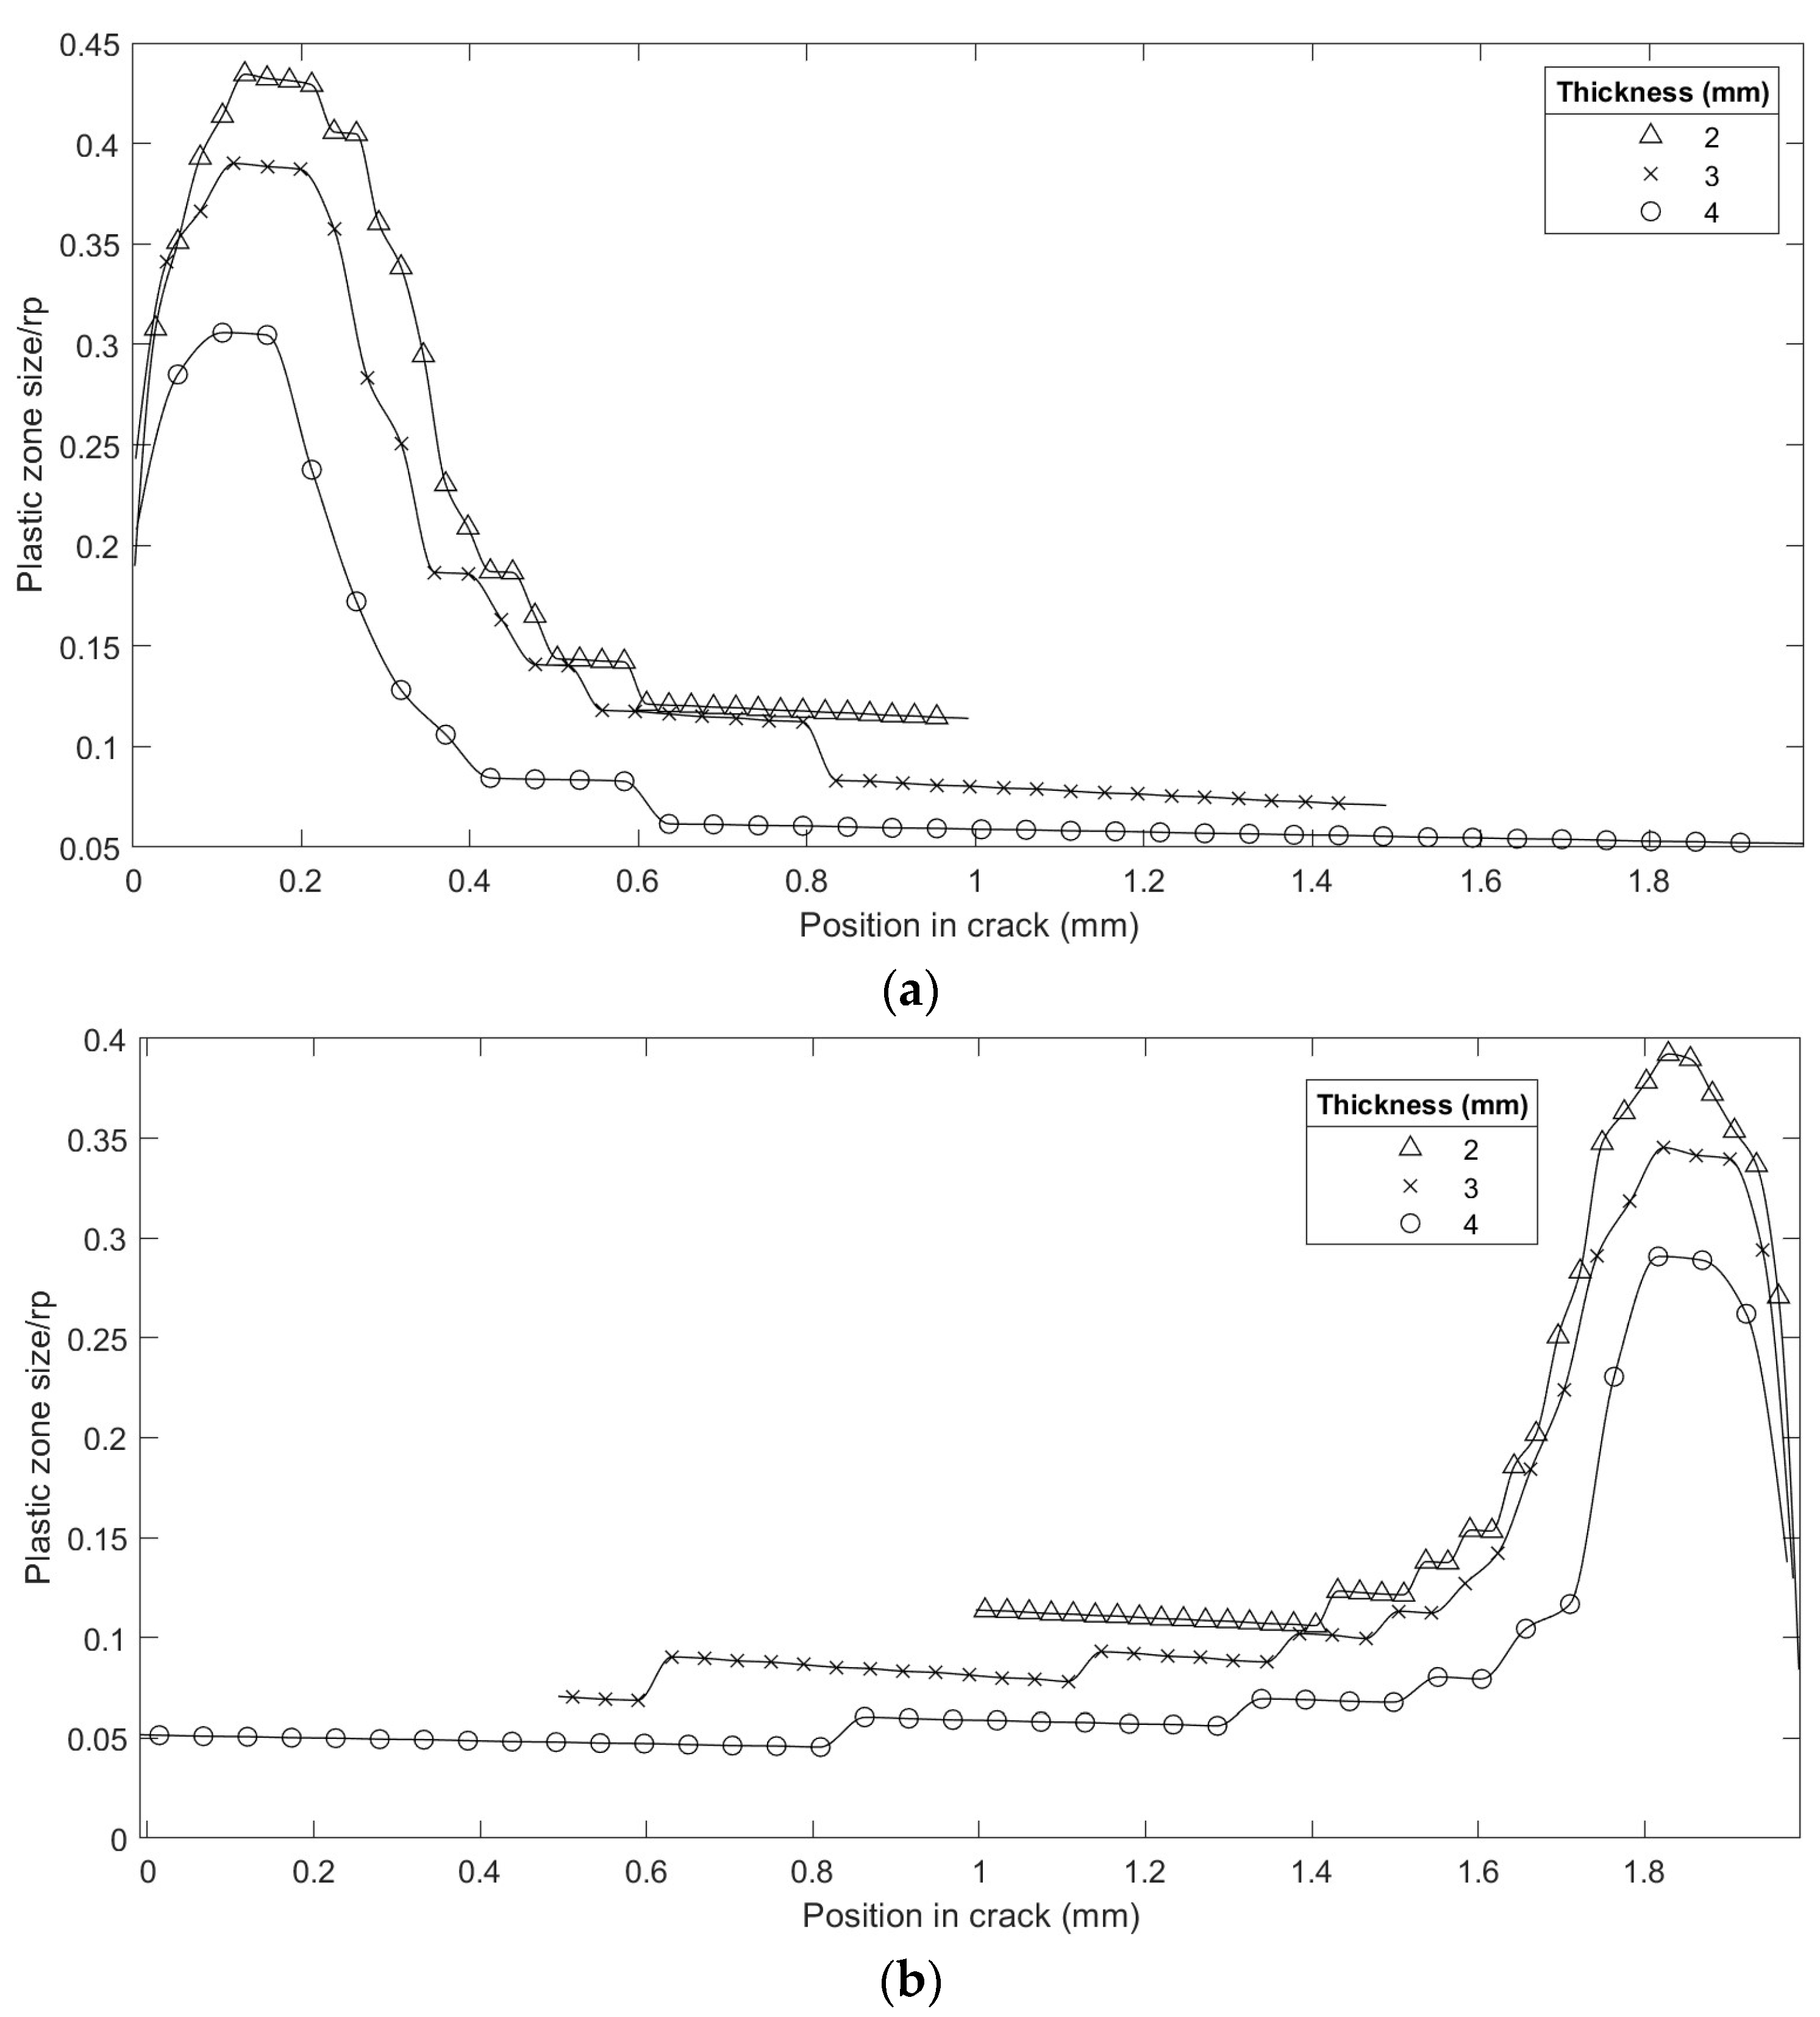
3.1. Plastic Zone Size
3.2. Stress State along the Thickness
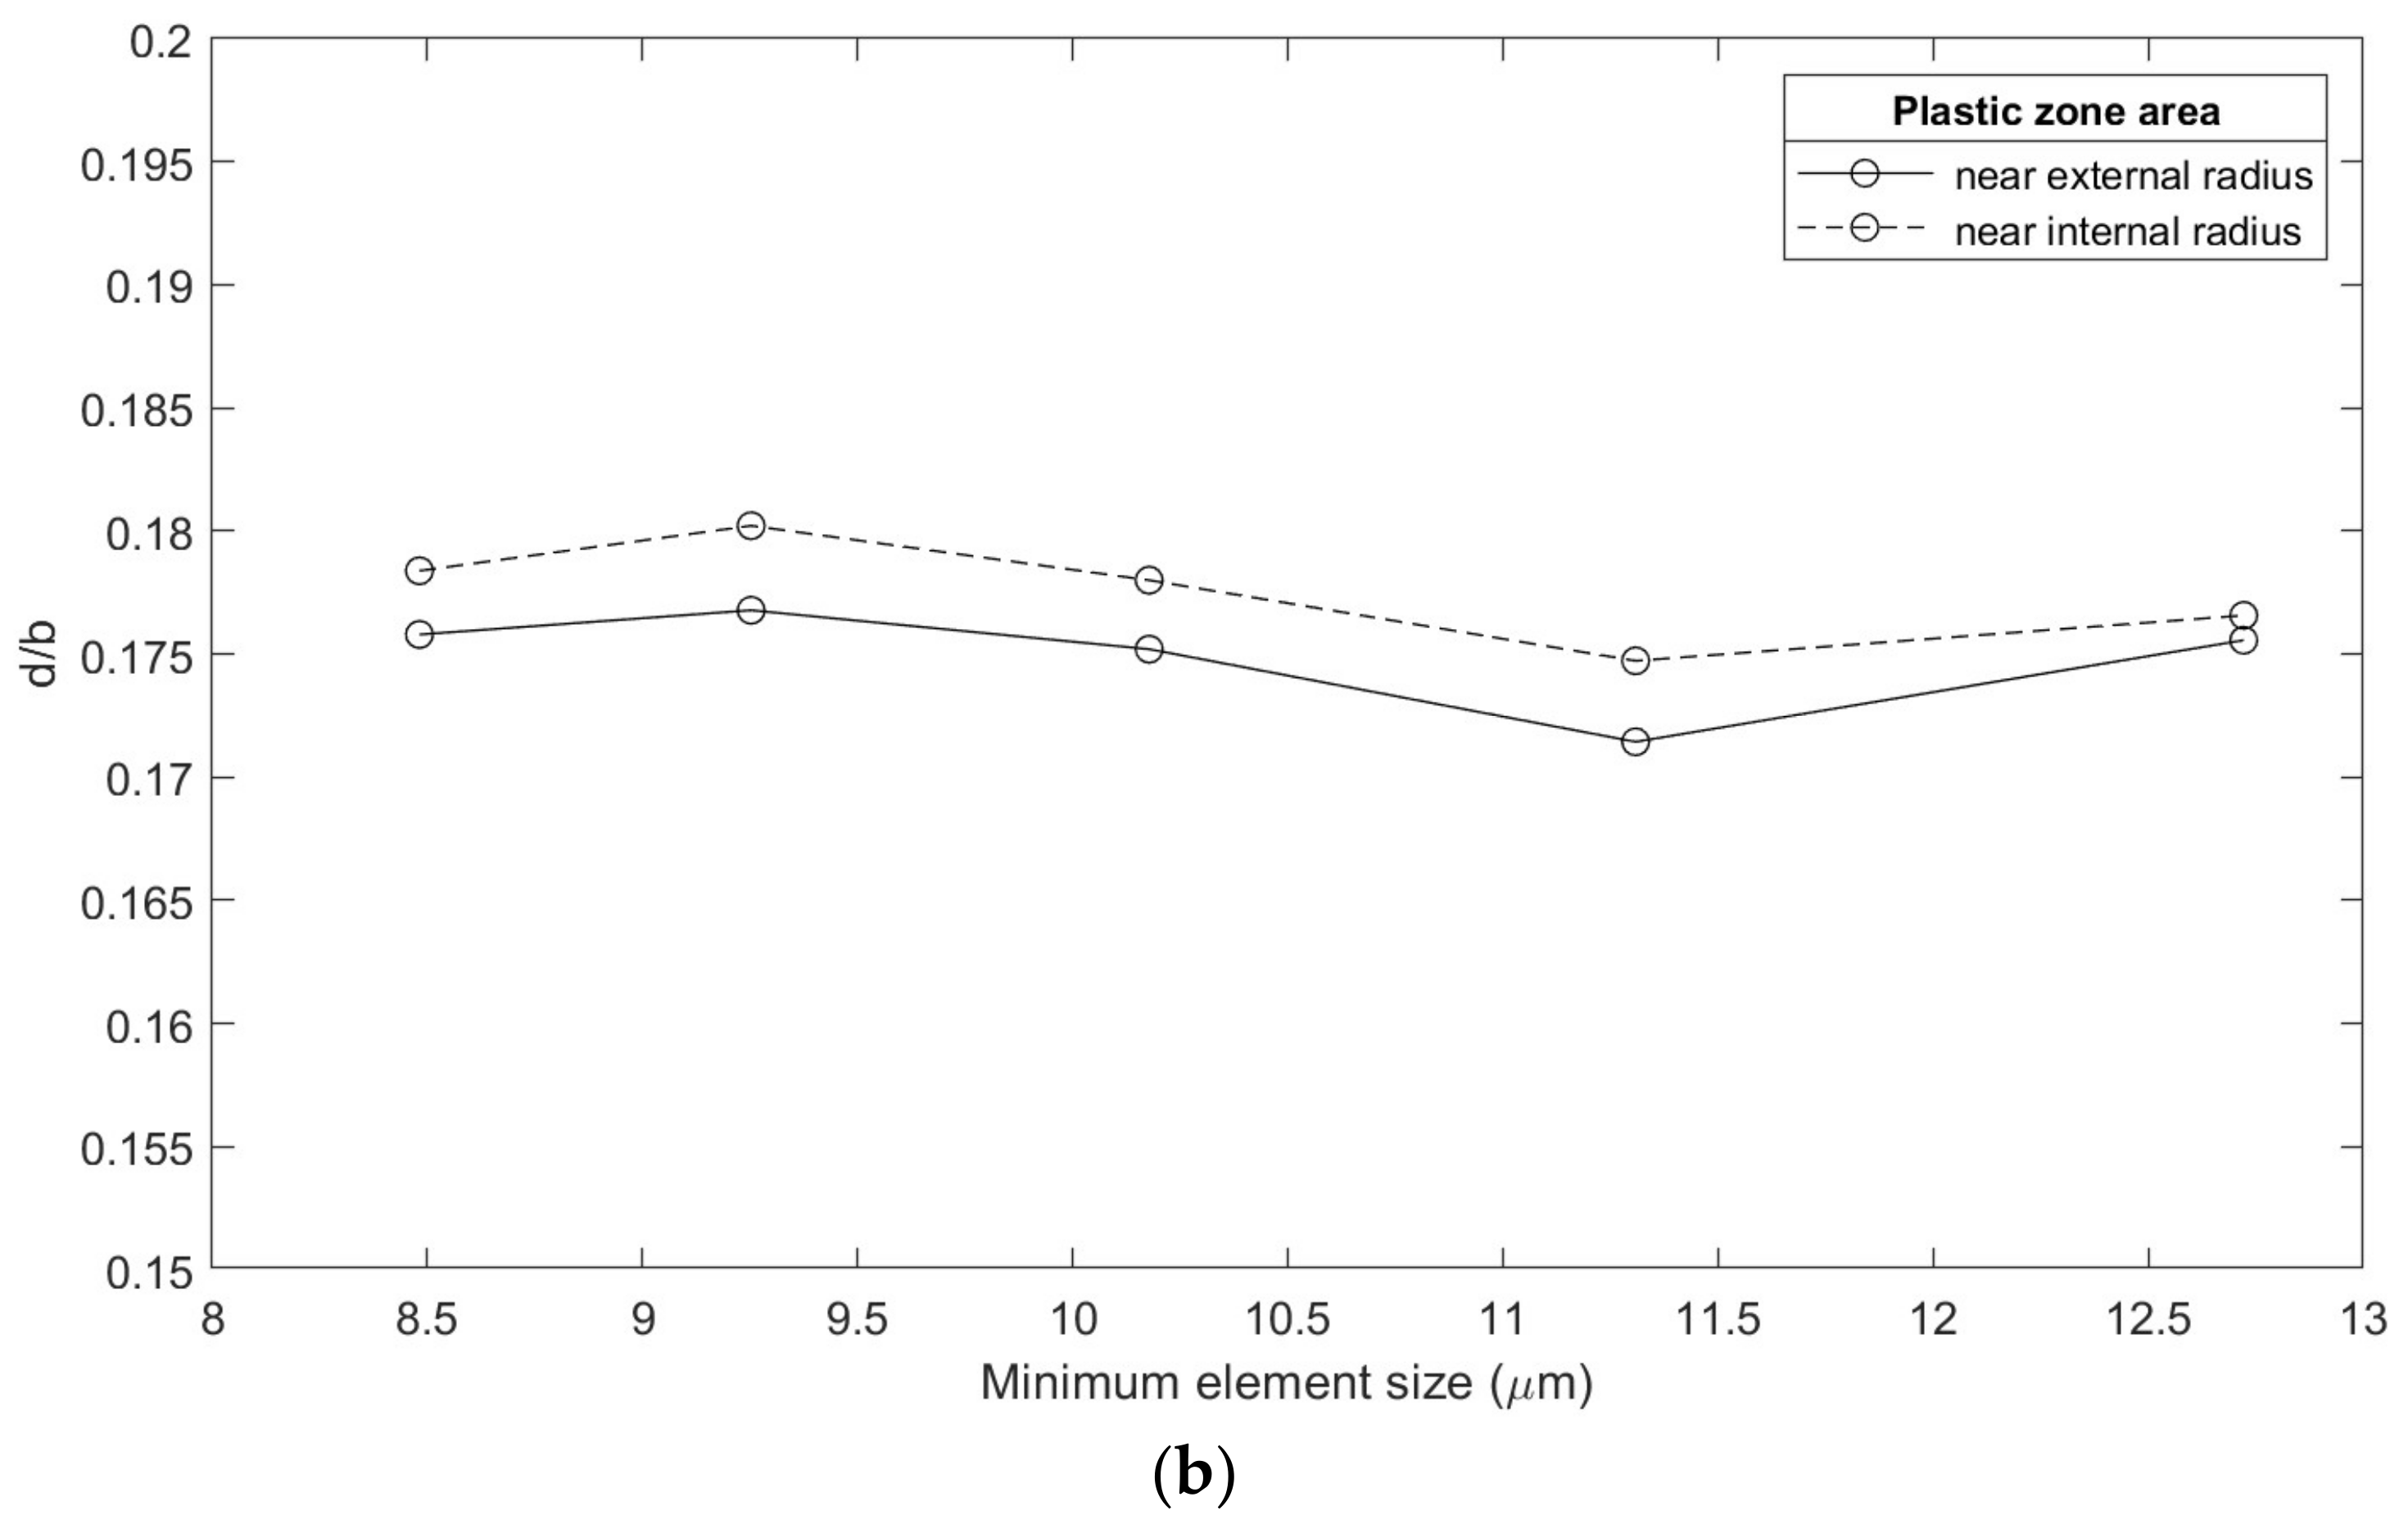
3.3. Numerical Verification
4. Conclusions
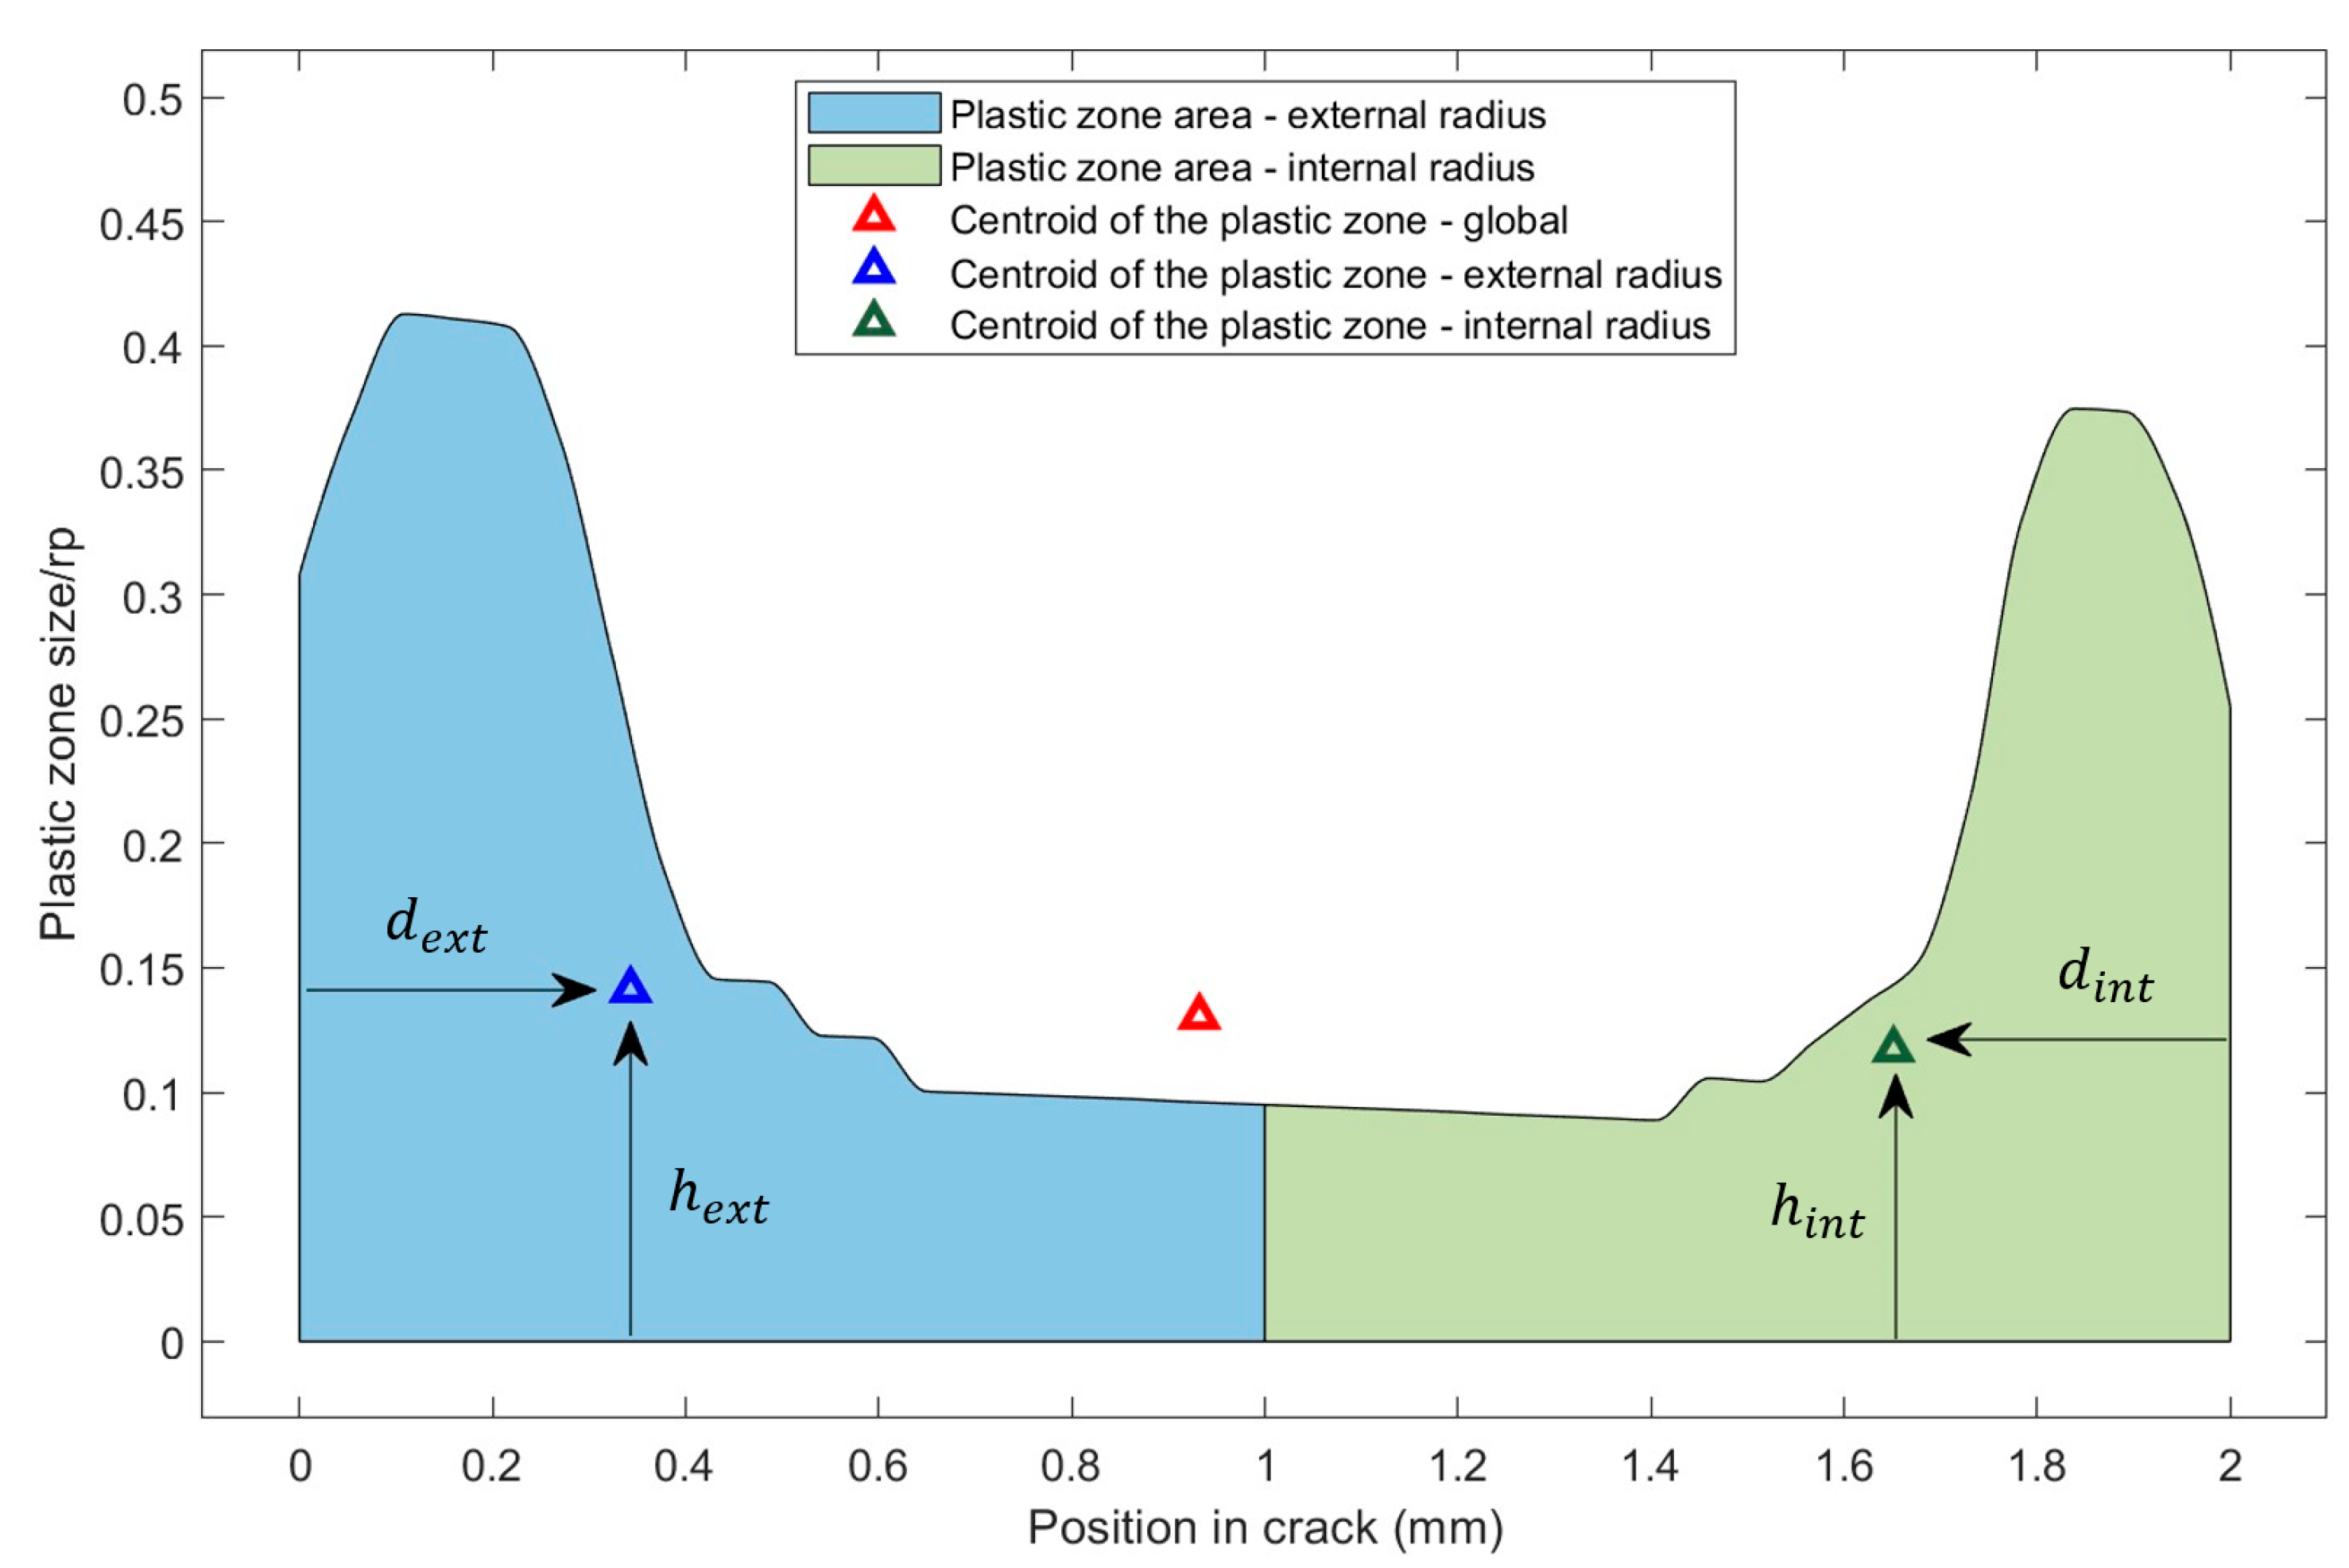
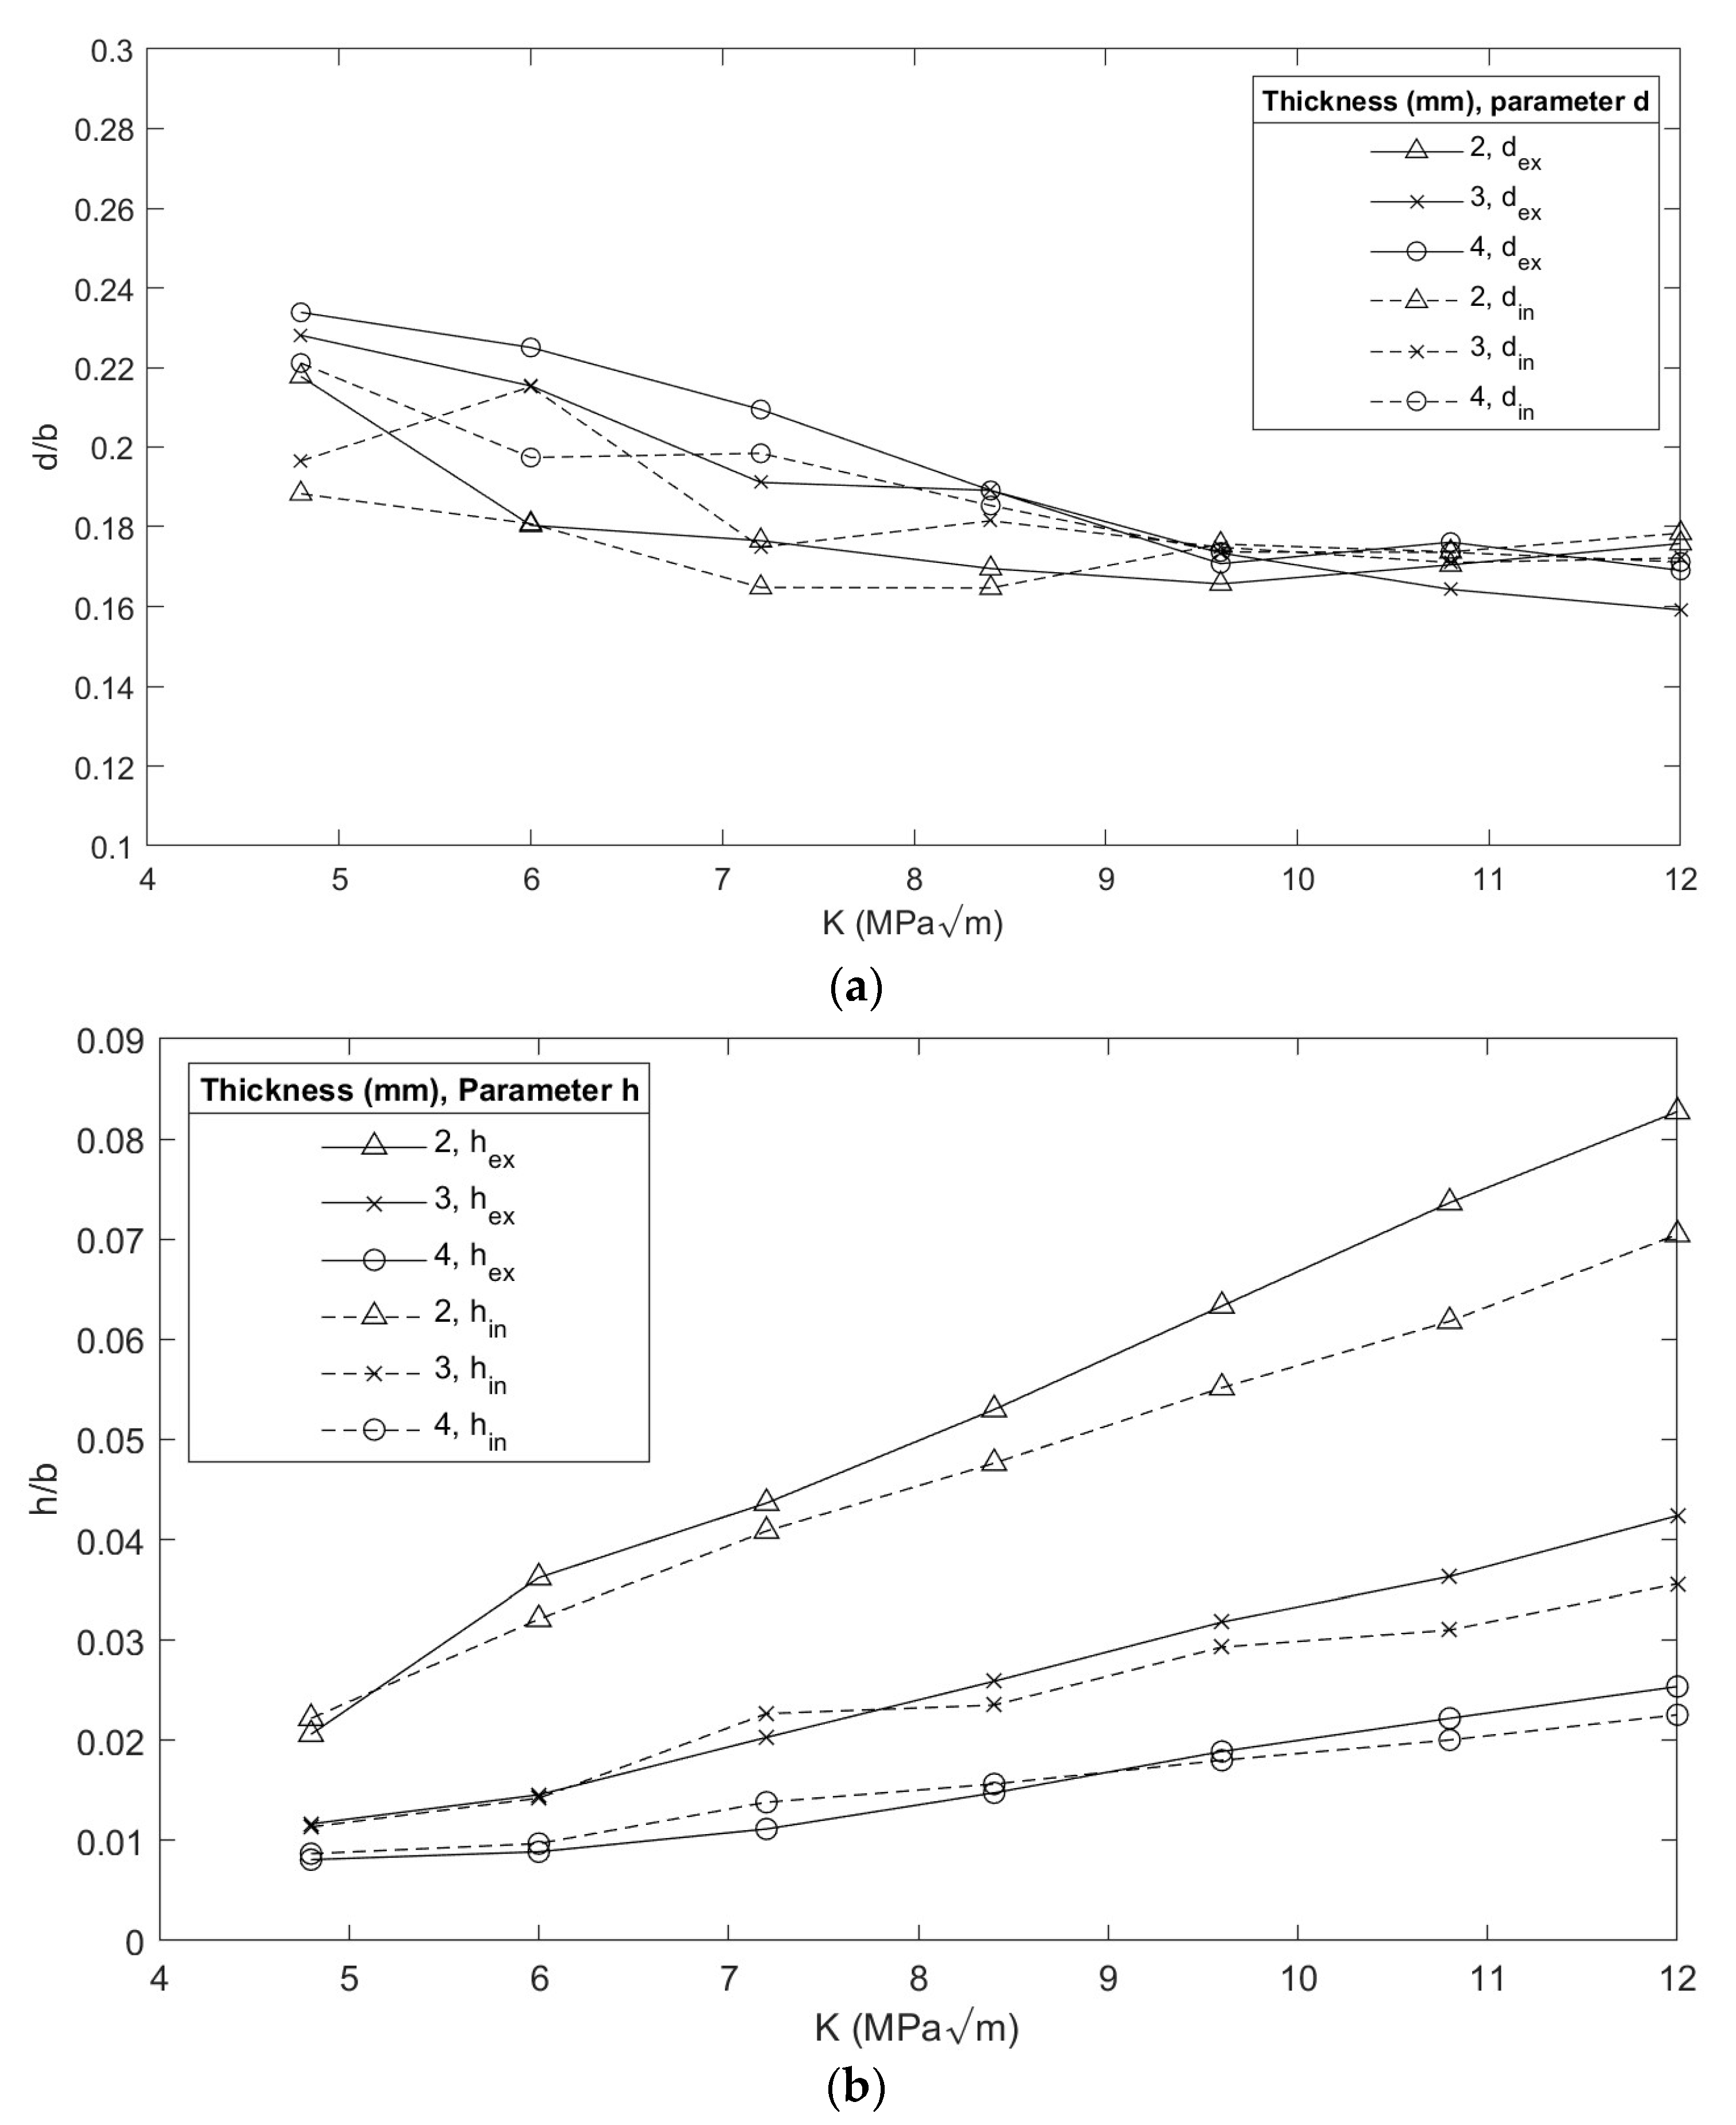
- When evaluating the shape of the plastic zone in the flat zone of the crack front in cylindrical specimens, a clear difference was found concerning flat specimens. The geometry of its ends showed a quantifiable geometric difference in area parameters associated with the internal and external radii. This difference increased as the load values increased. For low load values, their geometric characteristics tended to be similar;
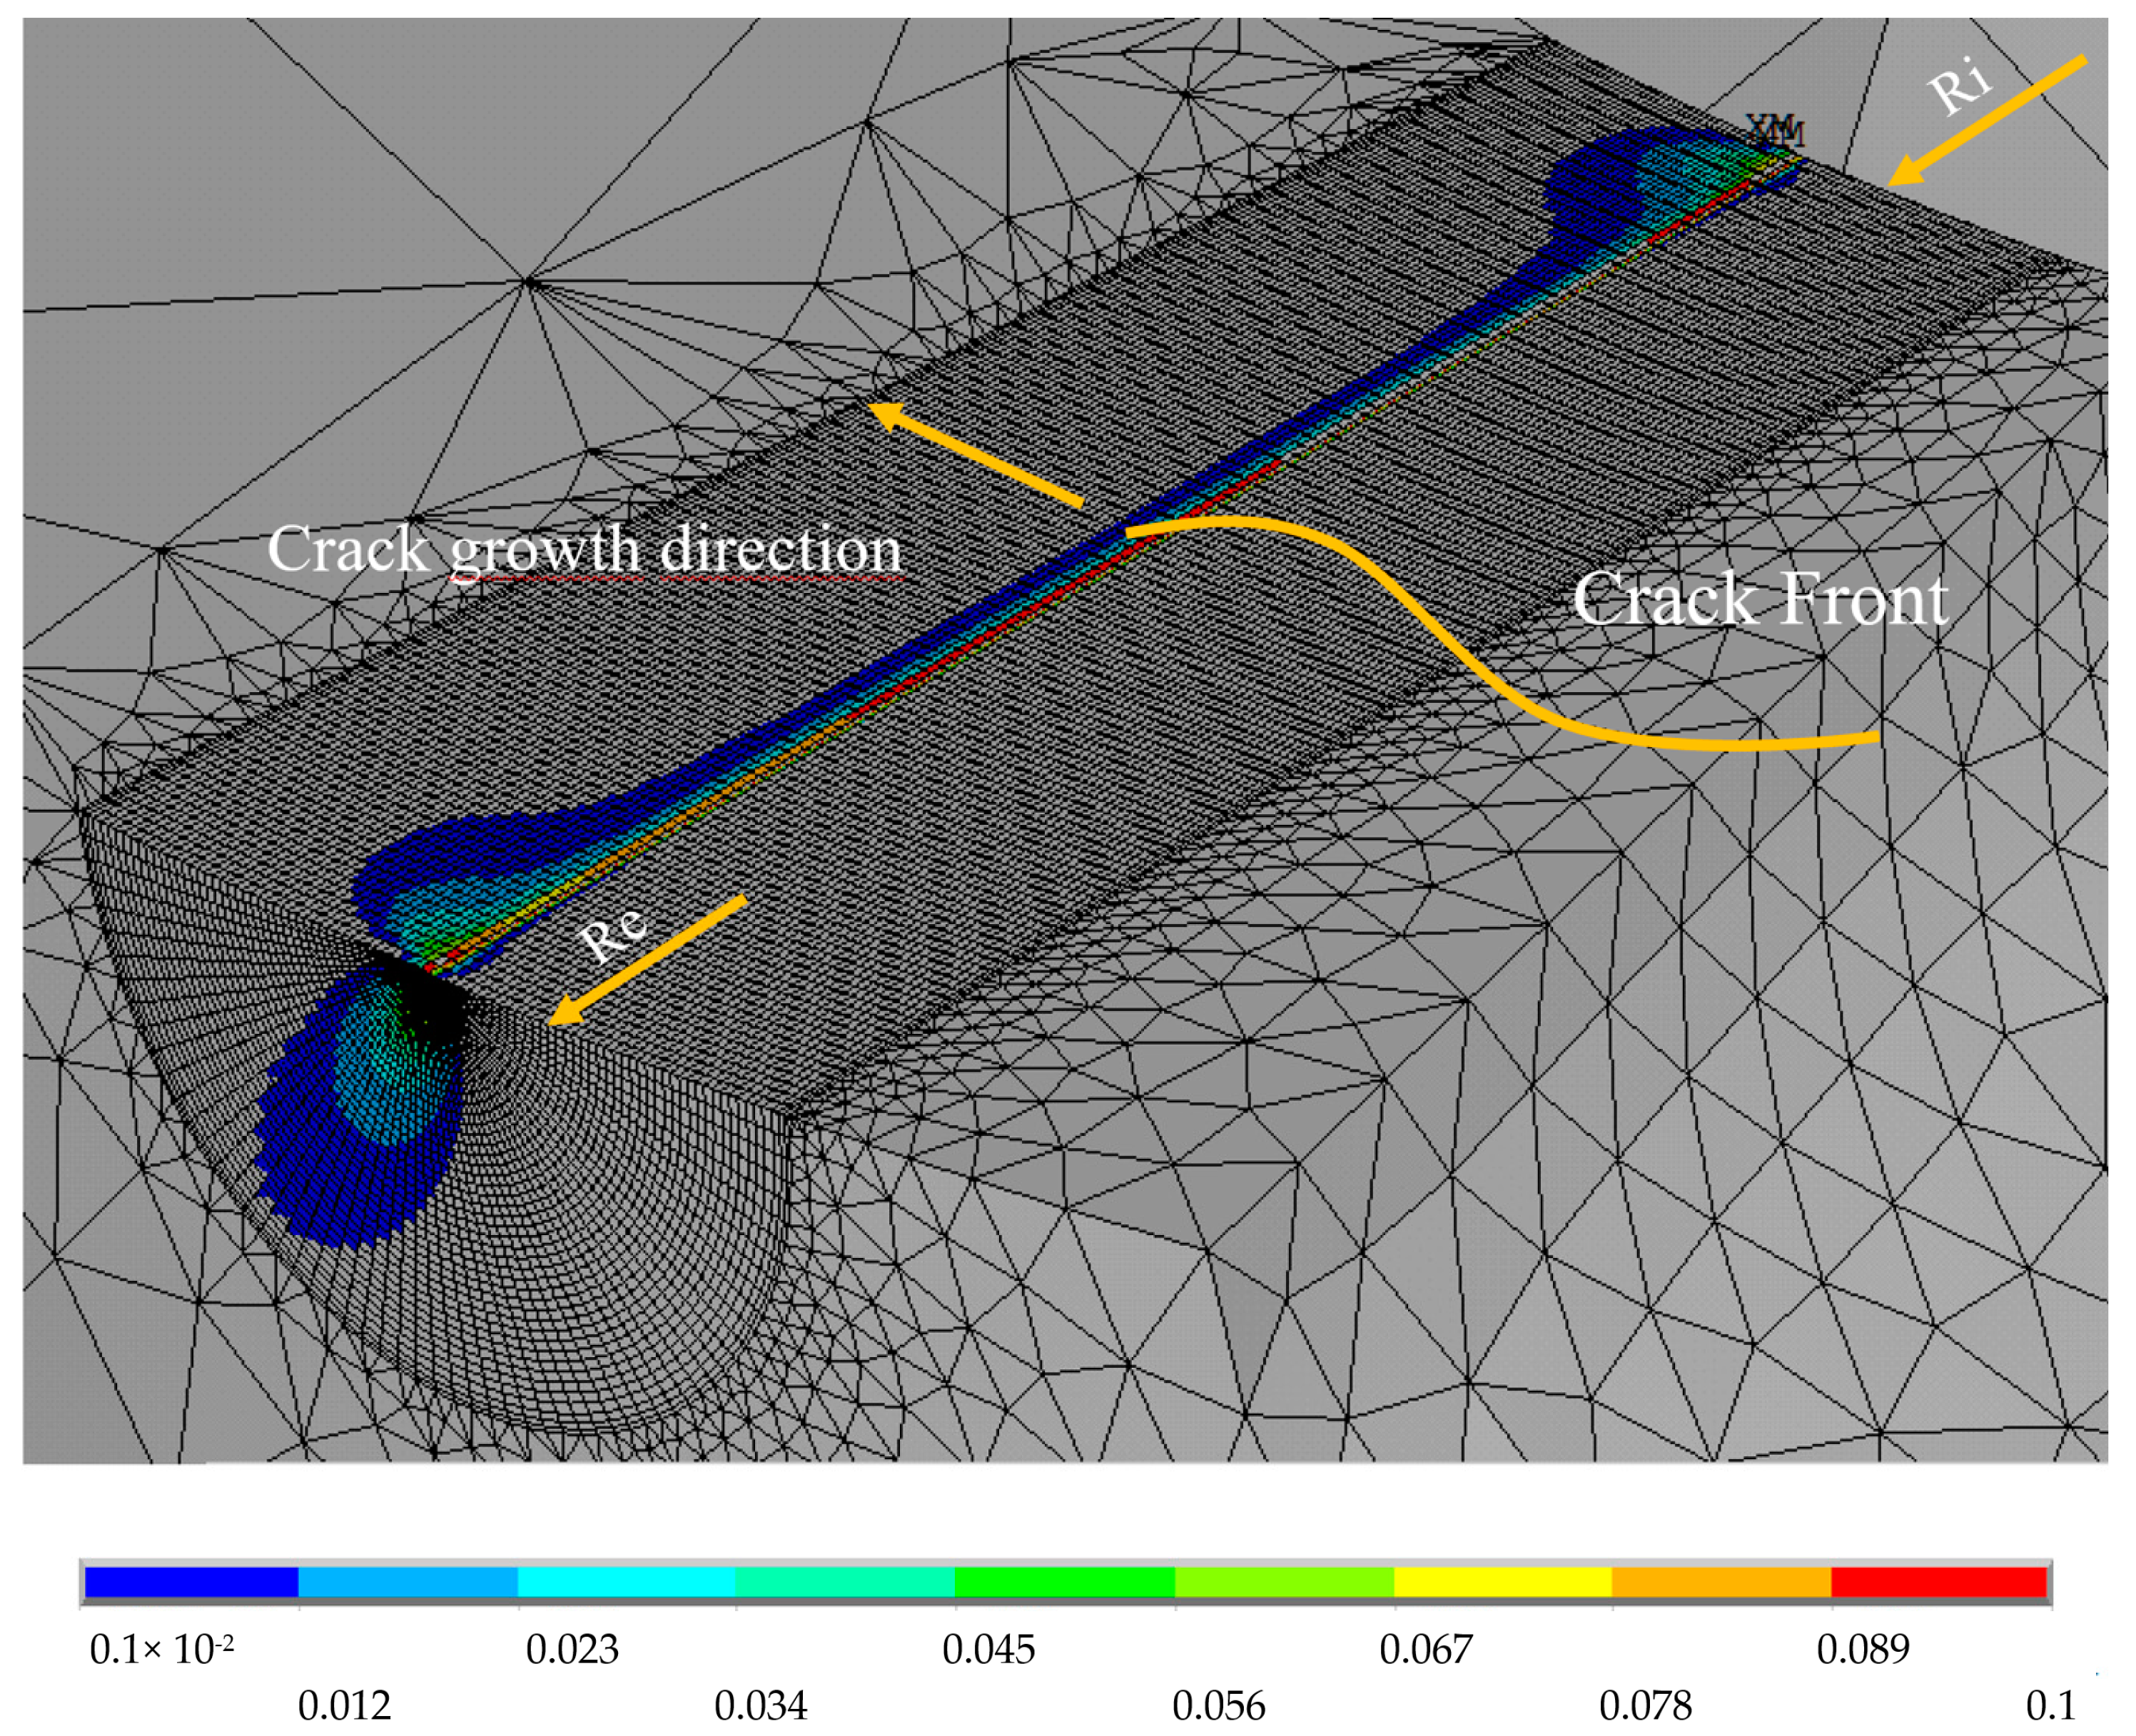
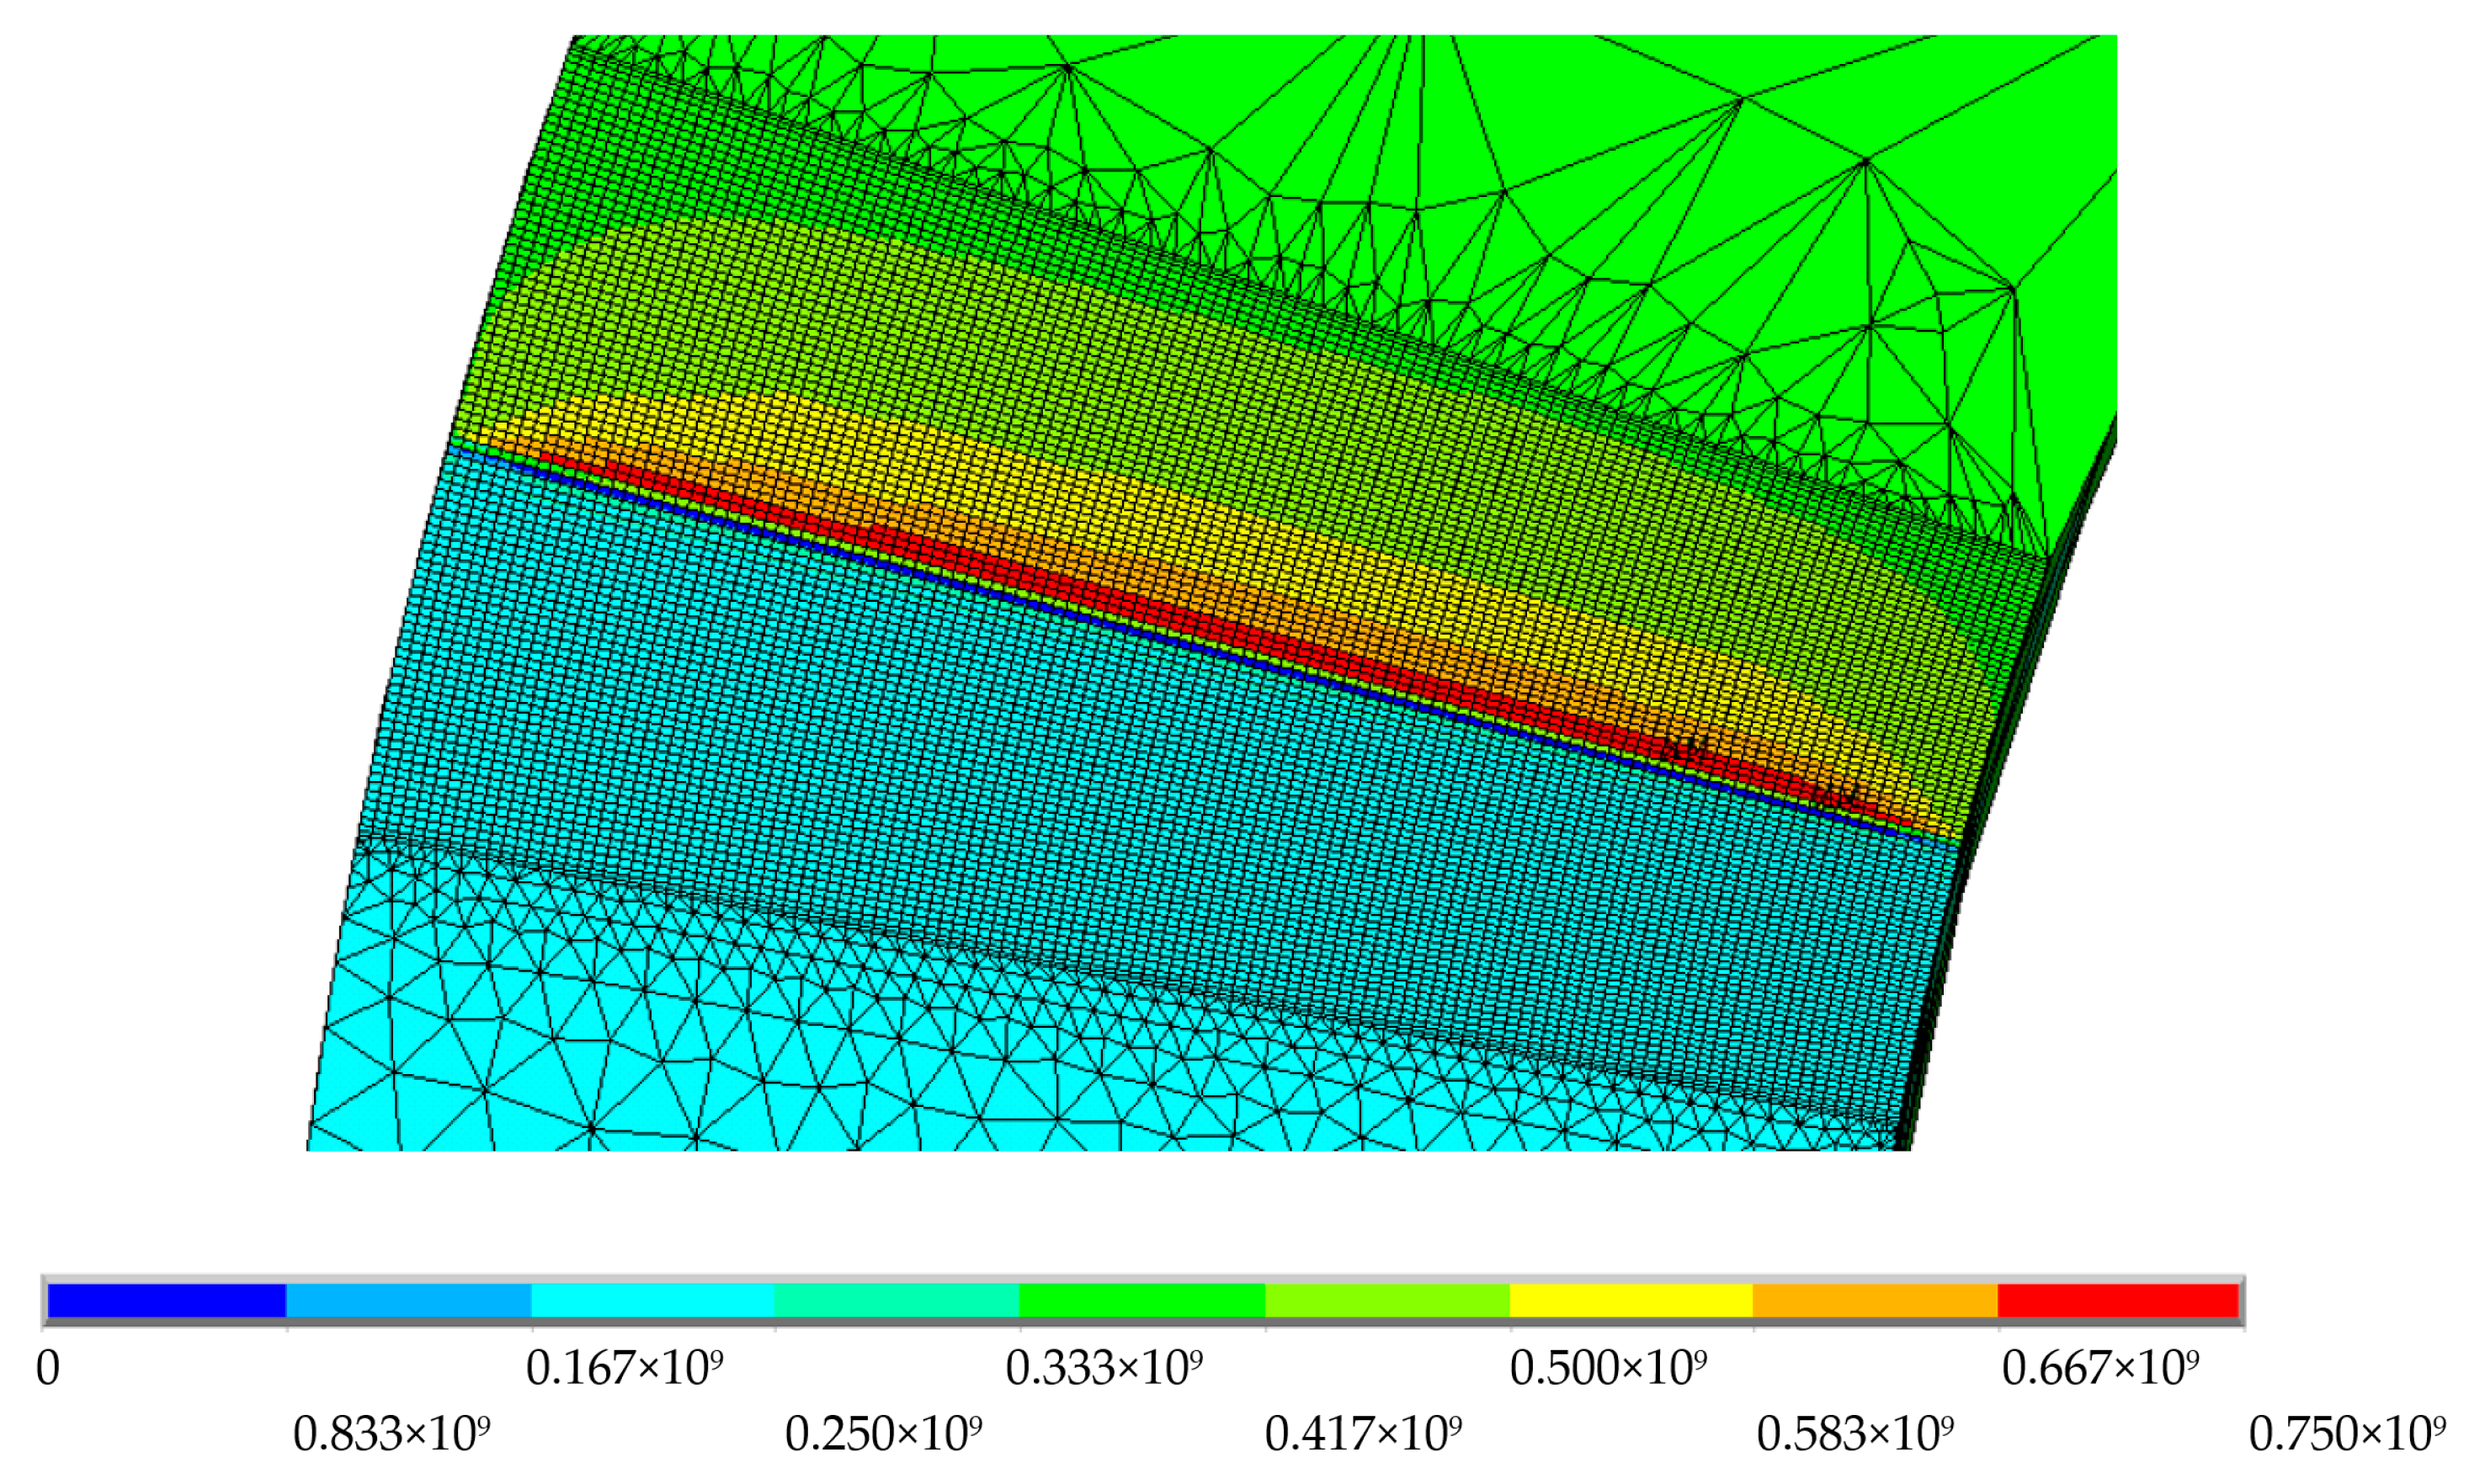
- It was found that, in the plane of the crack front, there was a greater plastic strain associated with the external radius;
- It was identified that the plastic strain was not constant in the central part as in flat specimens. It maintained an increasing trend towards the external radius of the cylindrical specimen;
- The centroid of the plastic strain presented in the flat area of the crack front was not located in the central part, as in flat specimens. The centroid showed a clear trend towards the external radius;
- A clear geometric trend of the plastic strain presented in the flat zone of the crack front was found when evaluating qualitatively with non-normalized thickness parameters under the same load regime;
- The evolution of the plastic strain’s size in the crack front’s flat area depended largely on the thickness and the load applied for the analysis. However, this strain maintained its clear relationship with the geometry of the cylindrical specimen, that is, it was associated with the external and internal radii;
- The normal stress σz at the crack front showed a trend with a positive slope in the central band, a characteristic parameter of cylindrical specimens.
Author Contributions
Funding
Data Availability Statement
Acknowledgments
Conflicts of Interest
Nomenclature
| Crack length. | |
| b | Specimen thickness. |
| Distance to the exterior face of the center of gravity of the plastic size area, associated with the internal radius. | |
| Distance to the exterior face of the center of gravity of the plastic size area, associated with the external radius. | |
| E | Modulus of elasticity. |
| Stress intensity factor, mode I. | |
| H | Elastoplastic behavior with isotropic hardening. |
| Distance from the crack front to the center of gravity, associated with the internal radius. | |
| Distance from the crack front to the center of gravity, associated with the external radius. | |
| Nu | Poisson’s Ratio. |
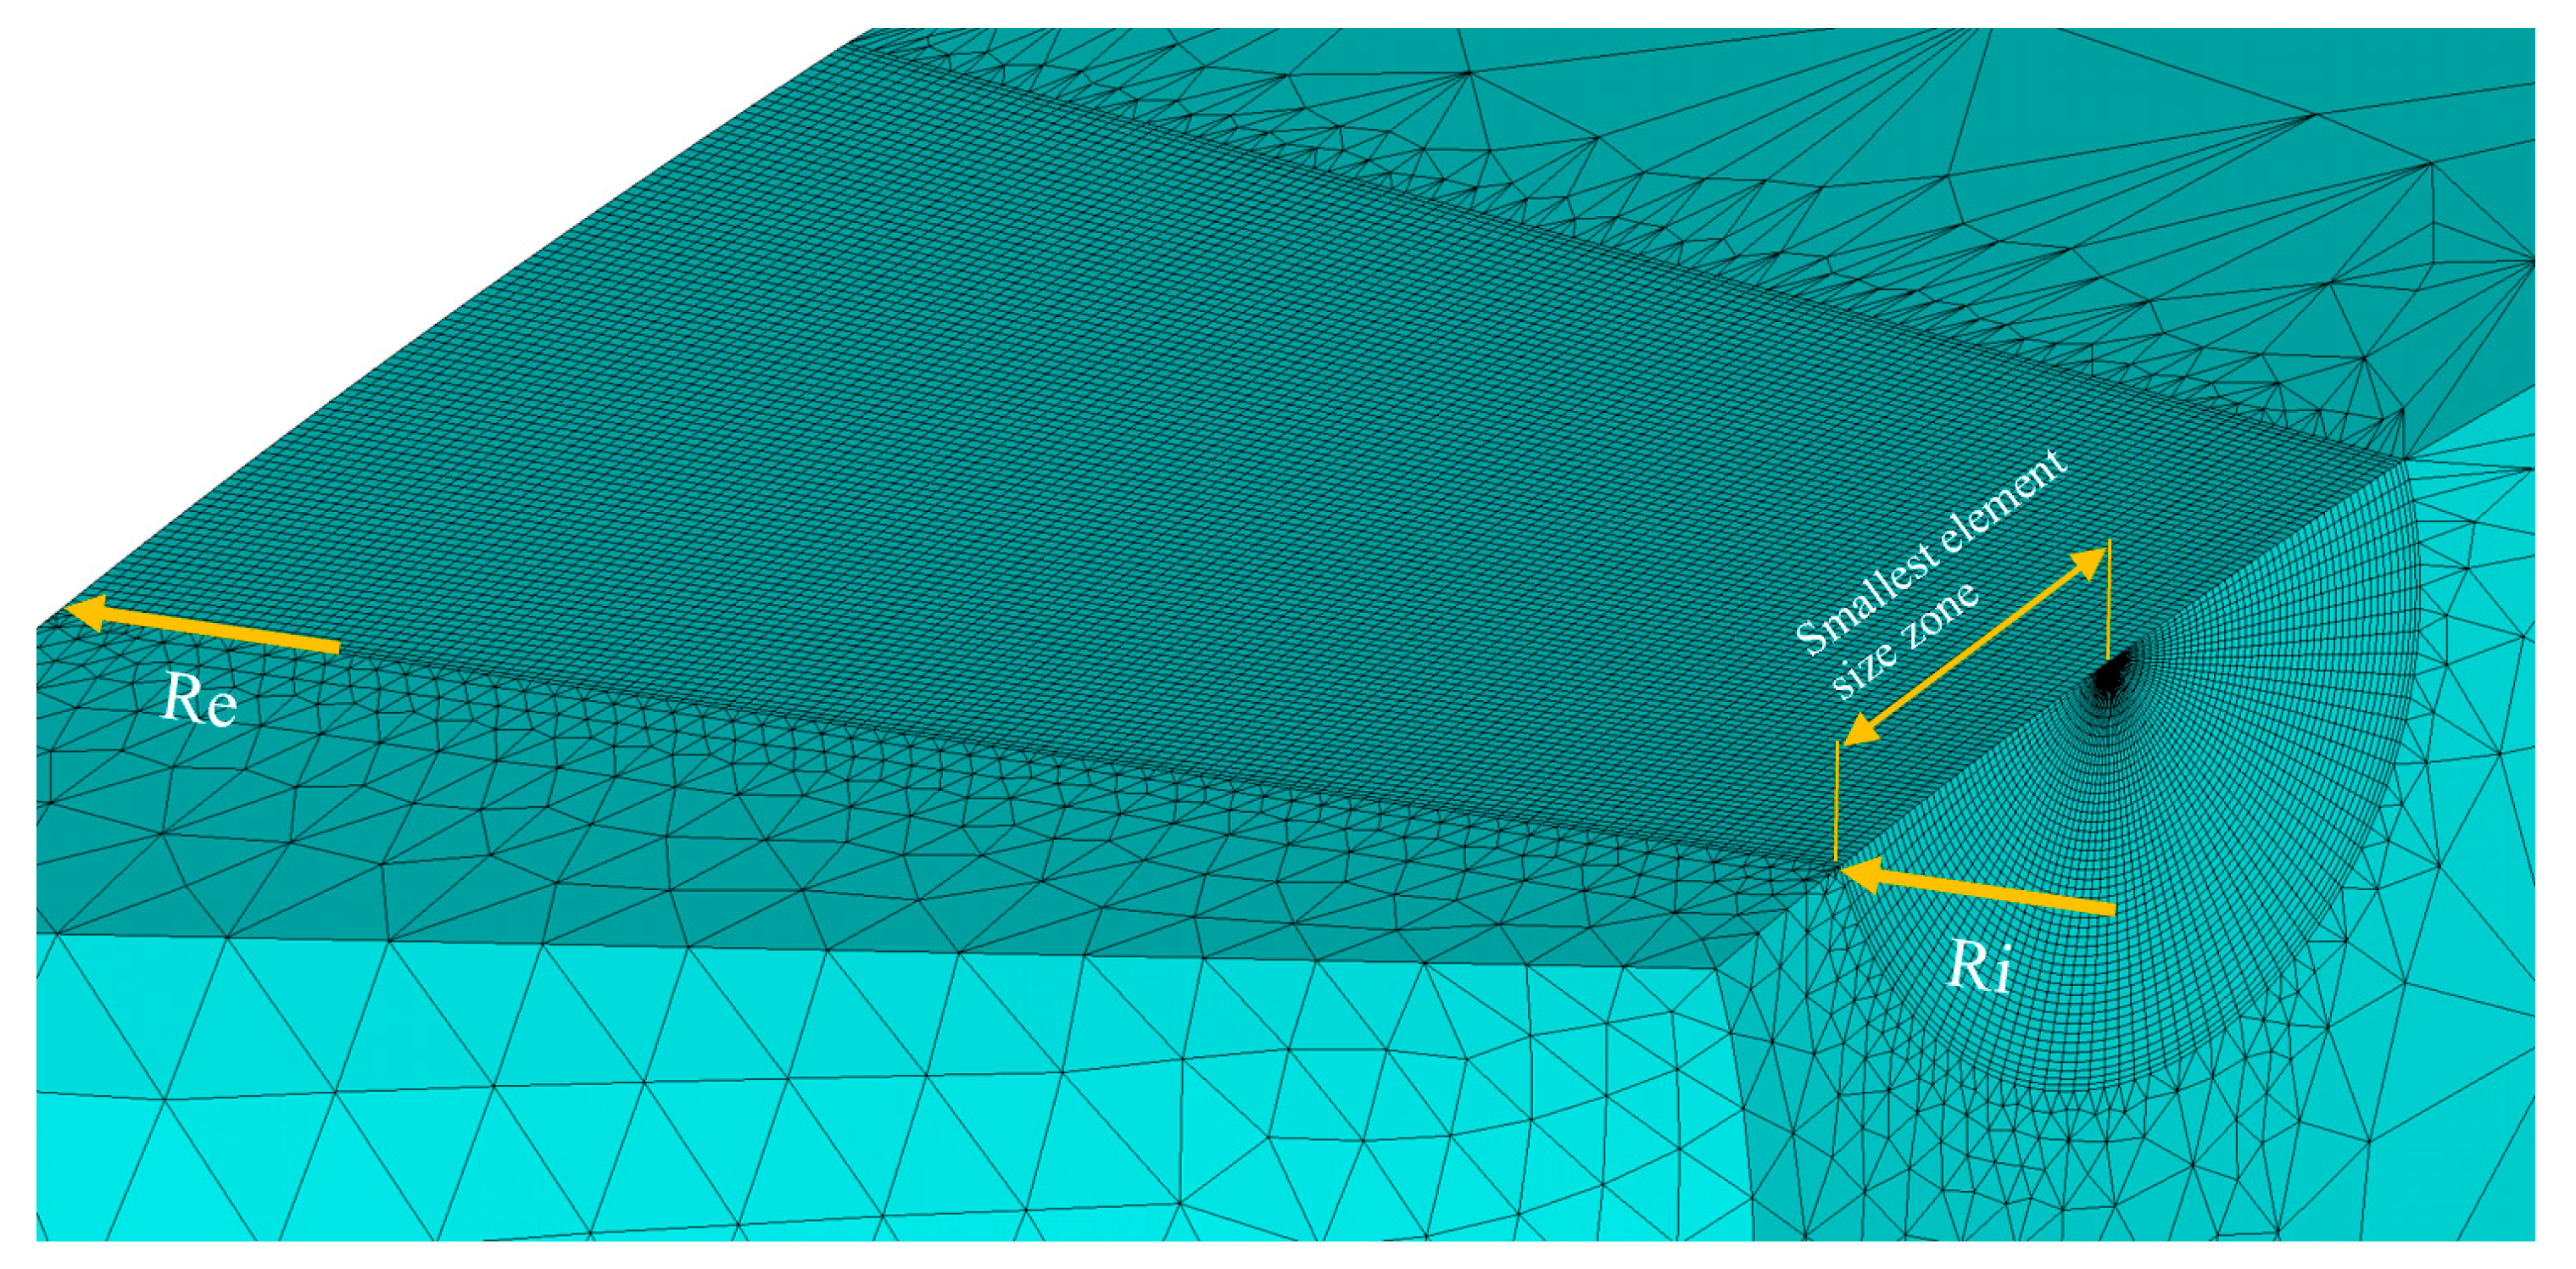
| Re | Internal radius |
| Ri | External radius |
| Calculated plastic radius. | |
| Dugdale’s plastic zone size. | |
| Geometric parameter, associated with the stress intensity factor. | |
| Restriction factor, associated with Dugdale’s plastic radius. | |
| Normal tensile stress. | |
| Yield strength. |
References
- Schütz, W. A history of fatigue. Eng. Fract. Mech. 1996, 54, 263–300. [Google Scholar] [CrossRef]
- Jasinski, J.J.; Tagowski, M. FEM Simulation of the Riveting Process and Structural Analysis of Low-Carbon Steel Tubular Rivets Fracture. Materials 2022, 15, 374. [Google Scholar] [CrossRef] [PubMed]
- Garcia-Manrique, J.; Camas, D.; Parrón-Rubio, M.; Gonzalez-Herrera, A. Corrections in numerical methodology to evaluate plasticity induced crack closure along the thickness. Theor. Appl. Fract. Mech. 2018, 97, 215–223. [Google Scholar] [CrossRef]
- Camas, D.; Garcia-Manrique, J.; Gonzalez-Herrera, A. Numerical study of the thickness transition in bi-dimensional specimen cracks. Int. J. Fatigue 2011, 33, 921–928. [Google Scholar] [CrossRef]
- Camas, D.; Garcia-Manrique, J.; Gonzalez-Herrera, A. Crack front curvature: Influence and effects on the crack tip fields in bi-dimensional specimens. Int. J. Fatigue 2012, 44, 41–50. [Google Scholar] [CrossRef]
- Garcia-Manrique, J.; Camas, D.; Lopez-Crespo, P.; Gonzalez-Herrera, A. Stress intensity factor analysis of through thickness effects. Int. J. Fatigue 2013, 46, 58–66. [Google Scholar] [CrossRef]
- Garcia-Manrique, J.; Camas, D.; Gonzalez-Herrera, A. Study of the stress intensity factor analysis through thickness: Methodological aspects. Fatigue Fract. Eng. Mater. Struct. 2017, 40, 1295–1308. [Google Scholar] [CrossRef]
- Garcia-Manrique, J.; Camas-Peña, D.; Lopez-Martinez, J.; Gonzalez-Herrera, A. Analysis of the stress intensity factor along the thickness: The concept of pivot node on straight crack fronts. Fatigue Fract. Eng. Mater. Struct. 2018, 41, 869–880. [Google Scholar] [CrossRef]
- Urrego, L.F.; García-Beltrán, O.; Arzola, N.; Araque, O. Mechanical Fracture of Aluminium Alloy (AA 2024-T4), Used in the Manufacture of a Bioproducts Plant. Metals 2023, 13, 1134. [Google Scholar] [CrossRef]
- Chmelko, V.; Harakal’, M.; Žlábek, P.; Margetin, M.; Ďurka, R. Simulation of stress concentrations in notches. Metals 2022, 12, 43. [Google Scholar] [CrossRef]
- Braun, M.; Fischer, C.; Baumgartner, J.; Hecht, M.; Varfolomeev, I. Fatigue Crack Initiation and Propagation Relation of Notched Specimens with Welded Joint Characteristics. Metals 2022, 12, 615. [Google Scholar] [CrossRef]
- Antunes, F.V.; Chegini, A.G.; Branco, R.; Camas, D. A numerical study of plasticity induced crack closure under plane strain conditions. Int. J. Fatigue 2015, 71, 75–86. [Google Scholar] [CrossRef]
- Camas, D.; Antunes, F.; Moreno, B.; Gonzalez-Herrera, A. Numerical analysis of the influence of the last cycle scheme on plasticity induced crack closure. Procedia Struct. Integr. 2019, 17, 894–899. [Google Scholar] [CrossRef]
- Gardin, C.; Fiordalisi, S.; Sarrazin-Baudoux, C.; Gueguen, M.; Petit, J. Numerical prediction of crack front shape during fatigue propagation considering plasticity-induced crack closure. Int. J. Fatigue 2016, 88, 68–77. [Google Scholar] [CrossRef]
- Marques, B.; Borrego, L.P.; Ferreira, J.M.; Antunes, F.V.; Branco, R. A numerical analysis of fatigue crack closure using CTOD. Procedia Struct. Integr. 2019, 18, 645–650. [Google Scholar] [CrossRef]
- Antunes, F.V.; Sousa, T.; Branco, R.; Correia, L. Effect of crack closure on non-linear crack tip parameters. Int. J. Fatigue 2015, 71, 53–63. [Google Scholar] [CrossRef]
- Antunes, F.V.; Correia, L.; Camas, D.; Branco, R. Effect of compressive loads on plasticity induced crack closure. Theor. Appl. Fract. Mech. 2015, 80, 193–204. [Google Scholar] [CrossRef]
- Toribio, J.; Kharin, V. Plasticity-induced crack closure: A contribution to the debate. Eur. J. Mech. A/Solids 2011, 30, 105–112. [Google Scholar] [CrossRef]
- Gardin, C.; Fiordalisi, S.; Sarrazin-Baudoux, C.; Petit, J. Numerical simulation of fatigue plasticity-induced crack closure for through cracks with curved fronts. Eng. Fract. Mech. 2016, 160, 213–225. [Google Scholar] [CrossRef]
- Calvín, G.; Escalero, M.; Zabala, H.; Muñiz-Calvente, M. Effects of stress ratio on plasticity-induced crack closure through three-dimensional advanced numerical finite element models. Theor. Appl. Fract. Mech. 2023, 127, 104000. [Google Scholar] [CrossRef]
- Antunes, F.V.; Camas, D.; Correia, L.; Branco, R. Finite element meshes for optimal modelling of plasticity induced crack closure. Eng. Fract. Mech. 2015, 142, 184–200. [Google Scholar] [CrossRef]
- Liu, J.; Chen, J.; Sun, Z.; Zhang, H.; Yuan, Q. A Study on Fatigue Crack Closure Associated with the Growth of Long Crack in a New Titanium Alloy. Metals 2023, 13, 1377. [Google Scholar] [CrossRef]
- Borges, M.; Caldas, M.; Antunes, F.; Branco, R.; Prates, P. Fatigue crack growth from notches: A numerical analysis. Appl. Sci. 2020, 10, 4174. [Google Scholar] [CrossRef]
- Ferreira, F.F.; Neto, D.M.; Jesus, J.S.; Prates, P.A.; Antunes, F.V. Numerical prediction of the fatigue crack growth rate in SLM Ti-6Al-4V based on crack tip plastic strain. Metals 2020, 10, 1133. [Google Scholar] [CrossRef]
- Neto, D.M.; Borges, M.F.; Sérgio, E.R.; Antunes, F.V. Effect of Residual Stresses on Fatigue Crack Growth: A Numerical Study Based on Cumulative Plastic Strain at the Crack Tip. Materials 2022, 15, 2156. [Google Scholar] [CrossRef] [PubMed]
- Mcclung, R.C. Crack closure and plastic zone sizes in fatigue. Fatigue Fract. Eng. Mater. Struct. 1991, 14, 455–468. [Google Scholar] [CrossRef]
- Sehitoglu, H.; Gall, K.; García, A.M. Recent advances in fatigue crack growth modeling. Int. J. Fract. 1996, 80, 165–192. [Google Scholar] [CrossRef]
- Ellyin, F.; Wu, J. A numerical investigation on the effect of an overload on fatigue crack opening and closure behaviour. Fract. Eng. Mater. Struct. 1999, 22, 835–847. [Google Scholar] [CrossRef]
- Wei, L.-W.; James, M.N. A study of fatigue crack closure in polycarbonate CT specimens. Eng. Fract. Mech. 2000, 66, 223–242. [Google Scholar] [CrossRef]
- Roychowdhury, S.; Dodds, R.H. A numerical investigation of 3-D small-scale yielding fatigue crack growth. Eng. Fract. Mech. 2003, 70, 2363–2383. [Google Scholar] [CrossRef]
- Subramanya, H.Y.; Viswanath, S.; Narasimhan, R. A three-dimensional numerical study of mixed mode (I and II) crack tip fields in elastic-plastic solids. Int. J. Fract. 2005, 136, 167–185. [Google Scholar] [CrossRef]
- Simandjuntak, S.; Alizadeh, H.; Smith, D.J.; Pavier, M.J. Three dimensional finite element prediction of crack closure and fatigue crack growth rate for a corner crack. Int. J. Fatigue 2006, 28, 335–345. [Google Scholar] [CrossRef]
- She, C.; Guo, W. Three-dimensional stress concentrations at elliptic holes in elastic isotropic plates subjected to tensile stress. Int. J. Fatigue 2007, 29, 330–335. [Google Scholar] [CrossRef]
- Proudhon, H.; Li, J.; Wang, F.; Roos, A.; Chiaruttini, V.; Forest, S. 3D simulation of short fatigue crack propagation by finite element crystal plasticity and remeshing. Int. J. Fatigue 2016, 82, 238–246. [Google Scholar] [CrossRef]
- Zerbst, U.; Vormwald, M.; Pippan, R.; Gänser, H.P.; Sarrazin-Baudoux, C.; Madia, M. About the fatigue crack propagation threshold of metals as a design criterion—A review. Eng. Fract. Mech. 2016, 153, 190–243. [Google Scholar] [CrossRef]
- Lopez-Crespo, C.; Cruces, A.S.; Seitl, S.; Moreno, B.; Lopez-Crespo, P. Estimation of the plastic zone in fatigue via micro-indentation. Materials 2021, 14, 5885. [Google Scholar] [CrossRef]
- Palacios-Pineda, L.M.; Hernandez-Reséndiz, J.E.; Martínez-Romero, O.; Donado, R.J.H.; Tenorio-Quevedo, J.; Jiménez-Cedeño, I.H.; López-Vega, C.; Olvera-Trejo, D.; Elías-Zúñiga, A. Study of the Evolution of the Plastic Zone and Residual Stress in a Notched T-6061 Aluminum Sample. Materials 2022, 15, 1546. [Google Scholar] [CrossRef]
- Lin, Z.; Shang, H.; Gao, H.; Huang, X. In Situ Measurement of the Strain Field at the Fatigue Crack Tip Based on Sub-Image Stitching and Matching DIC. Materials 2022, 15, 5150. [Google Scholar] [CrossRef]
- Ajmal, M.; Lopez-Crespo, C.; Cruces, A.S.; Lopez-Crespo, P. New Plastic Crack-Tip Opening Displacement Tool Based on Digital Image Correlation for Estimating the Fatigue-Crack-Growth Law on 316L Stainless Steel. Materials 2023, 16, 4589. [Google Scholar] [CrossRef]
- Mokhtarishirazabad, M.; Lopez-Crespo, P.; Moreno, B.; Lopez-Moreno, A.; Zanganeh, M. Optical and analytical investigation of overloads in biaxial fatigue cracks. Int. J. Fatigue 2017, 100, 583–590. [Google Scholar] [CrossRef]
- ASTM E647; Standard Test Method for Measurement of Fatigue Crack Growth Rates. ASTM International: West Conshohocken, PA, USA, 2000.
- Antunes, F.V.; Serrano, S.; Branco, R.; Prates, P. Fatigue crack growth in the 2050-T8 aluminium alloy. Int. J. Fatigue 2018, 115, 79–88. [Google Scholar] [CrossRef]
- Sato, M.; Moura, L.S.; Galvis, A.F.; Albuquerque, E.L.; Sollero, P. Analysis of two-dimensional fatigue crack propagation in thin aluminum plates using the Paris law modified by a closure concept. Eng. Anal. Bound. Elements 2019, 106, 513–527. [Google Scholar] [CrossRef]
- Zerbst, U.; Madia, M.; Klinger, C.; Bettge, D.; Murakami, Y. Defects as a root cause of fatigue failure of metallic components. I: Basic aspects. Eng. Fail. Anal. 2019, 97, 777–792. [Google Scholar] [CrossRef]
- Ferreira, S.E.; de Castro, J.T.P.; Meggiolaro, M.A.; de Oliveira Miranda, A.C. Crack closure effects on fatigue damage ahead of crack tips. Int. J. Fatigue 2019, 125, 187–198. [Google Scholar] [CrossRef]
- Oplt, T.; Hutar, P.; Pokorný, P.; Náhlík, L.; Chlup, Z.; Berto, F. Effect of the free surface on the fatigue crack front curvature at high stress asymmetry. Int. J. Fatigue 2019, 118, 249–261. [Google Scholar] [CrossRef]
- Antunes, F.V.; Prates, P.A.; Camas, D.; Sarrazin-Baudoux, C.; Gardin, C. Numerical prediction of fatigue threshold of metallic materials in vacuum. Eng. Fract. Mech. 2019, 216, 106491. [Google Scholar] [CrossRef]
- Hu, Y.; Cheng, H.; Yu, J.; Yao, Z. An experimental study on crack closure induced by laser peening in pre-cracked aluminum alloy 2024-T351 and fatigue life extension. Int. J. Fatigue 2020, 130, 105232. [Google Scholar] [CrossRef]
- Katinić, M.; Turk, D.; Konjatić, P.; Kozak, D. Estimation of c* Integral for mismatched welded compact tension specimen. Materials 2021, 14, 7491. [Google Scholar] [CrossRef]
- Bray, J.W. Nunes, ASM—Properties and Selection: Nonferrous Alloys and Special-Purpose Materials. In ASM Metals Handbook; American Society for Metals: Detroit, MI, USA, 1990. [Google Scholar]
- Vasco-Olmo, J.M.; Camacho-Reyes, A.; Gonzales, G.L.G.; Díaz, F. Investigation of Plasticity Effects on Growing Fatigue Cracks Using the CJP Model of Crack Tip Fields. Materials 2023, 16, 5744. [Google Scholar] [CrossRef]


| Load [N] Thickness 2 mm | Load [N] Thickness 3 mm | Load [N] Thickness 4 mm | |
|---|---|---|---|
| 1.20 | 594.51 | 903.68 | 1223.38 |
| 2.40 | 1189.02 | 1807.36 | 2446.76 |
| 3.60 | 1783.53 | 2711.04 | 3670.14 |
| 4.80 | 2378.04 | 3614.72 | 4893.52 |
| 6.00 | 2972.55 | 4518.40 | 6116.90 |
| 7.20 | 3567.06 | 5422.08 | 7340.28 |
| 8.40 | 4161.57 | 6325.76 | 8563.66 |
| 9.60 | 4756.08 | 7229.44 | 9787.04 |
| 10.80 | 5350.59 | 8133.12 | 11010.42 |
| 12.00 | 5945.10 | 9036.80 | 12233.80 |
Disclaimer/Publisher’s Note: The statements, opinions and data contained in all publications are solely those of the individual author(s) and contributor(s) and not of MDPI and/or the editor(s). MDPI and/or the editor(s) disclaim responsibility for any injury to people or property resulting from any ideas, methods, instructions or products referred to in the content. |
© 2023 by the authors. Licensee MDPI, Basel, Switzerland. This article is an open access article distributed under the terms and conditions of the Creative Commons Attribution (CC BY) license (https://creativecommons.org/licenses/by/4.0/).
Share and Cite
Abatta-Jacome, L.; Lima-Rodriguez, A.; Gonzalez-Herrera, A.; Garcia-Manrique, J.M. Numerical Study of the Plastic Zone at the Crack Front in Cylindrical Aluminum Specimens Subjected to Tensile Loads. Materials 2023, 16, 6759. https://doi.org/10.3390/ma16206759
Abatta-Jacome L, Lima-Rodriguez A, Gonzalez-Herrera A, Garcia-Manrique JM. Numerical Study of the Plastic Zone at the Crack Front in Cylindrical Aluminum Specimens Subjected to Tensile Loads. Materials. 2023; 16(20):6759. https://doi.org/10.3390/ma16206759
Chicago/Turabian StyleAbatta-Jacome, Lenin, Antonia Lima-Rodriguez, Antonio Gonzalez-Herrera, and Jose Manuel Garcia-Manrique. 2023. "Numerical Study of the Plastic Zone at the Crack Front in Cylindrical Aluminum Specimens Subjected to Tensile Loads" Materials 16, no. 20: 6759. https://doi.org/10.3390/ma16206759
APA StyleAbatta-Jacome, L., Lima-Rodriguez, A., Gonzalez-Herrera, A., & Garcia-Manrique, J. M. (2023). Numerical Study of the Plastic Zone at the Crack Front in Cylindrical Aluminum Specimens Subjected to Tensile Loads. Materials, 16(20), 6759. https://doi.org/10.3390/ma16206759