Abstract
The environmental impacts of cement manufacturing are becoming a real-time issue that requires attention. This paper investigates the mechanical and physical properties of mortars with finely ground sand as a substitute for cement. The experimental program consisted of three silica sands with a Blaine Specific Surface (BSS) area of 459 m2/kg, 497 m2/kg, and 543 m2/kg and four substitution ratios of 10%, 20%, 30%, and 40%. A total of 12 mixtures have been prepared and tested for comparison to the reference mortar. The pozzolanic effect of the sand was evaluated using thermogravimetric analysis (TGA). The results revealed that the fineness variation from 459 m2/kg to 543 m2/kg resulted in an increase of 20% and 30% in water absorption and compressive strength, respectively. However, increasing the substitution ratio from 10% to 40% led to a 40% decrease in mechanical strength and a 25% increase in water absorption. The statistical analysis of the results demonstrated that both factors under study influenced compressive strength and water absorption. The ANalysis of VAriance (ANOVA) confirmed that the proposed regression equations predict the experimental results. Further studies will investigate both the technical and environmental performances of cement mortars with finely ground silica sand.
1. Introduction
The cement industry contributes to greenhouse gas emissions, particularly carbon dioxide [1,2,3,4]. The main contribution is due to the production of clinker, which is the main component of cement. It involves a chemical reaction where carbonates (e.g., CaCO3) decompose into oxides (e.g., CaO) and CO2 through heat application [3]. This reaction requires fuel combustion to feed rotary kilns [5]. Accordingly, research for low-impact cement composed of alternative raw materials became a concern to solve this issue. De Medeiros et al. [6] tested the effects of fly ash on cement paste durability. The results indicated a decrease in the alkali contribution and compressive strength at 28 days, while there was an increase in the carbonation ratio. Patil et al. [7] conducted an experimental study by partially substituting cement with fly ash and bagasse ash in different ratios ranging from 0% to 30%. The results of the Frattini test showed that cement with 20% fly ash and 10% bagasse ash was pozzolanically active. The activity index of strength at 7 and 28 days exceeds the recommended value of 0.75. Hamidi et al. [8] investigated the andesite rock as a partial substitute for cement. Andesite exhibited moderate pozzolanic activity, surpassing that of natural pozzolans. Tayeh et al. [9] tested a mortar containing glass powder and observed an up to 8% increase in compressive strength for mixtures containing 20% glass powder; these findings comply with [10]. Furthermore, mortars containing glass powder exhibited good performance in external exposure to MgSO4 solution. Ramezanianpour et al. [11] observed that natural pozzolans and nanosilica reduce mortars’ workability due to their morphology and specific surface area higher than that of Portland cement. Cheah et al. [12] tested granulated blast furnace slag and ground granulated blast furnace slag containing calcium carbonate as partial substitutes for cement. A comparison between cement substitution with quartz and ash revealed that cement pastes containing quartz powder exhibited higher early compressive strength due to the physical filling of quartz particles [13]. Lin et al. [14] have reported that the quartz powder has both effects of dilution and crystal nucleation on cement hydration. Therefore, the incorporation of quartz powder does not affect the hydration product. Ma et al. [15] found a dilution effect of coral sand powder that delays the exothermic ratio of the cement system. Mortars containing fly ash and crushed river sand were more resistant to chloride penetration than the reference mortar [16]. This improvement is due to the filling effect, increased nucleation sites, a decrease in Ca(OH)2 content, and the presence of fine fly ash particles. The Kubuqi desert sand powder (North China) improved the early hydration of cement through nucleation, filling, and dilution [17]. Indeed, the sand particles enhanced the cement hydration, and their quartz and calcite contributed to the precipitation of early hydration products.
Other studies focused on supplementary materials in cement production [18] to reduce costs from quarries [19], decrease CO2 emissions [18,20], and enhance construction materials [21]. In the last few years, the use of industrial or natural pozzolanic materials (e.g., blast furnace slag, fly ash, silica fume, kaolin, and pozzolana) has been significantly reduced due to [22,23] environmental pressures related to energy consumption, steel recycling, which reduced the production of waste materials to be recycled, and the depletion of natural deposits [24,25].
In this context, finding abundant and alternative pozzolanic materials equivalent to those in use is strategic. Silica sand is one of the most widely available materials around the world. It derives from natural sources and is composed of SiO2 [21]. Quartz exhibits physical interactions with the cement hydration process (e.g., cement grain dilution, cement hydrate nucleation, and space-filling [14,26]). Table 1 summarizes the results of studies on silica sand as a substitute or mineral addition to construction materials.

Table 1.
Studies on silica sand as a substitute or mineral addition.
Despite its availability, few studies have investigated silica sand and proven a significant gap concerning the sand fineness effect on the mechanical and physical properties of binary mortars. Therefore, this study aims to predict the mechanical and physical behavior of mortars containing silica sand by varying its fineness and cement substitution ratio (SP).
2. Materials and Methods
In this study, the samples were prepared and manufactured with CEM I 52.5 N Portland cement (Schwenk, Ulm, Germany). The used cement has 3150 kg/m3 density and 342 m2/kg Blaine Specific Surface (BSS). Its chemical composition is in Table 2. The sand used as a substitute was quarried in the municipality of El Gor, Tlemcen province (north-west Algeria), and had a high quartz content (98.91% by weight in Table 2). It was dried and ground in a ball mill to achieve a fineness lower than that of the cement.
Table 2.
Chemical analysis of Portland cement and silica sand.
Three types of silica sand with 459 m2/kg, 497 m²/kg, and 543 m²/kg BSS (BSS1, BSS2, and BSS3, respectively) were investigated.
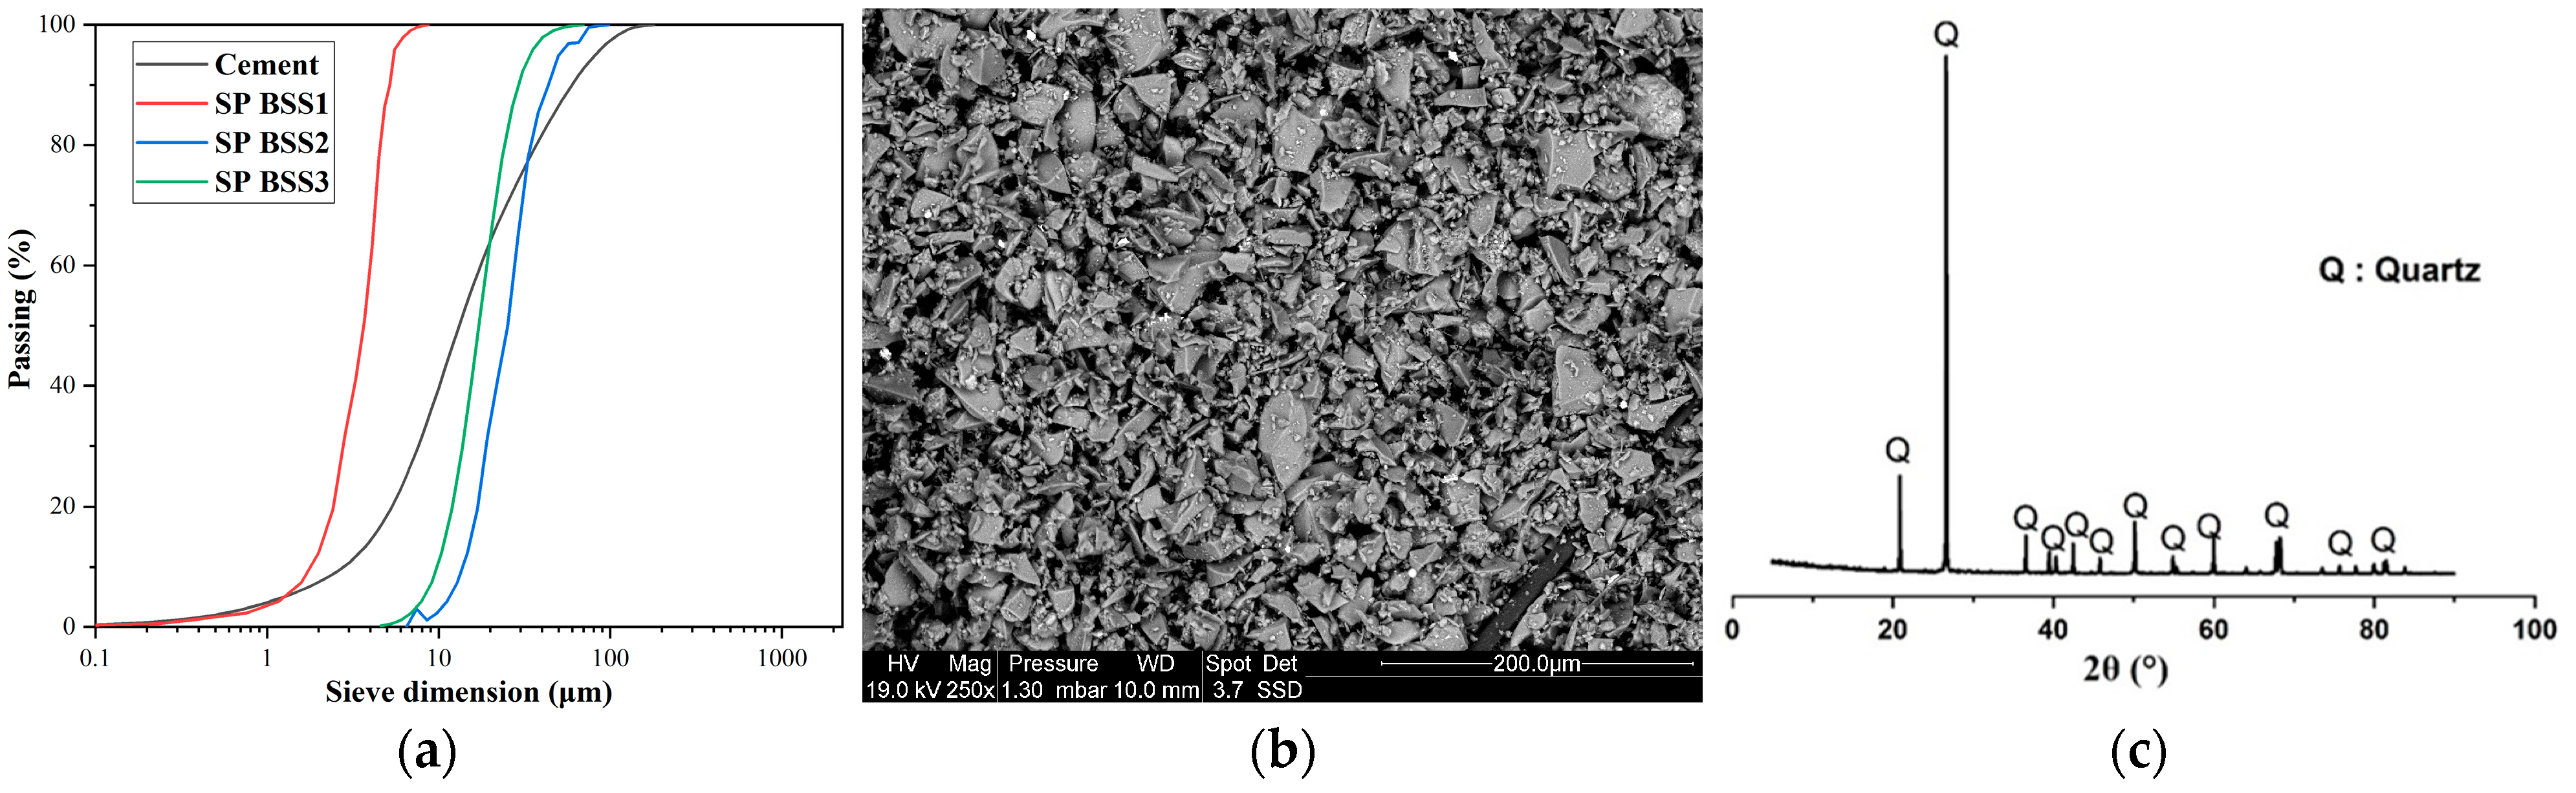
Figure 1a,b show the particle size distribution of cement and silica sand. The particle size analysis was compliant with [36] using a Mastersizer 2000 laser analyzer (Malvern Panalytical, Malvern, UK) and the scanning electron microscope “SEM” Philips/FEI XL 30S FEG Chatsworth, CA, USA. It is possible to observe an almost homogeneous size distribution for a range of sizes from 0 to 100 µm (Figure 1a). According to Figure 1b, grains of silica sand have an angular-shaped morphology. X-ray fluorescence spectroscopy was used to determine the chemical composition of the investigated materials, and a powder X-ray diffractometer identified the minerals in the samples. In Figure 1c, the X-ray diffraction pattern of silica sand confirms that quartz is the main mineral with a hexagonal structure.
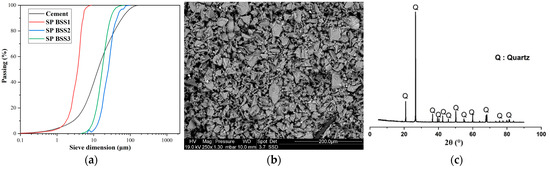
Figure 1.
(a) Particle size distribution of cement and silica sand; (b) SEM image of silica sand; (c) X-ray diffraction of silica sand.
This study compared four mixtures with 10%, 20%, 30%, and 40% cement substitution (M1, M2, M3, and M4, respectively) to the reference mixture (M0). Table 3 illustrates their chemical composition.
Table 3.
Main chemical composition of mortars.
The hydraulic index (I) of M0 (i.e., 0.39 in Table 4) indicates it is neutral. It is the ratio of the acidic to the basic fraction of cement. The increasing substitution ratio of up to 40% allowed the transition of M0 to silica-rich mixtures (i.e., I > 1) (Table 4). Therefore, the hydraulic index has a direct correlation with the substitution ratio of crushed sand.
Table 4.
Mixture recipes.
The ratios of binder/sand and water/binder were 0.33 and 0.5, respectively (Table 4). After mixing according to [37], each mixture was poured into 40 × 40 × 160 mm3 molds. Twenty-four hours after the initial set, the specimens were removed from the molds and stored in a water tank at room temperature until the test. A total of thirteen mixes were prepared and tested. Three samples were tested for each mortar.
Thermogravimetric analyses (TGA) quantified the non-evaporable water (NEW) and the portlandite percentage. Mortar samples were taken from crushed mixture cubes and immersed in acetone to halt hydration and prevent carbonation. After this step, the samples were carefully dried in a desiccator to eliminate residual moisture. Finally, the samples were ground and sieved through an 80 µm mesh sieve to obtain a homogeneous particle size distribution. Equation (1) allows NEW calculation [38]:
Equation (2) gave the portlandite percentage (CH) [38]:
where , , , , and are the mass losses at 105 °C, 450 °C, 55 °C, 680 °C, and 780 °C, respectively; , , and are the molecular masses of portlandite, water, and carbon dioxide, respectively.
The flexural and compressive strength values at 7 and 28 curing days (i.e., Rf7, Rf28, CS7, and CS28) derive from Equations (3) and (4) [37], respectively:
where is the distance between supports, is the cross-sectional area of the specimen, is the specimen thickness, and and are the applied forces.
Immersion absorption tests were conducted to evaluate the durability of mortars [39,40]. After a curing process of 28 days, the samples were dried in an oven until their mass reached a constant value. Subsequently, they were immersed in a water tank for 24 h. Equation (5) allowed the calculation of the water absorption () coefficient:
where and are the initial (i.e., after drying) and the final (i.e., after immersion) mass, respectively.
A rigorous statistical analysis investigated the influence of two independent variables (i.e., substitution ratios of 10%, 20%, 30%, and 40%, and Blaine fineness of 459 m2/kg, 497 m2/kg, and 543 m2/kg) on , , and . The authors used the JMP Pro 17 software, SAS for Universities Edition (SAS Institute Inc., Cary, NC, USA) [41] to obtain full factorial models (Equations (6)–(8)).
The ANalysis Of VAriance (ANOVA) evaluated the components’ contribution to the responses. The statistical significance of the models was assessed using the Fisher test distribution with a 95% confidence level [42]. The factors’ influence and their interaction were assessed using the Student’s t-test (Equation (9)).
where is the test statistic, is the sample mean, is the population mean, is the sample standard deviation, and n is the sample size.
is compared to a critical value for a significance level α and degree of freedom () where is the number of coefficients in the model. The critical value can be read from the Student’s t-distribution table [42]. If the absolute value of is higher than , the effect of is significant; otherwise, it is not.
The compressive and flexural strengths at 7 and 28 days of the mortars have been investigated according to Equation (10) using the mechanical performance ratio () [43].
3. Results
Table 5 lists the mechanical and physical performances of the mortars according to Equations (3)–(5).
Table 5.
Mechanical and physical performances of the mortars.
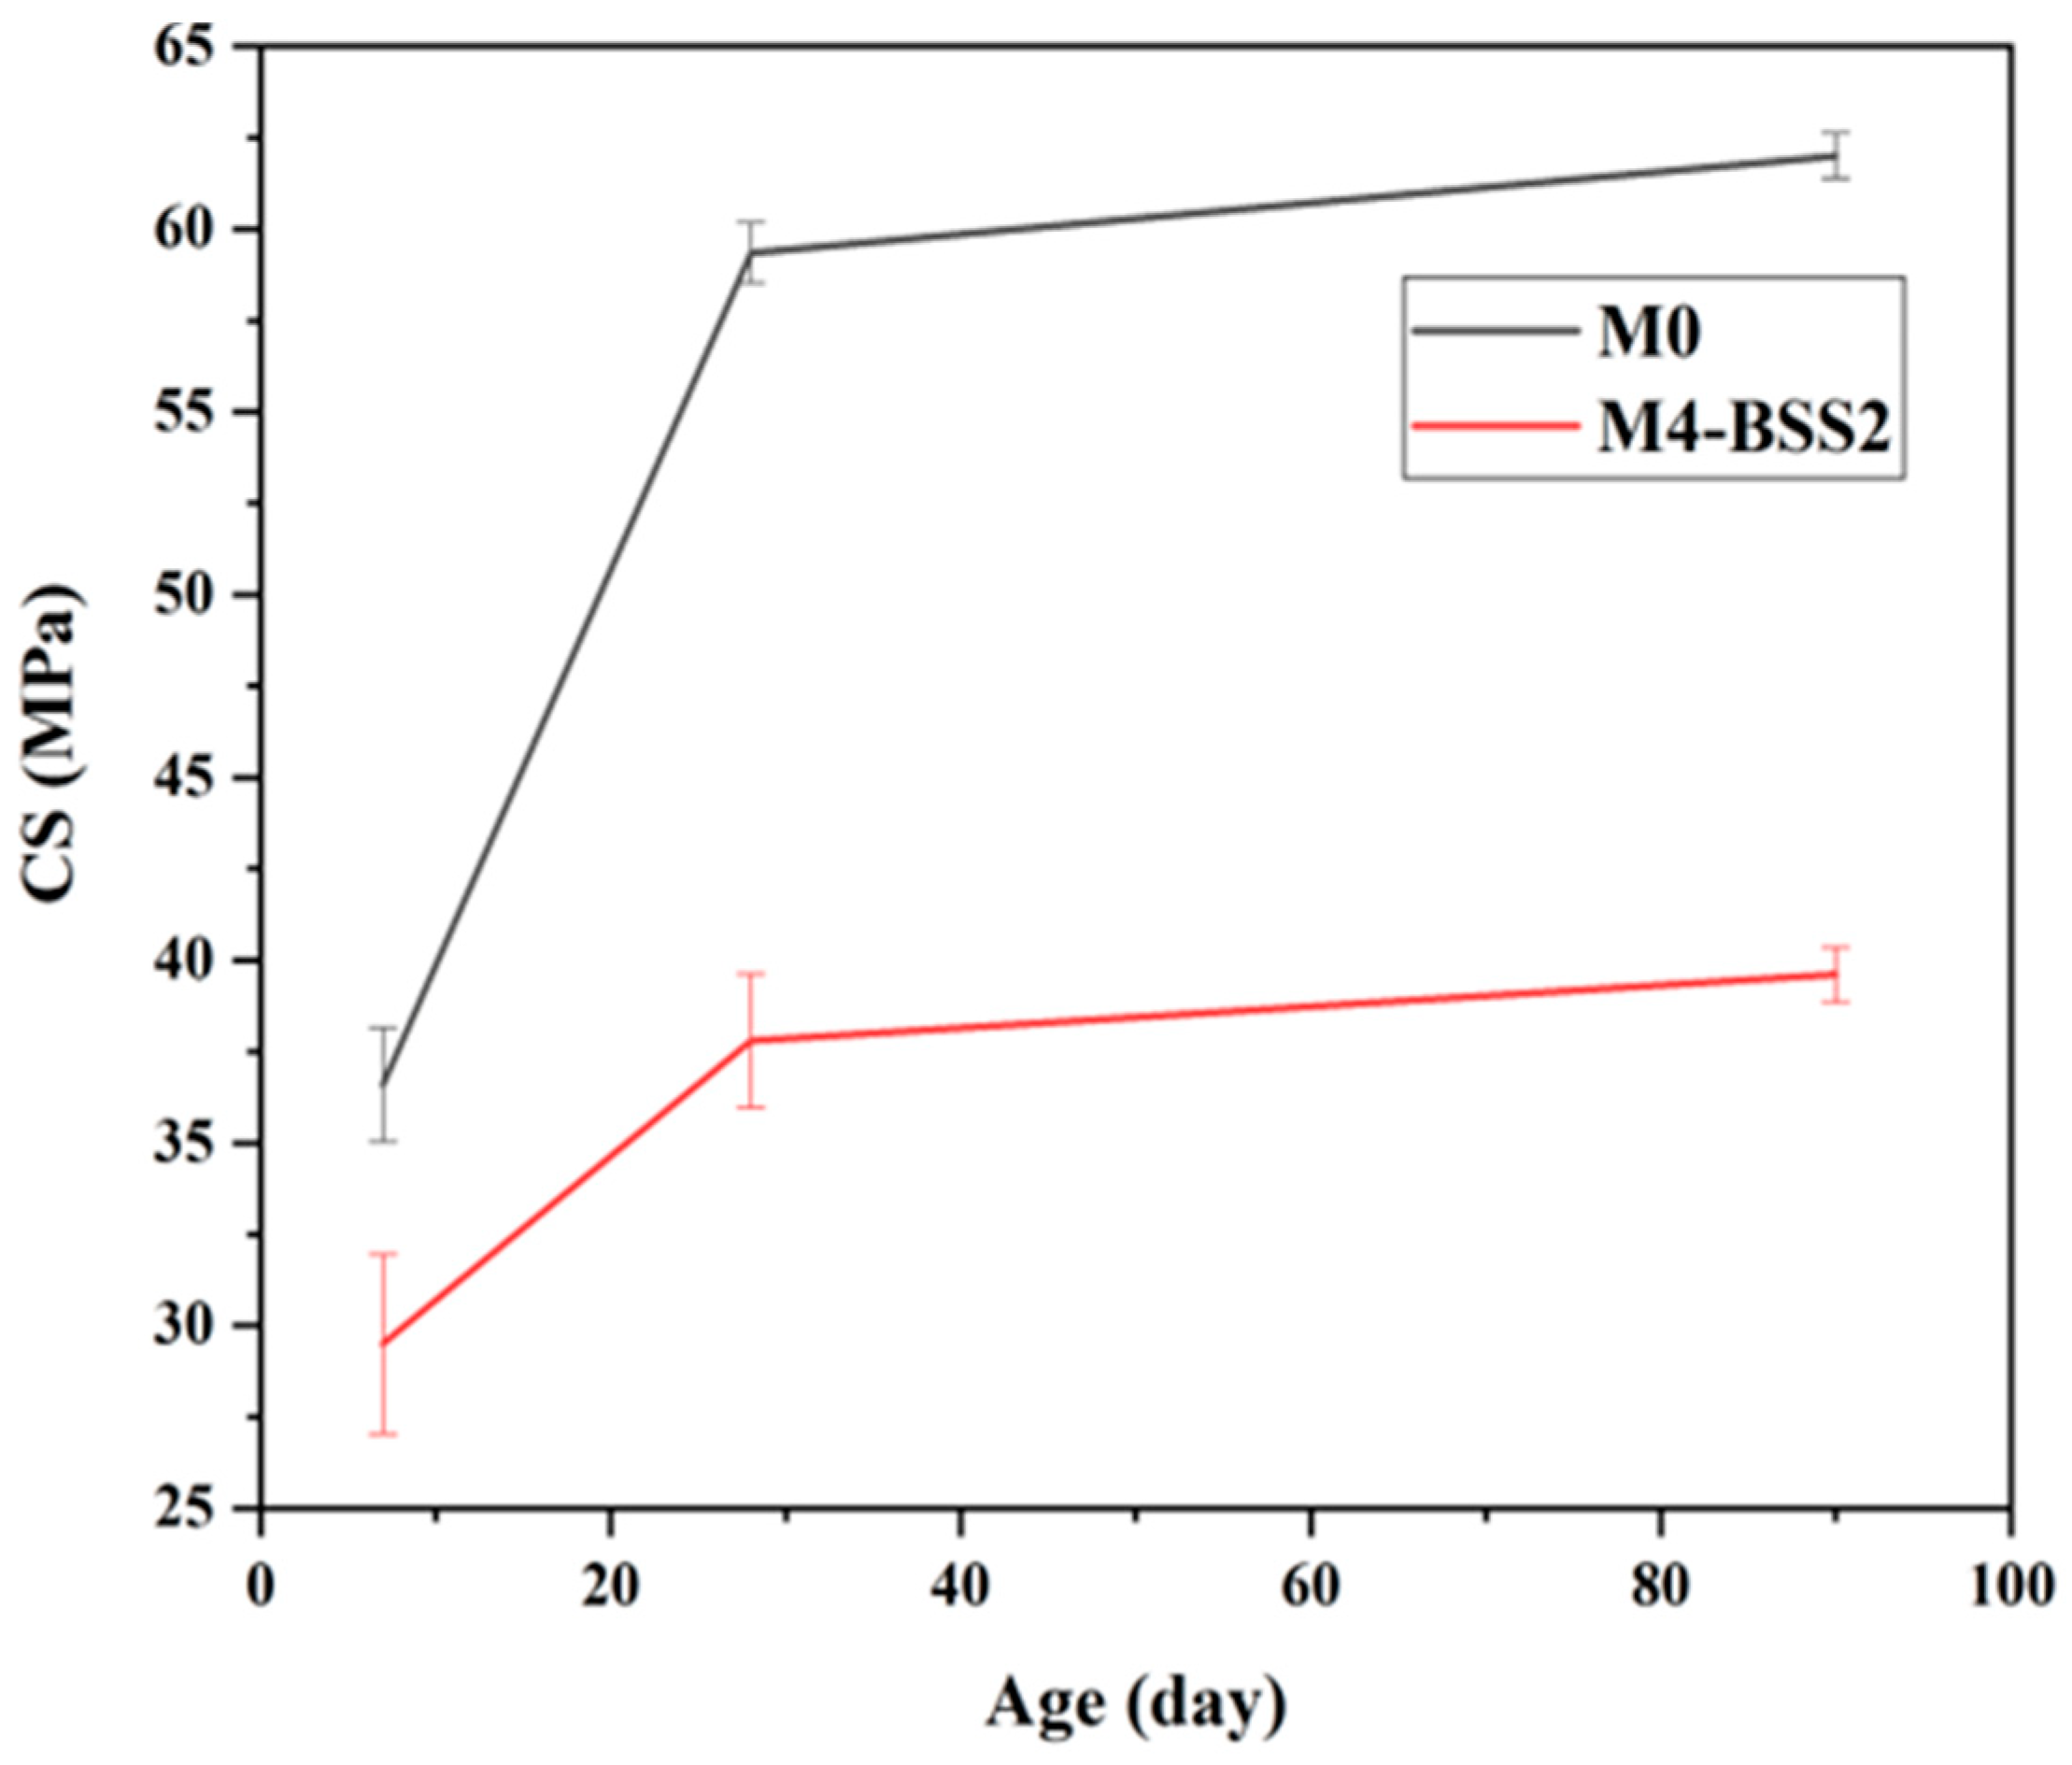
M0 and M4-BSS2 have been tested for 90 days. Their compressive strength values are 62 MPa and 39.6 MPa, and their flexural strength values are 8.46 MPa and 4.90 MPa, respectively. Therefore, the highest SP with 497 m2/kg silica sand implies a 40% decrease in mechanical strength after 90 curing days.
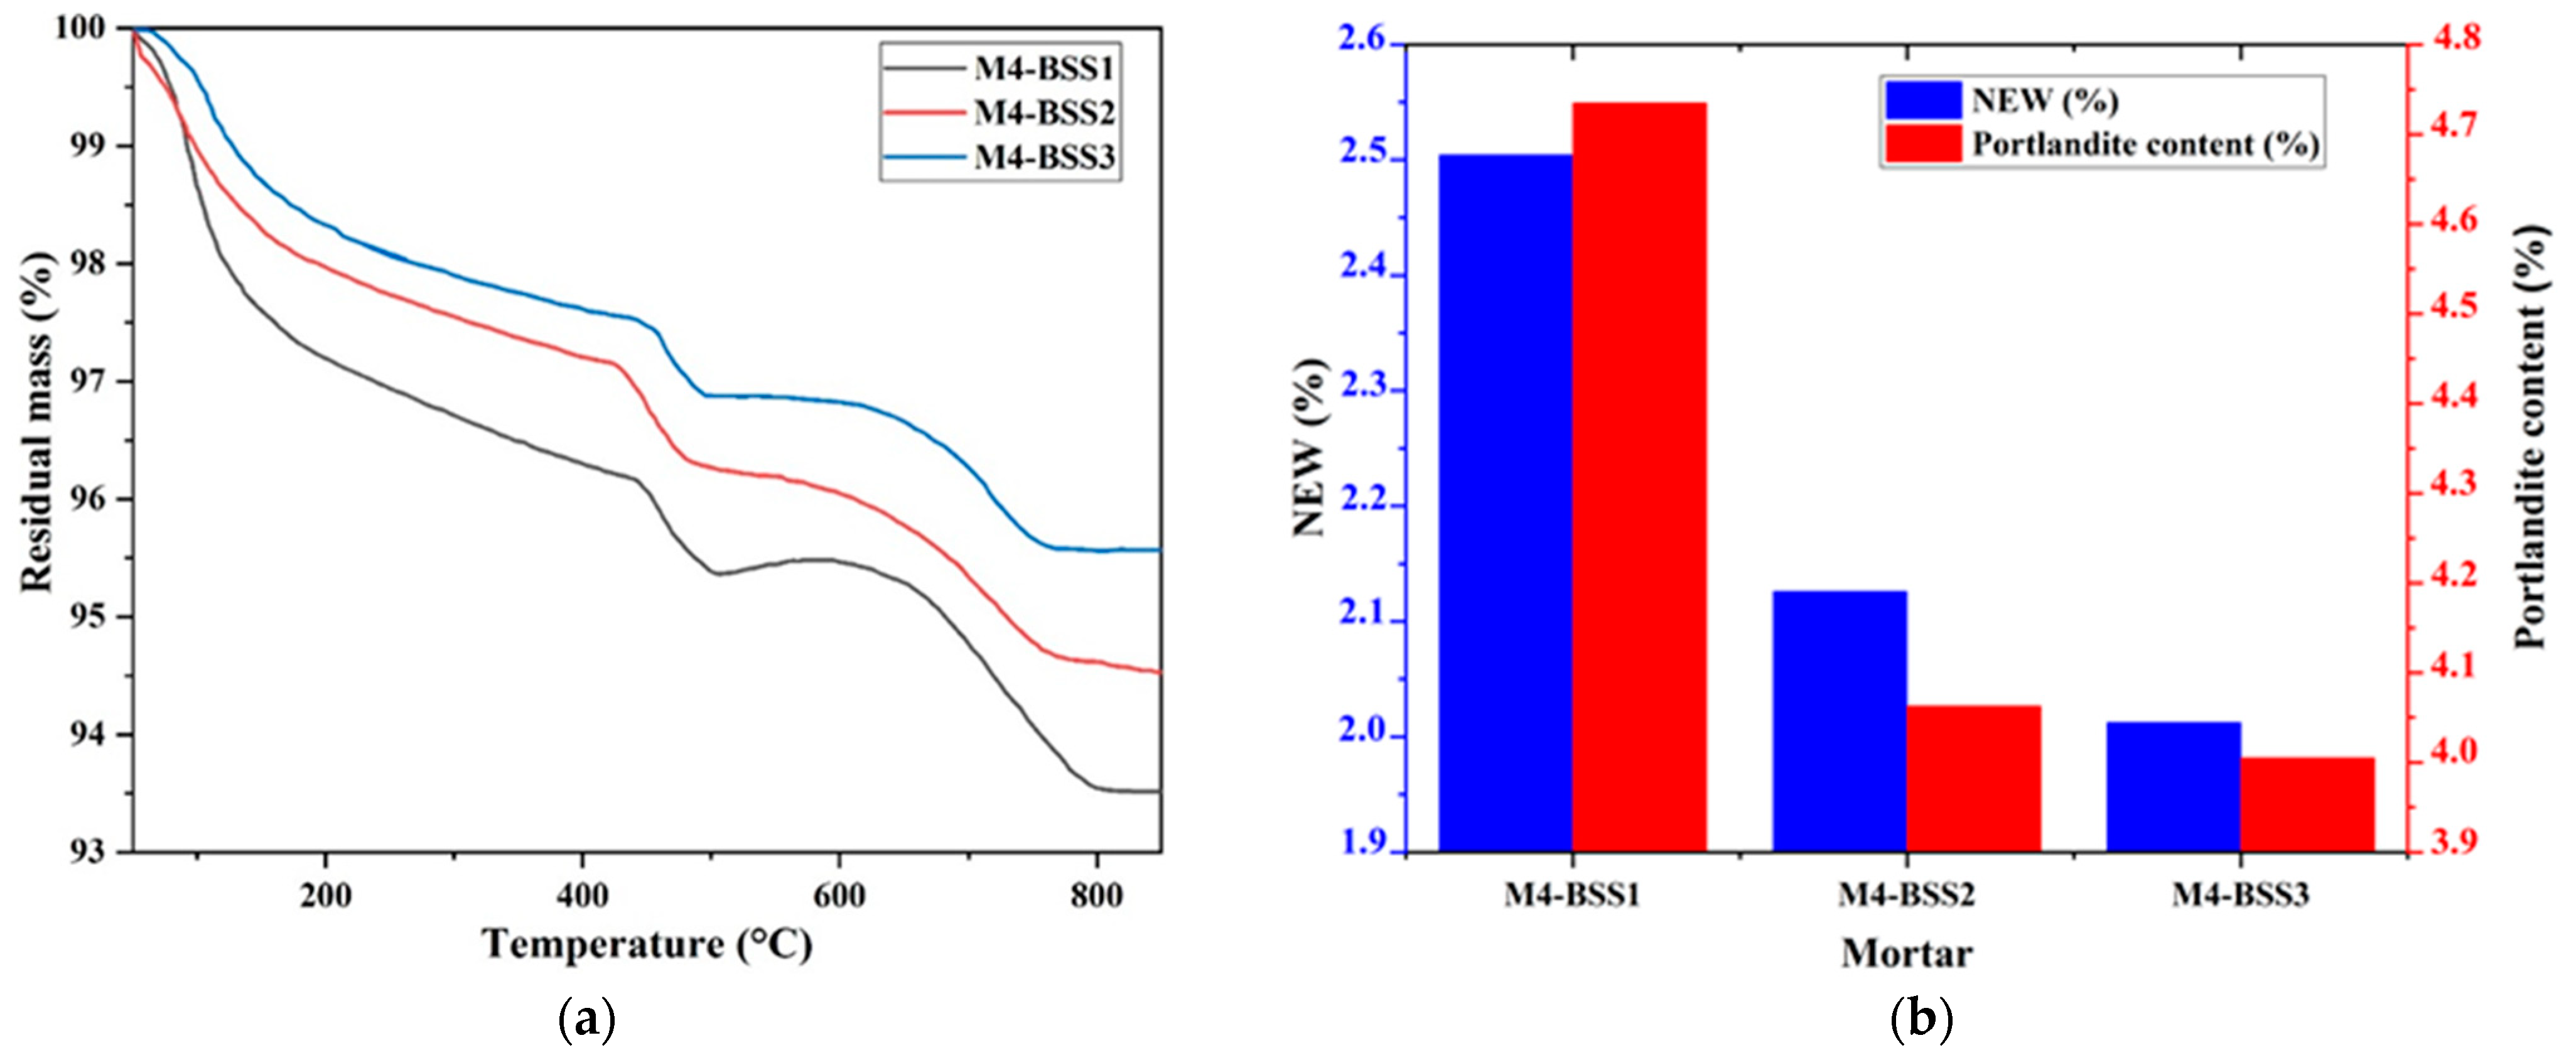
Figure 2 presents the TGA results of M4 after 1-day curing by varying BSS. Figure 2a has residual mass curves, and Figure 2b shows NEW and portlandite content.
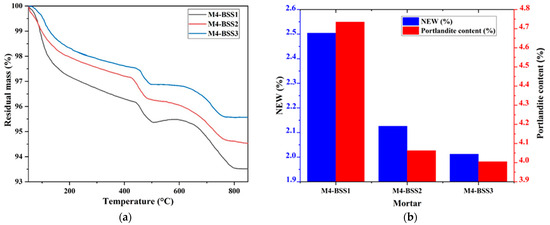
Figure 2.
TGA of M4. (a) residual mass curves; (b) hydration degree and amount of portlandite at 1-day curing.
Figure 2 shows a slight mass loss of M4 caused by silica sand fine particles at an early age. However, the variation in NEW and Ca(OH)2 content concerning BSS is not significant due to the nucleation phenomenon [44,45].
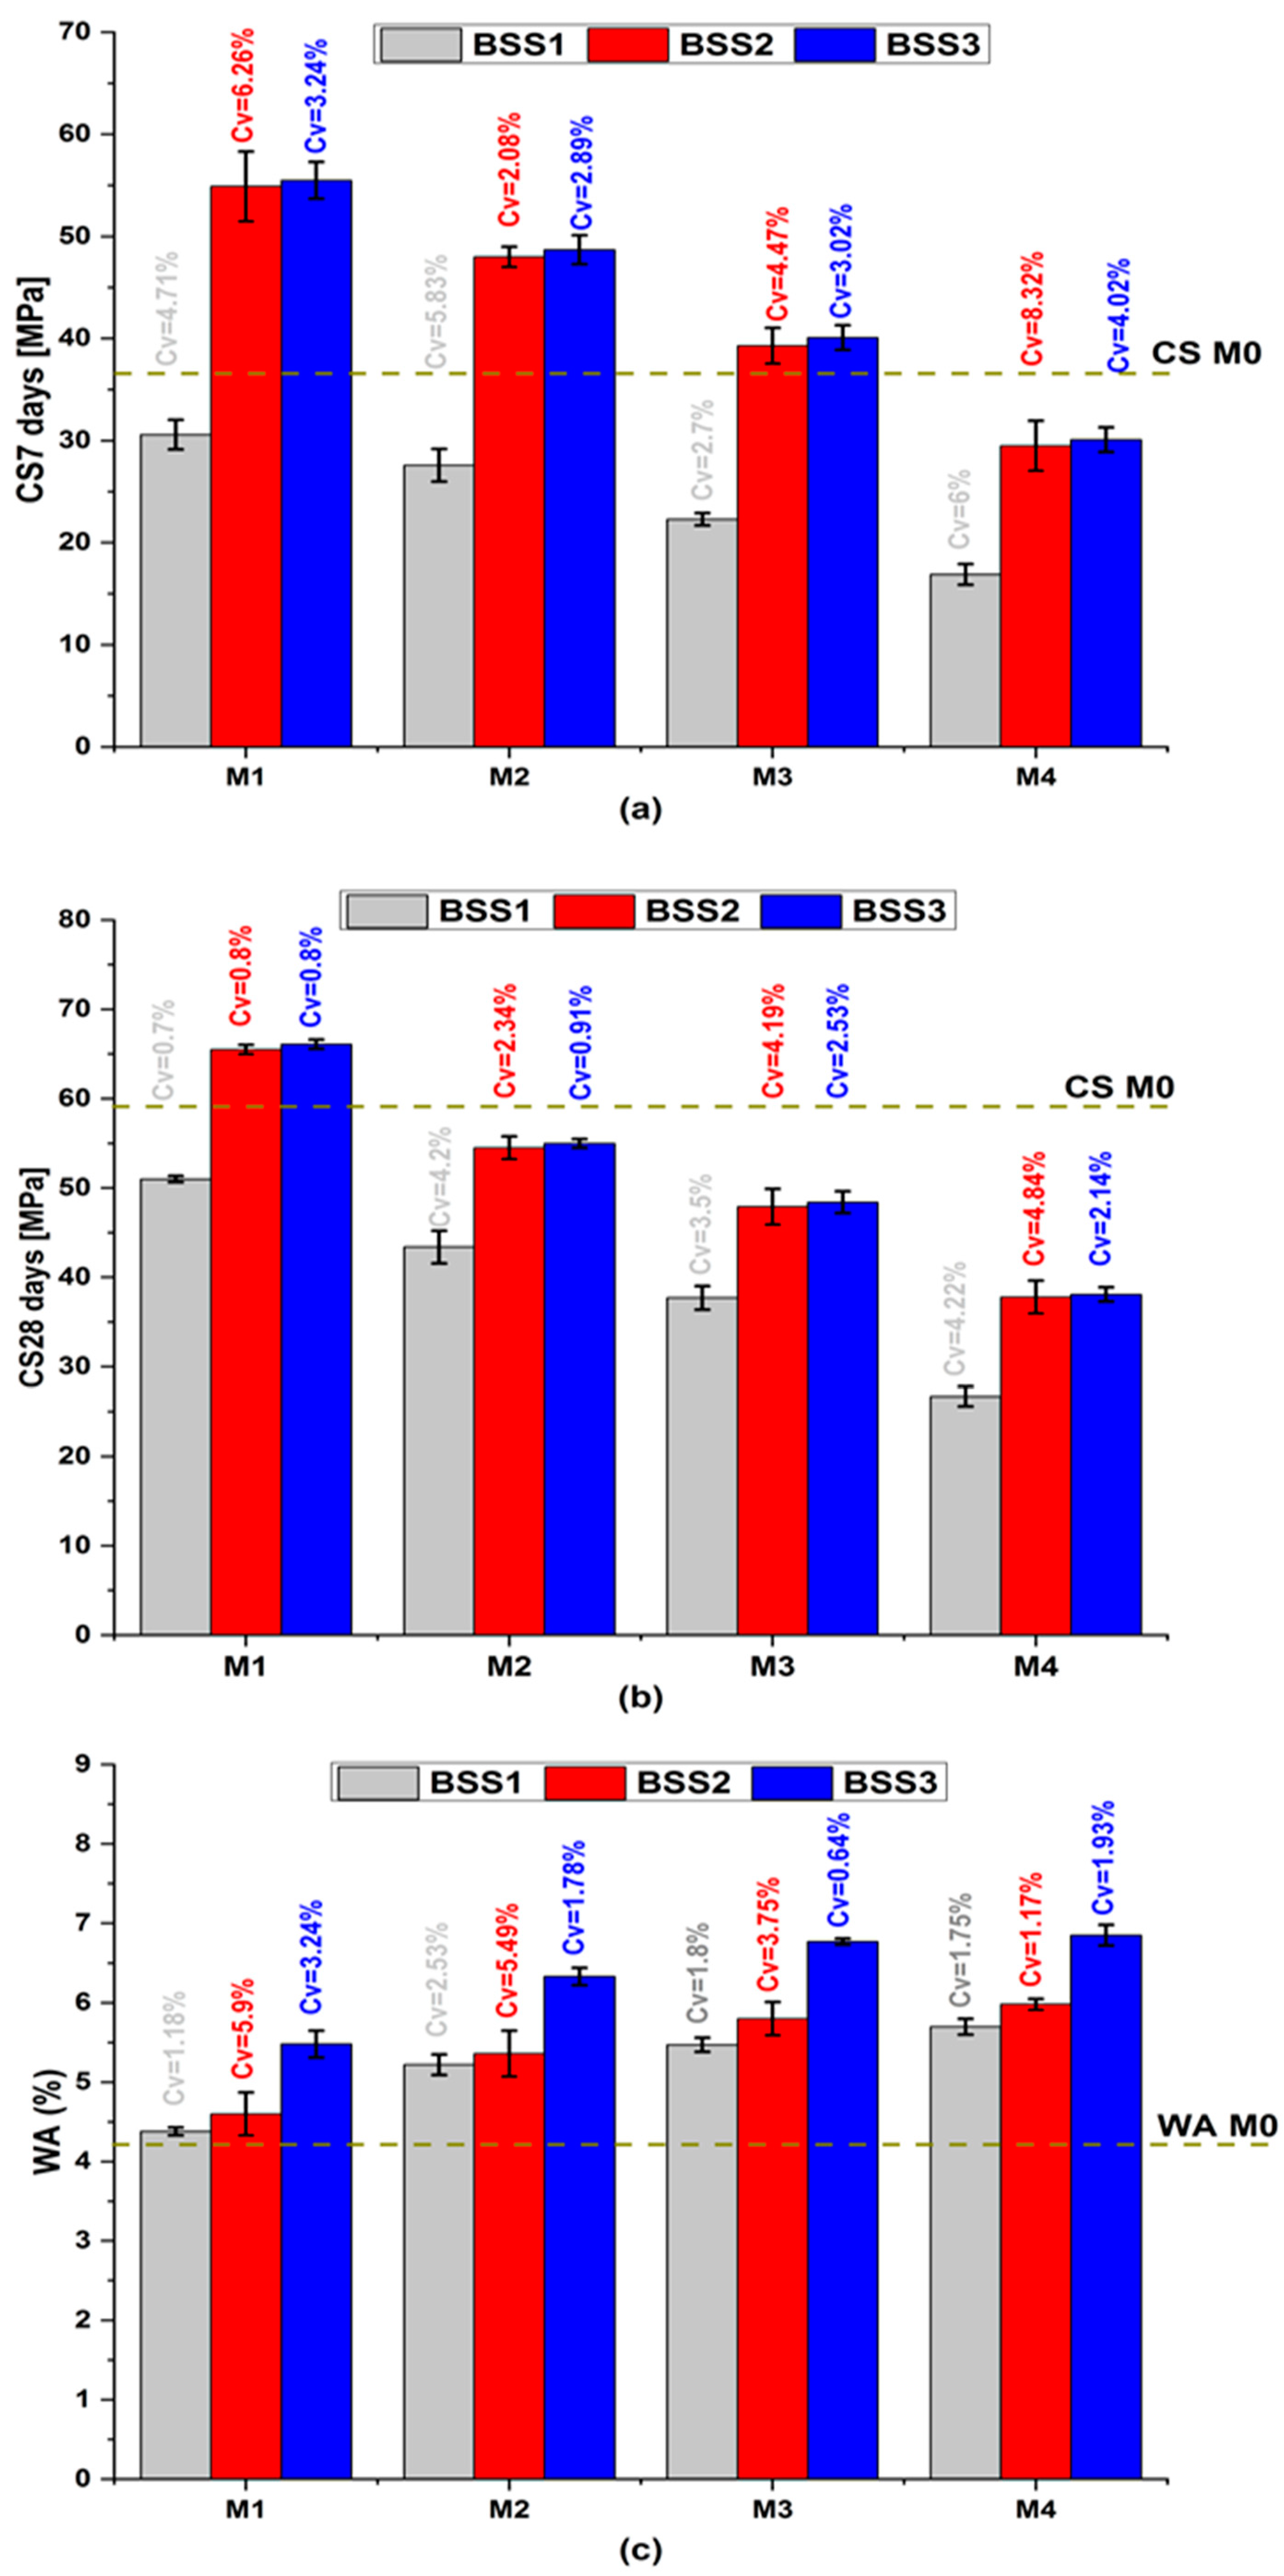
Figure 3 shows the average mortar properties of CS7, CS28, and WA with their coefficient of variation (Cv). In Figure 3a,b, the compressive strength exhibits a comparable qualitative trend with varying BSS [46,47]. At the same age, CS decreases with the increase in cement substitution and the resulting increase in water-to-cement ratio (W/C) [48]. The decrease in cement content increases the hydraulic index (Table 4), reduces hydration products that confer mechanical strength to mortars [49,50], and causes the formation of large capillary pores. On the other hand, CS increases with an increase in silica sand BSS. This behavior is due to the sand’s fineness exceeding that of cement (Figure 1a). The BSS2 and BSS3 values ensure that M1 to M3 CS7 and M1 CS28 are higher than M0. The pozzolanic effect of the silica sand justifies its mechanical performance because it contributes to the formation of the amorphous and dense calcium silicate hydrate gel [51,52]. Whatever the cement substitution ratio, the CS7 and CS28 values of mortars containing BSS2 sand are close to those containing BSS3 sand (red and blue bars in Figure 3a,b, respectively). It demonstrates the benefits of silica sand as pozzolanic and a filler material [49,53,54]. Therefore, BSS2 sand is recommended for binary mortars because it balances mechanical and environmental goals concerning high CS values and low grinding energy.

Figure 3.
Mortar properties. (a) compressive strength at 7 days; (b) compressive strength at 28 days; (c) water absorption.
In Figure 3c, the increase in sand BSS implies an increase in WA because the sand particles are finer than those of cement (Table 1) and require more water. It causes a decrease in the cement hydrate volume and an increase in porosity and water absorption. The simultaneous increase in BSS and substitution ratio causes an increase in WA from 4.2% (M0) to 6.8% (M4-BSS3). The observed trend is attributed to the angular shape of silica sand grains, making granular stacking a bit challenging. However, the WA of binary mortars remains below 10% and ensures durability in aggressive environments [55].
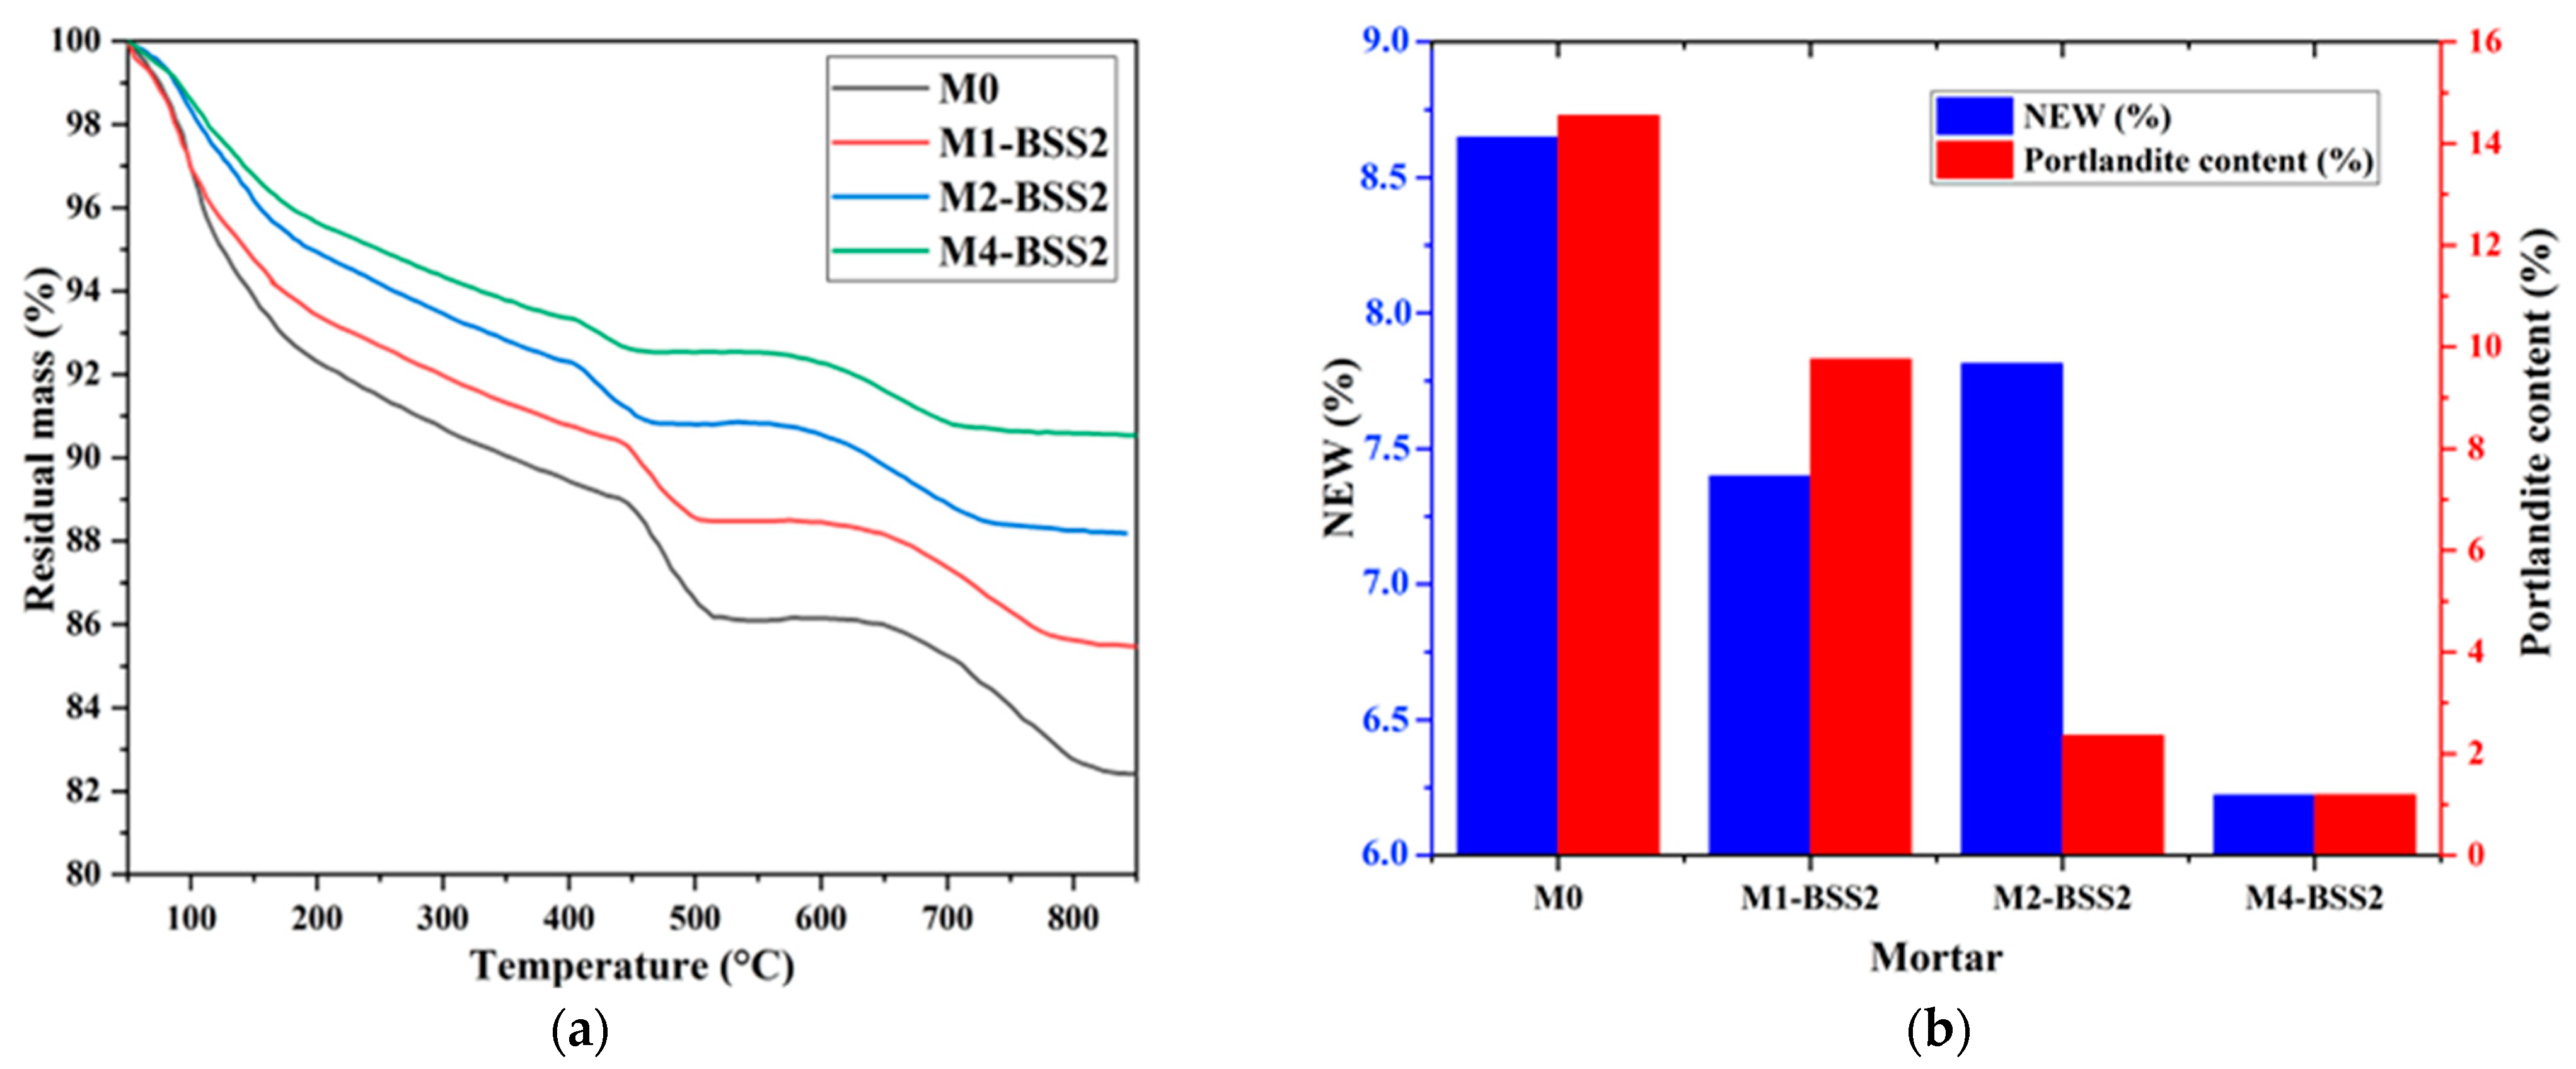
Figure 4a shows the residual masses of M0 and binary mortars containing BSS2 sand by varying the cement substitution ratio. Figure 4b represents the NEW and portlandite content of M0 and binary mortars containing BSS2 sand after 7-day curing.

Figure 4.
TGA of a mixture with different silica sand substitution ratios. (a) residual mass curves; (b) NEW and portlandite content at 7 days.
The results revealed an inversely proportional relationship between the sand substitution ratio and NEW, which decreased from 8.65% to 6.22% from M0 to M4-BSS2, respectively (Figure 4b). According to [56], the dilution effect occurring when a pozzolanic additive substitutes the cement can explain that. The pozzolanic behavior of silica sand causes the partial consumption of calcium hydroxide ions produced during the cement hydration, resulting in a M0 to M4 decrease in Ca(OH)2 from 14.55% to 1.19%, respectively (Figure 4b).
Table 6 compares M0 and M4-BSS2 NEW and CH values at 7 and 90 days.
Table 6.
Effects of curing time on NEW and CH.
According to Table 6, NEW increases with time. M4-BSS2 is 28% and 18% lower than M0 after 7 and 90 days of hydration, respectively. A dilution effect [57,58] can explain this trend. Furthermore, the effective contribution of sand to hydration occurs in the long term. Over time, an increase in Ca(OH)2 in both samples reveals the formation of hydrated calcium silicate compounds due to hydration reactions [8,17]. In M0, CH contents increase with sample age because hydration leads to the formation of hydrated solids. The quantity of CH in M4-BSS2 is lower than in M0 due to dilution and pozzolanic reactions. After 7 and 90 days of curing, a decrease in CH of 91% and 54% (Table 6) is observed compared to M0, respectively. Finely ground sand promotes long-term hydration reactions by consuming portlandite from cement hydration [59].
Figure 5 shows the TGA results of M0 and M4 at 7 and 90 days. At an early age (7 days), the mass loss of M0 is higher than that of M4-BSS2. At 90 days, both curves are similar below 450 °C because sand hydration products accelerate the long-term hydration processes.
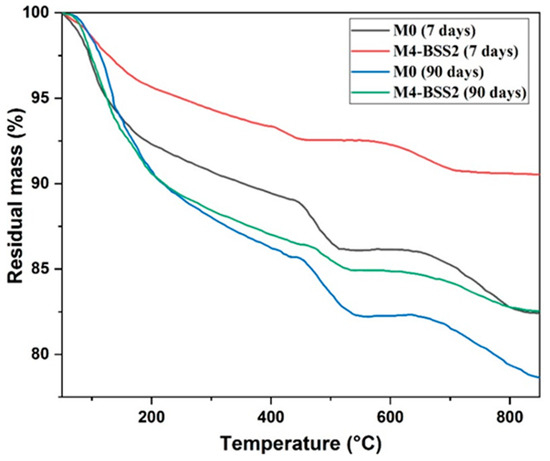
Figure 5.
TGA curves of M0 and M4 at 7 and 90 days.
The evolution of compressive strength with age (Figure 6) and the data in Table 6 suggest a correlation between the variation in NEW and CS. Whatever the tested mixture, CS has a decreasing rate over time. CS7 is about 73% of CS90 for M4-BSS2 and 51% of CS90 for M0; CS28 is about 90% of CS90 for both mixtures.

Figure 6.
Effect of curing time on CS.
The non-evaporable water content can predict the compressive strength of binary mortars containing finely ground sand. Further studies will confirm the hypothesis and investigate the responsible mechanism.
4. Statistical Analysis
The models proposed by Equations (6)–(8) have high correlation coefficients (R2 > 0.8 in Table 7) between the predicted and obtained mechanical and physical properties.
Table 7.
Summary of fit.
Table 8 shows the results of the ANOVA for each modeled response. Since the t value of each model is higher than tcrit (tcrit for α = 0.05, − 1 = 3, and n − = 8 is equal to 4.07), at least one significant variable is in each model.
Table 8.
ANOVA results for the proposed models.
Table 9 presents the contribution of each independent variable (i.e., BSS in m2/kg and SP in %) and their interaction with SC7, SC28, and WA. In this study, tcrit was 2.306 for experiments and = 4 coefficients.
Table 9.
Effect test.
According to Table 9, the independent variables (i.e., SP and BSS) affect CS7, CS28, and WA since |t| > tcrit. However, the Student’s t-test shows that the interaction between BSS (m2/kg) × SP (%) is not significant since |t| < tcrit. Therefore, the proposed models can predict the sand powder effects on the mechanical and physical properties of mortars.
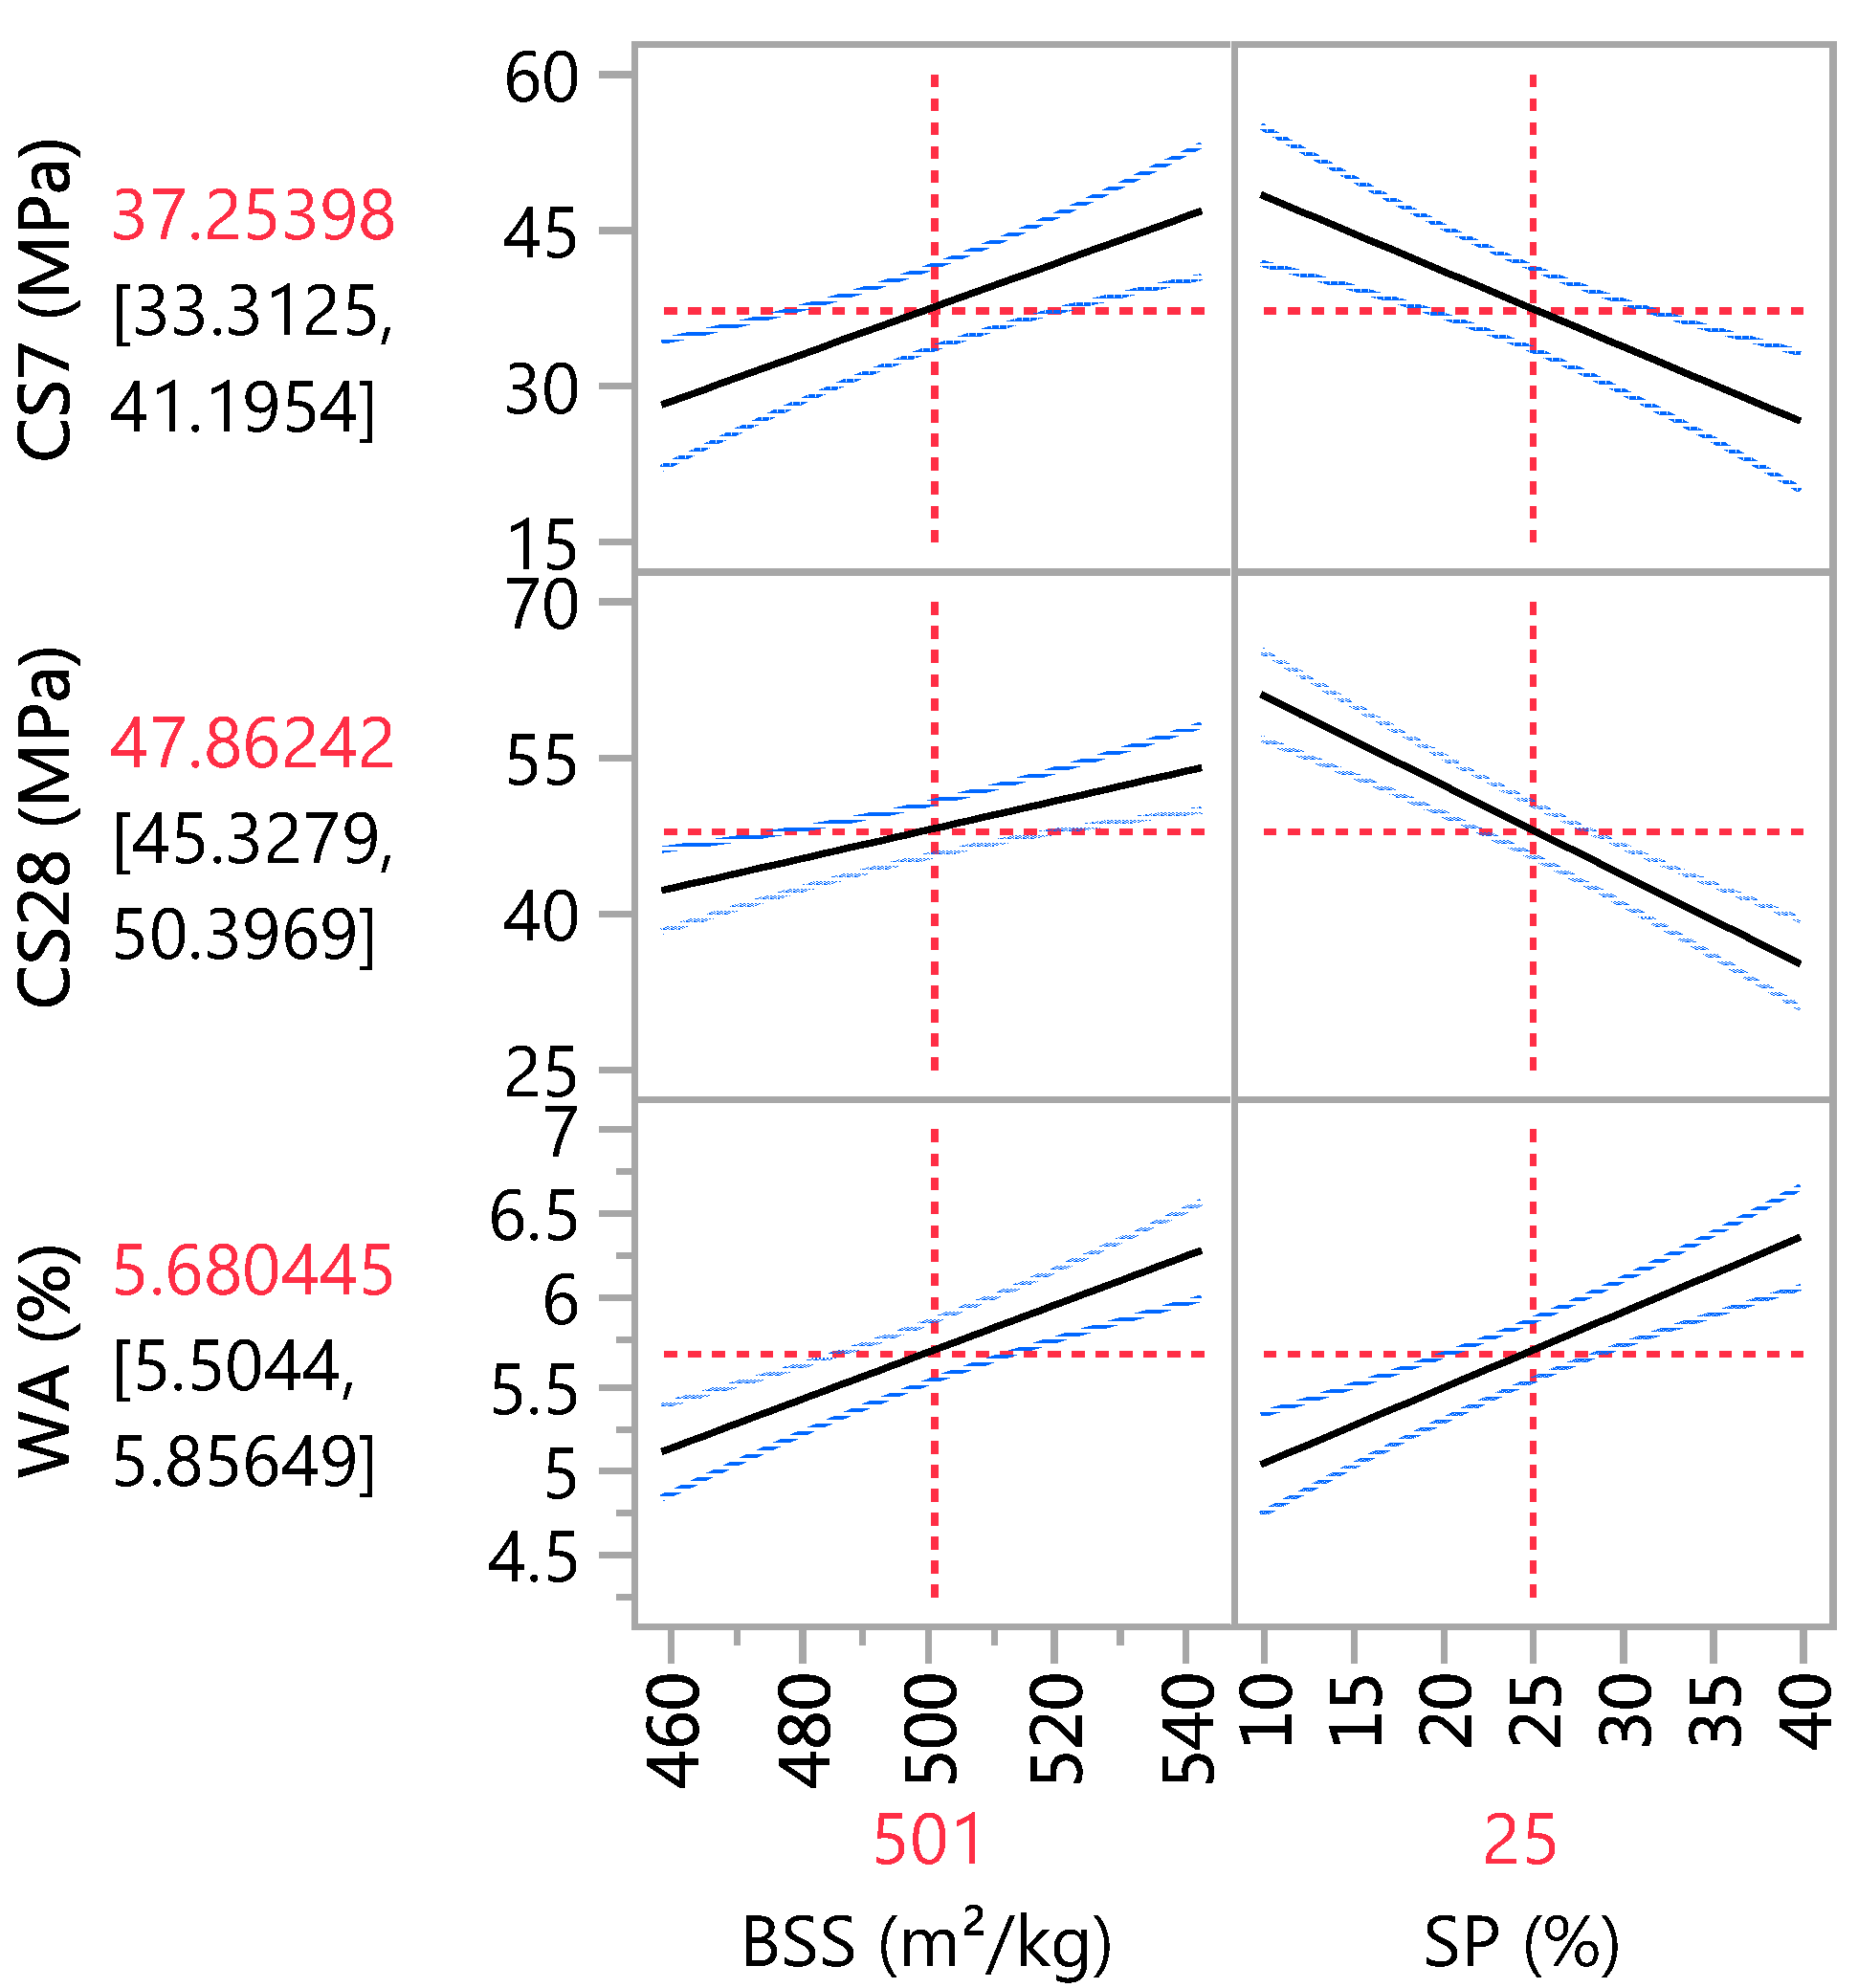
The adopted models allow iso-response curves to be drawn based on the independent variables. The main effect plot in Figure 7 confirms that the sand substitution hurts compressive strength, and an increase in SP causes a decrease in CS. On the other hand, BSS has a positive effect on CS. Its influence is more significant at 7 days than at 28 days of curing. This conclusion aligns with the estimation coefficients in Table 9, where the coefficients for BSS and SP are 9.31 and −10.89 at 7-day curing, respectively, and 5.90 and −12.97 at 28-day curing, respectively. Concerning WA, the statistical results indicate that BSS and SP positively affect water absorption. Therefore, an increase in these two variables leads to an increase in water absorption, as in Table 9, where the coefficients for BSS and SP are 0.59 and 0.67, respectively.

Figure 7.
Main effects plot.
Table 10 lists the mechanical properties of the cementitious mortars according to Equation (10).
Table 10.
MPR results.
Figure 8 depicts the evolution of MPR as a function of SP and BSS and confirms that both significantly affect the mechanical response.
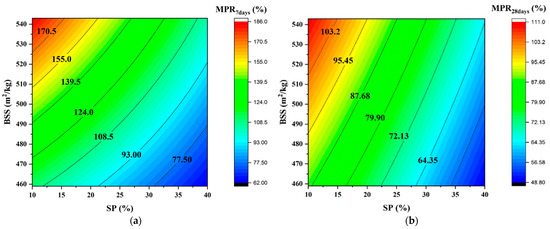
Figure 8.
Iso-response curves of MPR. (a) at 7 days; (b) at 28 days.
5. Conclusions
The environmental burdens of manufacturing are a challenge faced by cement production companies to offer sustainable cement. This study investigates the mechanical and physical properties of binary mortars with finely ground silica sand as a partial substitute for cement. Thirteen mortars have been investigated by varying four substitution ratios from 0% to 40% and three sand fineness values from 459 m2/kg to 543 m2/kg. Experimental evaluations and statistical data analysis allowed the following conclusions:
- At a young age, the sand BSS does not significantly affect the degree of hydration or amount of portlandite. The increase in sand fineness from 459 to 497 and 543 m2/kg decreases the non-evaporable water content from 2.50% to 2.12% and 2.01%, respectively. Moreover, the portlandite content decreased from 4.73% to 4.06% and 4.00% due to the increase in sand fineness.
- Increasing the substitution ratio from 0% to 40% causes a decrease in the non-evaporable water content from 8.65% to 6.22% due to the dilution effect and the portlandite content from 14.55% to 1.19% due to the sand pozzolanic properties.
- The increase in fineness from 459 m2/kg to 543 m2/kg and the substitution ratio from 0% to 40% led to an increase in water absorption from 4.38% to 6.85% due to the sand’s specific surface area being higher than cement.
- The increase in sand BSS and substitution ratios reduces the volume of cement hydrates and increases porosity and water absorption. Whatever the curing period, the increase in silica sand content causes a decrease in the compressive strength of cement mortars.
- Despite the increase in sand BSS, all mortars maintain water absorption below 10%, ensuring durable and high-performing properties in aggressive environments.
- The statistical analysis of compression and water absorption results demonstrated a strong correlation between the obtained and predicted outcomes, with an R2 value exceeding 0.84 and a 95% confidence interval, confirming the validity of the proposed regression models.
Further research should be conducted because this study only included three BSS silica sands, and more binary mixtures should be investigated. Other testing procedures should be conducted to analyze the rheological characteristics of mortars through flow, setting times, shrinkage, microstructure, and durability. Moreover, it is suggested to deepen the micro-mechanisms responsible for water absorption. Finally, the life cycle impacts of binary mortars shall be compared to those of the reference material to assess their environmental effectiveness. This approach will result in better knowledge for practical applications.
Author Contributions
Data curation, formal analysis, investigation, methodology: all authors; Writing—original draft: A.D., K.H., M.B., S.T., R.H., G.D.S. and L.M.; Writing—review & editing: C.B.; G.D.S. and L.M. All authors contributed equally to this paper. All authors have read and agreed to the published version of this manuscript.
Funding
This research received no external funding.
Institutional Review Board Statement
Not applicable.
Informed Consent Statement
Not applicable.
Data Availability Statement
The data presented in this study are available on request from the corresponding author.
Conflicts of Interest
The authors declare no conflict of interest.
References
- Zhang, J.; Liu, G.; Chen, B.; Song, D.; Qi, J.; Liu, X. Analysis of CO2 emission for the cement manufacturing with alternative raw materials: A LCA-based framework. Energy Procedia 2014, 61, 2541–2545. [Google Scholar] [CrossRef]
- Shen, W.; Cao, L.; Li, Q.; Zhang, W.; Wang, G.; Li, C. Quantifying CO2 emissions from China’s cement industry. Renew. Sustain. Energy Rev. 2015, 50, 1004–1012. [Google Scholar] [CrossRef]
- Durastanti, C.; Moretti, L. Environmental impacts of cement production: A statistical analysis. Appl. Sci. 2020, 10, 8212. [Google Scholar] [CrossRef]
- Del Serrone, G.; Moretti, L. A stepwise regression to identify relevant variables affecting the environmental impacts of clinker production. J. Clean. Prod. 2023, 398, 136564. [Google Scholar] [CrossRef]
- Andrew, R.M. Global CO2 Emissions from Cement Production, 1928–2018. Earth Syst. Sci. Data 2019, 11, 1675–1710. [Google Scholar] [CrossRef]
- de Medeiros, M.H.F.; Raisdorfer, J.W.; Hoppe Filho, J.; Medeiros-Junior, R.A. Partial replacement and addition of fly ash in Portland cement: Influences on carbonation and alkaline reserve. J. Build. Rehabil. 2017, 2, 4. [Google Scholar] [CrossRef]
- Patil, C.; Manjunath, M.; Hosamane, S.; Bandekar, S.; Athani, R. Pozzolonic activity and strength activity index of Bagasse Ash and fly ash blended cement mortar. Mater. Today Proc. 2021, 42, 1456–1461. [Google Scholar] [CrossRef]
- Moussa, H.; Larbi, K.; Martin, C.; Pierre, C. Evaluation and improvement of pozzolanic activity of andesite for its use in eco-efficient cement. Constr. Build. Mater. 2013, 47, 1268–1277. [Google Scholar] [CrossRef]
- Tayeh, B.A.; Al Saffar, D.M.; Aadi, A.S.; Almeshal, I. Sulphate resistance of cement mortar contains glass powder. J. King Saud Univ. Eng. Sci. 2019, 32, 495–500. [Google Scholar] [CrossRef]
- Al Saffar, D.M.A.R. Experimental investigation of using ultra-fine glass powder in concrete. Int. J. Eng. Res. Appl. 2017, 7, 33–39. [Google Scholar]
- Ramezanianpour, A.A.; Mortezaei, M.; Mirvalad, S. Synergic effect of nano-silica and natural pozzolans on transport and mechanical properties of blended cement mortars. J. Build. Eng. 2021, 44, 102667. [Google Scholar] [CrossRef]
- Cheah, C.B.; Liew, J.J.; Kevin, K.L.P.; Rafat, S.; Weerachart, T. Properties of ternary blended cement containing ground granulated blast furnace slag and ground coal bottom ash. Constr. Build. Mater. 2022, 315, 125249. [Google Scholar] [CrossRef]
- Yan, P.; Zhang, Q. Microstructural characteristics of complex binder paste containing active or inert mineral admixtures. J. Chin. Ceram. Soc. 2006, 34, 1491–1496. [Google Scholar]
- Lin, R.-S.; Wang, X.-Y.; Zhang, G.-Y. Effects of Quartz Powder on the Microstructure and Key Properties of Cement Paste. Sustainability 2018, 10, 3369. [Google Scholar] [CrossRef]
- Ma, H.; Fan, H.; Yu, H.; Peng, X. Effect of using grounded coral sand on hydration and strength development of portland cement paste: Experimental and GEMS modelling investigation. J. Build. Eng. 2023, 68, 106001. [Google Scholar] [CrossRef]
- Saloni; Singh, A.; Kumar, J.; Parveen. Influence of fly ash, cement and ground river sand on compressive strength and chloride penetration of mortar. Mater. Today Proc. 2020, 33, 1690–1694. [Google Scholar] [CrossRef]
- Liu, M.; Liu, E.; Hao, J.L.; Di Sarno, L.; Xia, J. Hydration and material properties of blended cement with ground desert sand. Constr. Build. Mater. 2023, 389, 131624. [Google Scholar] [CrossRef]
- Skibsted, J.; Snellings, R. Reactivity of Supplementary Cementitious Materials (SCMs) in Cement Blends. Cem. Concr. Res. 2019, 124, 105799. [Google Scholar] [CrossRef]
- Juenger, M.C.G.; Snellings, R.; Bernal, S.A. Supplementary cementitious materials: New sources, characterization, and performance insights. Cem. Concr. Res. 2019, 122, 257–273. [Google Scholar] [CrossRef]
- Lin, R.-S.; Liao, Y.; Han, Y.; Oh, S.; Park, K.-B.; Yang, H.-M.; Wang, X.-Y.; Yang, B.; Meng, L.-Y. Low-CO2 Optimization Design of Quaternary Binder Containing Calcined Clay, Slag, and Limestone. Materials 2023, 16, 6385. [Google Scholar] [CrossRef]
- Alhozaimy, A.; Al-Negheimish, A.; Alawad, O.; Jaafar, M.; Noorzaei, J. Binary and ternary effects of ground dune sand and blast furnace slag on the compressive strength of mortar. Cem. Concr. Compos. 2012, 34, 734–738. [Google Scholar] [CrossRef]
- Izquierdo, M.; Querol, X.; Davidovits, J.; Antenucci, D.; Nugteren, H.; Fernández-Pereira, C. Coal fly ash-slag-based geopolymers: Microstructure and metal leaching. J. Hazard. Mater. 2009, 166, 561–566. [Google Scholar] [CrossRef]
- Yazici, H.; Yiǧiter, H.; Karabulut, A.Ş.; Baradan, B. Utilization of fly ash and ground granulated blast furnace slag as an alternative silica source in reactive powder concrete. Fuel 2008, 87, 2401–2407. [Google Scholar] [CrossRef]
- Panesar, D.K.; Zhang, R. Performance comparison of cement replacing materials in concrete: Limestone fillers and supplementary cementing materials—A review. Constr. Build. Mater. 2020, 251, 118866. [Google Scholar] [CrossRef]
- Hafez, H.; Kurda, R.; Cheung, W.M.; Nagaratnam, B. Comparative life cycle assessment between imported and recovered fly ash for blended cement concrete in the UK. J. Clean. Prod. 2019, 244, 118722. [Google Scholar] [CrossRef]
- Krauss, H.; Budelmann, H. Hydration kinetics of cement paste with very fine inert mineral additives. In Proceedings of the International RILEM Conference on Advances in Construction Materials through Science and Engineering, Hong Kong, China, 5–7 September 2011; pp. 93–99. [Google Scholar]
- Alhozaimy, A.; Alawad, O.A.; Jaafar, M.S.; Al-Negheimish, A.; Noorzaei, J. Use of Fine Ground Dune Sand as a Supplementary Cementing Material. J. Civ. Eng. Manag. 2014, 20, 32–37. [Google Scholar] [CrossRef]
- Guettala, S.; Mezghiche, B. Compressive strength and hydration with age of cement pastes containing dune sand powder. Constr. Build. Mater. 2011, 25, 1263–1269. [Google Scholar] [CrossRef]
- Zaitri, R.; Guettala, S.; Bederina, M. Physico-mechanical properties of mortars based on the addition of dune sand powder and the recycled fines using the mixture design modelling approach. J. Adhes. Sci. Technol. 2018, 32, 1613–1628. [Google Scholar] [CrossRef]
- Dahmani, S.; Kriker, A. Contribution to the physical-mechanical study of cement CRS basis of dune-sand powder and other minerals. Technol. Mater. Renew. Energy Environ. Sustain. 2016, 1758. [Google Scholar] [CrossRef]
- Arroudj, K.; Dorbani, S.; Oudjit, M.N.; Tagnit-Hamou, A. Use of Algerian Natural Mineral Deposit as Supplementary Cementitious Materials. Int. J. Eng. Res. Afr. 2018, 34, 48–58. [Google Scholar] [CrossRef]
- Lin, R.S.; Wang, X.Y.; Han, Y. Effects of cement types and addition of quartz and limestone on the normal and carbonation curing of cement paste. Constr. Build. Mater. 2021, 305, 124799. [Google Scholar] [CrossRef]
- Tavares, L.R.C.; Junior, J.F.T.; Costa, L.M.; da Silva Bezerra, A.C.; Cetlin, P.R.; Aguilar, M.T.P. Influence of quartz powder and silica fume on the performance of Portland cement. Sci. Rep. 2020, 10, 21461. [Google Scholar] [CrossRef] [PubMed]
- Stark, J.; Moser, B.; Bellmann, F. Nucleation and growth of C-S-H phases on mineral admixtures. In Advances in Construction Materials; Springer: Berlin/Heidelberg, Germany, 2007; pp. 531–538. [Google Scholar]
- Nécira, B.; Guettala, A.; Guettala, S. Study of the combined effect of different types of sand on the characteristics of high performance self-compacting concrete. J. Adhes. Sci. Technol. 2017, 31, 1912–1928. [Google Scholar] [CrossRef]
- ISO 13320-1; Particle size analysis—Laser diffraction methods, Part 1: General Principles. International Organization for Standardization: Geneva, Switzerland, 1999.
- EN 196-1:2016; Methods of Testing Cement—Part 1: Determination of Strength. Comite Europeen de Normalisation (CEN): Brussels, Belgium, 2016.
- Kellouche, Y.; Bougara, A. Analyse de la Réactivité du Laitier d’El-Hadjar Par les Essais Thermogravimétriques. Master´s Thesis, Université Hassiba Benbouali de Chlef, Chlef, Algeria, 2011. [Google Scholar]
- Chiker, T.; Aggoun, S.; Houari, H.; Siddique, R. Sodium sulfate and alternative combined sulfate/chloride action on ordinary and self-consolidating PLC-based concretes. Constr. Build. Mater. 2016, 106, 342–348. [Google Scholar] [CrossRef]
- Belkadi, A.A.; Kessal, O.; Chiker, T.; Achour, Y.; Rouabhi, A.; Messaoudi, O.; Khouadjia, M.L.K. Full factorial design of mechanical and physical properties of eco-mortars containing waste marble powder. Arab. J. Sci. Eng. 2023, 48, 4325–4338. [Google Scholar] [CrossRef]
- SAS Institute. SAS User’s Guide: Statistics; SAS Institute: Cary, NC, USA, 2005. [Google Scholar]
- Protassov, K. Analyse Statistique des Données Expérimentales. Grenoble Science; Université Joseph Fourier: Grenoble, France, 2002. [Google Scholar]
- Boutlikht, M.; Hebbache, K.; Tabchouche, S.; Douadi, A.; Gahtar, N. Evaluation of the sieve analysis effect on the efficiency of PVC waste as sand replacement in concrete mixtures. J. Adhes. Sci. Technol. 2023, 1–16. [Google Scholar] [CrossRef]
- Bougara, A.; Lynsdale, C.; Milestone, N.B. Reactivity and performance of blastfurnace slags of differing origin. Cem. Concr. Compos. 2010, 32, 319–324. [Google Scholar] [CrossRef]
- Douglas, E.; Bilodeau, A.; Brandstetr, J.; Malhotra, V.M. Alkali activated ground granulated blast-furnace slag concrete: Preliminary investigation. Cem. Concr. Res. 1991, 21, 101–108. [Google Scholar] [CrossRef]
- Khan, K.; Salami, B.A.; Jamal, A.; Amin, M.N.; Usman, M.; Al-Faiad, M.A.; Abu-Arab, A.M.; Iqbal, M. Prediction Models for Estimating Compressive Strength of Concrete Made of Manufactured Sand Using Gene Expression Programming Model. Materials 2022, 15, 5823. [Google Scholar] [CrossRef]
- Djepaze, Y., II; Pagna, B.K.; Madi, A.B.; Kmseu, E.; Ntamack, G.E. Influence of the fineness modulus of sand on the compressive strength of Its Corresponding Mortar: A Mathematical Model Proposal. Sci. Technol. Publ. 2020, 4, 308–315. [Google Scholar]
- Vandhiyan, R.; Vijaty, T.J.; Kumar, M. Effect of fine aggregate properties on cement mortar strength. Mater. Today Proc. 2021, 37, 2019–2026. [Google Scholar] [CrossRef]
- Belebchouche, C.; Moussaceb, K.; Bensebti, S.-E.; Aït-Mokhtar, A.; Hammoudi, A.; Czarnecki, S. Mechanical and Microstructural Properties of Ordinary Concrete with High Additions of Crushed Glass. Materials 2021, 14, 1872. [Google Scholar] [CrossRef]
- Atahan, H.N.; Oktar, O.N.; Tasdemir, M.A. Effects of water-cement ratio and curing time on the critical pore width of hardened cement paste. Constr. Build. Mater. 2009, 23, 1196–1200. [Google Scholar] [CrossRef]
- Menéndez, E.; Sanjuán, M.Á.; García-Roves, R.; Argiz, C.; Recino, H. Sustainable and Durable Performance of Pozzolanic Additions to Prevent Alkali-Silica Reaction (ASR) Promoted by Aggregates with Different Reaction Rates. Appl. Sci. 2020, 10, 9042. [Google Scholar] [CrossRef]
- Mane, K.M.; Kulkarni, D.K.; Prakash, K.B. Properties and microstructure of concrete using pozzolanic materials and manufactured sand as partial replacement of fine aggregate. SN Appl. Sci. 2019, 1, 1–10. [Google Scholar] [CrossRef]
- Małek, M.; Łasica, W.; Jackowski, M.; Kadela, M. Effect of waste glass addition as a replacement for fine aggregate on properties of mortar. Materials 2020, 13, 3189. [Google Scholar] [CrossRef]
- Jurczak, R.; Szmatuła, F.; Rudnicki, T.; Korentz, J. Effect of Ground Waste Glass Addition on the Strength and Durability of Low Strength Concrete Mixes. Materials 2021, 14, 190. [Google Scholar] [CrossRef]
- Alexander, M.; Bertron, A.; De Belie, N. Performance of Cement-Based Materials in Aggressive Aqueous Environments; Springer: Berlin/Heidelberg, Germany, 2013; Volume 10. [Google Scholar]
- Zeng, Q.; Li, K.; Fen-chong, T.; Dangla, P. Determination of cement hydration and pozzolanic reaction extents for fly-ash cement pastes. Constr. Build. Mater. 2012, 27, 560–569. [Google Scholar] [CrossRef]
- Chidiac, S.E.; Panesar, D.K. Evolution of Mechanical Properties of Concrete Containing Ground Granulated Blast Furnace Slag and Effects on the Scaling Resistance Test at 28 days. Cem. Concr. Compos. 2008, 30, 63–71. [Google Scholar] [CrossRef]
- Lawrence, P.; Cyr, M.; Ringot, E. Mineral admixtures in mortars: Effect of inert materials on short-term hydration. Cem. Concr. Res. 2003, 33, 1939–1947. [Google Scholar] [CrossRef]
- Izadifar, M.; Ukrainczyk, N.; Salah Uddin, K.M.; Middendorf, B.; Koenders, E. Dissolution of Portlandite in Pure Water: Part 2 Atomistic Kinetic Monte Carlo (KMC) Approach. Materials 2022, 15, 1442. [Google Scholar] [CrossRef] [PubMed]


Disclaimer/Publisher’s Note: The statements, opinions and data contained in all publications are solely those of the individual author(s) and contributor(s) and not of MDPI and/or the editor(s). MDPI and/or the editor(s) disclaim responsibility for any injury to people or property resulting from any ideas, methods, instructions or products referred to in the content. |
© 2023 by the authors. Licensee MDPI, Basel, Switzerland. This article is an open access article distributed under the terms and conditions of the Creative Commons Attribution (CC BY) license (https://creativecommons.org/licenses/by/4.0/).