
Study on the Microstructure of Mg-4Zn-4Sn-1Mn-xAl As-Cast Alloys

Abstract
:1. Introduction
2. Materials and Methods
3. Results
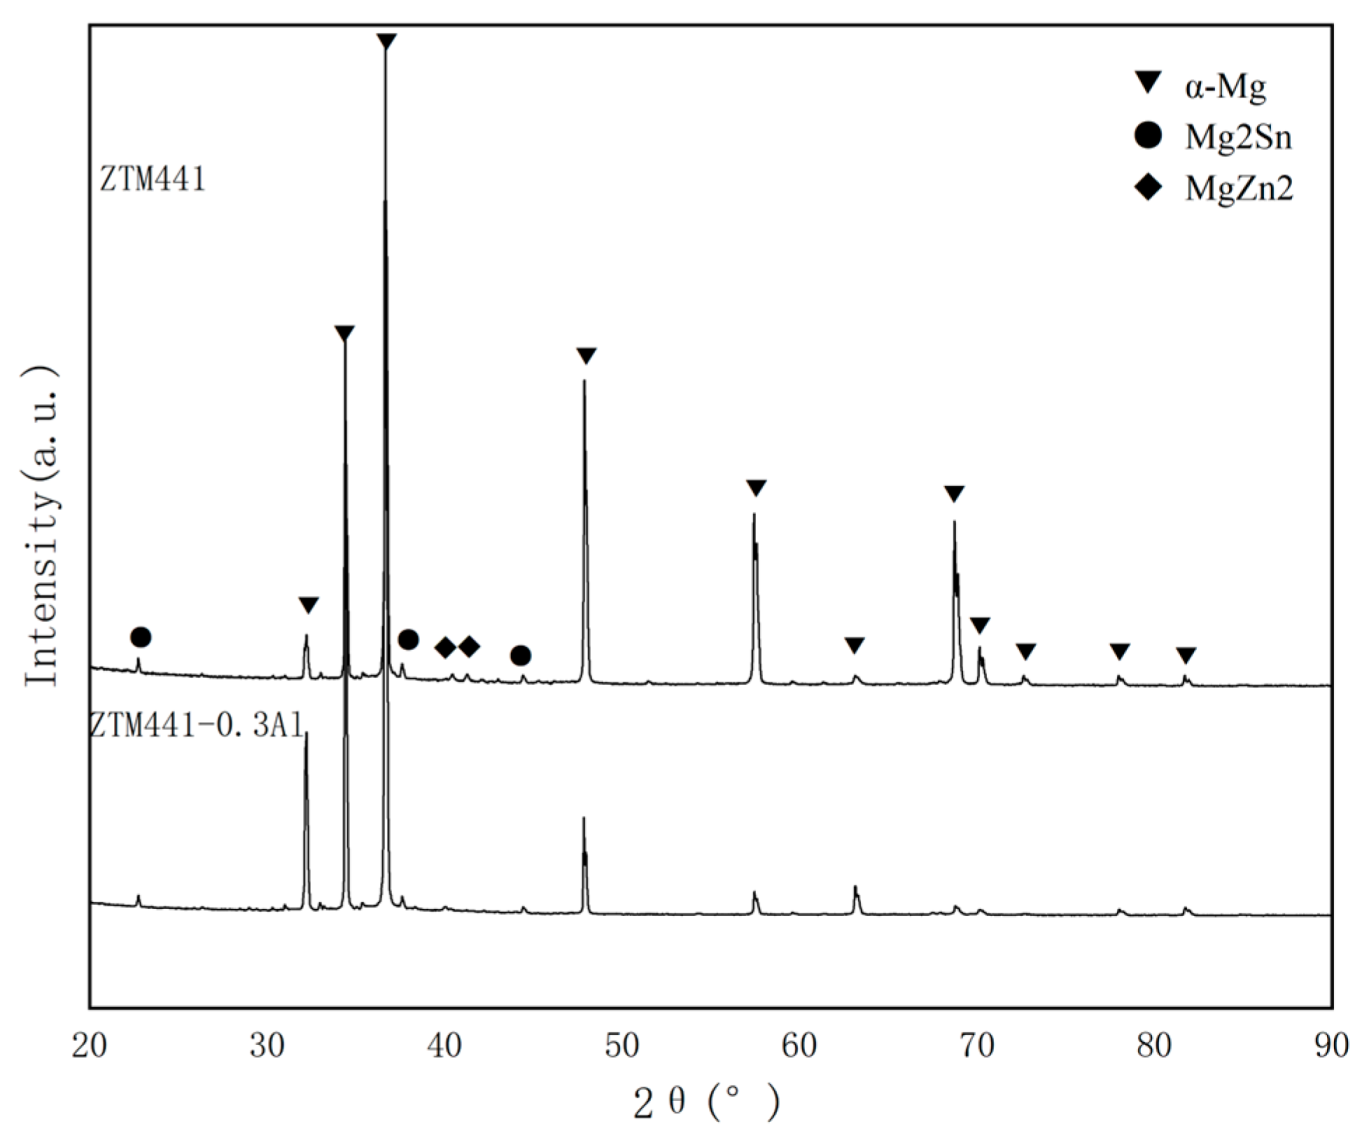
3.1. XRD Results
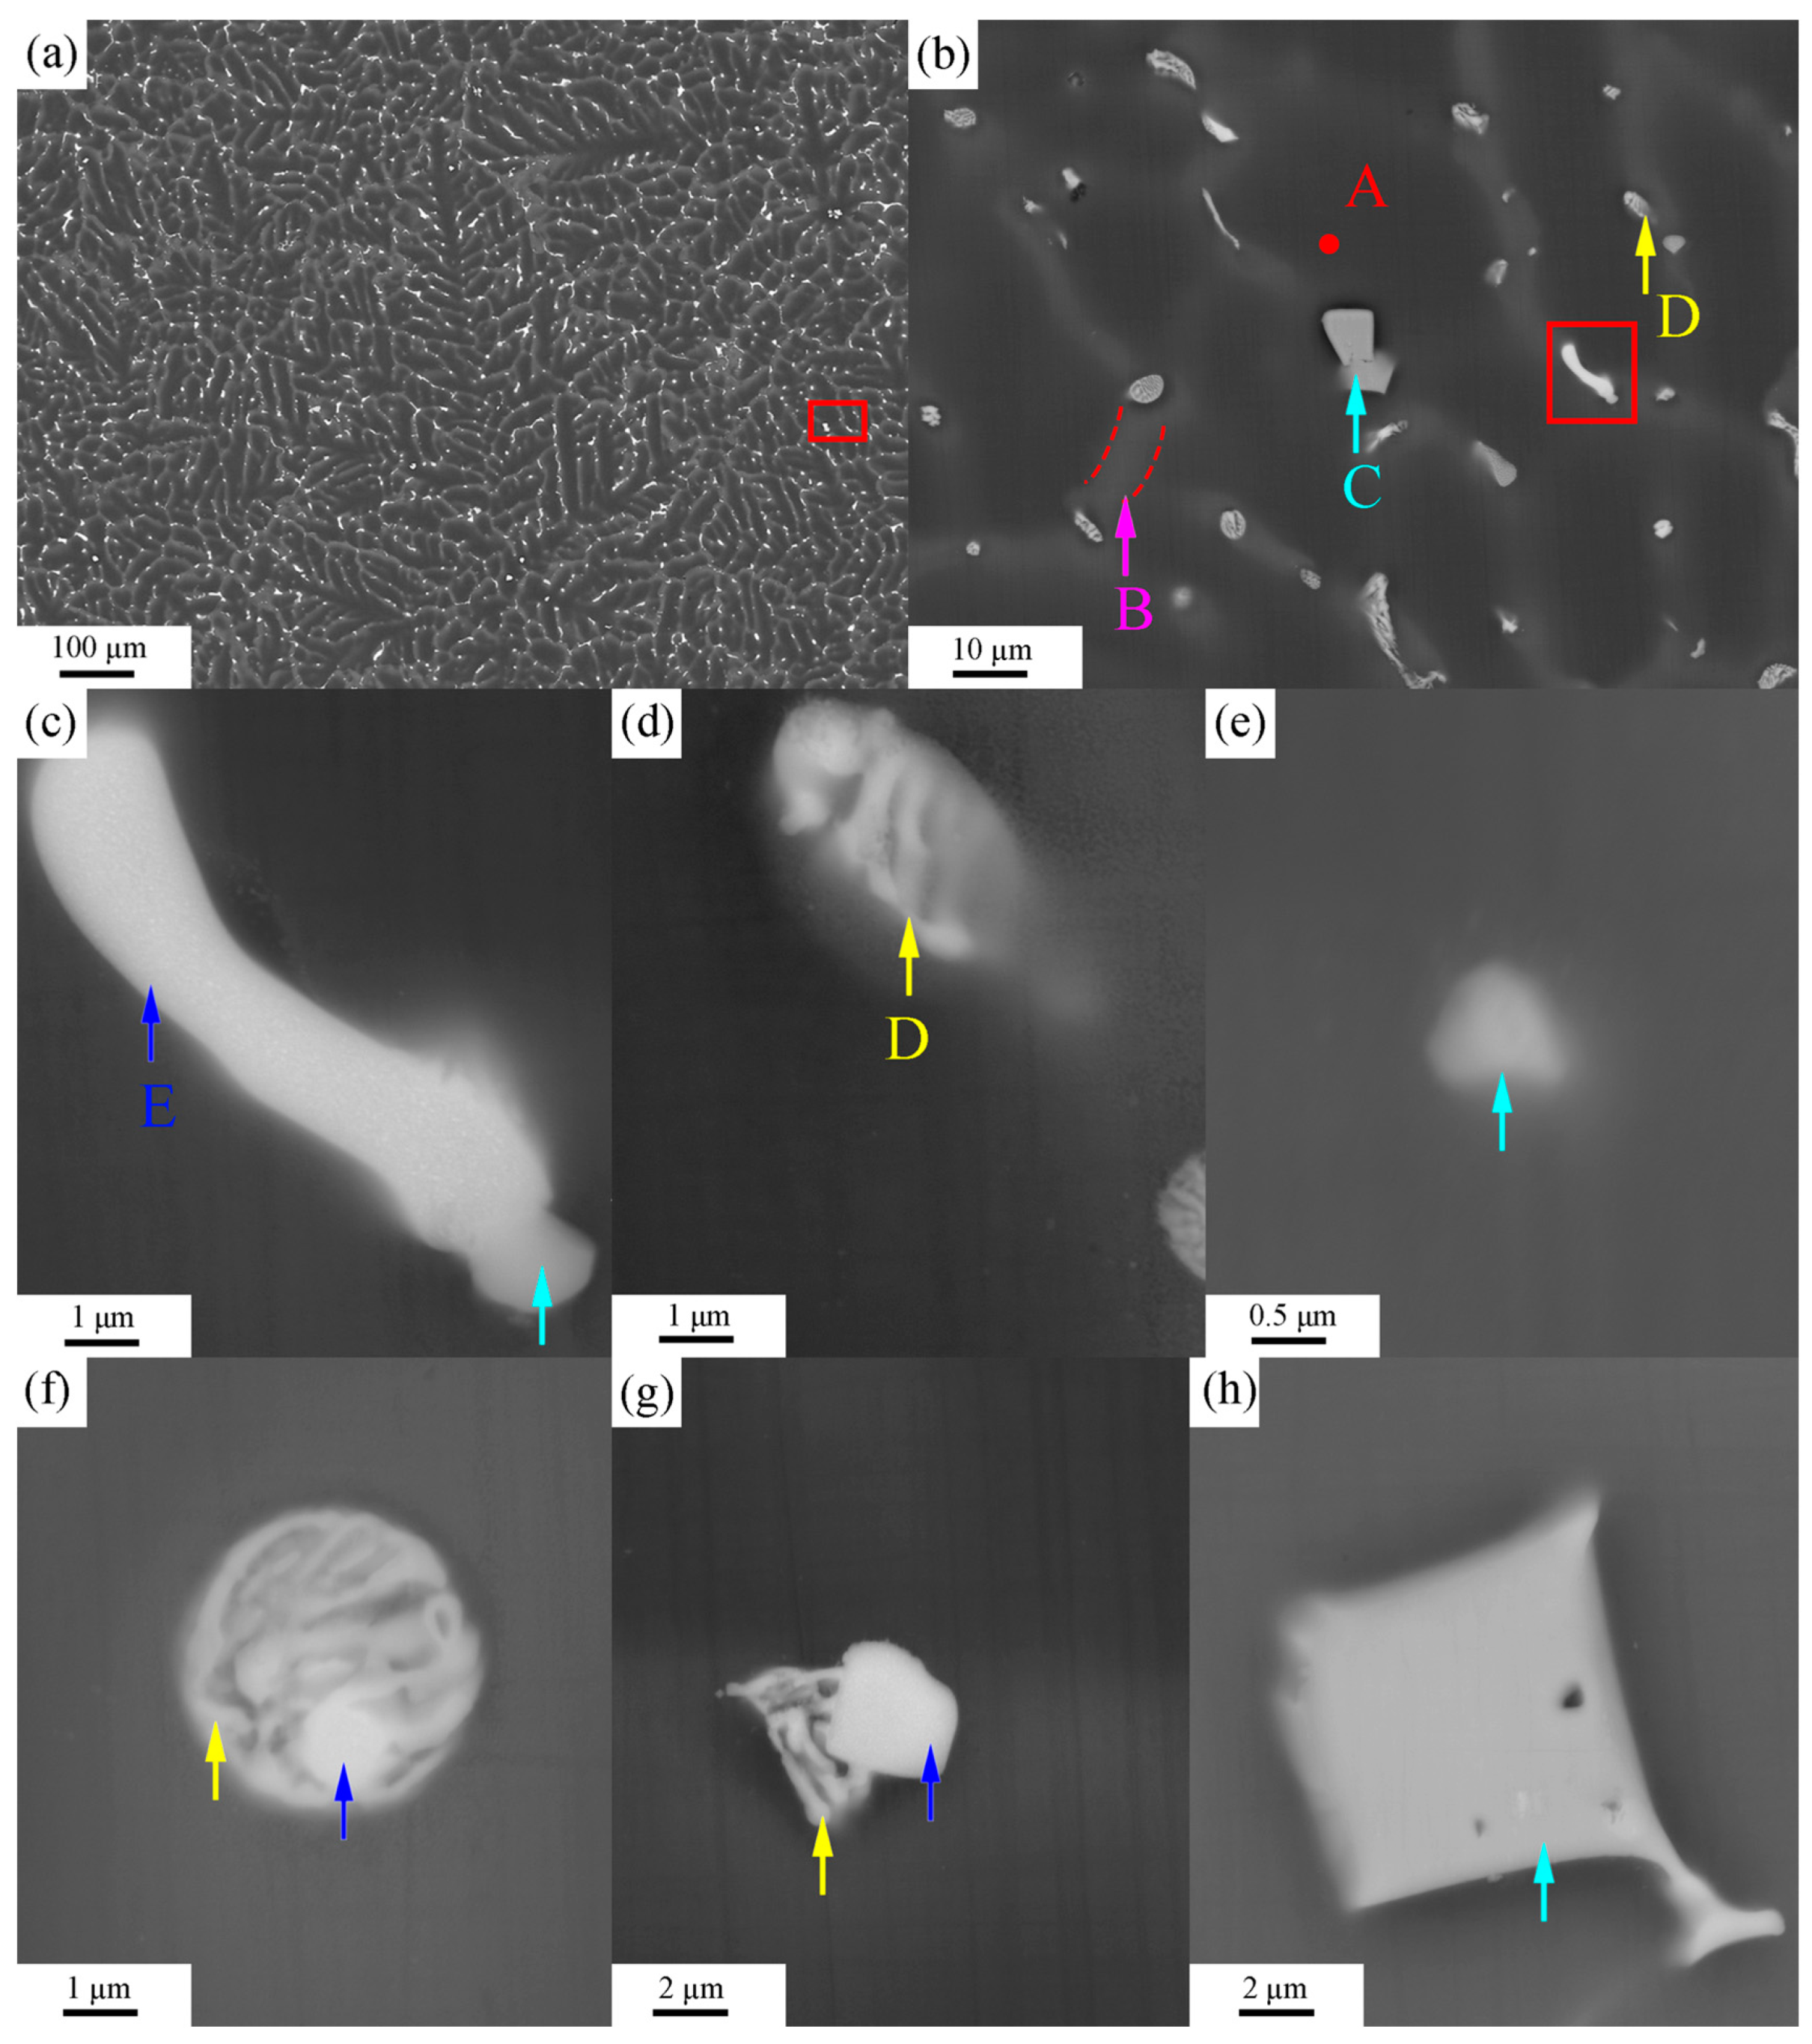
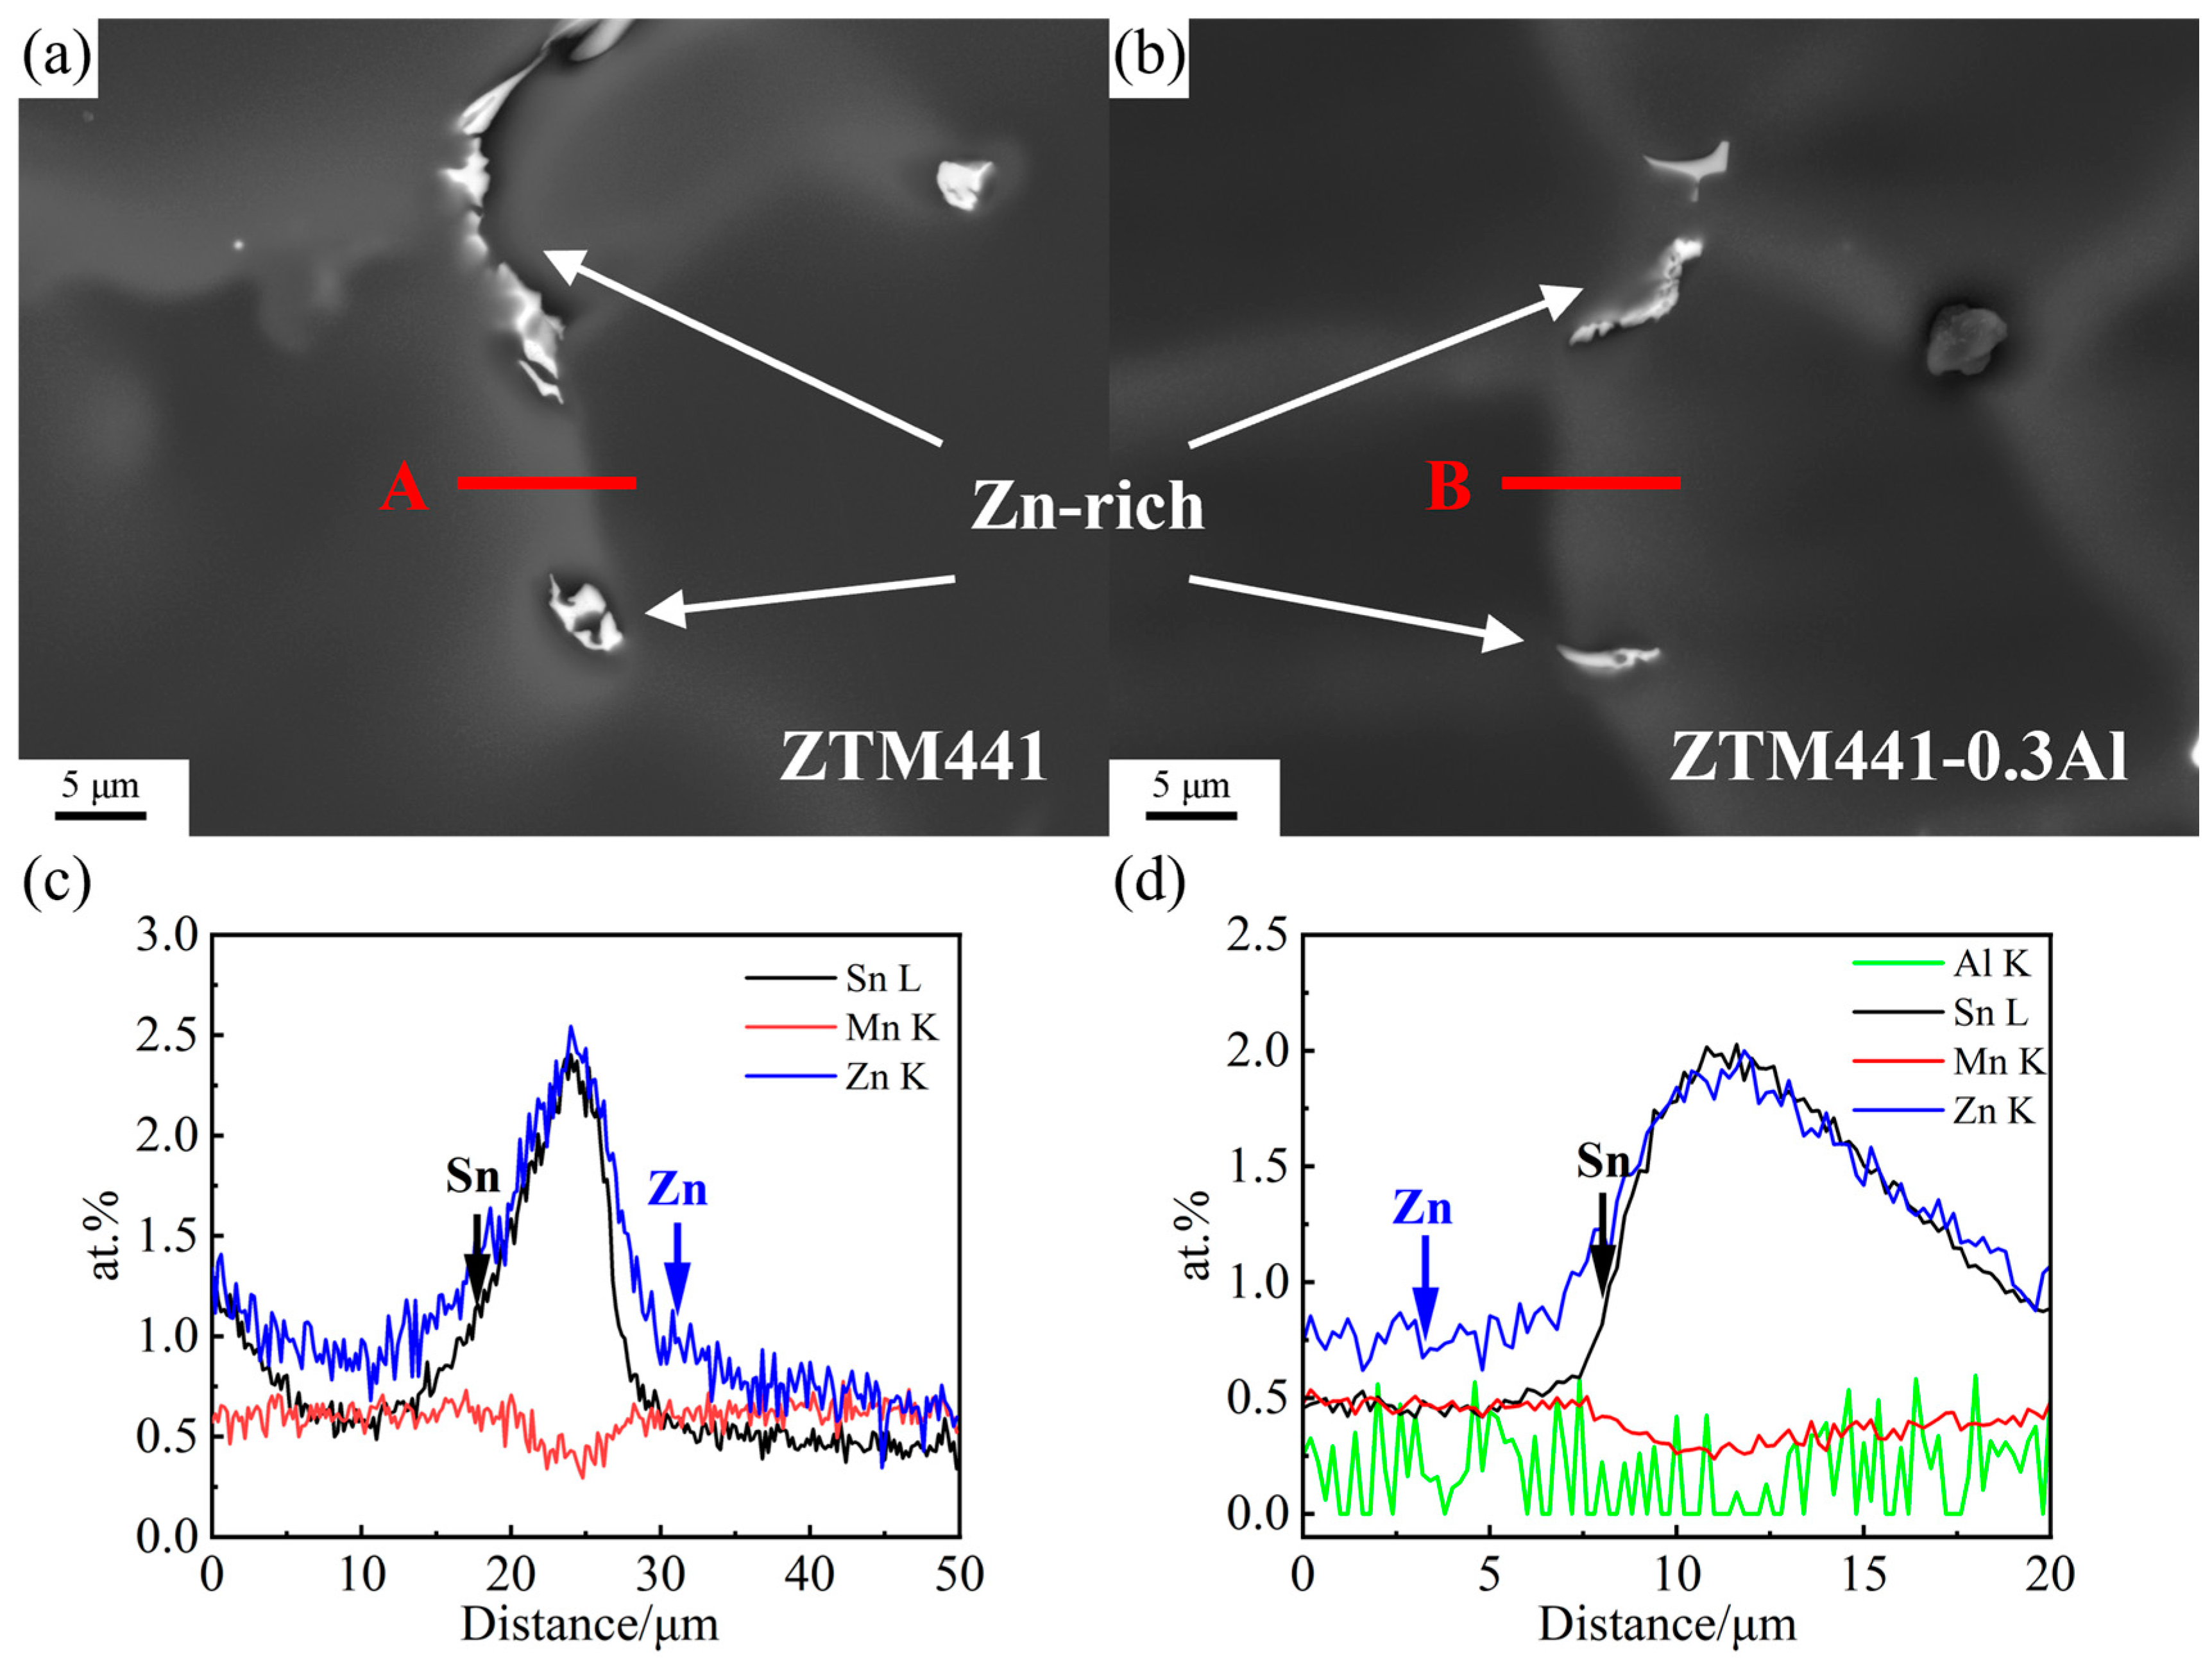
3.2. SEM Results
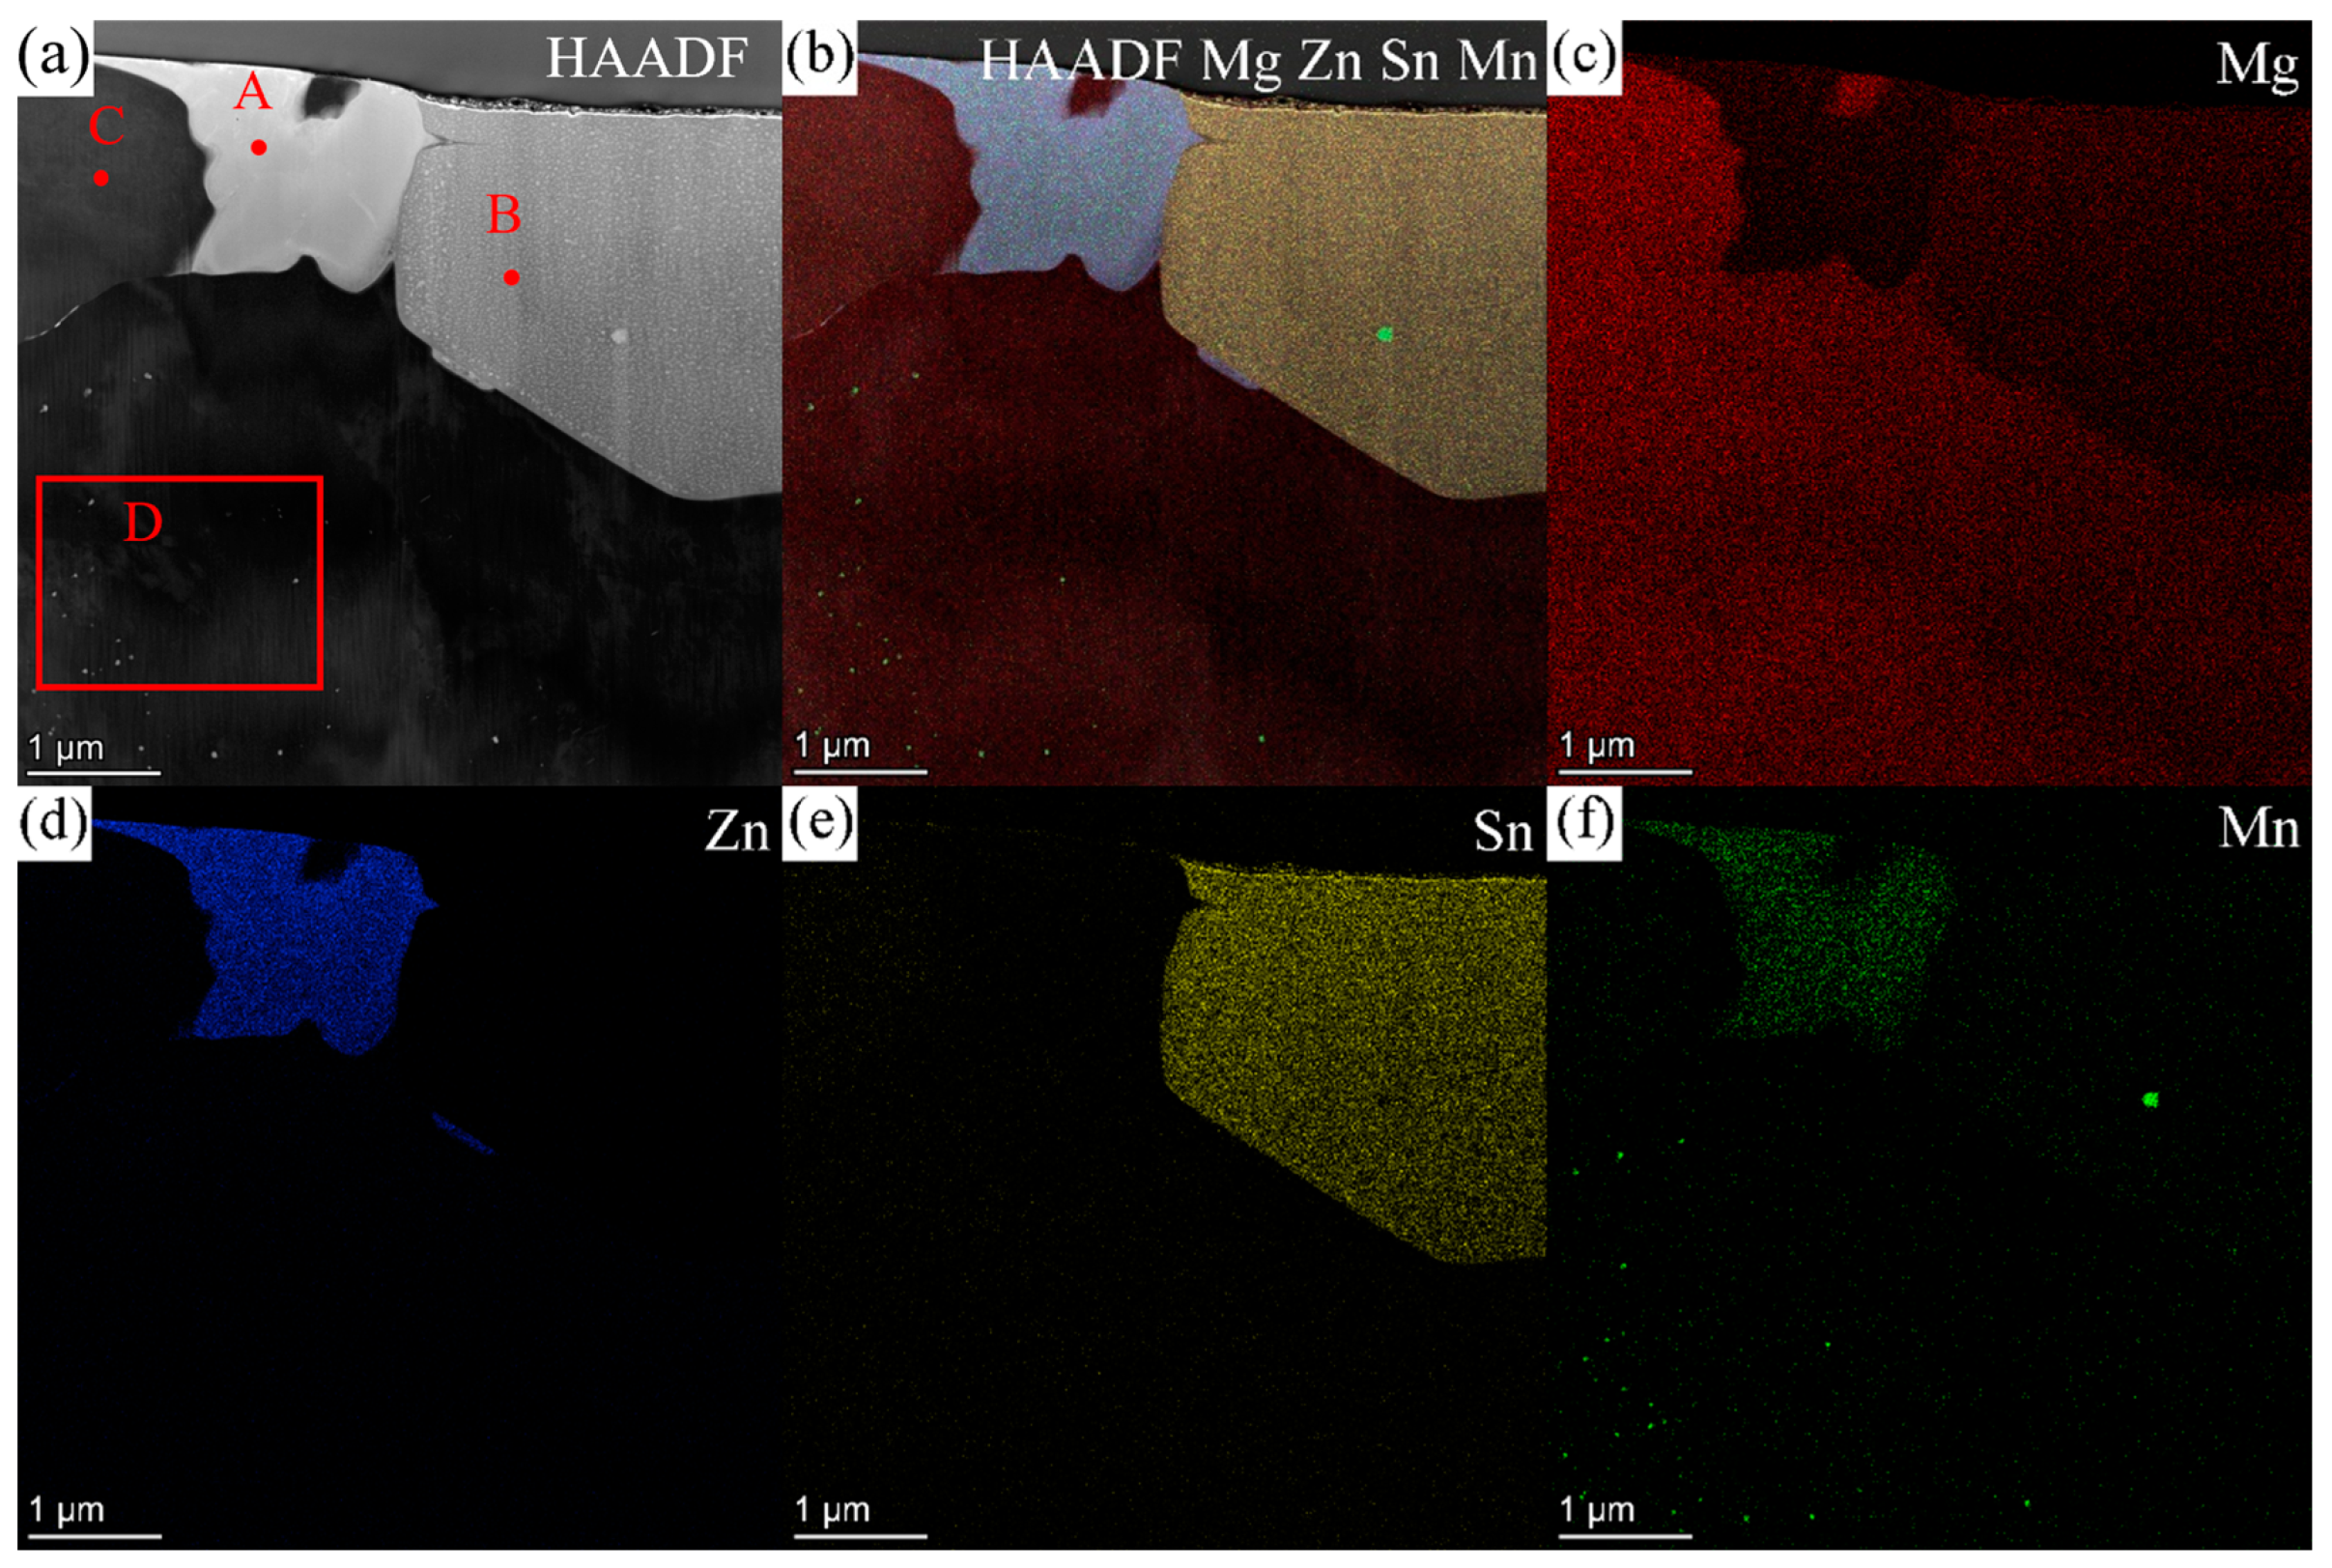
3.3. TEM Results
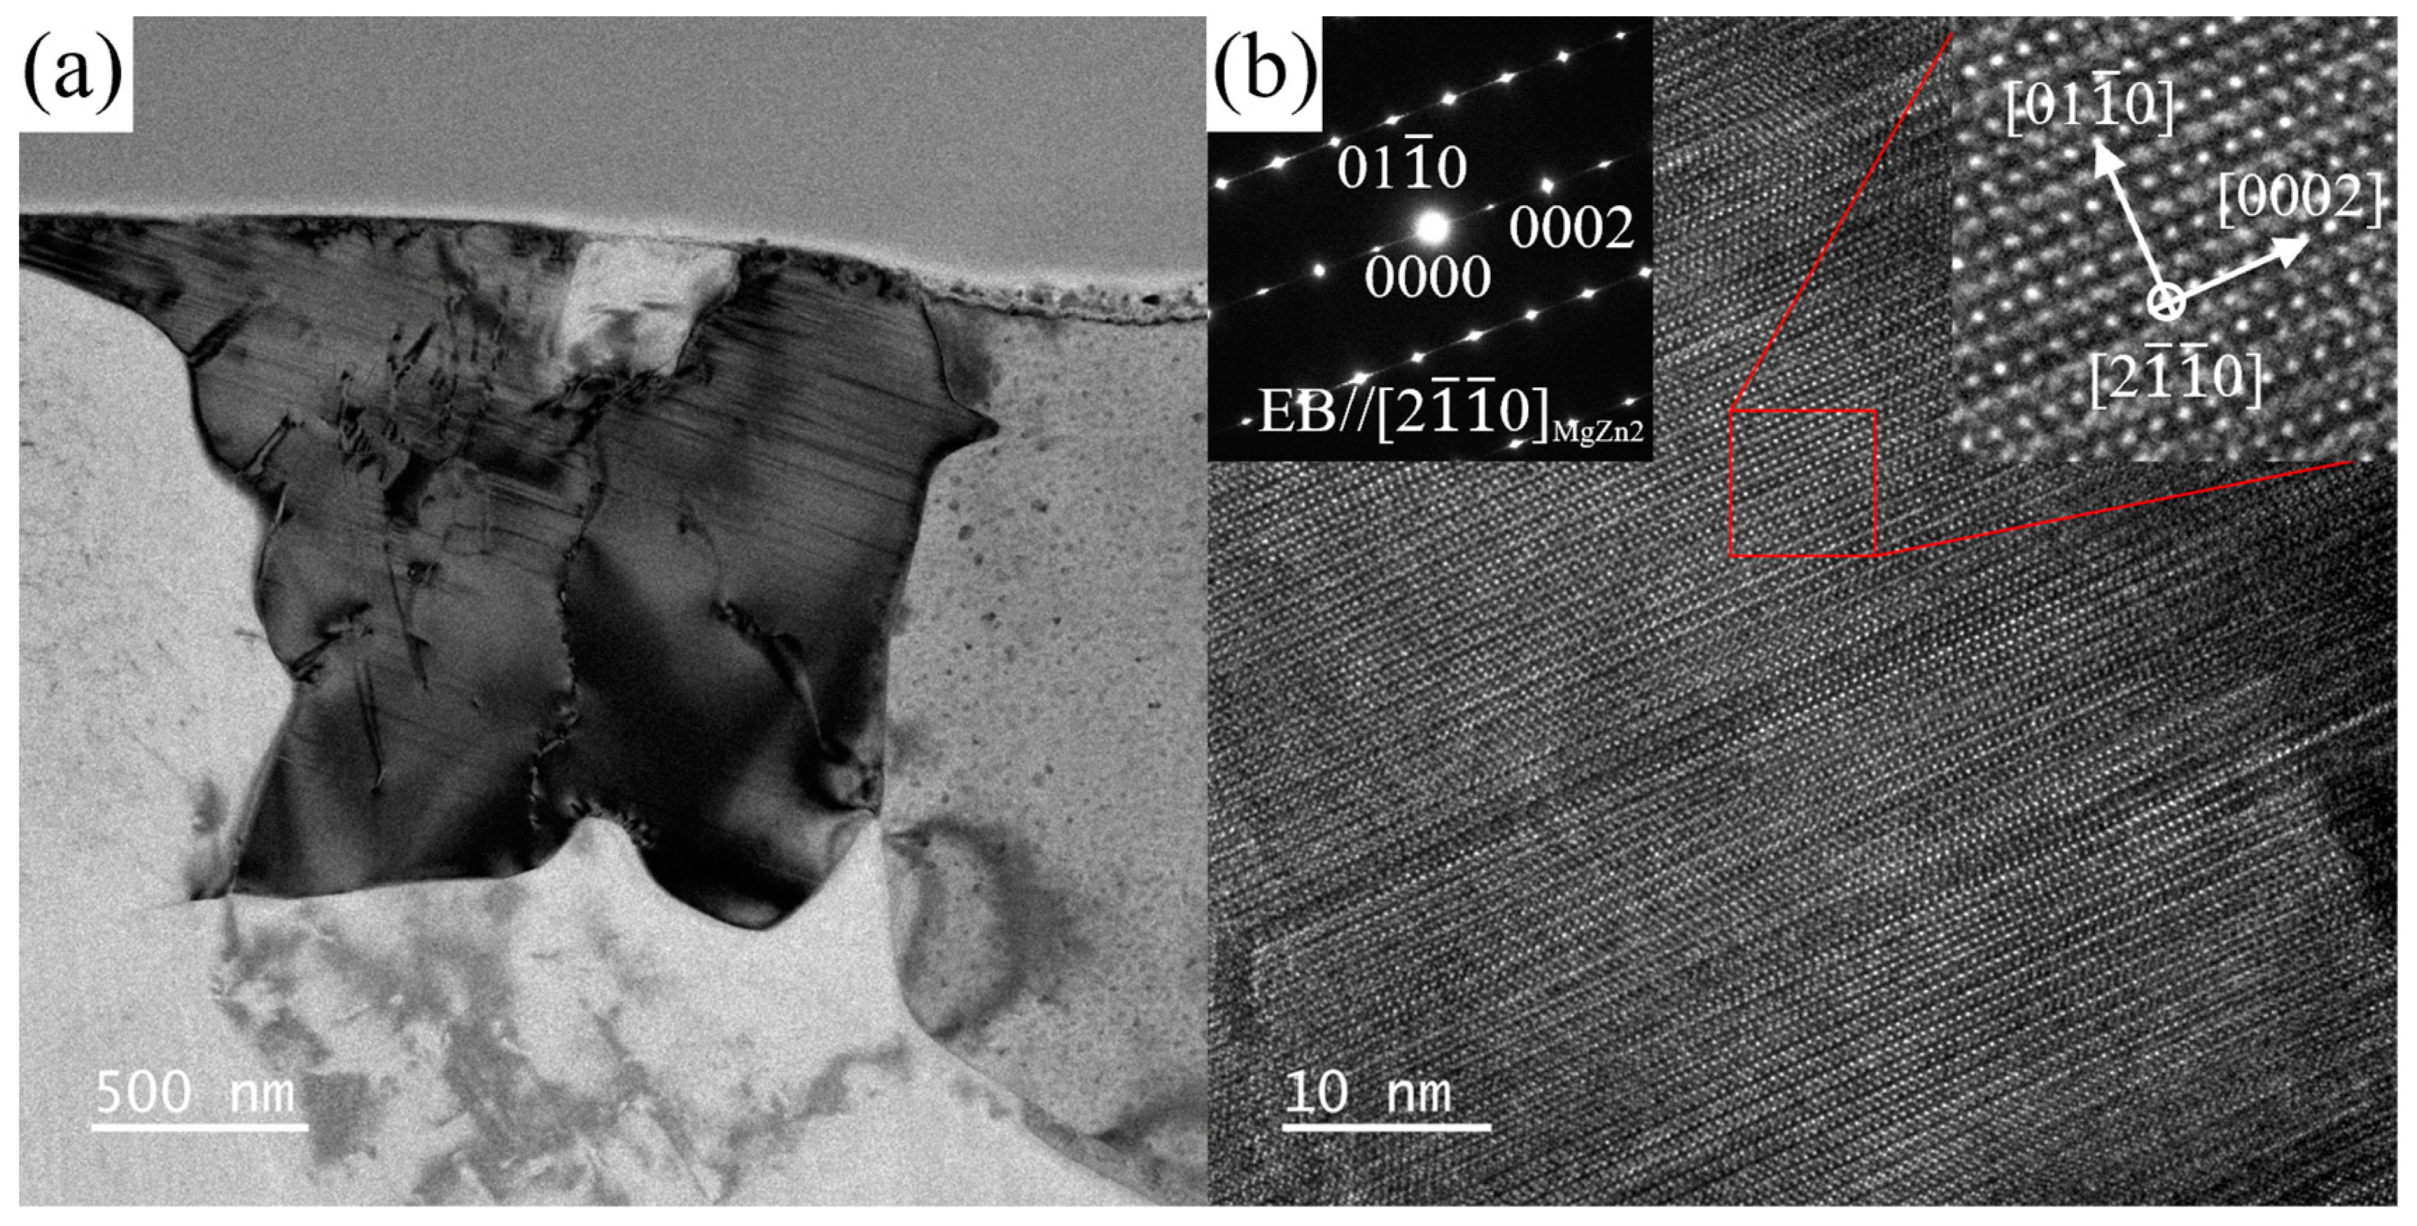
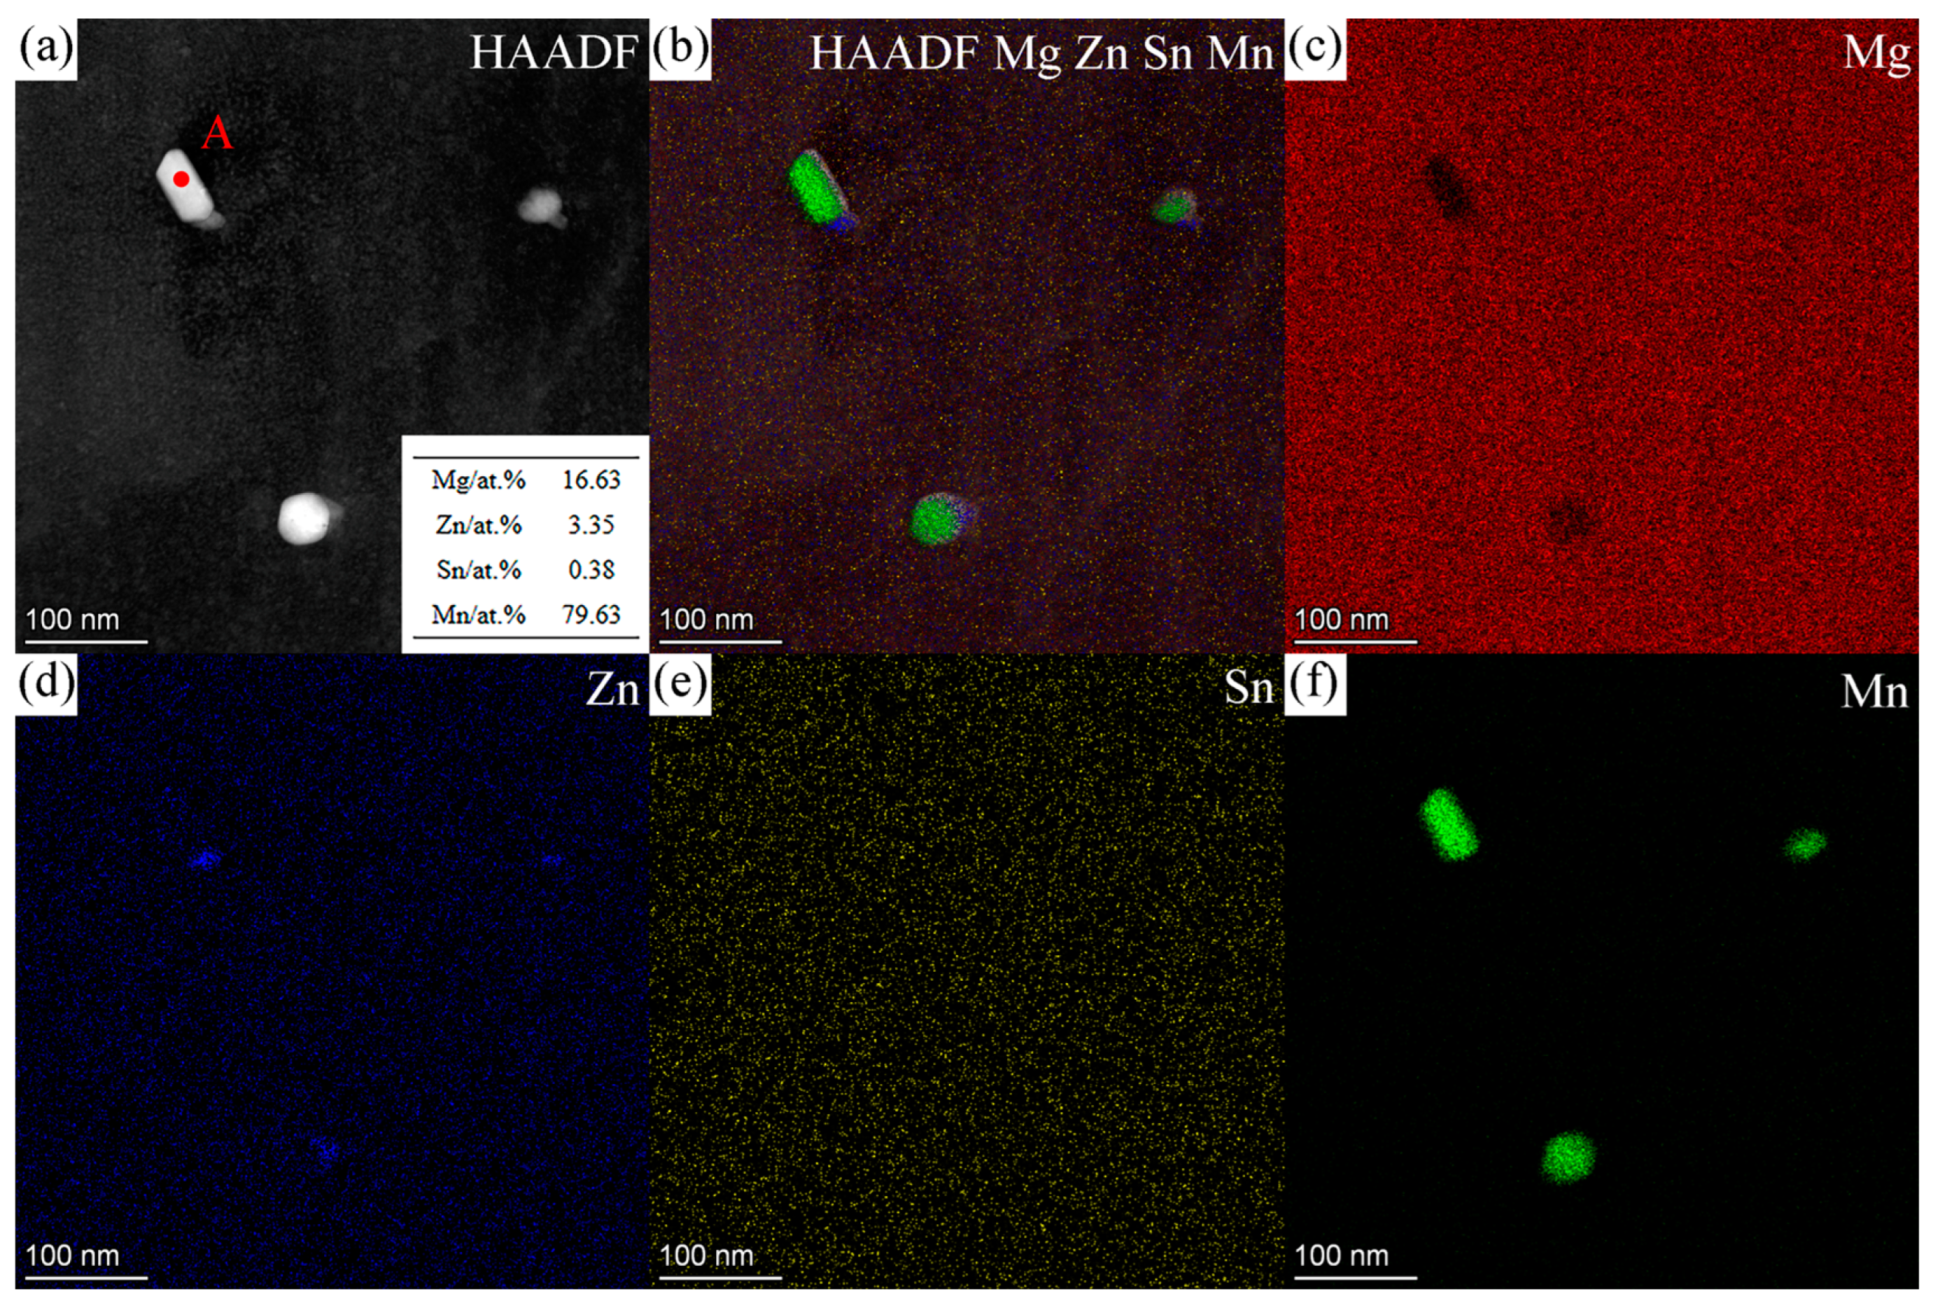
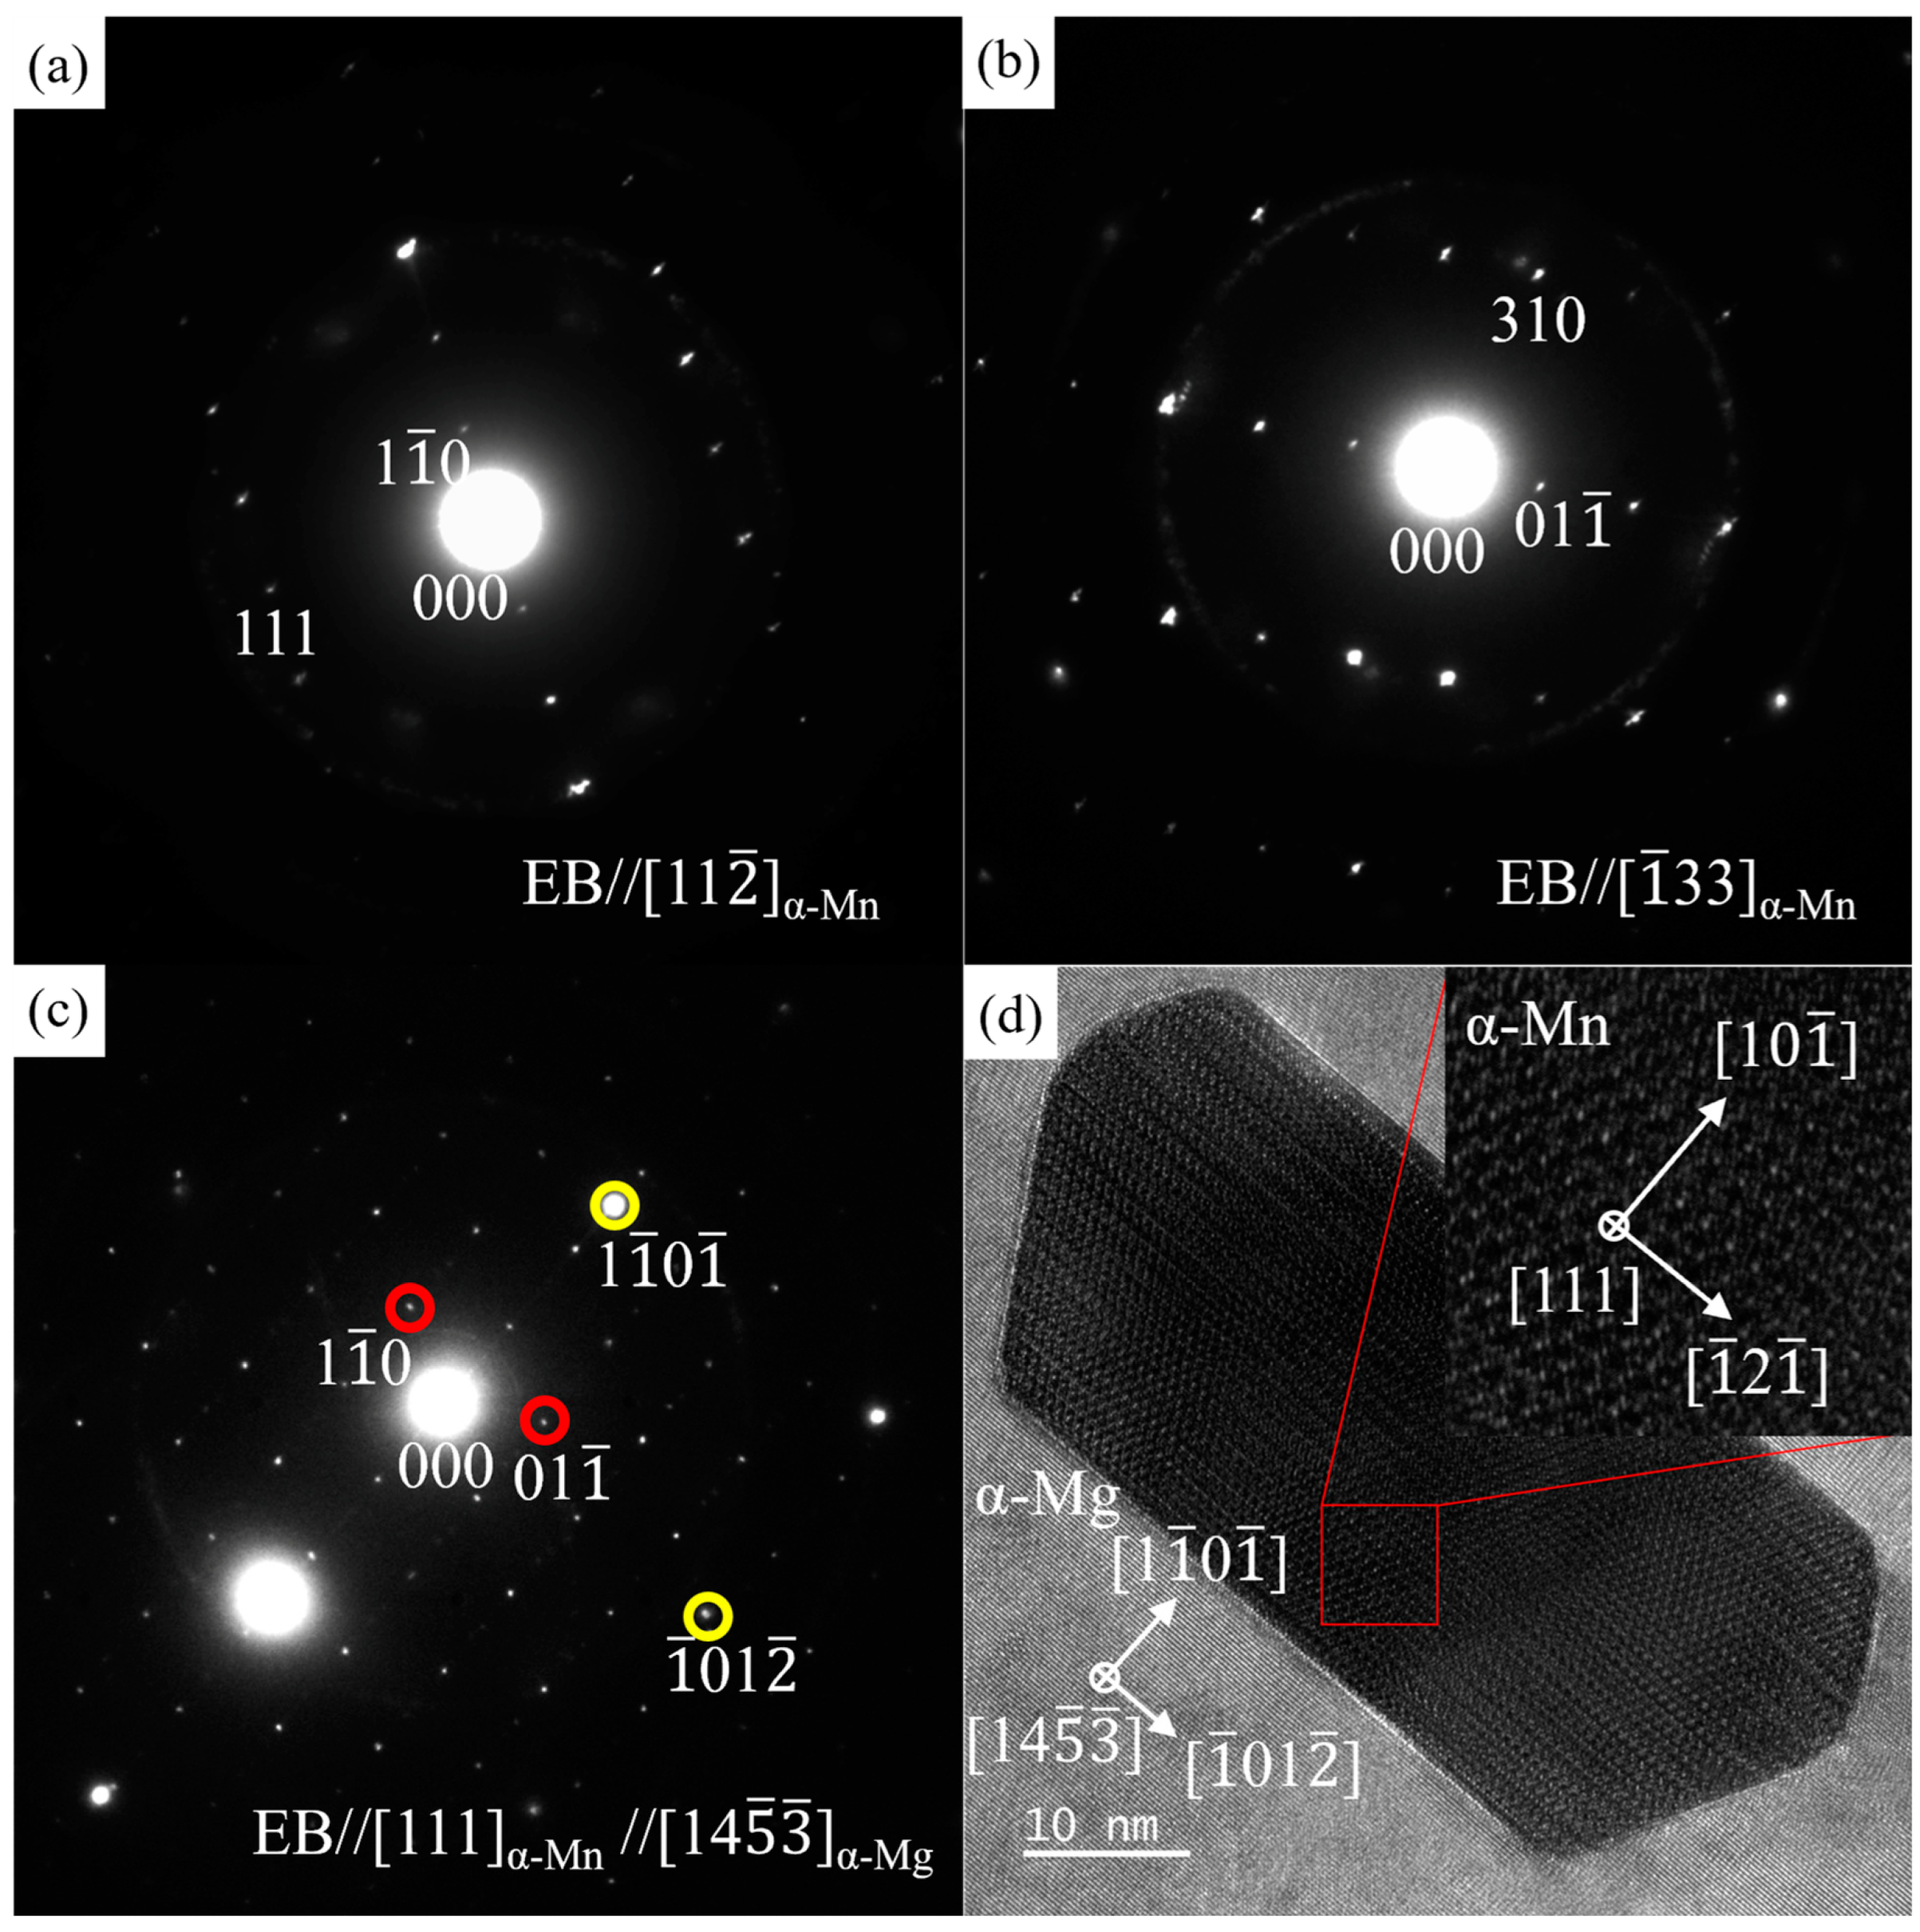
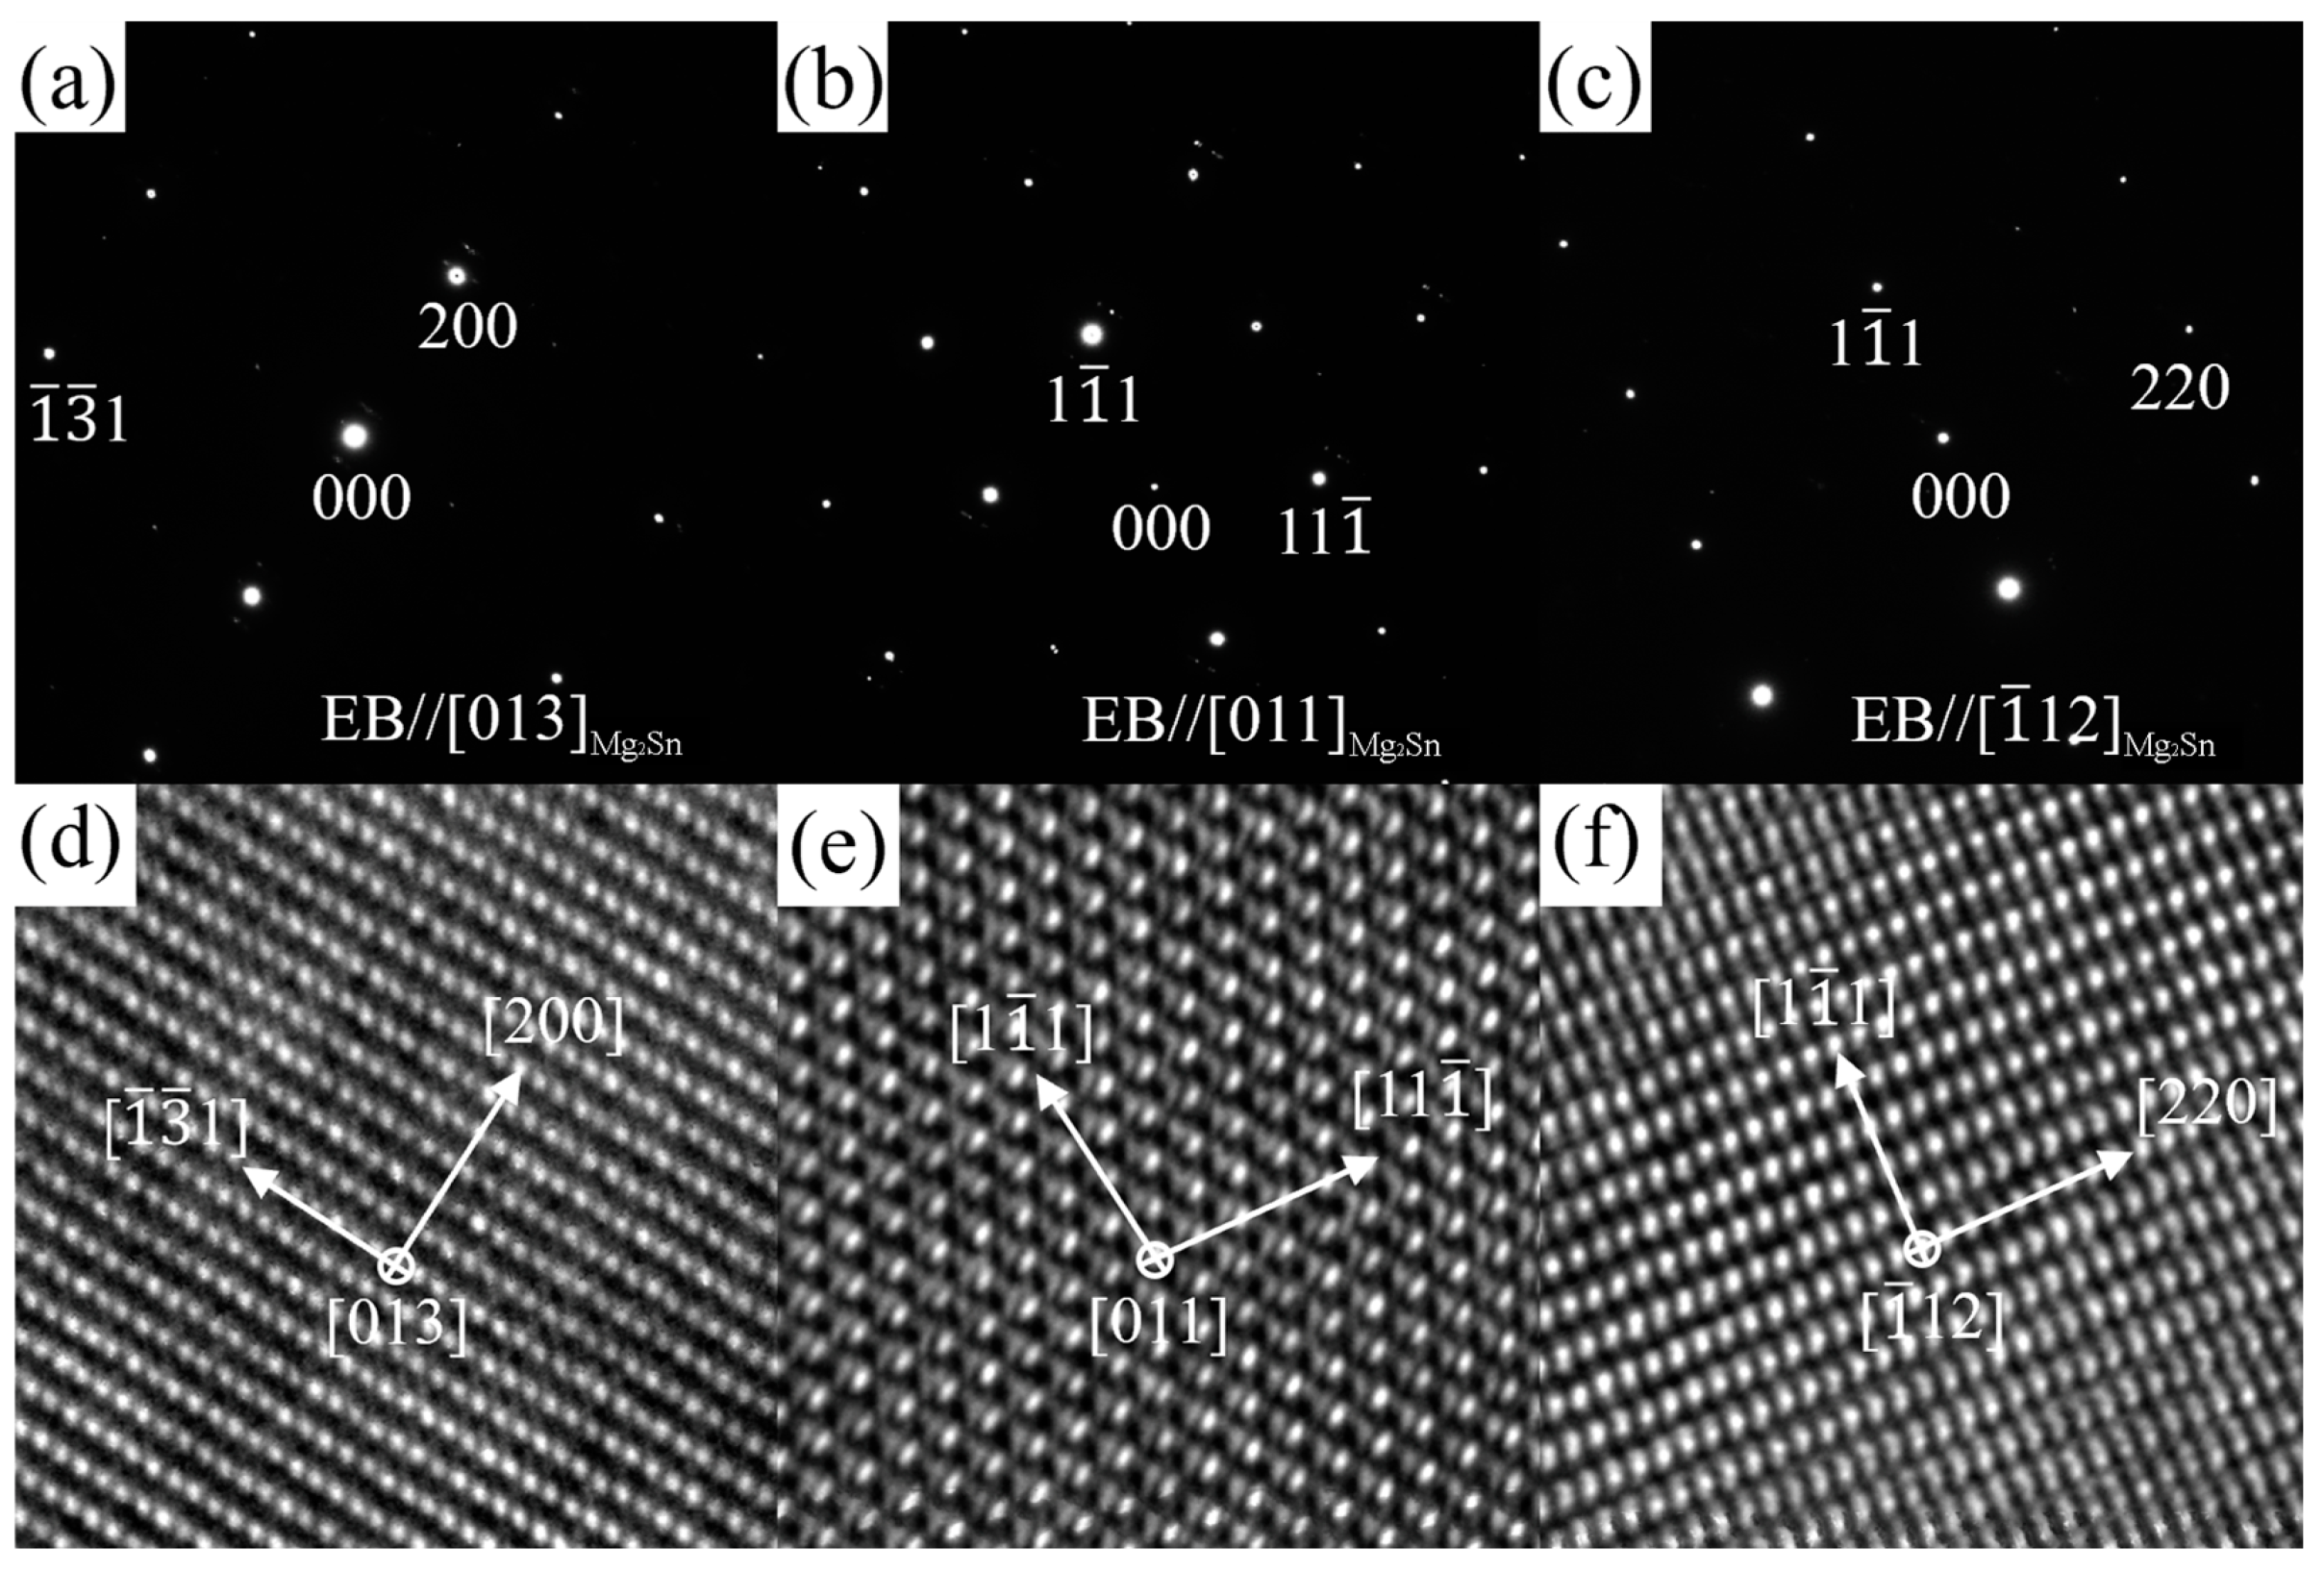
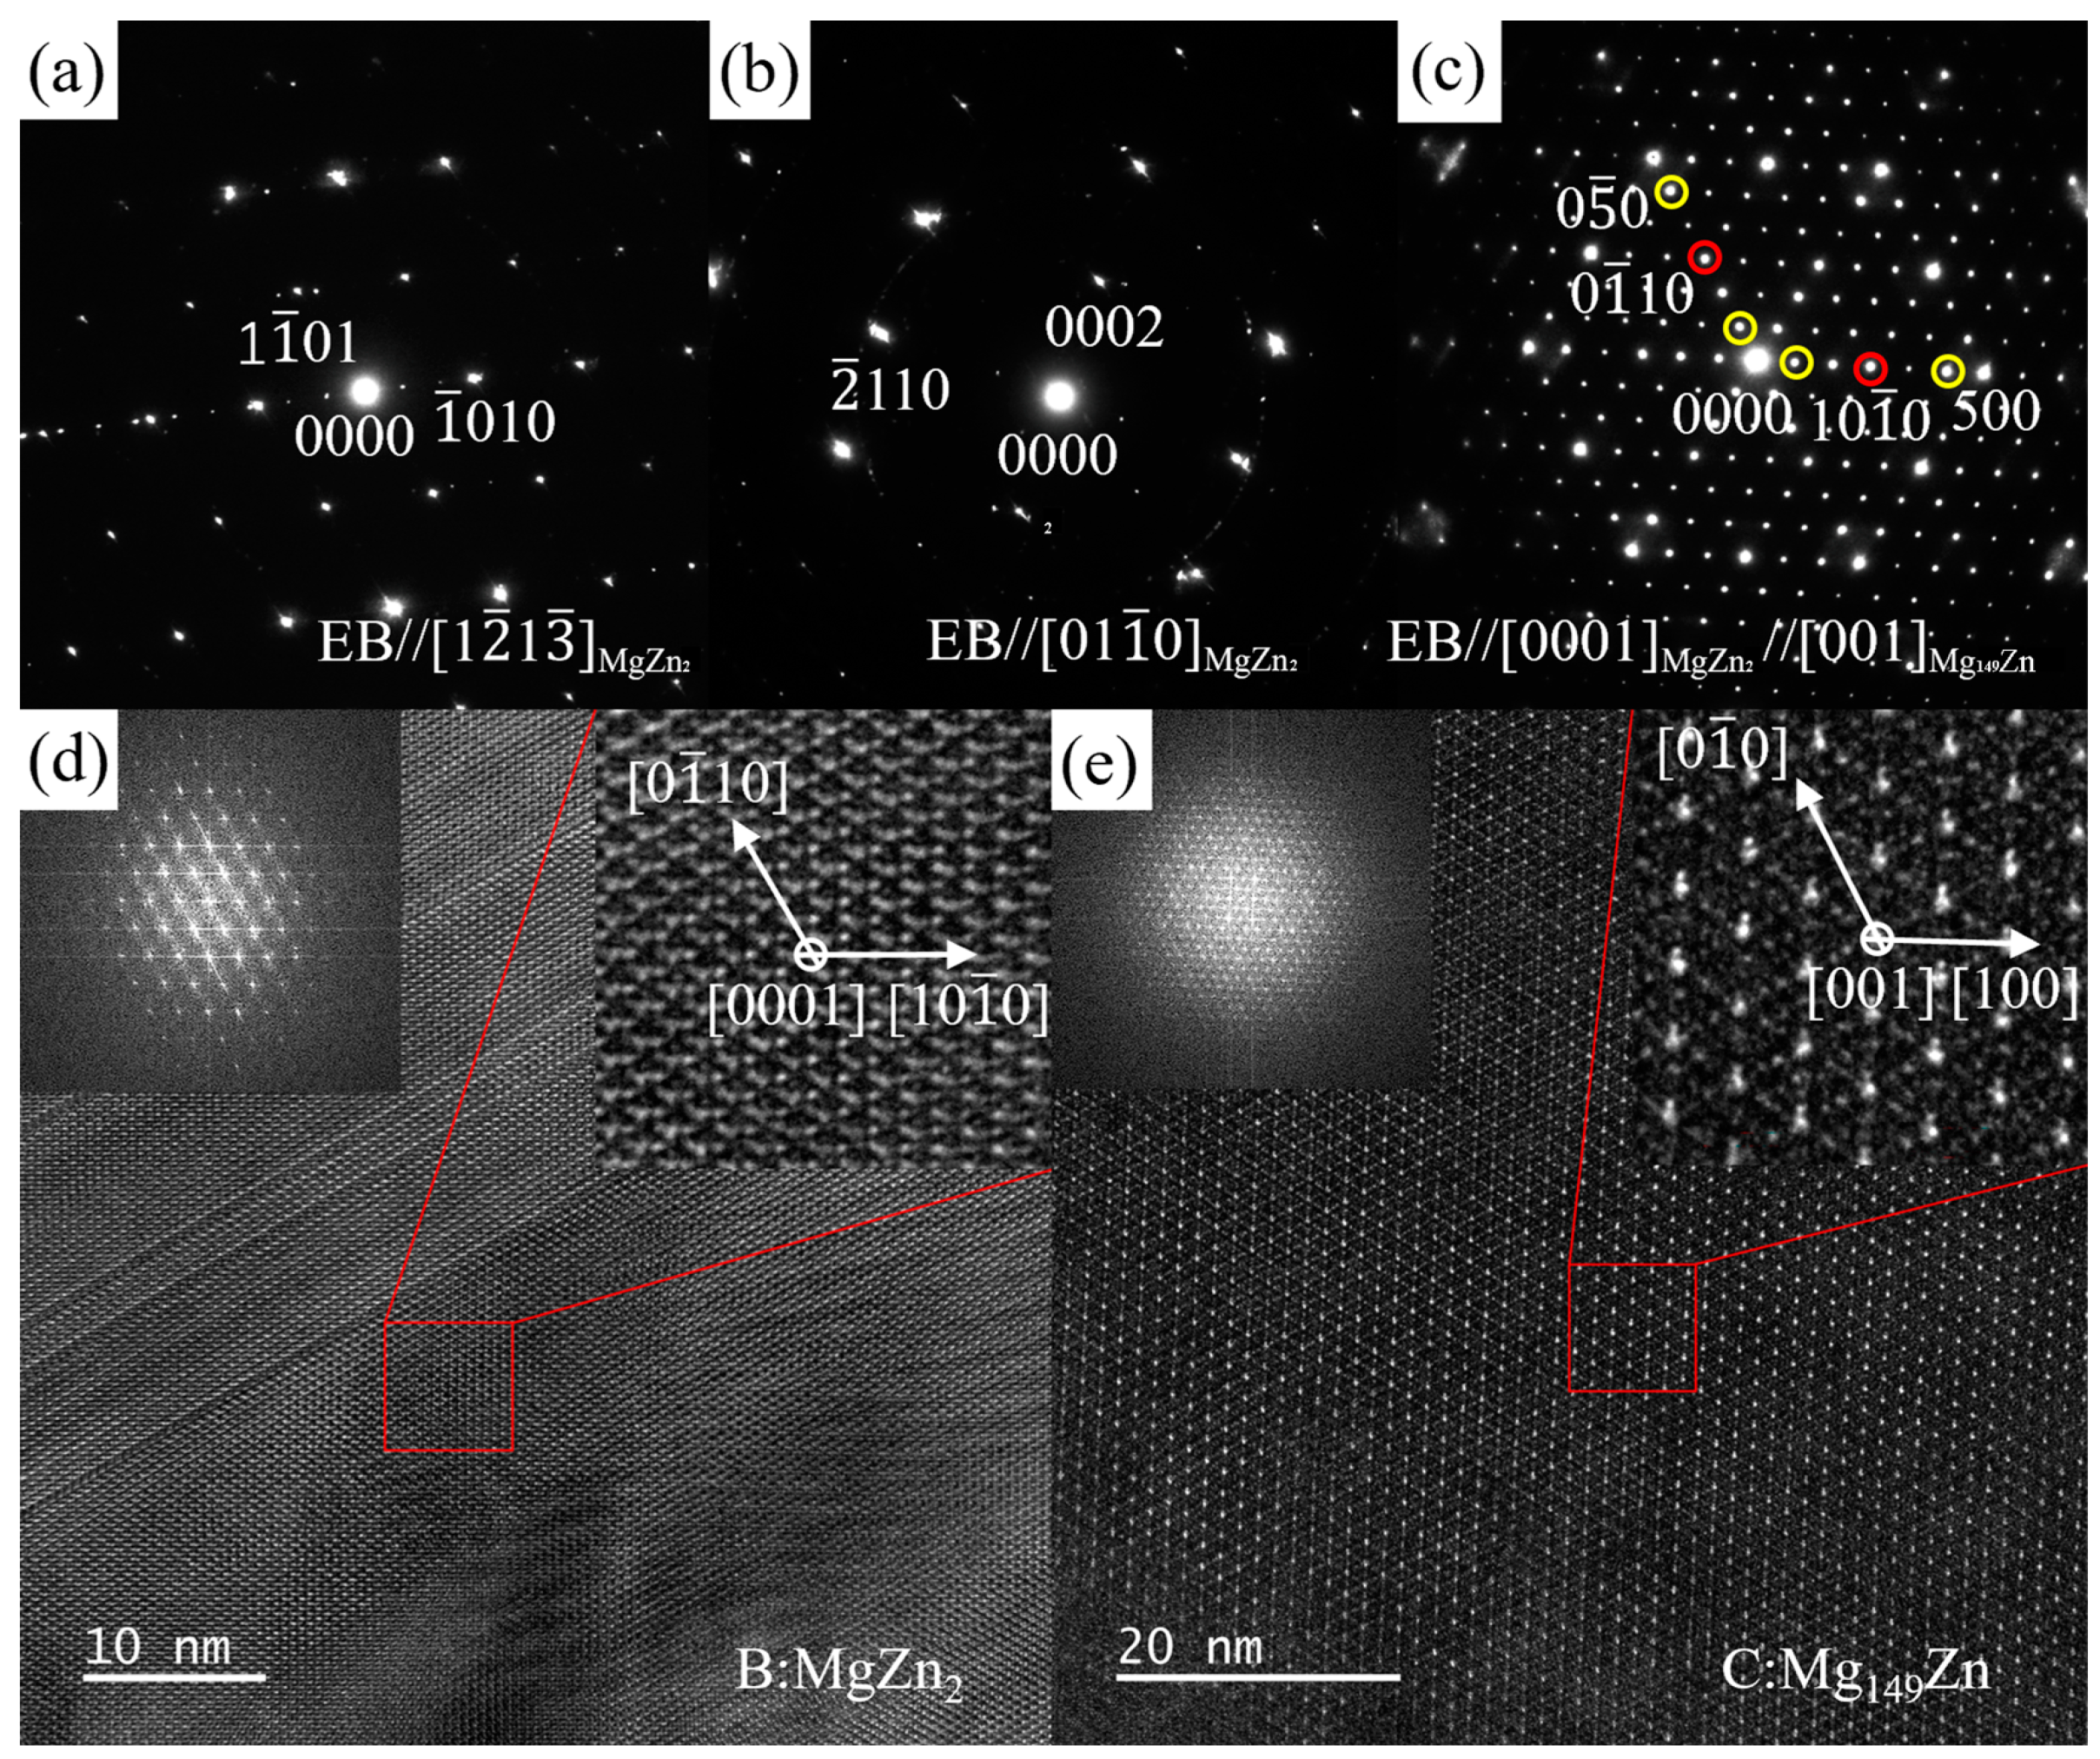
3.3.1. ZTM441
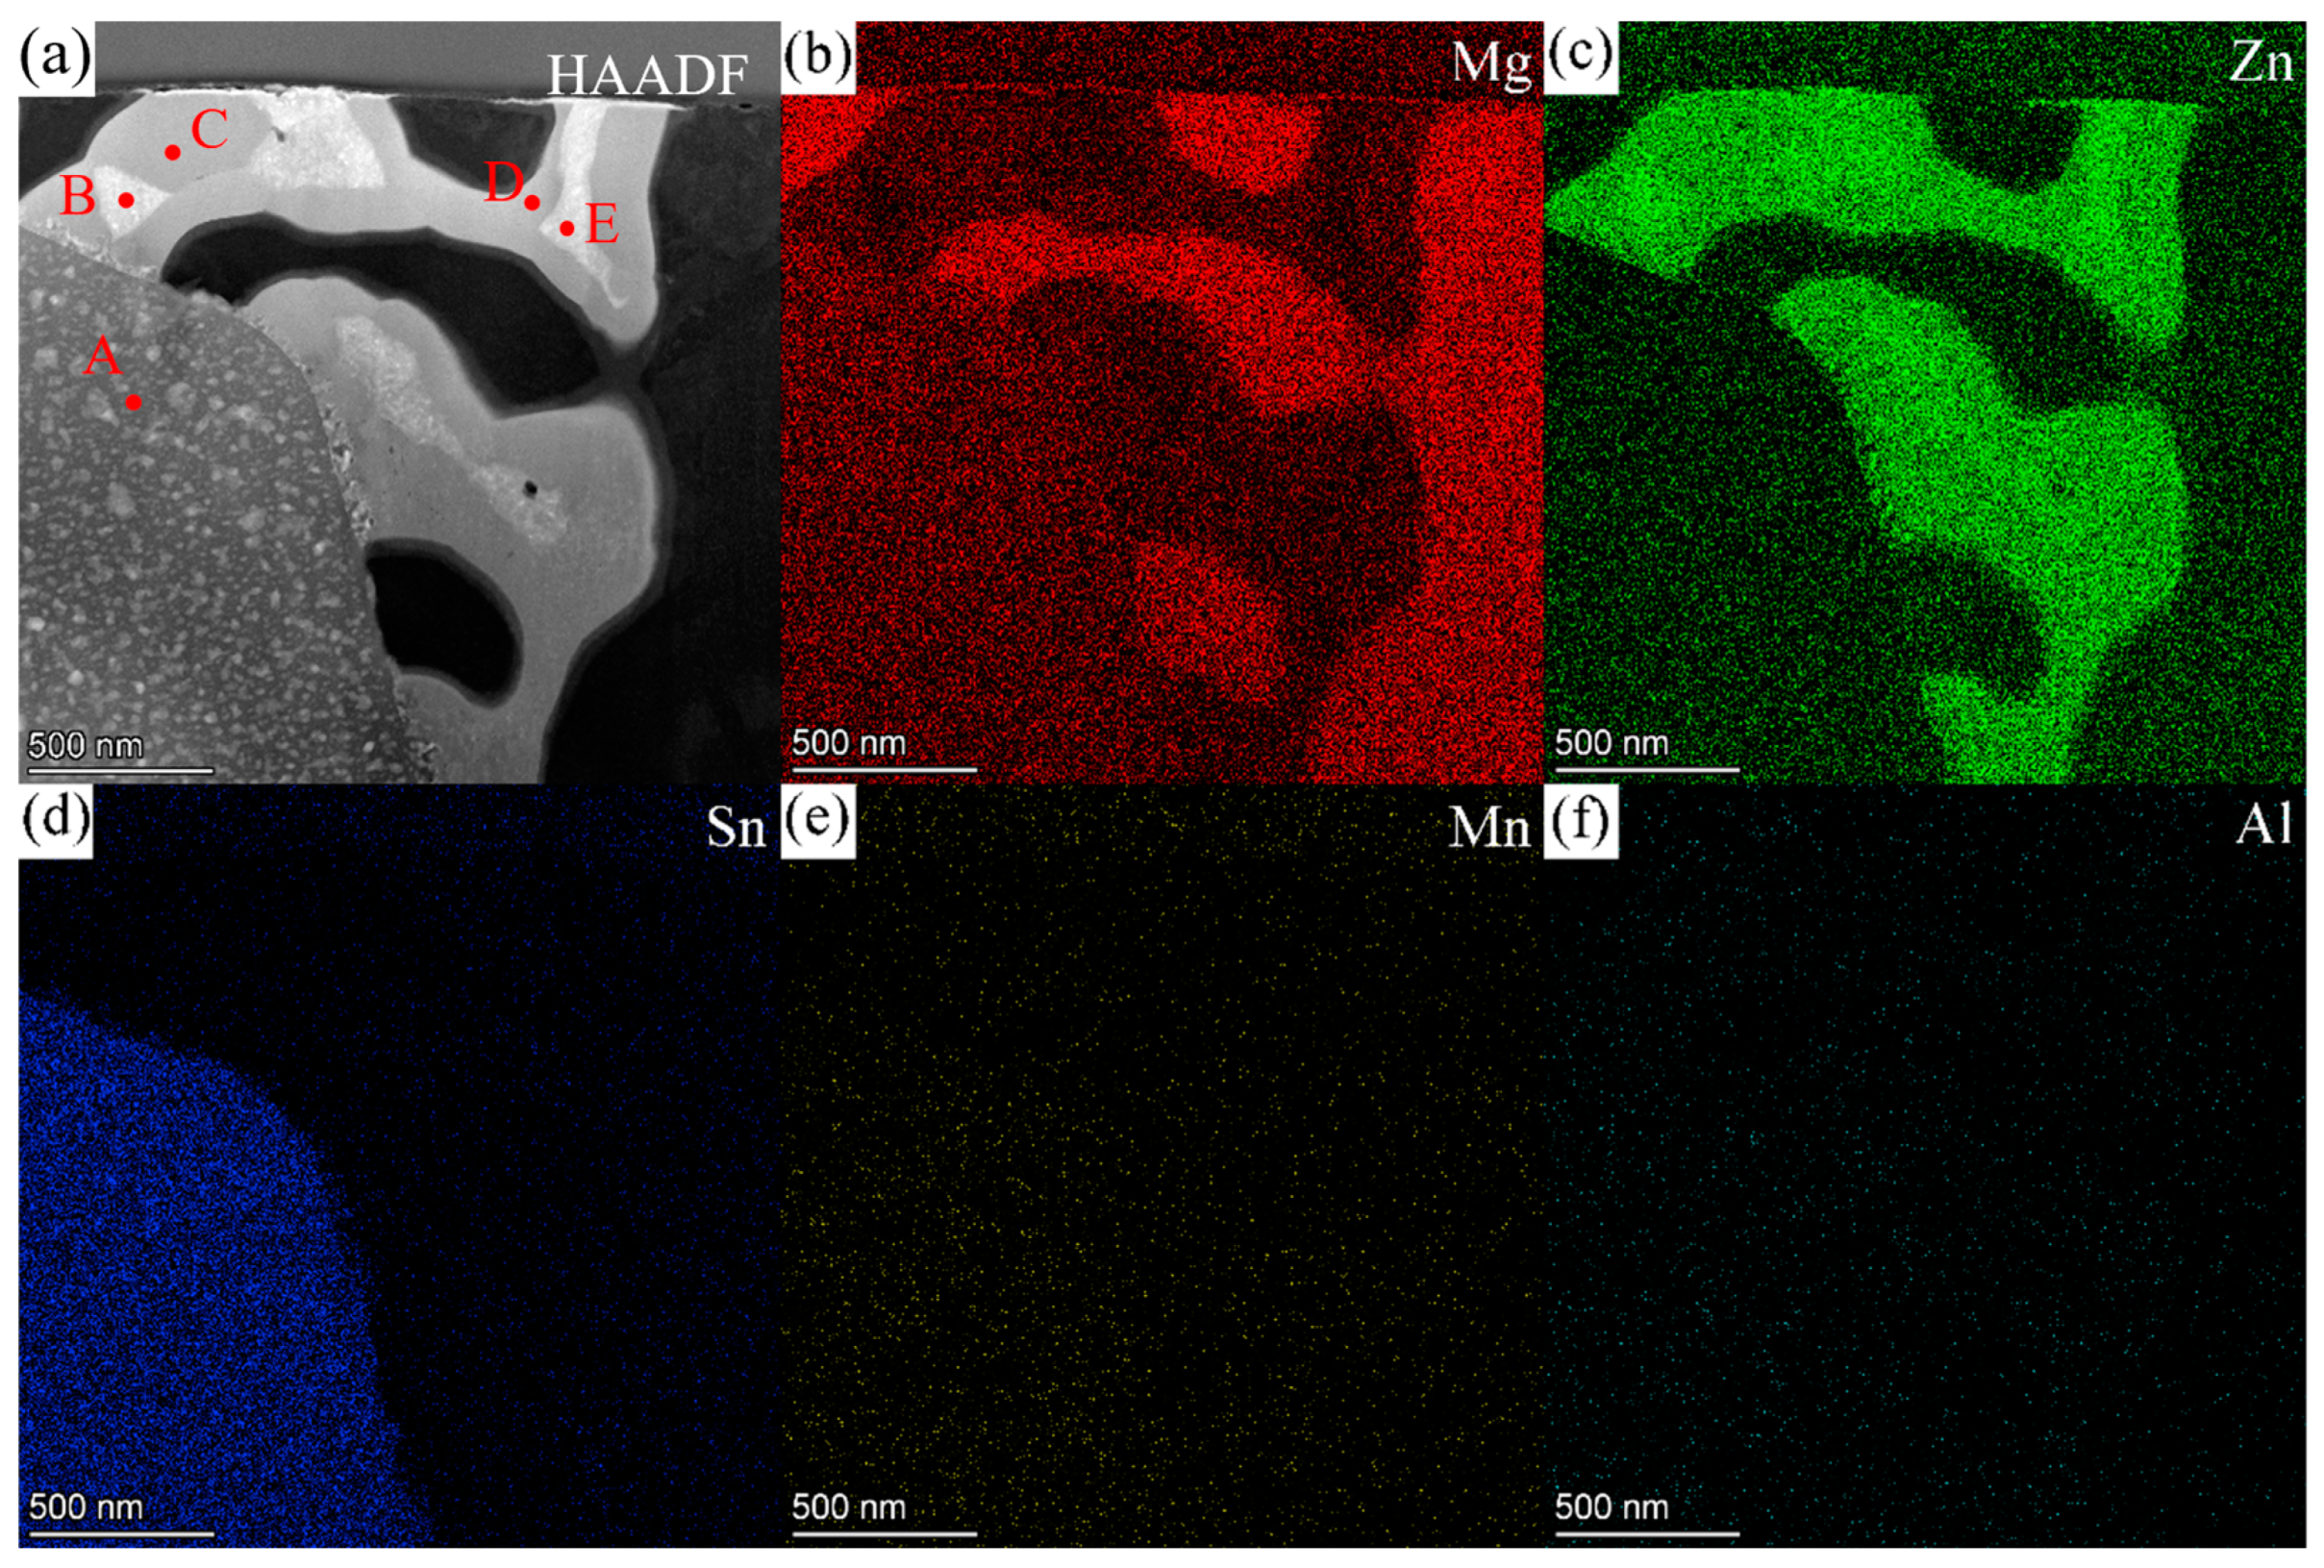
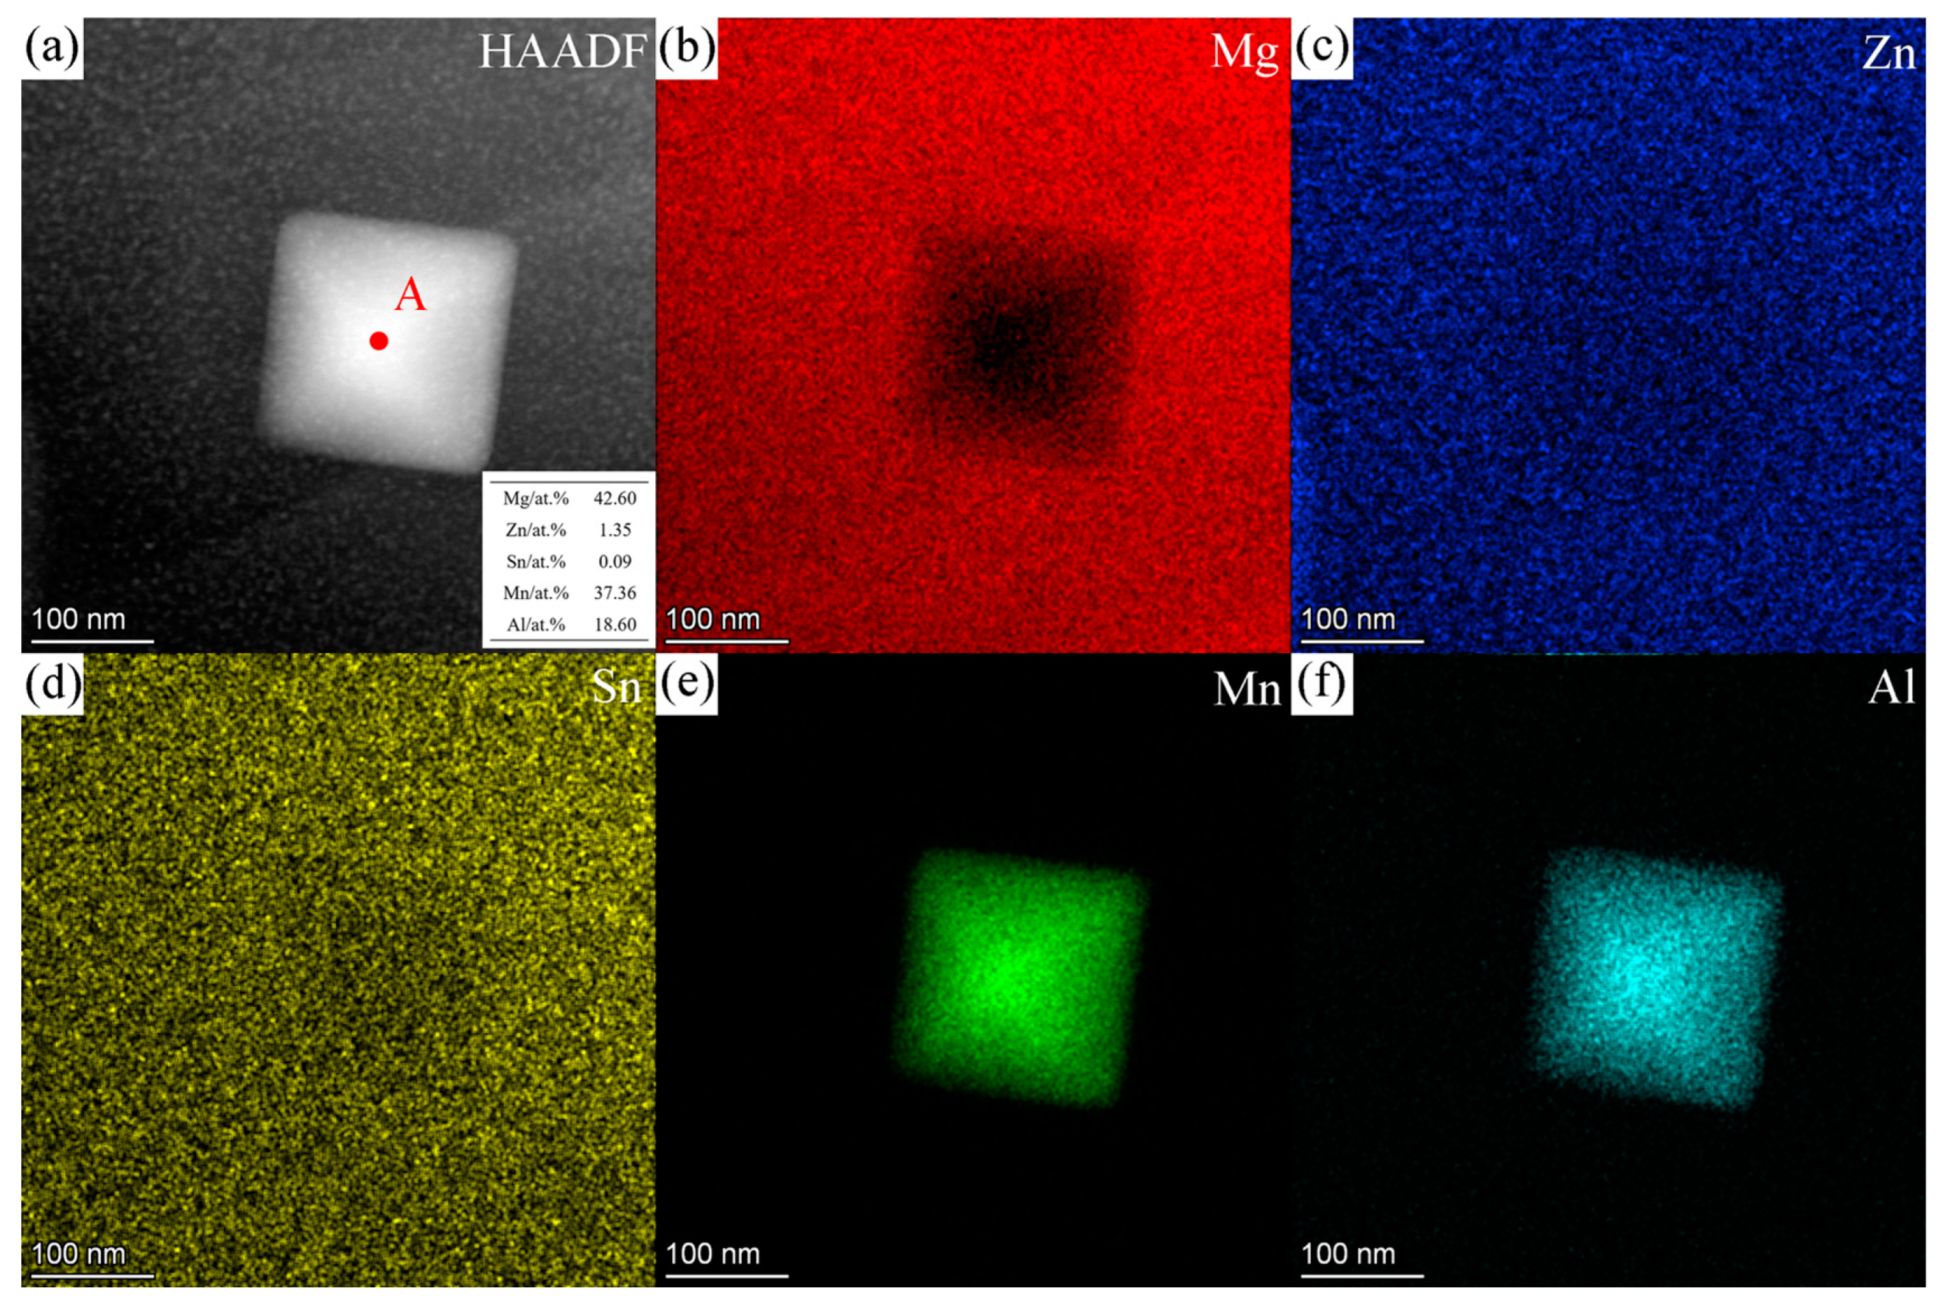
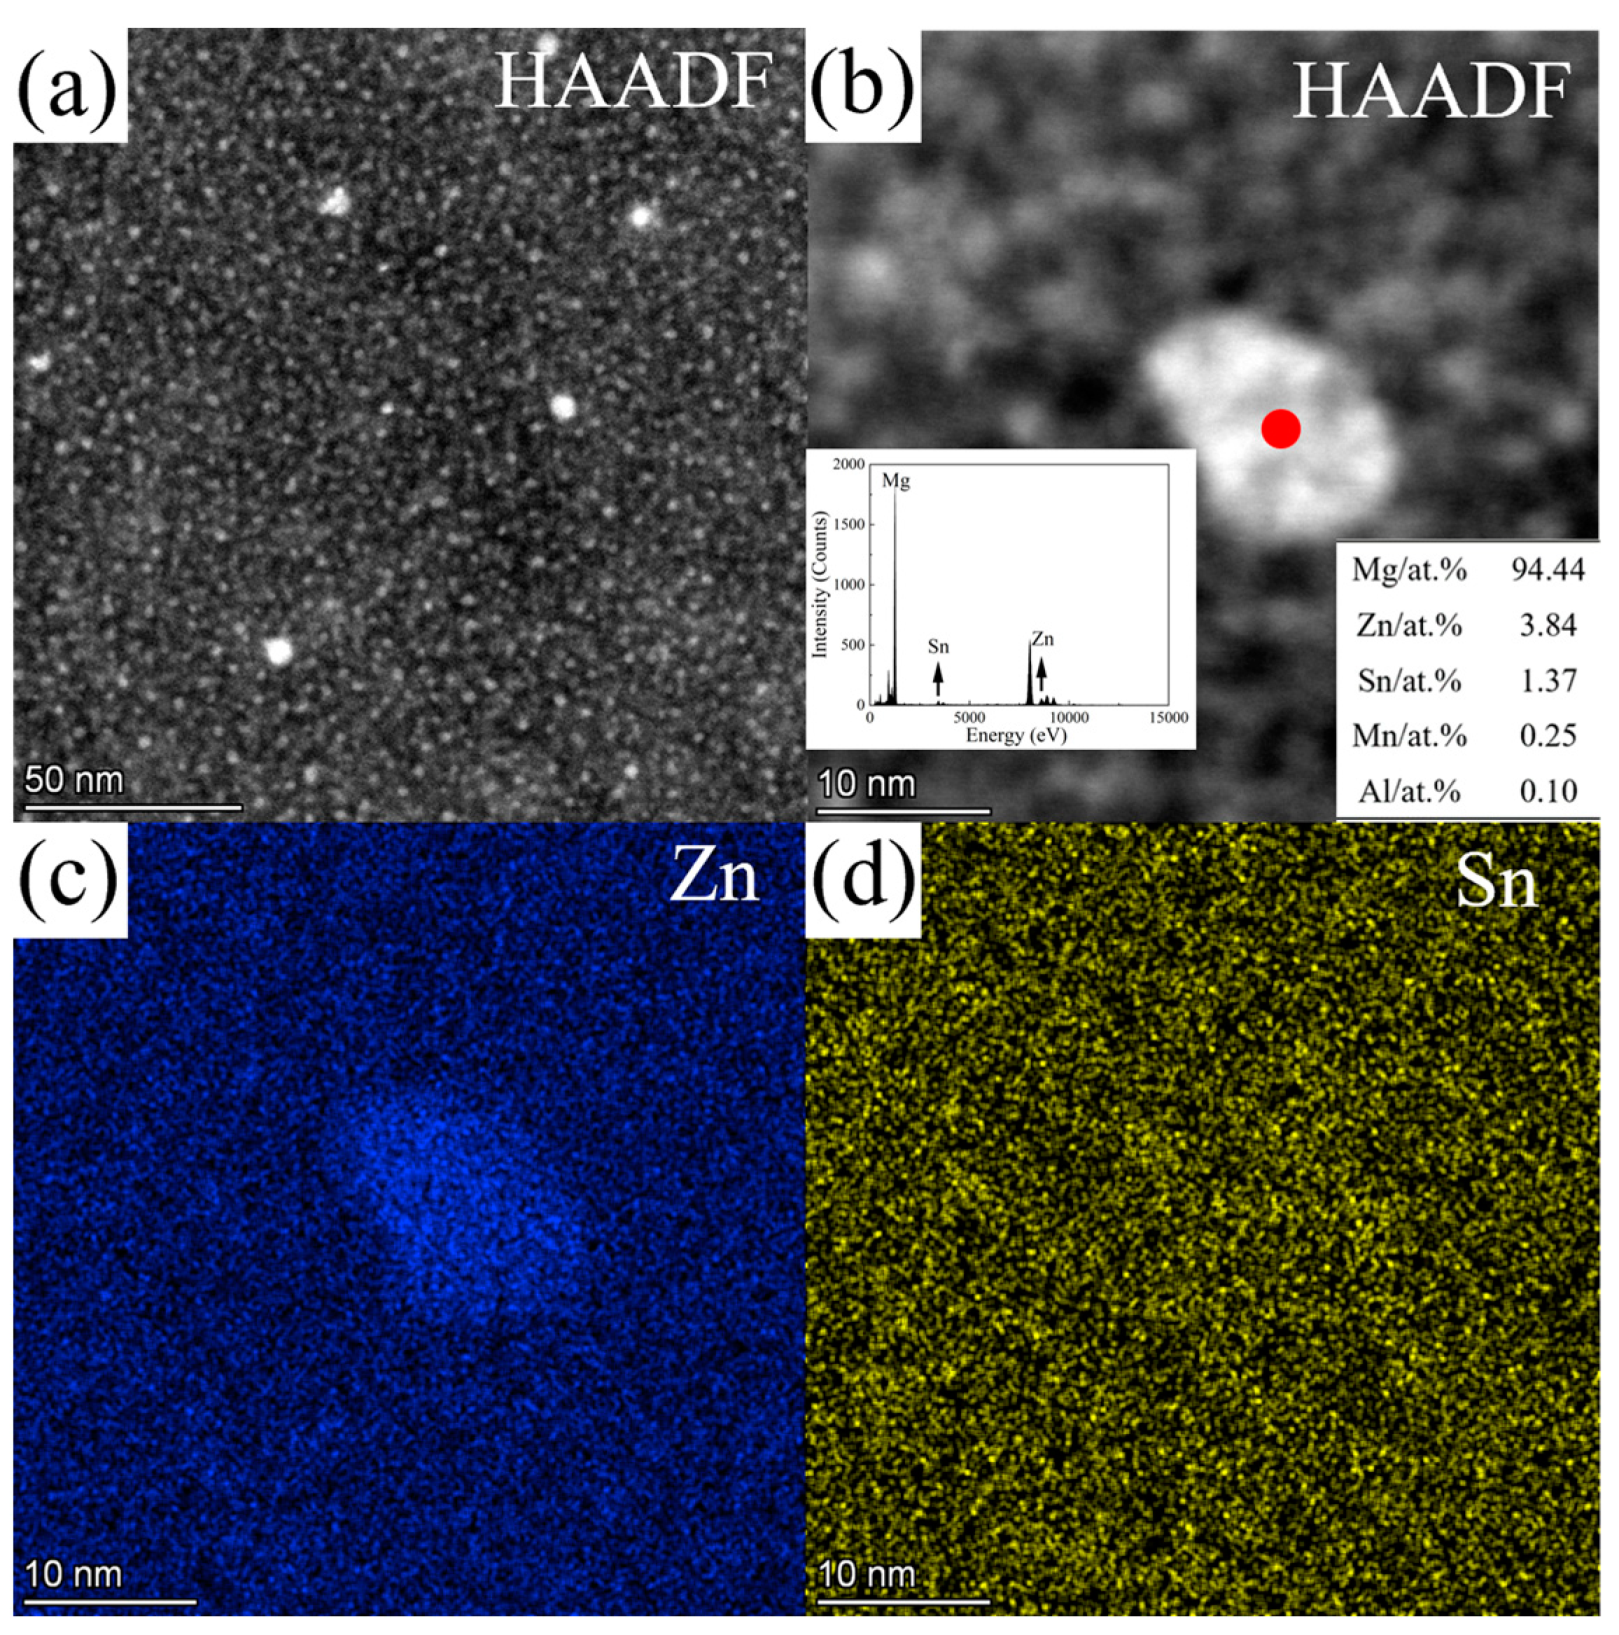
3.3.2. ZTM441-0.3Al
4. Discussion
5. Conclusions
Author Contributions
Funding
Institutional Review Board Statement
Informed Consent Statement
Data Availability Statement
Conflicts of Interest
References
- Fan, Z.Z.; Chen, J.Z.; Lu, Z.; Xiong, Y.C. Research Status and Development Trend of Magnesium Alloys. Foundry 2020, 69, 1016–1029. [Google Scholar]
- Li, F.; Guan, R.G.; Tie, D.; Liu, C.M.; Le, Q.C.; Song, J.F.; Zeng, X.Q.; Jiang, B. Development Strategies for China’s Advanced Magnesium Alloy Industry toward 2035. Strateg. Study CAE 2020, 22, 76–83. [Google Scholar] [CrossRef]
- Ashby, M.F. Material Selection in Mechanical Design, 3rd ed.; Elsevier: Chennai, India, 2009. [Google Scholar]
- Avedesian, M.; Baker, H. ASM Specialty Handbook: Magnesium and Magnesium Alloys; ASM International: Almere, The Netherlands, 1999. [Google Scholar]
- Pezzato, L.; Brunelli, K.; Gross, S.; Magrini, M.; Dabalà, M. Effect of process parameters of plasma electrolytic oxidation on microstructure and corrosion properties of magnesium alloys. J. Appl. Electrochem. 2014, 44, 867–879. [Google Scholar] [CrossRef]
- Yang, L.X.; Xiao, L.; Zhou, H.T.; Tian, Y.; Li, F.; Zeng, X.Q.; Sun, B.D.; Li, Z.Q. Current Development of High-Strength Heat-Resistant Rare Earth Magnesium Alloys. Aerosp. Shanghai 2019, 36, 38–44. [Google Scholar]
- Zhuo, X.R.; Zhao, L.Y.; Gao, W.; Wu, Y.N.; Liu, H.; Zhang, P.; Hu, Z.C.; Jiang, J.H.; Ma, A.B. Recent progress of Mg-Sn based alloys: The relationship between aging response and mechanical performance. J. Mater. Res. Technol. 2022, 21, 186–211. [Google Scholar] [CrossRef]
- Wang, Y.G.; Li, Q.A.; Zhang, Q.; Zhang, X.Y. Application of Sn in heat resistant magnesium alloy. Light Met. 2011, 12, 45–48. [Google Scholar]
- Davis, A.E.; Robson, J.D.; Turski, M. The effect of multiple precipitate types and texture on yield asymmetry in Mg-Sn-Zn(-Al-Na-Ca) alloys. Acta Mater. 2018, 158, 1–12. [Google Scholar] [CrossRef]
- Sun, Z.Q.; Li, Y.J.; Zhang, K.; Li, X.G.; Ma, M.L.; Shi, G.L.; Yuan, J.W.; Zhang, H.J. Microstructure and Hot Deformation Behavior of the Mg–8 wt.% Sn–1.5 wt.% Al Alloy. Materials 2021, 14, 2050. [Google Scholar] [CrossRef] [PubMed]
- Huang, Y.; Dieringa, H.; Kainer, K.U.; Hort, N. Effects of Sn segregation and precipitates on creep response of Mg-Sn alloys. Fatigue Fract. Eng. Mater. Struct. 2012, 36, 308–315. [Google Scholar] [CrossRef]
- Dharmendra, C.; Rao, K.P.; Suresh, K.; Hort, N. Hot Deformation Behavior and Processing Map of Mg-3Sn-2Ca-0.4Al-0.4Zn Alloy. Metals 2018, 8, 216. [Google Scholar] [CrossRef]
- Pan, H.C.; Qin, G.W.; Xu, M.; Fu, H.; Ren, Y.P.; Pan, F.S.; Gao, Z.Y.; Zhao, C.Y.; Yang, Q.S.; She, J.; et al. Enhancing mechanical properties of Mg–Sn alloys by combining addition of Ca and Zn. Mater. Des. 2015, 83, 736–744. [Google Scholar] [CrossRef]
- Vignesh, P.; Venkatesh, G.; Kumaran, S. Second-Phase Precipitates and Their Influence on Mechanical and Work Hardening Behavior of Mg-Al-Sn Alloy. J. Mater. Eng Perform 2022, 31, 5288–5297. [Google Scholar] [CrossRef]
- Kim, D.H.; Lim, H.K.; Kim, Y.K.; Kyeong, J.S.; Kim, W.T.; Kim, D.H. High temperature deformation behavior of Mg-Sn(-Zn) alloy. Met. Mater. Int 2011, 17, 383–388. [Google Scholar] [CrossRef]
- Luo, Y.X.; Chen, Y.A.; Ran, L.; Pang, X.; Pan, F.S. Effects of Zn/Al mass ratio on microstructure evolution and mechanical properties of Mg–Sn based alloys. Mater. Sci. Eng. A 2021, 815, 141307. [Google Scholar] [CrossRef]
- Hou, C.H.; Hu, F.; Qi, F.G.; Zhao, N.; Zhang, D.C.; Ouyang, X.P.; Zhang, D.F. Aging hardening and precipitate behavior of a solution-treated Mg-6Zn-4Sn-1Mn (wt.%) wrought Mg alloy. J. Alloys Compd. 2021, 889, 161640. [Google Scholar] [CrossRef]
- Wang, Y.J.; Zhong, L.P. Unexpected effect of pre-aging prior to extrusion on microstructure and mechanical properties of extruded Mg–8Sn–6Zn–0.1Mn alloy. J. Mater. Res. Technol. 2022, 21, 859–871. [Google Scholar] [CrossRef]
- Wang, Y.J.; Peng, J.; Zhong, L.P. On the microstructure and mechanical property of as-extruded Mg-Sn-Zn alloy with Cu addition. J. Alloys Compd. 2018, 744, 234–242. [Google Scholar] [CrossRef]
- Chen, Y.; Jin, L.; Li, W.; Song, Y.; Hao, L. Microstructure and mechanical properties of as aged Mg–3Sn–1Al and Mg–3Sn–2Zn–1Al alloy. Mater. Sci. Technol. 2015, 31, 73–78. [Google Scholar] [CrossRef]
- Hou, C.H.; Qi, F.G.; Wang, L.F.; Lu, L.W.; Zhao, N.; She, J.; Zhou, Y.; Ouyang, X.P. Effects of Ca addition on the microstructure and mechanical properties of Mg–Zn–Sn–Mn alloys. J. Mater. Res. Technol. 2023, 25, 3884–3900. [Google Scholar] [CrossRef]
- Kim, Y.K.; Sohn, S.W.; Kim, D.H.; Kim, W.T.; Kim, D.H. Role of icosahedral phase in enhancing the strength of Mg–Sn–Zn–Al alloy. J. Alloys Compd. 2013, 549, 46–50. [Google Scholar] [CrossRef]
- Yan, S.J.; Hou, C.H.; Zhang, A.G.; Qi, F.G. Influence of Al Addition on the Microstructure and Mechanical Properties of Mg-Zn-Sn-Mn-Ca Alloys. Materials 2023, 16, 3664. [Google Scholar] [CrossRef]
- Chen, X.; Zhang, D.F.; Zhao, Y.; Pan, F.S.; Liu, Q.Y. Effect of microalloyed Ca on microstructure and mechanical properties of Mg–6Zn–1Mn–4Sn (wt.%) alloy. J. Mater. Res. Technol. 2022, 17, 925–936. [Google Scholar] [CrossRef]
- Ma, D.Q.; Luan, S.Y.; Jin, P.P.; Sun, L.X.; Wang, J.H. The effects of Ca on the microstructure, mechanical and corrosion properties of extruded Mg–2Zn–0.5Mn alloy. J. Mater. Res. Technol. 2023, 25, 2880–2889. [Google Scholar] [CrossRef]
- Xiong, Y.; Jiao, Y.K.; Zha, X.Q.; Chen, Z.G.; He, T.T.; Wang, S.B.; Cao, W. Effect of Al Addition on Microstructure, Mechani-cal, and Corrosion Properties of Hot Extruded Mg-2.0Zn-0.4Mn Alloy. J. Mater. Eng. Perform. 2023, 1–13. [Google Scholar] [CrossRef]
- Chai, Y.F.; Shan, L.; Jiang, B.; Yang, H.B.; He, C.; Hao, W.X.; He, J.J.; Yang, Q.S.; Yuan, M.; Pan, F.S. Ameliorating mechanical properties and reducing anisotropy of as-extruded Mg-1.0Sn-0.5Ca alloy via Al addition. Prog. Nat. Sci. Mater. Int. 2021, 31, 722–730. [Google Scholar] [CrossRef]
- Xu, S.; Zhang, S.C.; Lu, Z.; Hu, J. Effects of w(Zn)/w(Sn) Mass Ratios on Microstructure and Mechanical Properties of As-cast Mg-Zn-Sn (ZT) Alloys. Spec. Castal Nonferrous Alloys 2020, 40, 108–112. [Google Scholar]
- Hu, J.; Xu, S.; Yang, J.; Zhang, S.C. Non-equilibrium Structure and Mechanical Properties of Permanent Mold Casting Mg-Zn-Sn Alloys. Spec. Castal Nonferrous Alloys 2021, 41, 114–118. [Google Scholar]
- Hu, J. Study on Non-Equilibrium Structure and Properties of Mg-Zn (Sn) and Mg-Zn-Sn Magnesium Alloys; Wuhan University of Science and Technology: Wuhan, China, 2021. [Google Scholar]
- Chen, X.Q.; Liu, J.W.; Luo, C.P. Research Status and Development Trend of Mg-Zn Alloys with High Strength. Mater. Rep. 2008, 22, 58–62. [Google Scholar]
- Liu, C.Q.; Chen, H.W.; Liu, H.; Zhao, X.J.; Nie, J.F. Metastable precipitate phases in Mg–9.8 wt% Sn alloy. Acta Mater. 2018, 144, 590–600. [Google Scholar] [CrossRef]
- Liu, C.Q.; He, C.; Chen, H.W.; Nie, J.F. Precipitation on stacking faults in Mg–9.8 wt% Sn alloy. J. Mater. Sci. Technol. 2020, 45, 230–240. [Google Scholar] [CrossRef]
- Liu, C.Q.; Chen, H.W.; Song, M.; Nie, J.F. Electron beam irradiation induced metastable phase in a Mg–9.8 wt% Sn alloy. J. Mater. Sci. Technol. 2021, 84, 133–138. [Google Scholar] [CrossRef]
- Kim, Y.K.; Kim, D.H.; Kim, W.T.; Kim, D.H. Precipitation of DO19 type metastable phase in Mg–Sn alloy. Mater. Lett. 2013, 113, 50–53. [Google Scholar] [CrossRef]
- Higashi, I.; Shiotani, N.; Uda, M.; Mizoguchi, T.; Katoh, H. The crystal structure of Mg51Zn20. J. Solid State Chem. 1981, 36, 225–233. [Google Scholar] [CrossRef]
- Liu, C.M.; Zhu, X.R.; Zhou, H.T. Magnesium Alloy Phase Atlas; Central South University Press: Changsha, China, 2006. [Google Scholar]
- Dev, A.; Naskar, N.; Kumar, N.; Jena, A.; Paliwal, M. A systematic investigation of secondary phase dissolution in Mg–Sn alloys. J. Magnes. Alloys 2019, 7, 725–737. [Google Scholar] [CrossRef]
- Yu, J.; Liao, H.; Lee, J.H.; Moon, Y.H.; Yoon, H.S.; Kim, J.; Lee, T. Microstructural Evolution of Multi-Pass Caliber-Rolled Mg–Sn and Mg–Sn–Mn Alloys. Metals 2020, 10, 1203. [Google Scholar] [CrossRef]
- Somekawa, H.; Naito, K. Grain boundary plasticity at intermediate temperatures in fine-grained Mg-Mn ternary alloys. J. Alloys Compd. 2023, 942, 169012. [Google Scholar] [CrossRef]
- Huang, X.S.; Bian, M.Z.; Chino, Y. Improvement of deep drawing formability of Mg-6Al-1Zn magnesium alloy sheets with high strength utilizing aging precipitation. Scr. Mater. 2022, 215, 114709. [Google Scholar] [CrossRef]
- Xian, J.W.; Peng, L.; Zeng, G.; Wang, D.; Gourlay, C.M. Al11Mn4 formation on Al8Mn5 during the solidification and heat treatment of AZ-series magnesium alloys. Materialia 2021, 19, 101192. [Google Scholar] [CrossRef]
- Mendis, C.L.; Oh-ishi, K.; Hono, K. Effect of Al additions on the age hardening response of the Mg–2.4Zn–0.1Ag–0.1Ca (at.%) alloy—TEM and 3DAP study. Mater. Sci. Eng. A 2010, 527, 973–980. [Google Scholar] [CrossRef]
- Kim, S.H.; Lee, J.U.; Kim, Y.J.; Jung, J.G.; Park, S.H. Controlling the microstructure and improving the tensile properties of extruded Mg-Sn-Zn alloy through Al addition. J. Alloys Compd. 2018, 751, 1–11. [Google Scholar] [CrossRef]
- Elsayed, F.R.; Sasaki, T.T.; Mendis, C.L.; Ohkubo, T.; Hono, K. Compositional optimization of Mg–Sn–Al alloys for higher age hardening response. Mater. Sci. Eng. A 2013, 566, 22–29. [Google Scholar] [CrossRef]
- Ye, Z.S. Effect of Al Addition on the Microstructure and Mechanical Properties of Mg-Zn-Sn-Mn Alloy; Xiangtan University: Xiangtan, China, 2020. [Google Scholar]
- Hou, C.H.; Ye, Z.S.; Qi, F.G.; Lu, L.W.; She, J.; Wang, L.F.; Ouyang, X.P.; Zhao, N.; Chen, J. Microstructure and Mechanical Properties of As-Aged Mg-Zn-Sn-Mn-Al Alloys. Materials 2022, 16, 109. [Google Scholar] [CrossRef]
- Hou, C.H.; Ye, Z.S.; Qi, F.G.; Wang, Q.; Li, L.H.; Ouyang, X.P.; Zhao, N. Effect of Al addition on microstructure and mechanical properties of Mg−Zn−Sn−Mn alloy. Trans. Nonferrous Met. Soc. China 2021, 31, 1951–1968. [Google Scholar] [CrossRef]
- Deng, Y.C.; Zeng, G.; Xian, J.W.; Zhan, H.Y.; Liu, C.M.; Gourlay, C.M. Eutectic intermetallic formation during solidification of a Mg-Sn-Al-Zn-Mn alloy. Mater. Charact. 2022, 186, 111807. [Google Scholar] [CrossRef]
- Yang, M.B.; Pan, F.S.; Tang, A.T.; Tang, L.W.; Yang, H. Research Status of Mg-Zn-Al (ZA) Based Elevated Temperature. Magnesium Alloy. Mater. Heat Treat. 2007, 36, 73–77. [Google Scholar]
- Huang, D.D.; Liu, S.H.; Xu, H.H.; Du, Y. Phase equilibria of the Mg–Mn–Zn system at 593 K (320 °C). J. Alloys Compd. 2016, 688, 1115–1124. [Google Scholar] [CrossRef]
- Peng, P.; She, J.; Tang, A.T.; Zhang, J.Y.; Song, K.; Yang, Q.S.; Pan, F.S. A strategy to regulate the microstructure and properties of Mg-2.0Zn-1.5Mn magnesium alloy by tracing the existence of Mn element. J. Alloys Compd. 2022, 890, 161789. [Google Scholar] [CrossRef]
- Ohba, T.; Kitano, Y.; Komura, Y. The charge-density study of the Laves phases, MgZn2 and MgCu2. Acta Crystallogr. Sect. C Cryst. Struct. Commun. 1984, 40, 1–5. [Google Scholar] [CrossRef]
- Brauer, G.; Tiesler, J. Ueber Dichte und Gitterbau der Verbindungen Mg2Pb, Mg2Sn und Mg2Ge. Z. Anorg. Und Allg. Chem. 1950, 262, 319–327. [Google Scholar] [CrossRef]
- Gazzara, C.P.; Middleton, R.M.; Weiss, R.J.; Hall, E.O. A refinement of the parameters of alpha manganese Localilty: Synthetic Sample: At T = 298K. Acta Crystallogr. 1967, 22, 859–862. [Google Scholar] [CrossRef]
- The Materials Project. Materials Data on Mg149Zn by Materials Project. United States: N. p., 2019. Web. Available online: https://next-gen.materialsproject.org/materials/mp-1185642?chemsys=Mg-Zn (accessed on 9 October 2023).
- Yarmolyuk, Y.P.; Mel’nik, E.V.; Kripyakevich, P.I. Crystal structure of the compound Mg4Zn7. Kristallografiya 1975, 20, 538–542. [Google Scholar]
- Yan, K.; Bai, J.; Liu, H.; Jin, Z.Y. The precipitation behavior of MgZn2 and Mg4Zn7 phase in Mg-6Zn (wt.%) alloy during equal-channel angular pressing. J. Magnes. Alloys 2017, 5, 336–339. [Google Scholar] [CrossRef]
- Rosalie, J.M.; Somekawa, H.; Singh, A.; Mukai, T. Orientation relationships between icosahedral clusters in hexagonal MgZn2 and monoclinic Mg4Zn7 phases in Mg-Zn(-Y) alloys. Philos. Mag. 2011, 91, 2634–2644. [Google Scholar] [CrossRef]
- Liu, S.; Esteban-Manzanares, G.; LLlorca, J. First-principles analysis of precipitation in Mg-Zn alloys. Phys. Rev. Mater. 2020, 4, 093609. [Google Scholar] [CrossRef]
- Xie, Y.P.; Wang, Z.Y.; Hou, Z.F. The phase stability and elastic properties of MgZn2 and Mg4Zn7 in Mg–Zn alloys. Scr. Mater. 2013, 68, 495–498. [Google Scholar] [CrossRef]
- Zheng, Y.H.; Bourgeois, L.; Nie, J.F. Aperiodic structures of rod-shaped precipitates in a Mg-Zn-Al alloy. Scr. Mater. 2021, 205, 114189. [Google Scholar] [CrossRef]
- Gao, X.; Nie, J.F. Characterization of strengthening precipitate phases in a Mg–Zn alloy. Scr. Mater. 2007, 56, 645–648. [Google Scholar] [CrossRef]
- The Materials Project. Materials Data on Mn2Al3 by Materials Project. United States: N. p., 2020. Web. Available online: https://next-gen.materialsproject.org/materials/mp-1180309?chemsys=Al-Mn#0cde6366-d943-4652-af6a-196ac471cc51 (accessed on 9 October 2023).
- Shao, L.; Zhang, C.; Li, C.Y.; Tang, A.T.; Liu, J.G.; Yu, Z.W.; Pan, F.S. Mechanistic study of Mg-Mn-Al extrusion alloy with superior ductility and high strength. Mater. Charact. 2022, 183, 111651. [Google Scholar] [CrossRef]
- Gao, F.H.; Lv, B.J.; Xu, T.W.; Cui, N.; Guo, F. Effects of Sn and Mn Addition on the Microstructure and Mechanical Properties of As-Extruded Mg–2Al–1Zn Alloys. Met. Mater. Int. 2023, 1–12. [Google Scholar] [CrossRef]
- Wang, Y.; Xia, M.; Fan, Z.; Zhou, X.; Thompson, G.E. The effect of Al8Mn5 intermetallic particles on grain size of as-cast Mg–Al–Zn AZ91D alloy. Intermetallics 2010, 18, 1683–1689. [Google Scholar] [CrossRef]
- Cho, J.H.; Han, S.H.; Lee, G.Y. Microstructure and Texture Evolutions during Deep Drawing of Mg–Al–Mn Sheets at Elevated Temperatures. Materials 2020, 13, 3608. [Google Scholar] [CrossRef]
- Razzaghi, M.; Mirzadeh, H.; Emamy, M. Mechanical properties of Mg-Al-Mn magnesium alloys with low Al content in the as-cast and extruded conditions. Mater. Res. Express 2019, 6, 106521. [Google Scholar] [CrossRef]
- Nakata, T.; Xu, C.; Kaibe, K.; Yoshida, Y.; Yoshida, K.; Kamado, S. Improvement of strength and ductility synergy in a room-temperature stretch-formable Mg-Al-Mn alloy sheet by twin-roll casting and low-temperature annealing. J. Magnes. Alloys 2022, 10, 1066–1074. [Google Scholar] [CrossRef]
- Nie, J.F. Effects of precipitate shape and orientation on dispersion strengthening in magnesium alloys. Scr. Mater. 2003, 48, 1009–1015. [Google Scholar] [CrossRef]
- Sasaki, T.T.; Oh-ishi, K.; Ohkubo, T.; Hono, K. Effect of double aging and microalloying on the age hardening behavior of a Mg–Sn–Zn alloy. Mater. Sci. Eng. A 2011, 530, 1–8. [Google Scholar] [CrossRef]


| Sample Type | Zn | Sn | Mn | Al | Mg |
|---|---|---|---|---|---|
| ZTM441 | 3.80 | 3.98 | 0.98 | — | Bal. |
| ZTM441-0.3Al | 4.00 | 4.06 | 0.86 | 0.29 | Bal. |
| Mg | Zn | Sn | Mn | ||
|---|---|---|---|---|---|
| A | 96.19 | 1.84 | 1.54 | 0.44 | Matrix |
| C | 71.79 | 26.90 | 0.27 | 1.03 | Zn-rich |
| D | 15.75 | 0.00 | 0.00 | 84.25 | Mn-rich |
| E | 81.88 | 1.83 | 16.29 | 0.00 | Sn-rich |
| F | 64.49 | 6.40 | 29.12 | 0.00 | Sn-rich |
| G | 77.11 | 17.40 | 4.68 | 0.81 | Zn-rich |
| H | 80.81 | 18.45 | 0.74 | 0.00 | Zn-rich |
| Mg | Zn | Sn | Mn | Al | ||
|---|---|---|---|---|---|---|
| C | 7.67 | 0.00 | 0.00 | 61.97 | 30.35 | Al-Mn-rich |
| D | 81.65 | 17.21 | 0.49 | 0.14 | 0.51 | Zn-rich |
| E | 80.79 | 0.80 | 18.41 | 0.00 | 0.00 | Sn-rich |
| Mg | Zn | Sn | Mn | ||
|---|---|---|---|---|---|
| A | 27.98 | 66.24 | 0.05 | 5.73 | MgZn2 |
| B | 68.94 | 0.20 | 30.33 | 0.53 | Mg2Sn |
| C | 95.41 | 3.02 | 1.26 | 0.31 | α-Mg |
| Mg | Zn | Sn | Mn | Al | ||
|---|---|---|---|---|---|---|
| A | 59.49 | 0.25 | 39.97 | 0.11 | 0.18 | Mg2Sn |
| B | 20.84 | 78.81 | 0.07 | 0.16 | 0.12 | MgZn2 |
| C | 37.69 | 61.39 | 0.05 | 0.08 | 0.79 | Mg149Zn |
| D | 29.34 | 69.67 | 0.08 | 0.12 | 0.80 | Mg4Zn7 |
| E | 35.75 | 63.52 | 0.07 | 0.07 | 0.59 | MgZn2 |
Disclaimer/Publisher’s Note: The statements, opinions and data contained in all publications are solely those of the individual author(s) and contributor(s) and not of MDPI and/or the editor(s). MDPI and/or the editor(s) disclaim responsibility for any injury to people or property resulting from any ideas, methods, instructions or products referred to in the content. |
© 2023 by the authors. Licensee MDPI, Basel, Switzerland. This article is an open access article distributed under the terms and conditions of the Creative Commons Attribution (CC BY) license (https://creativecommons.org/licenses/by/4.0/).
Share and Cite
Liu, J.; Du, Z.; Peng, Y.; Jia, R.; Han, X.; Ma, M.; Li, T. Study on the Microstructure of Mg-4Zn-4Sn-1Mn-xAl As-Cast Alloys. Materials 2023, 16, 6979. https://doi.org/10.3390/ma16216979
Liu J, Du Z, Peng Y, Jia R, Han X, Ma M, Li T. Study on the Microstructure of Mg-4Zn-4Sn-1Mn-xAl As-Cast Alloys. Materials. 2023; 16(21):6979. https://doi.org/10.3390/ma16216979
Chicago/Turabian StyleLiu, Junlin, Zhiwei Du, Yonggang Peng, Rongguang Jia, Xiaolei Han, Minglong Ma, and Ting Li. 2023. "Study on the Microstructure of Mg-4Zn-4Sn-1Mn-xAl As-Cast Alloys" Materials 16, no. 21: 6979. https://doi.org/10.3390/ma16216979
APA StyleLiu, J., Du, Z., Peng, Y., Jia, R., Han, X., Ma, M., & Li, T. (2023). Study on the Microstructure of Mg-4Zn-4Sn-1Mn-xAl As-Cast Alloys. Materials, 16(21), 6979. https://doi.org/10.3390/ma16216979