
Bearing Capacity Performance and Optimal Design of a Novel Aluminum Alloy Arch Gusset Joint


Abstract
:1. Introduction
2. Experimental Verification of Finite Element Model
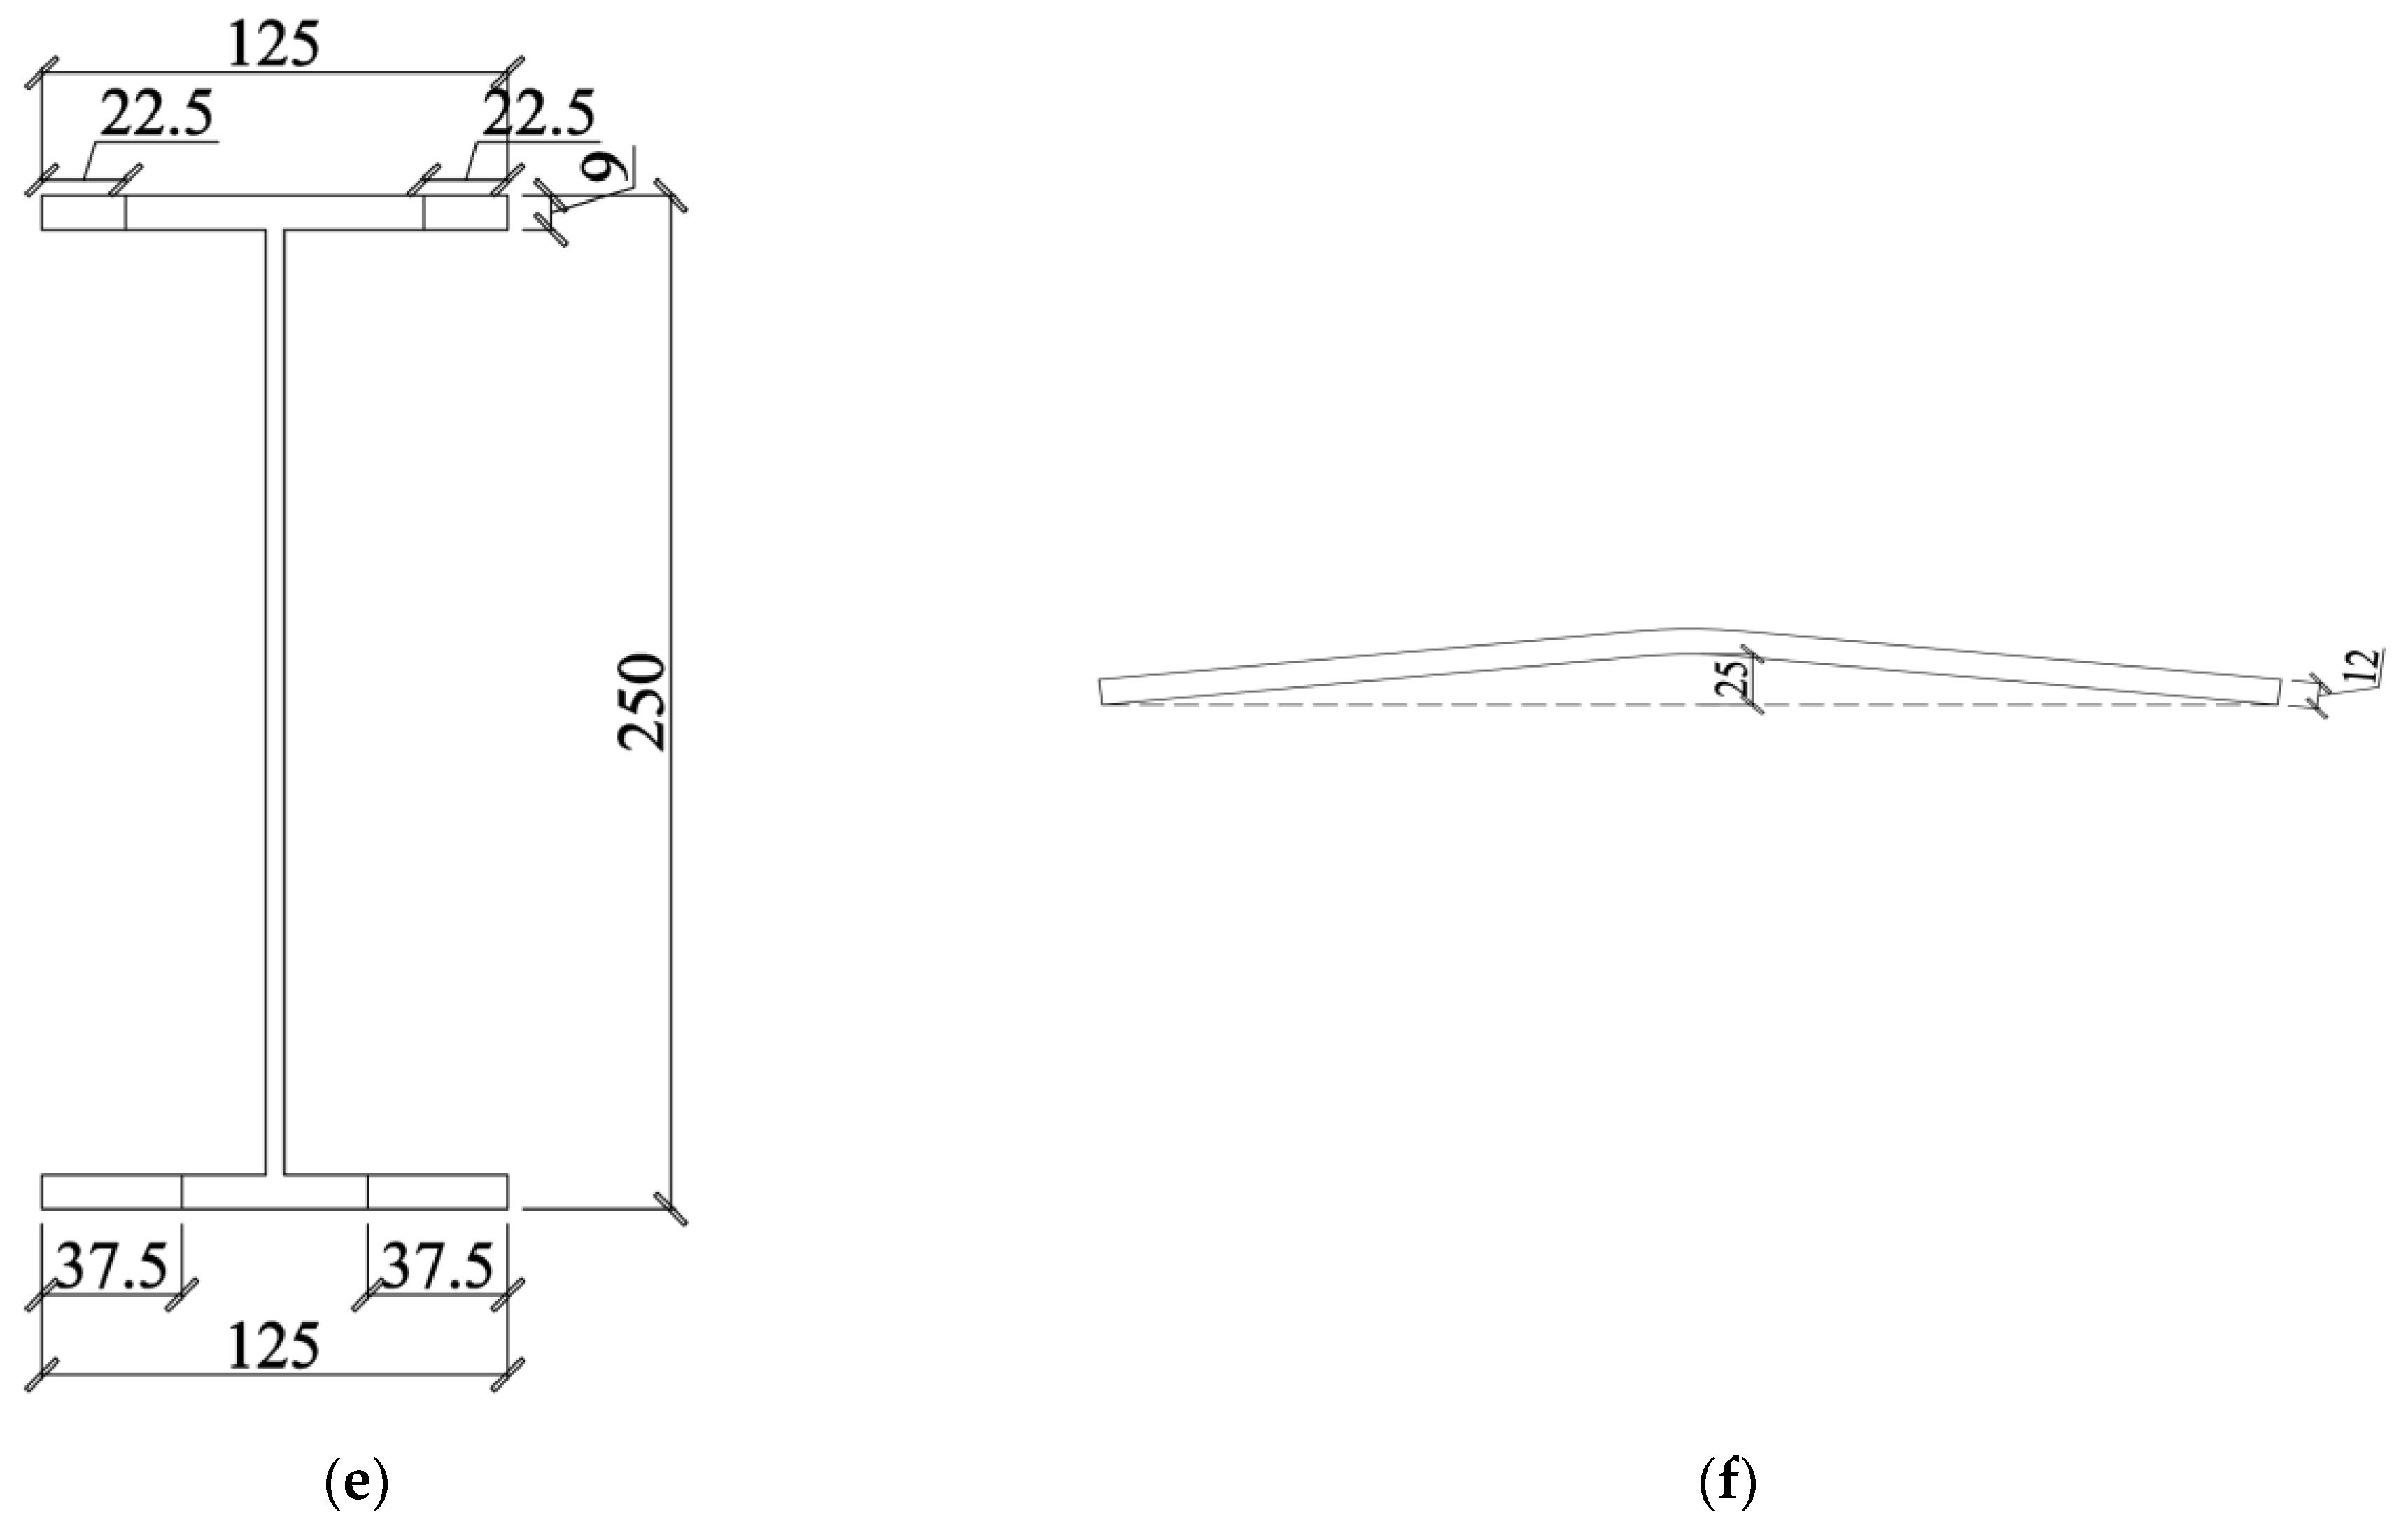
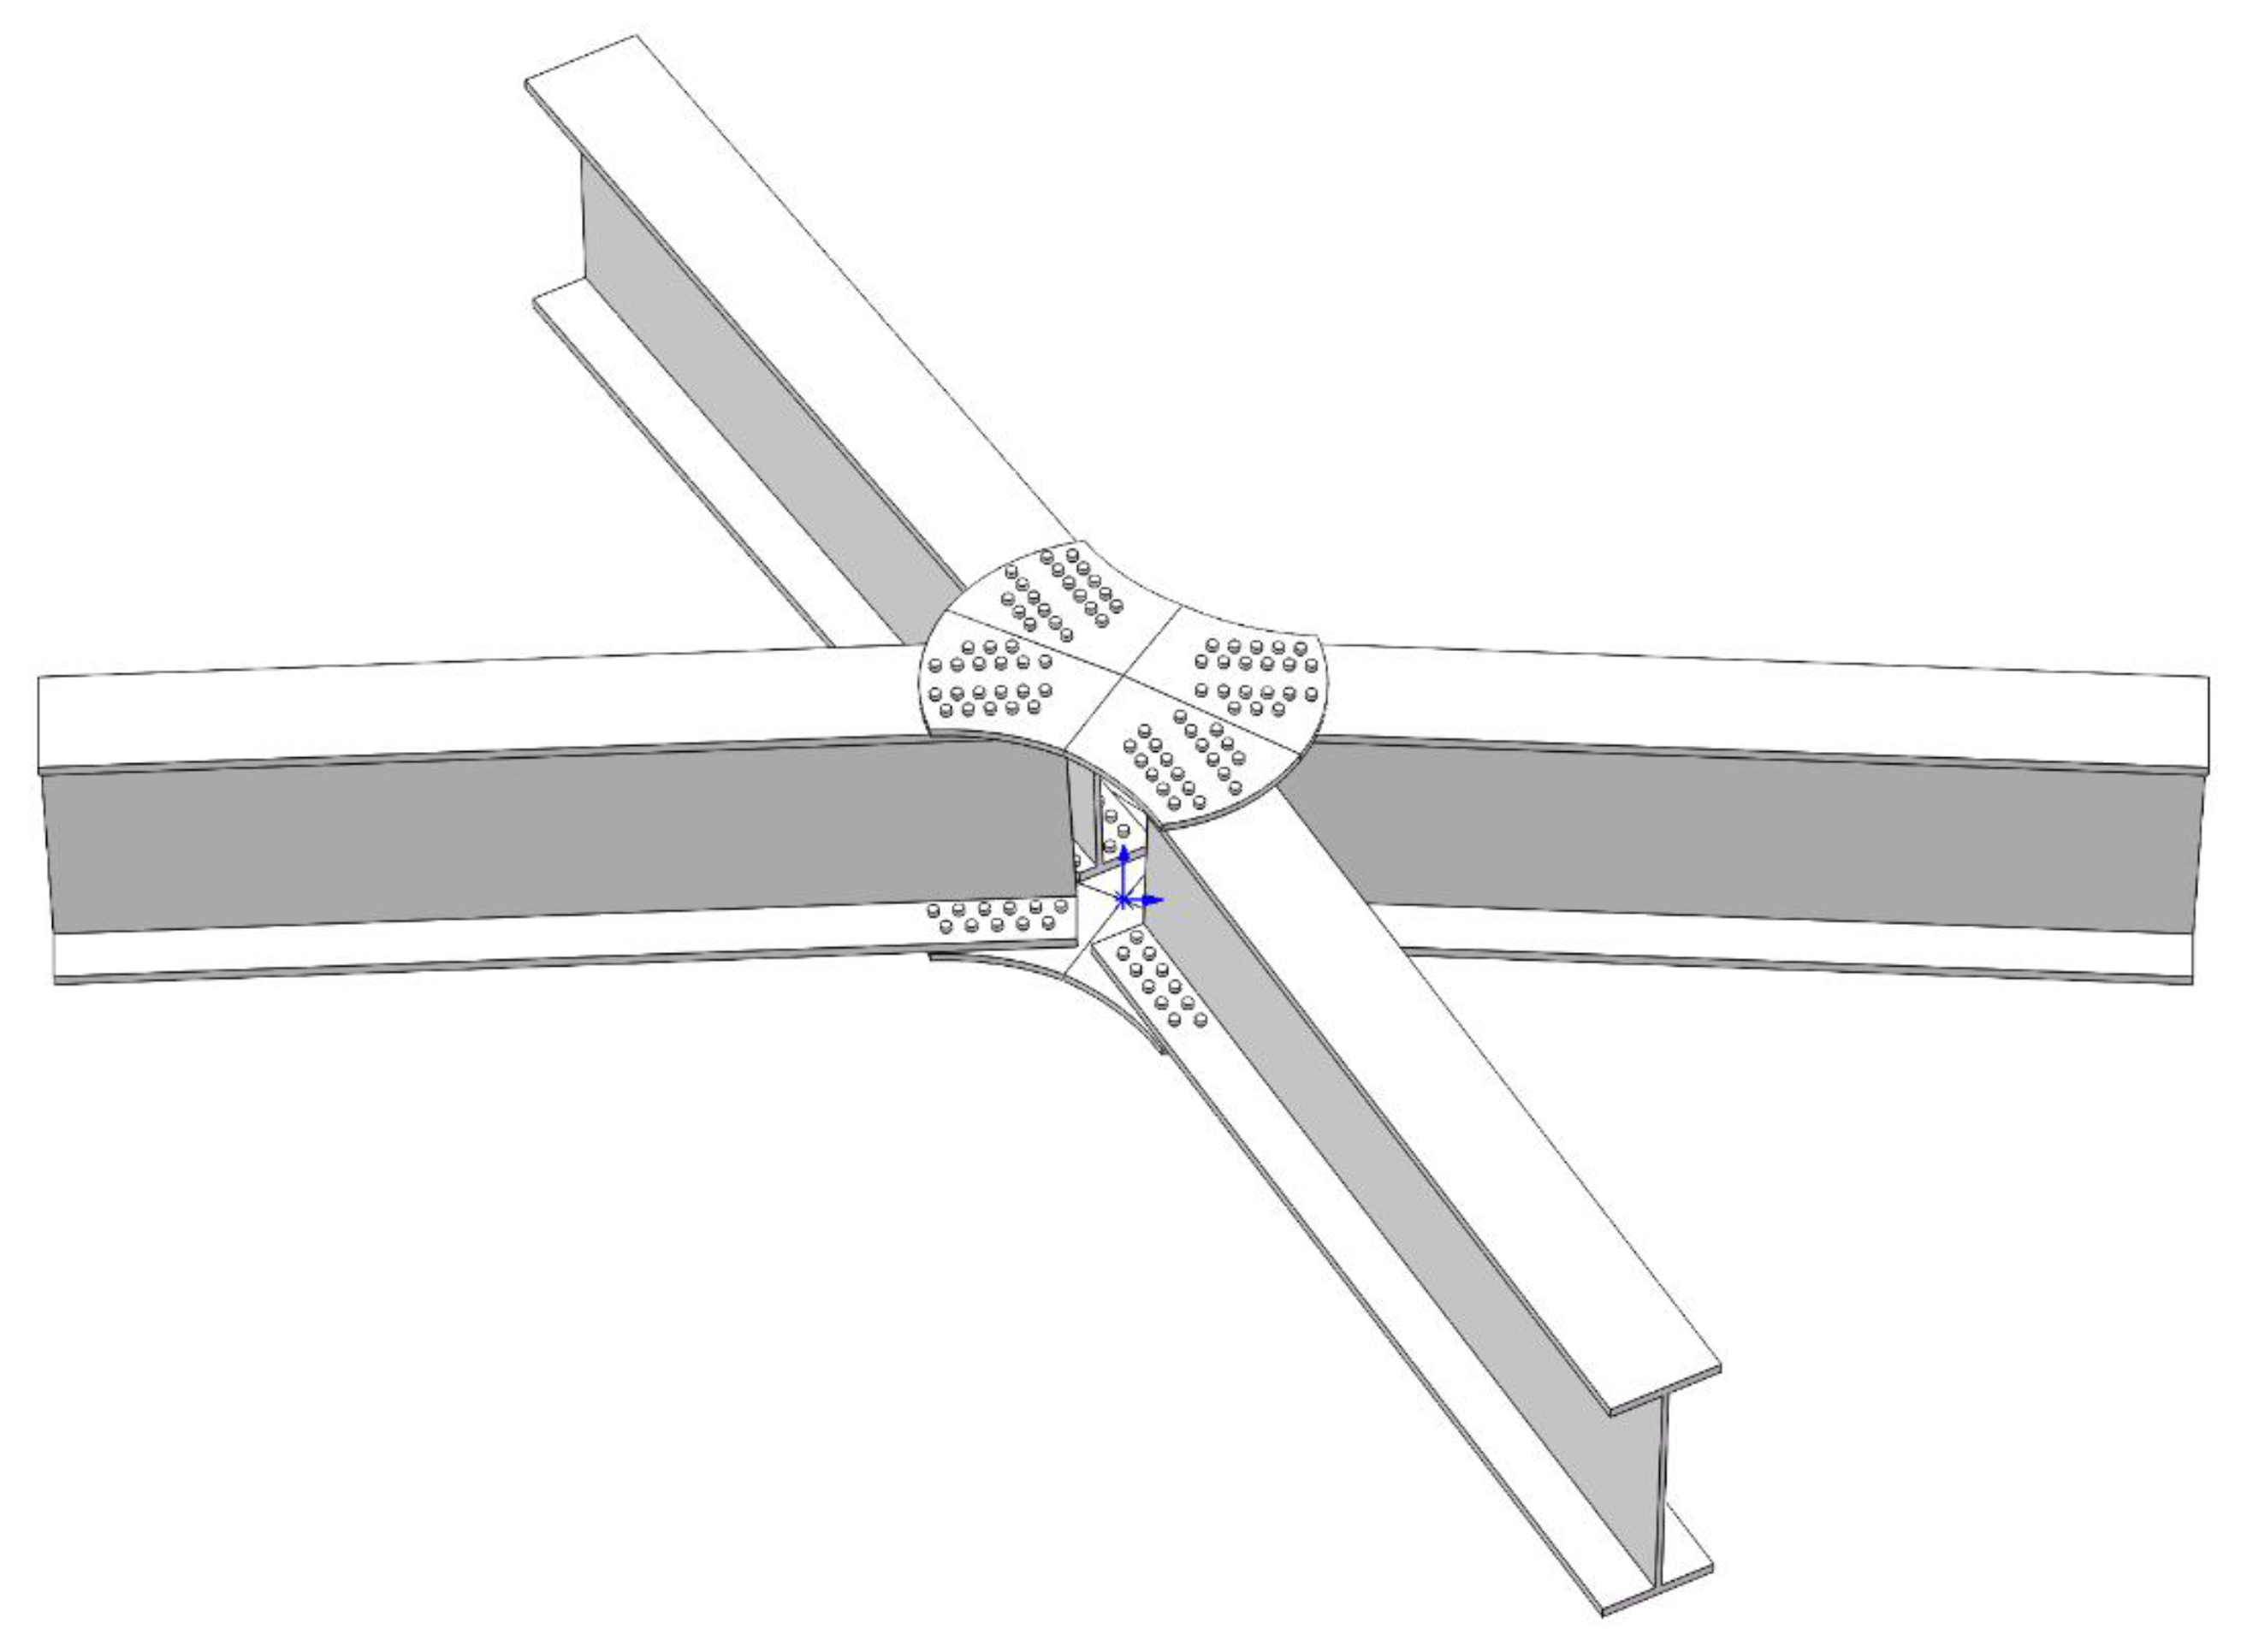
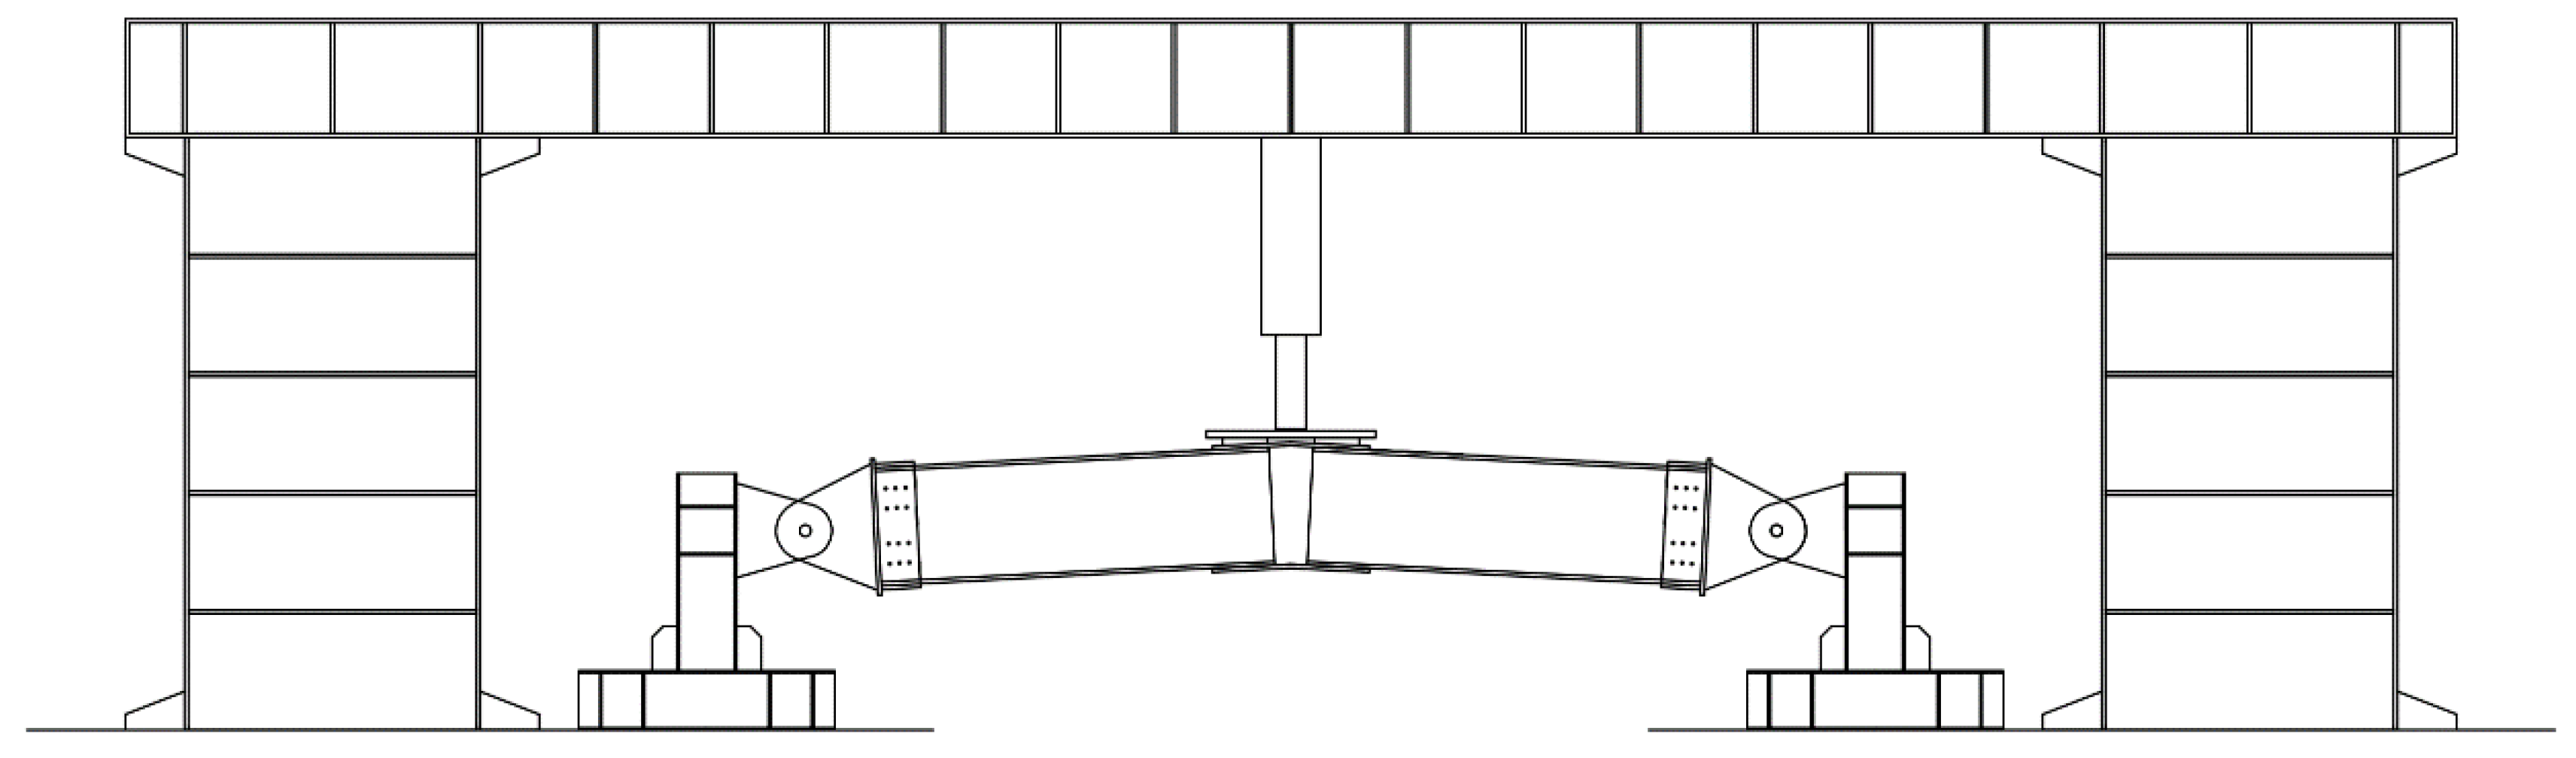
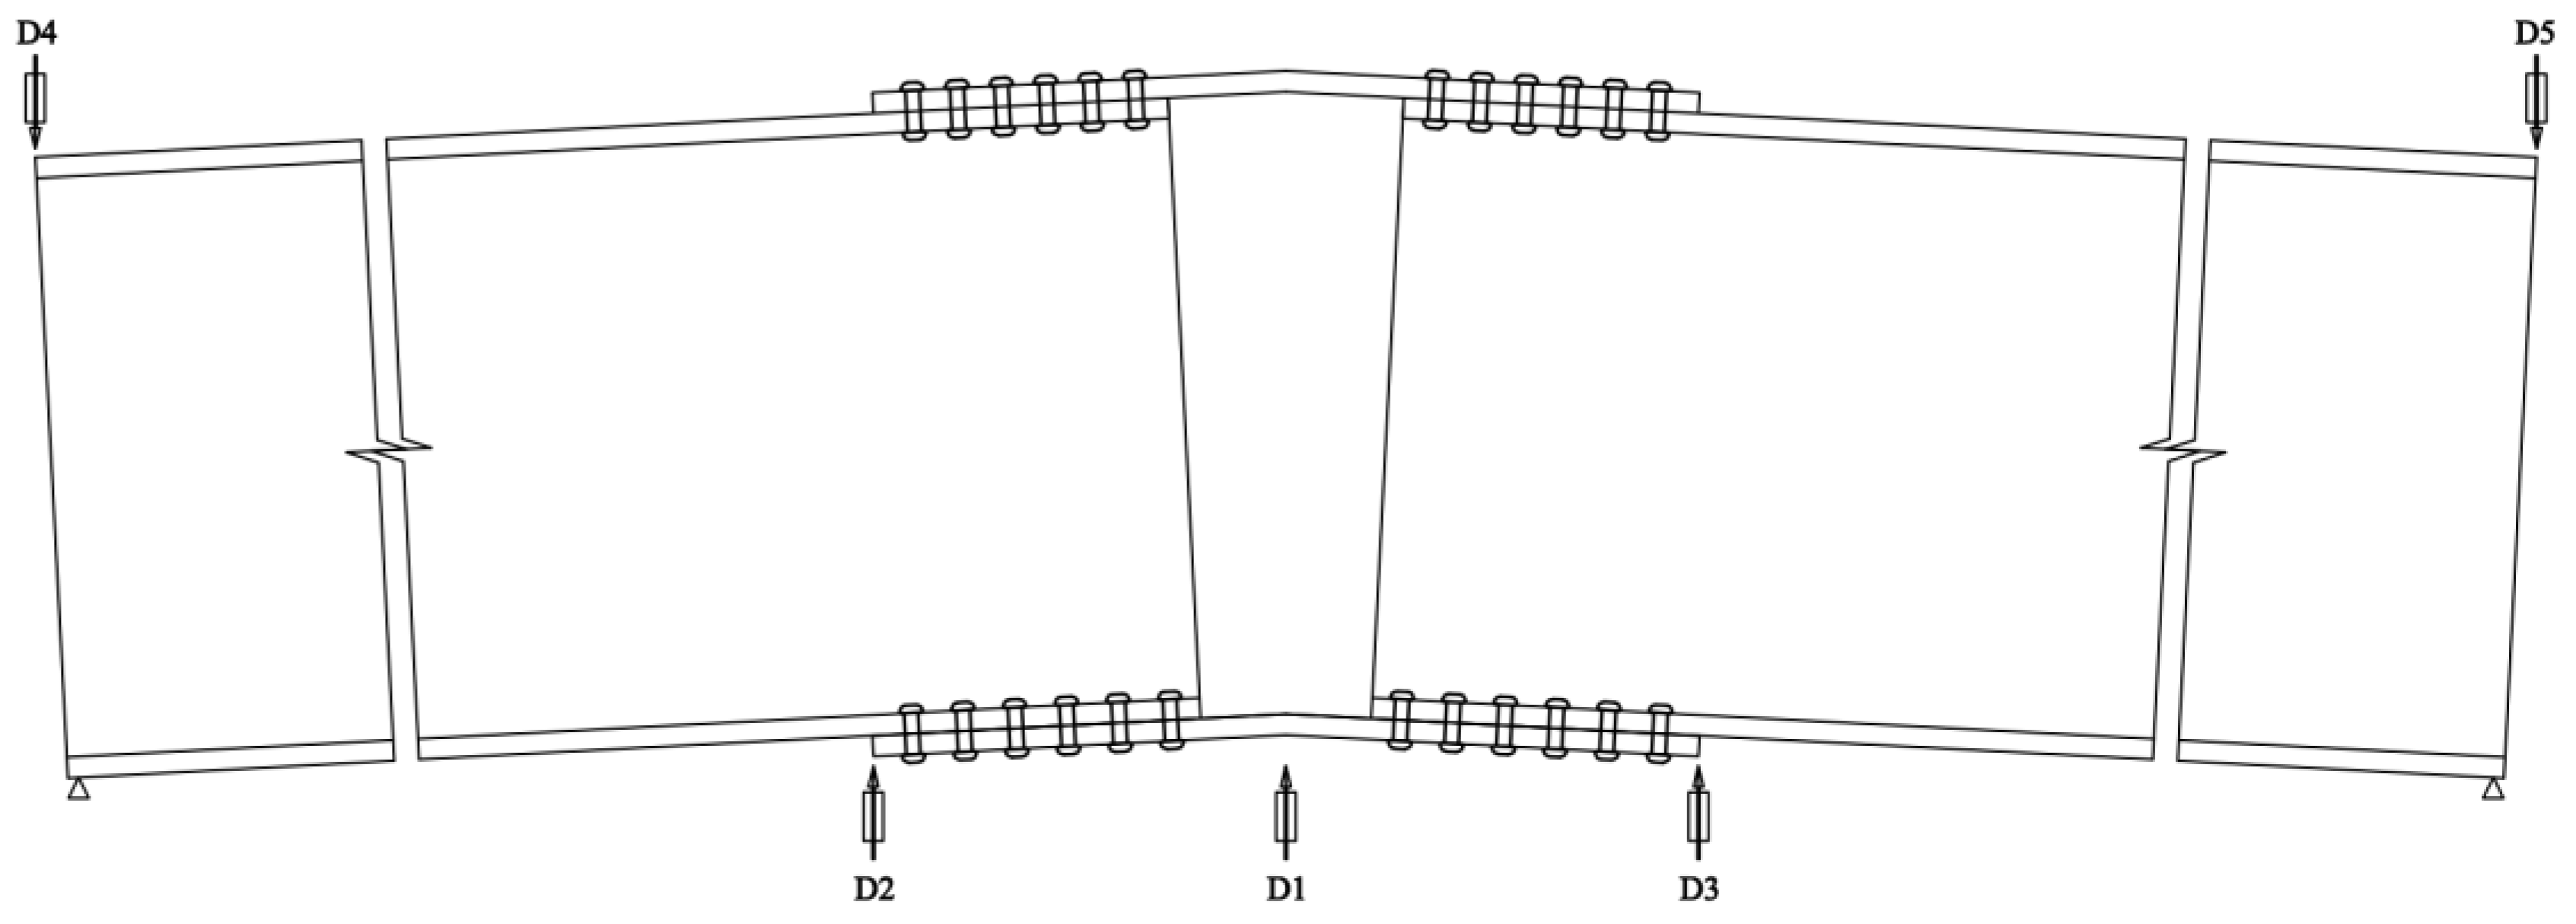
2.1. Experimental Model
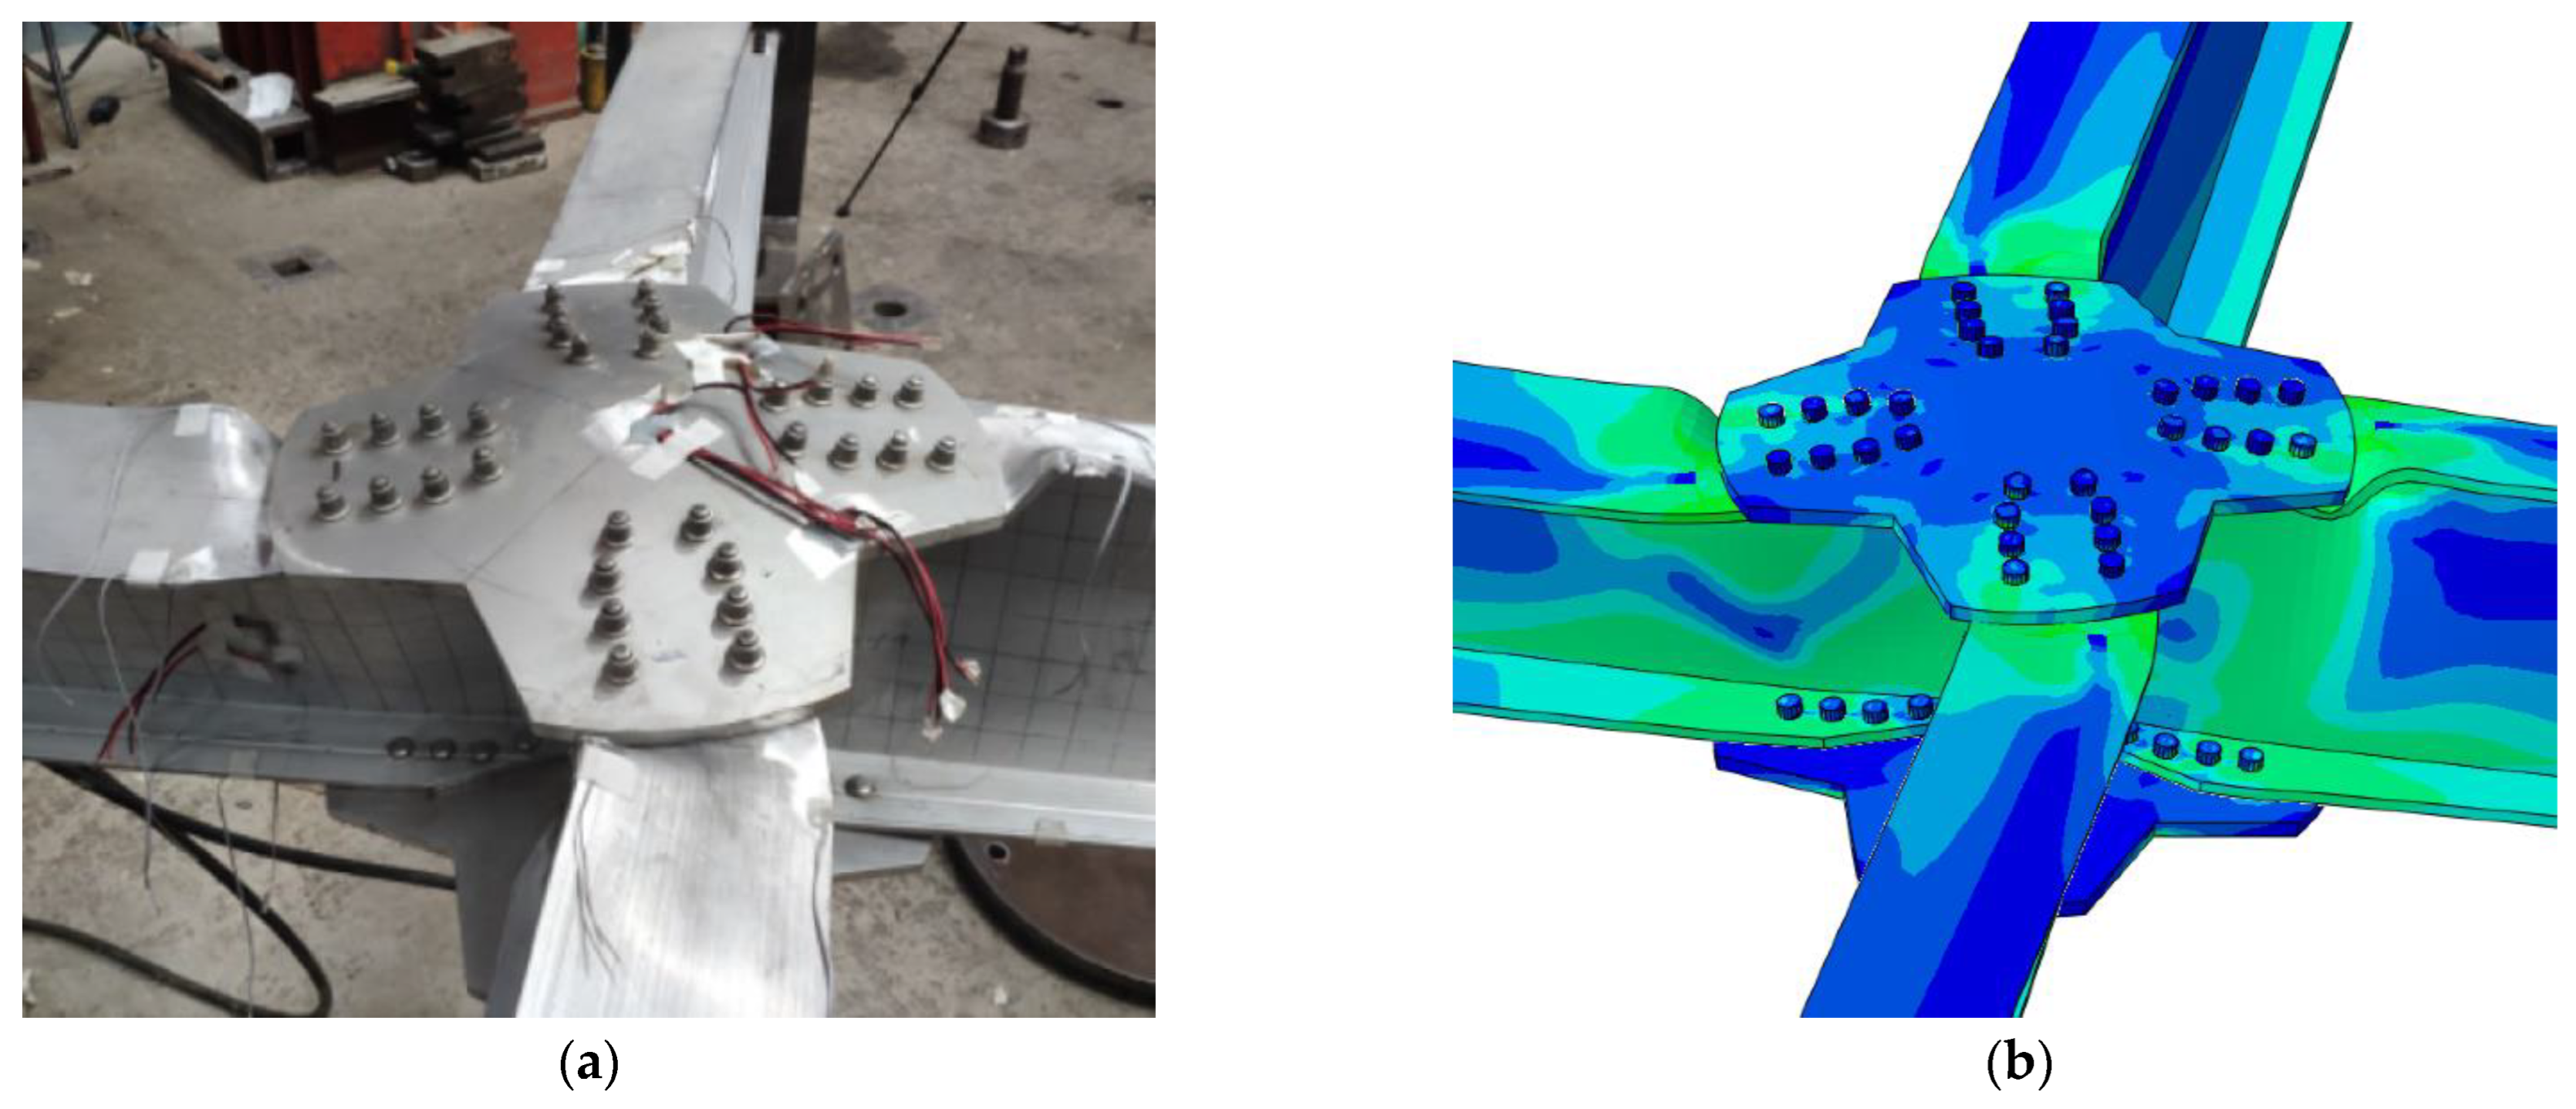
2.2. Simulation Verification
3. Orthogonal Experimental Design
4. Finite Element Model Establishment
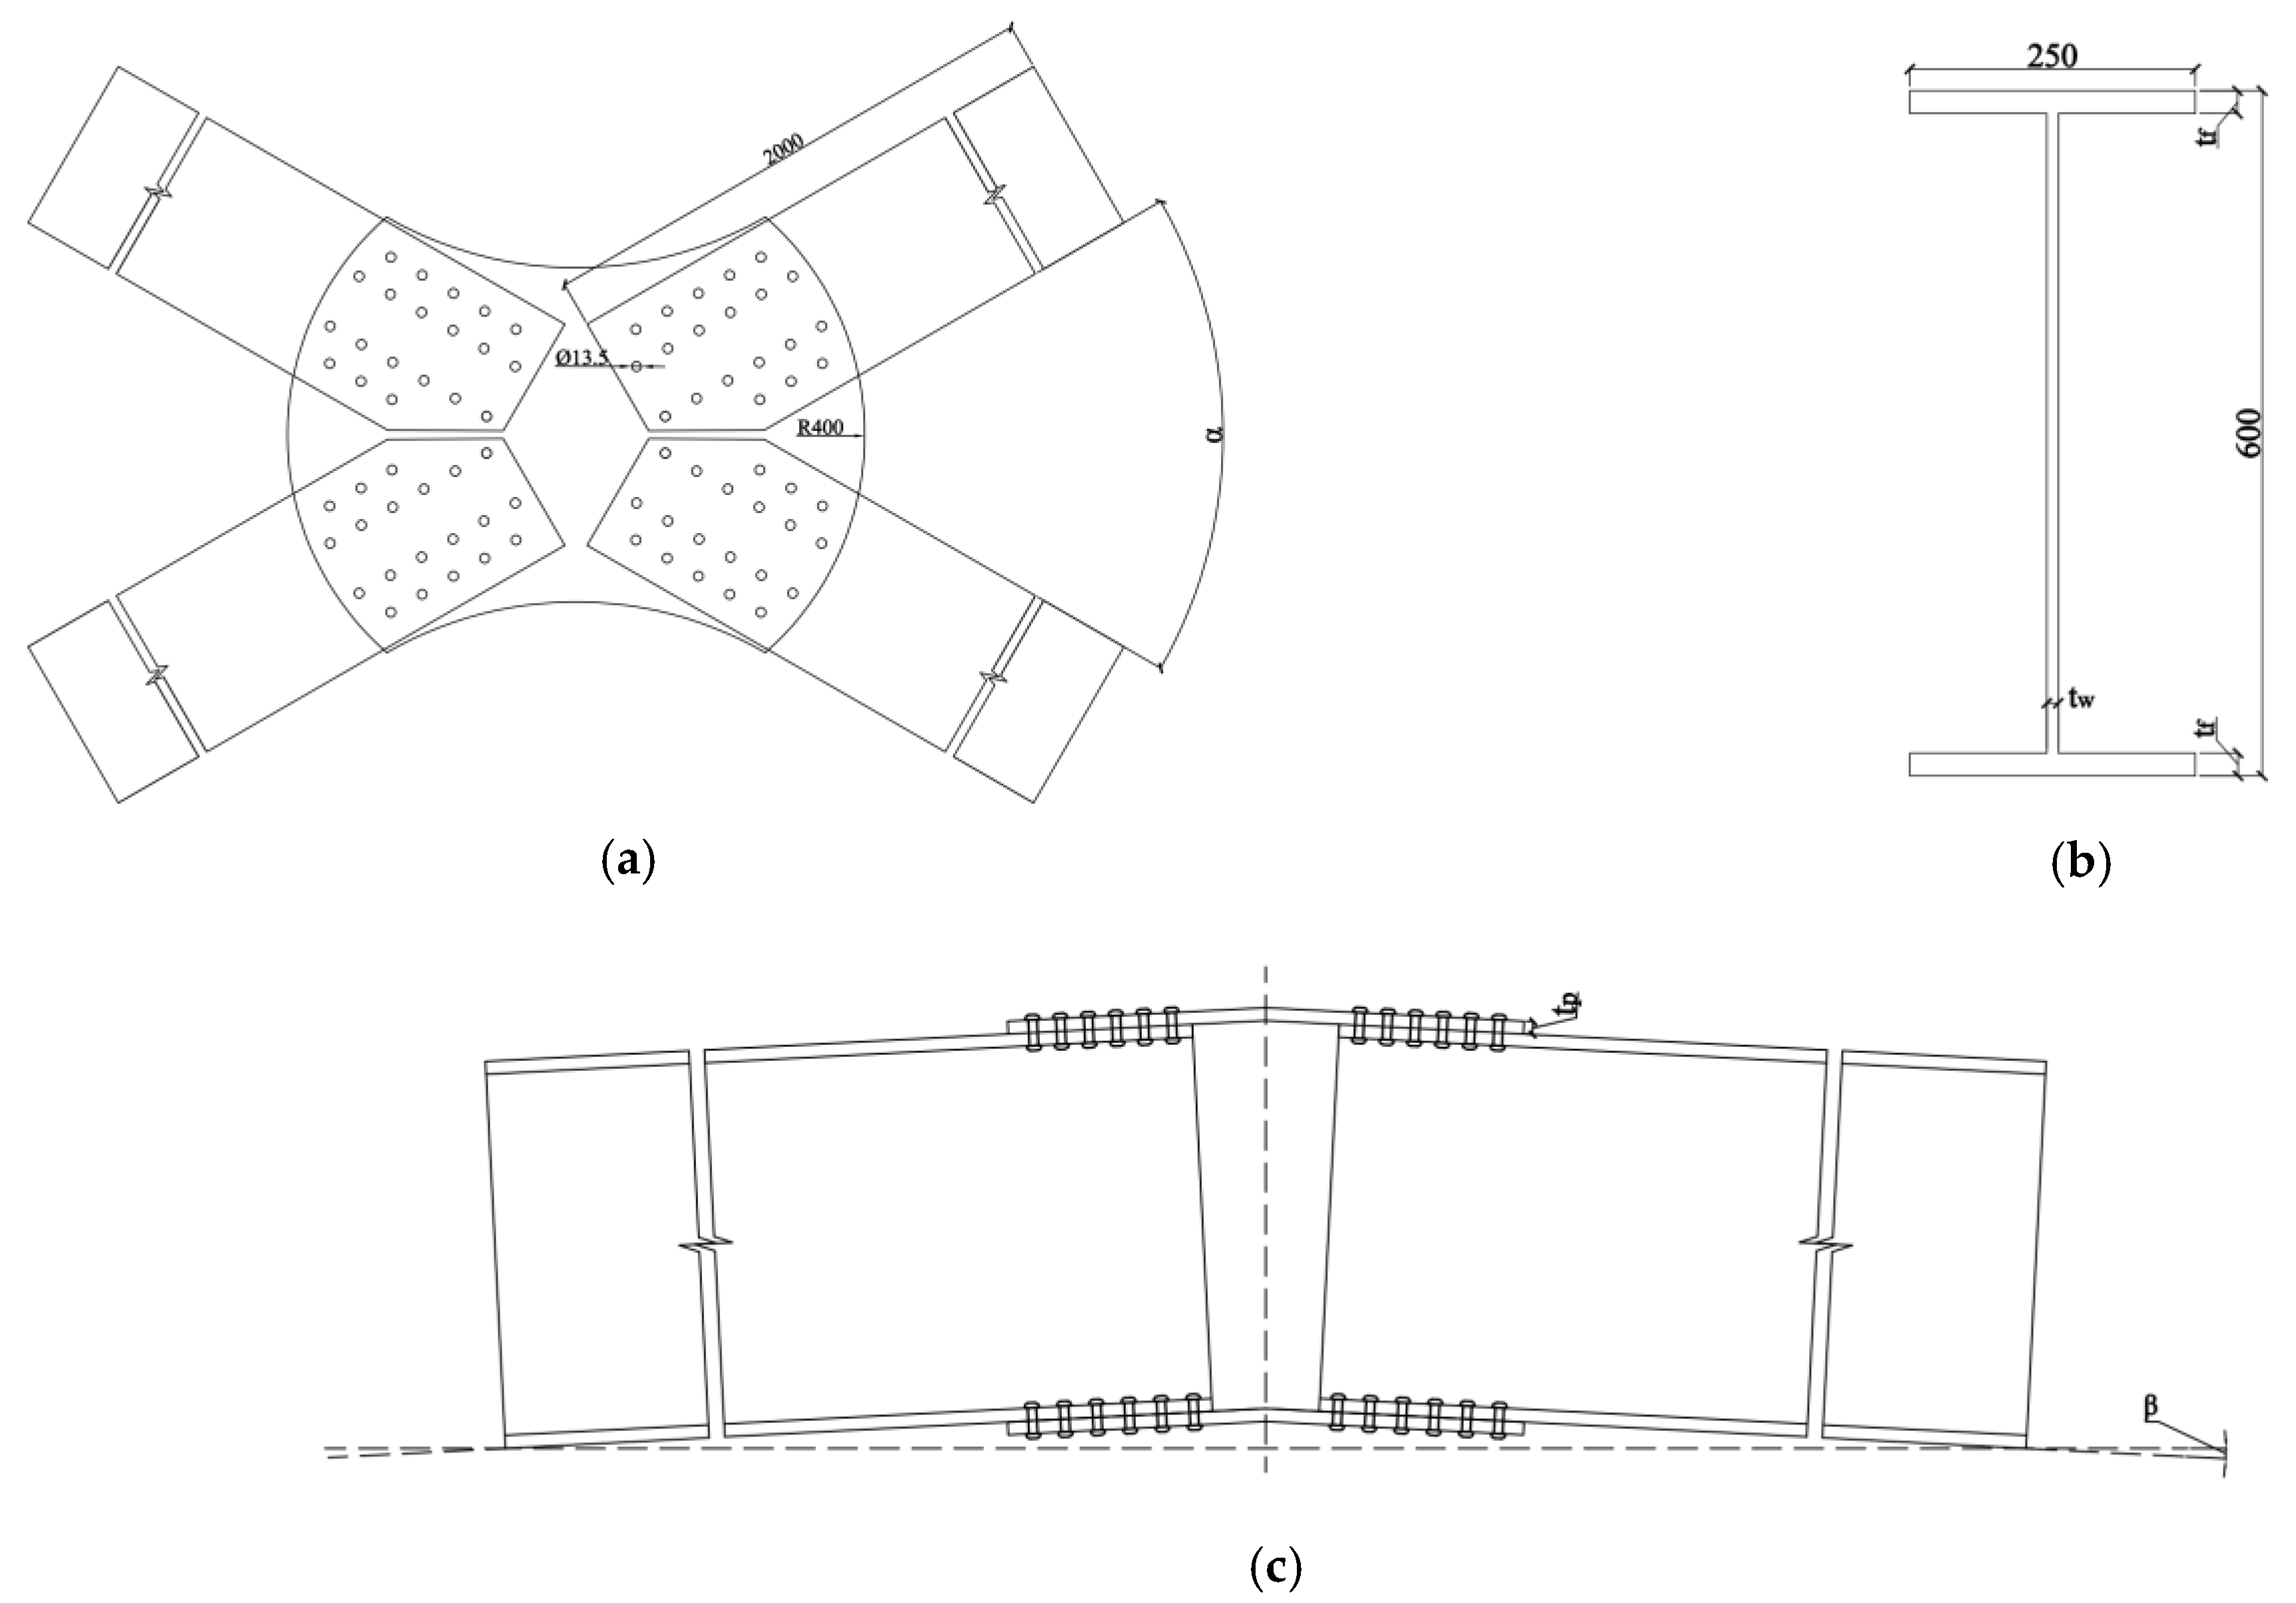
4.1. Geometric Parameters
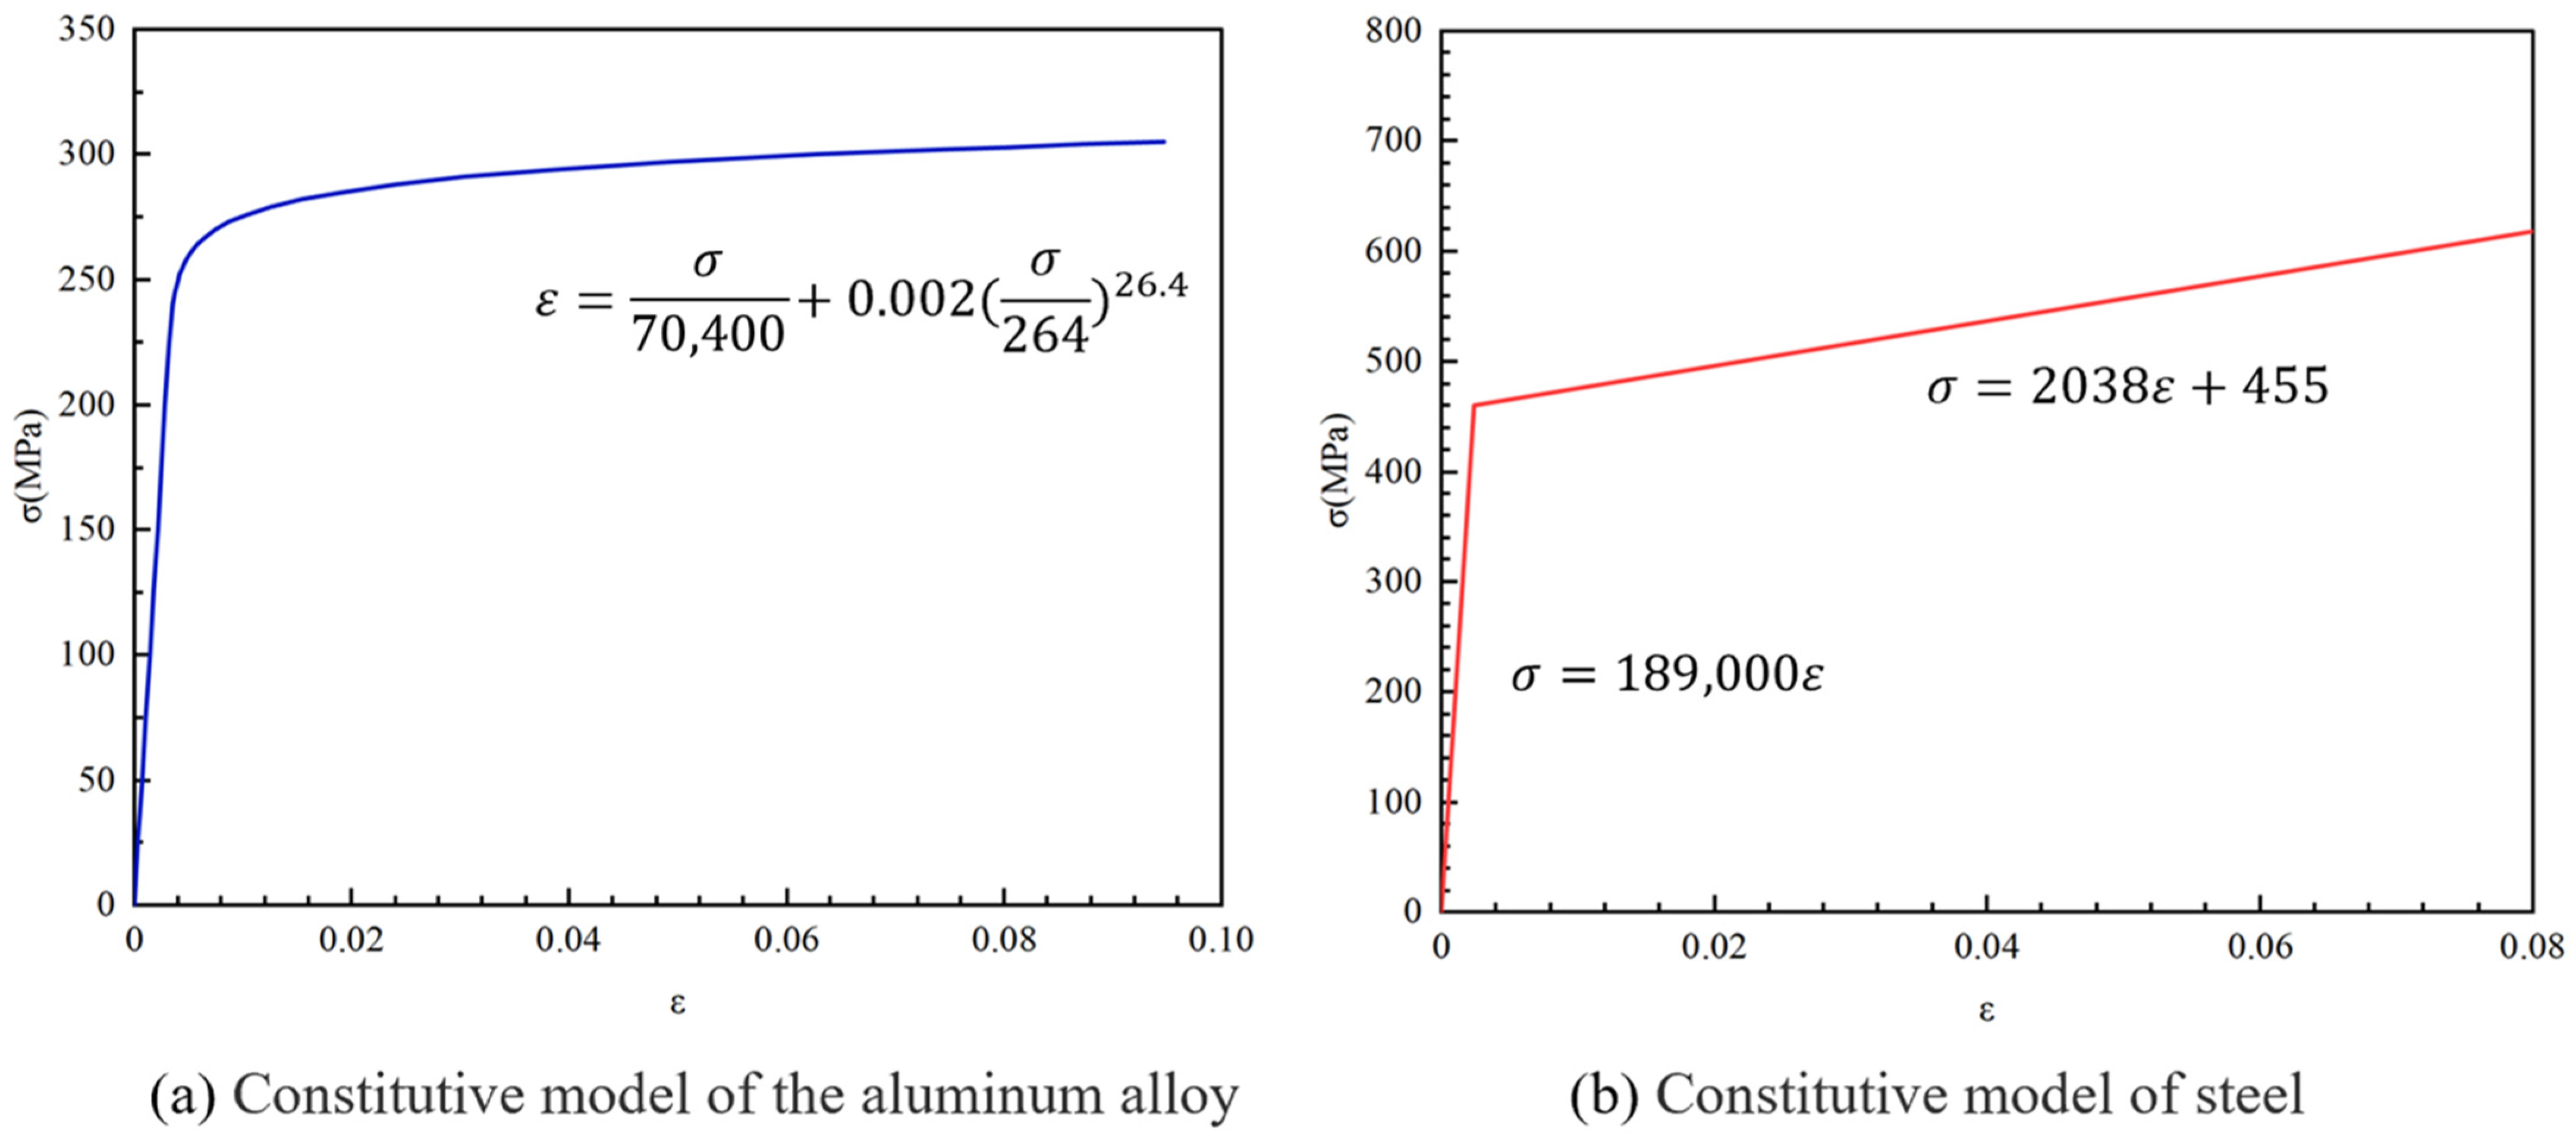
4.2. Material Model
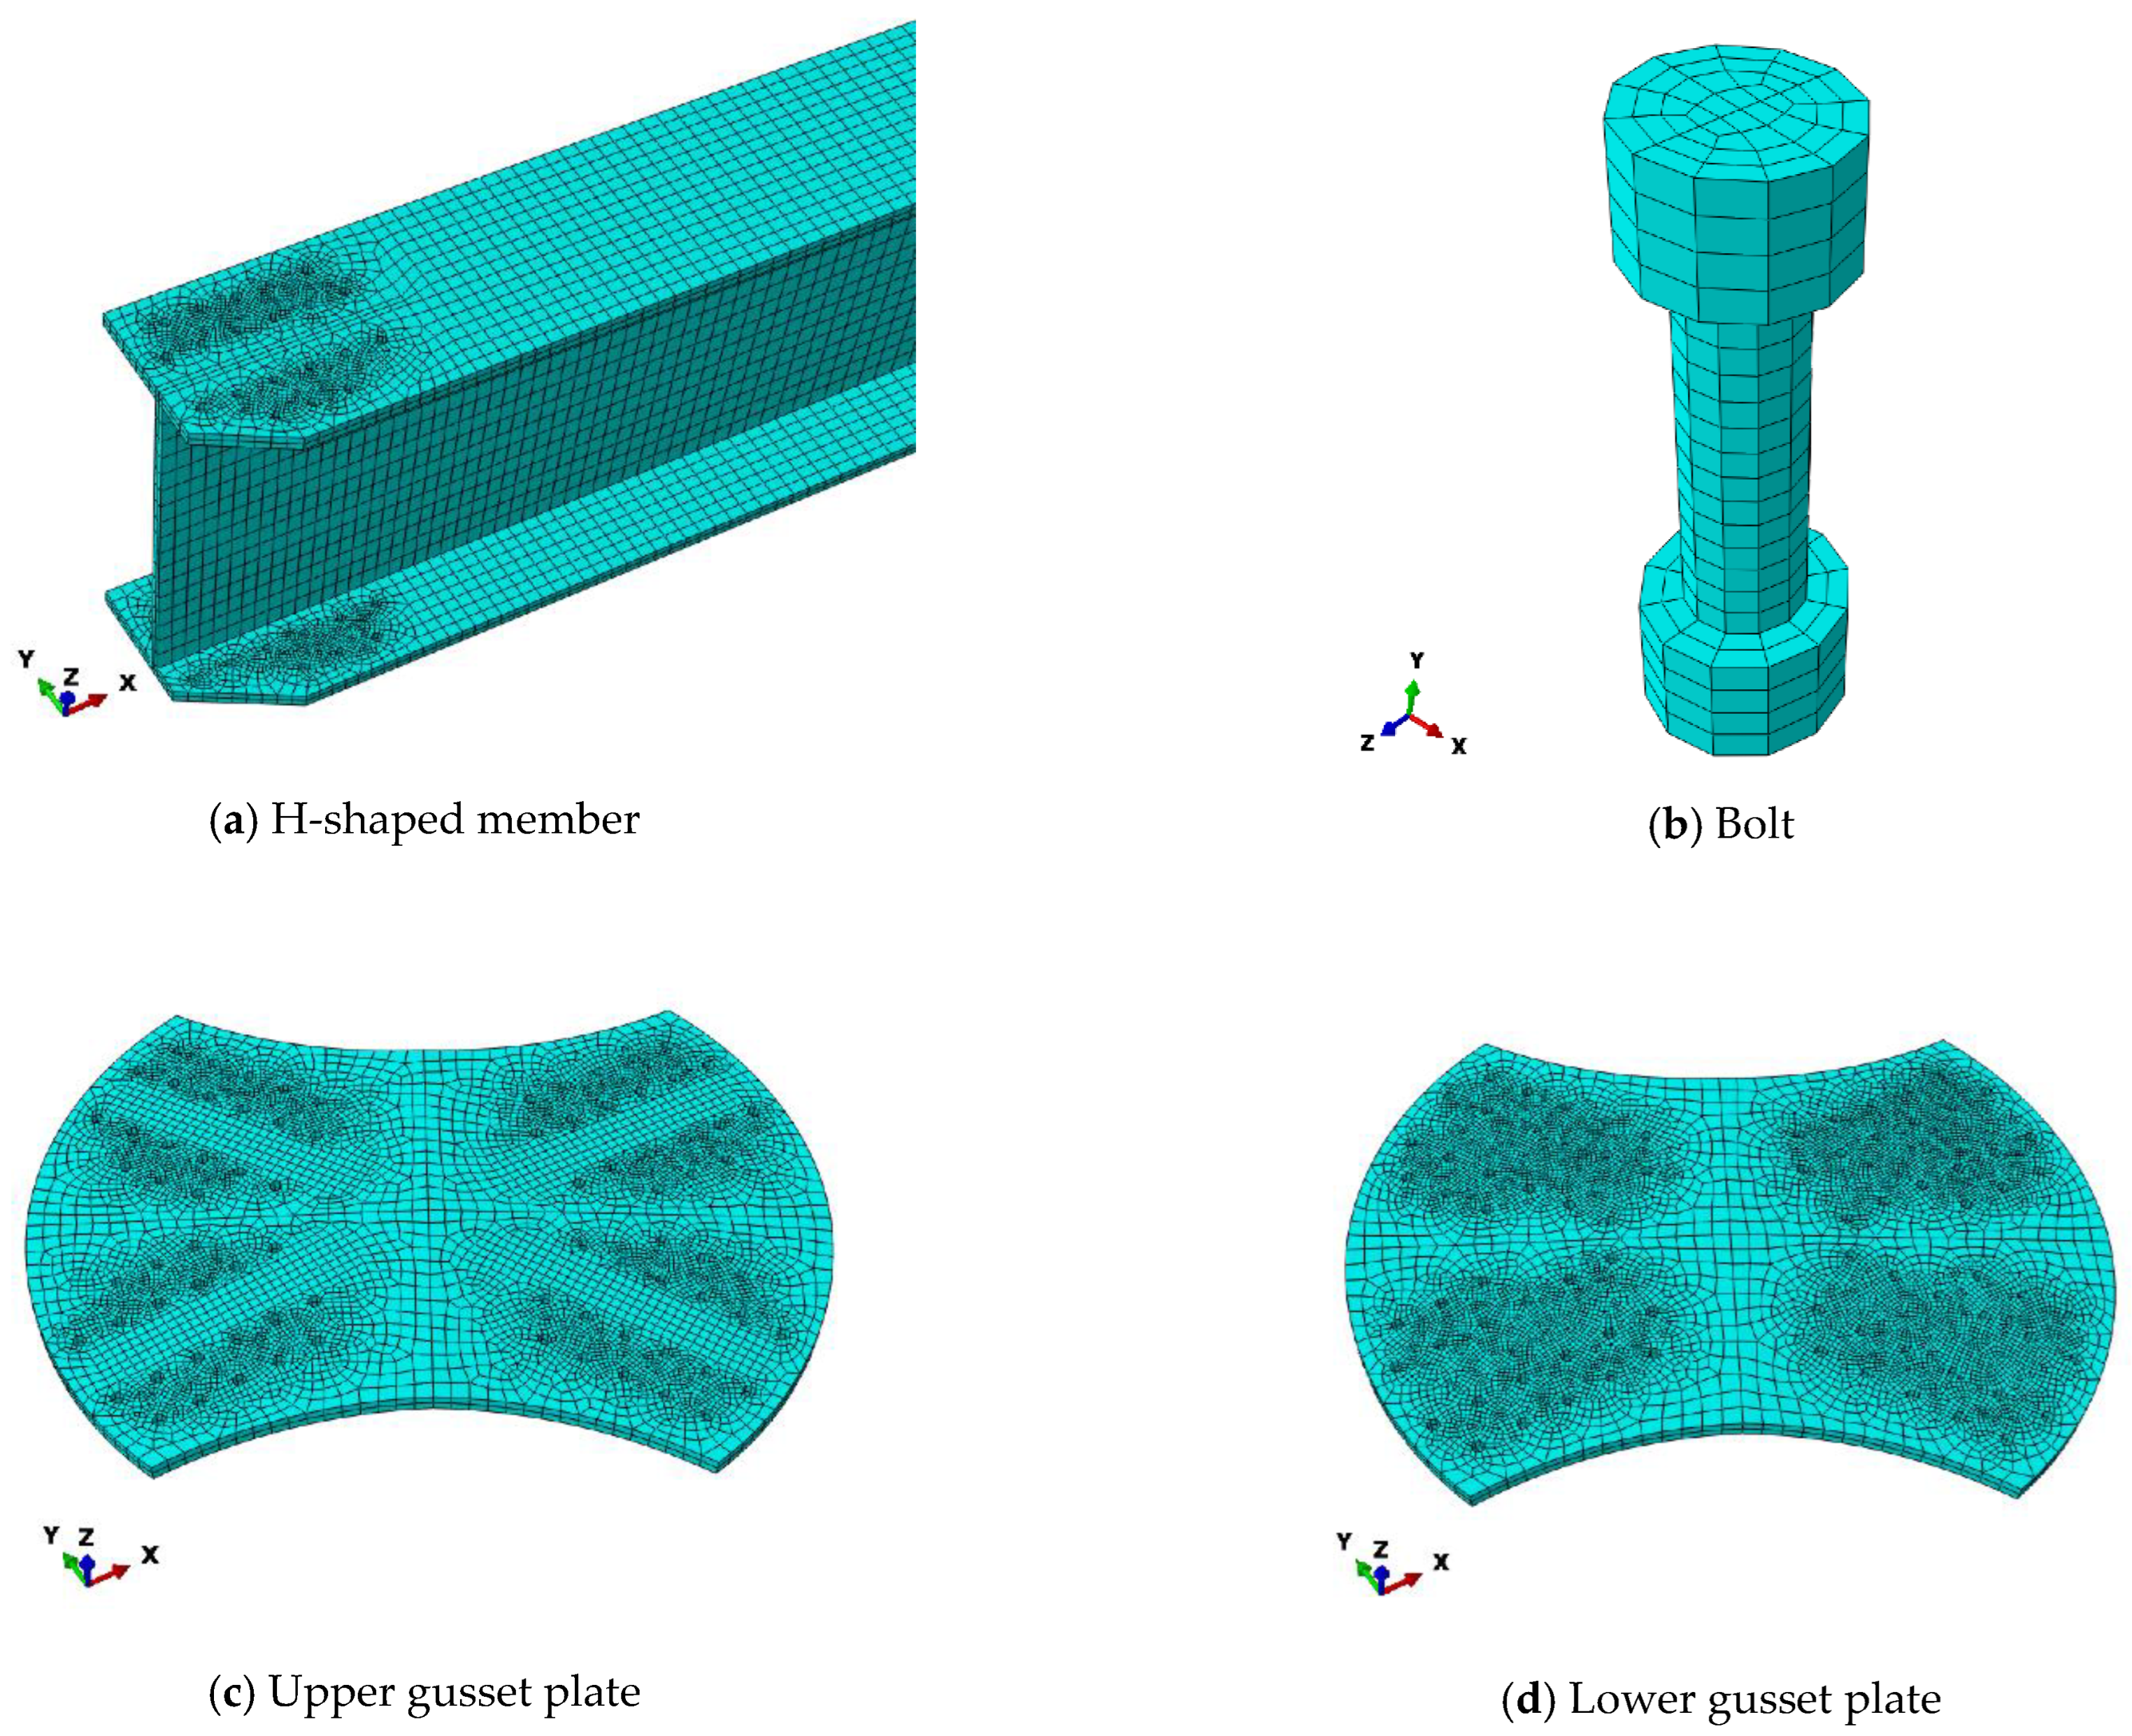
4.3. Element Settings and Mesh Division
4.4. Contact and Analysis Steps
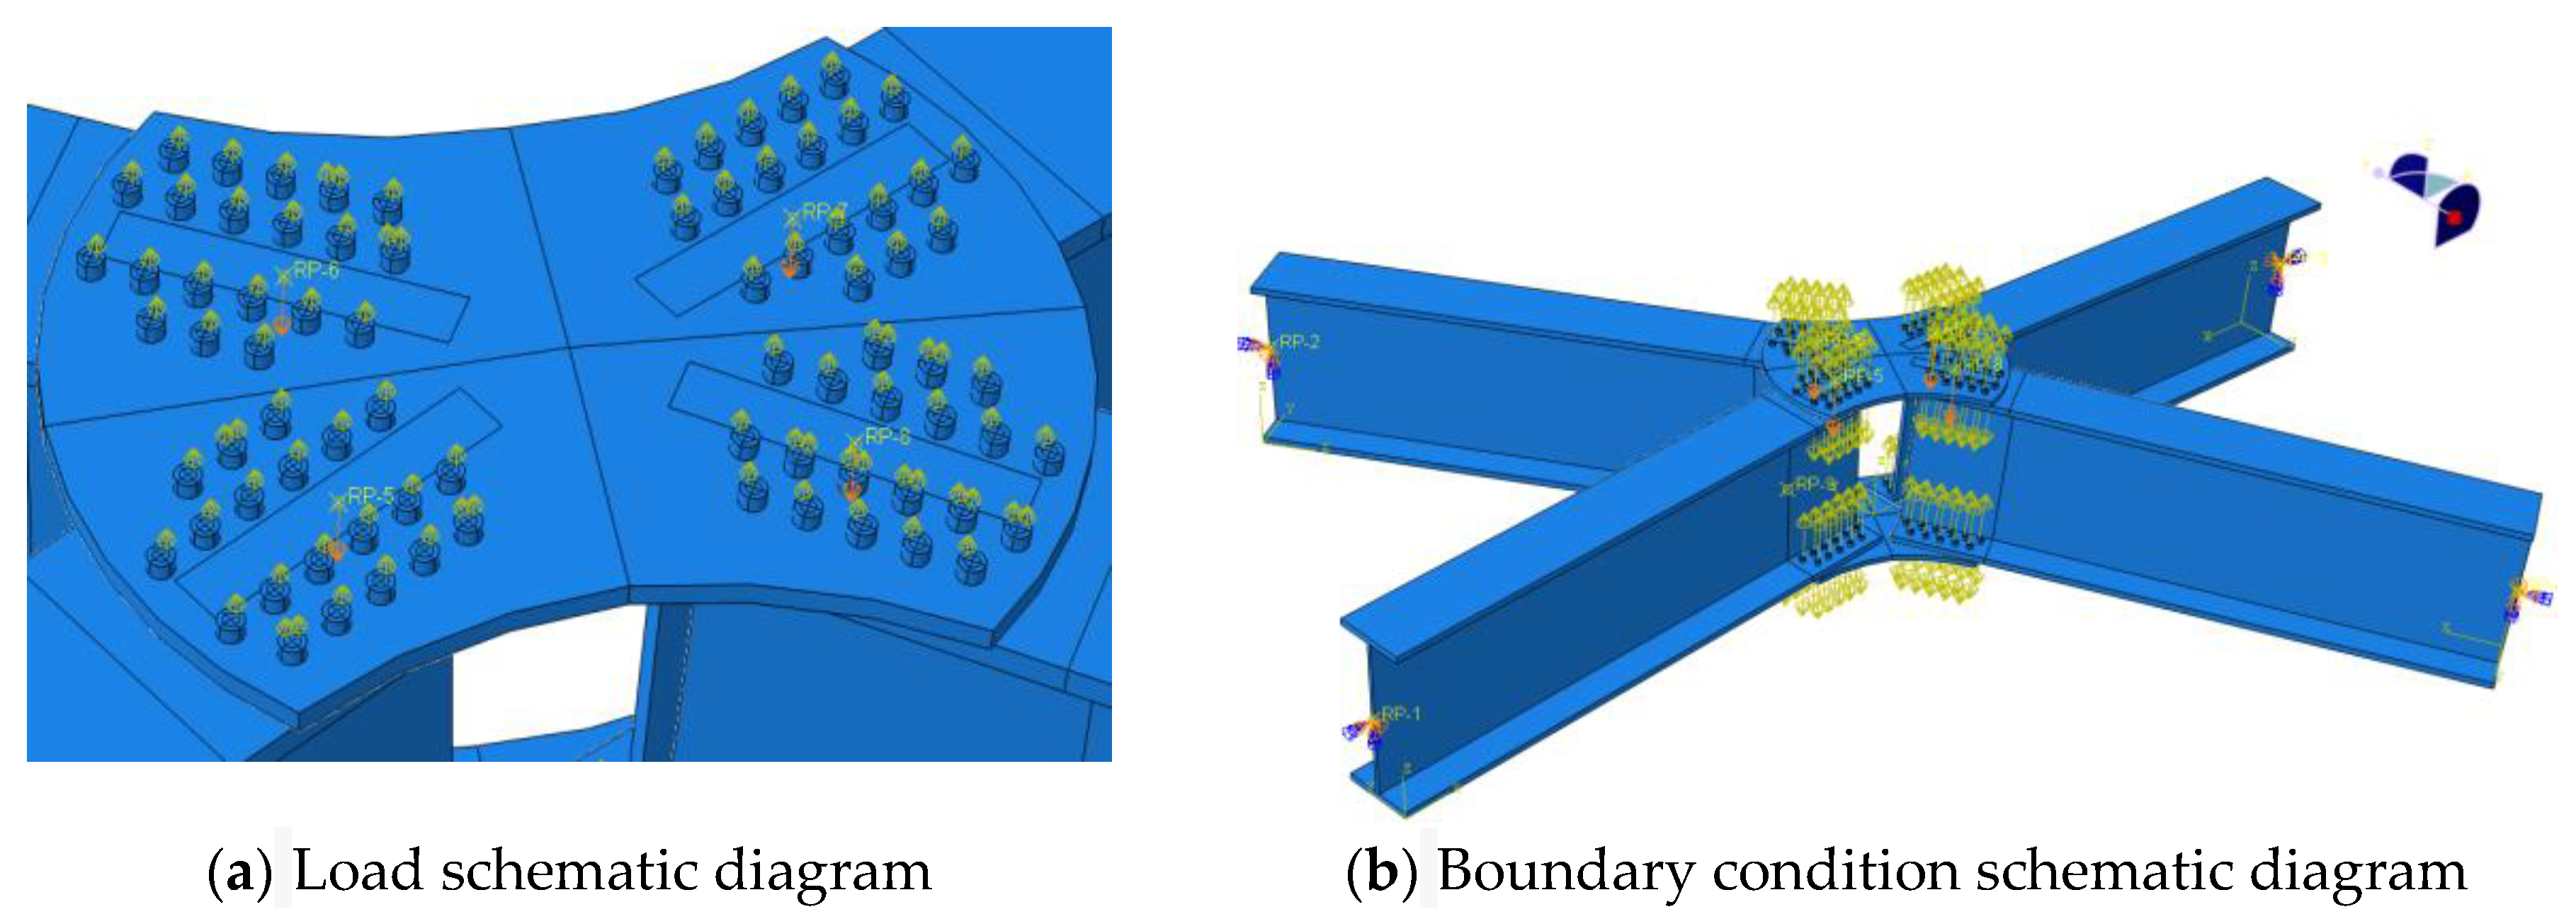
4.5. Boundary Conditions and Loading Scheme
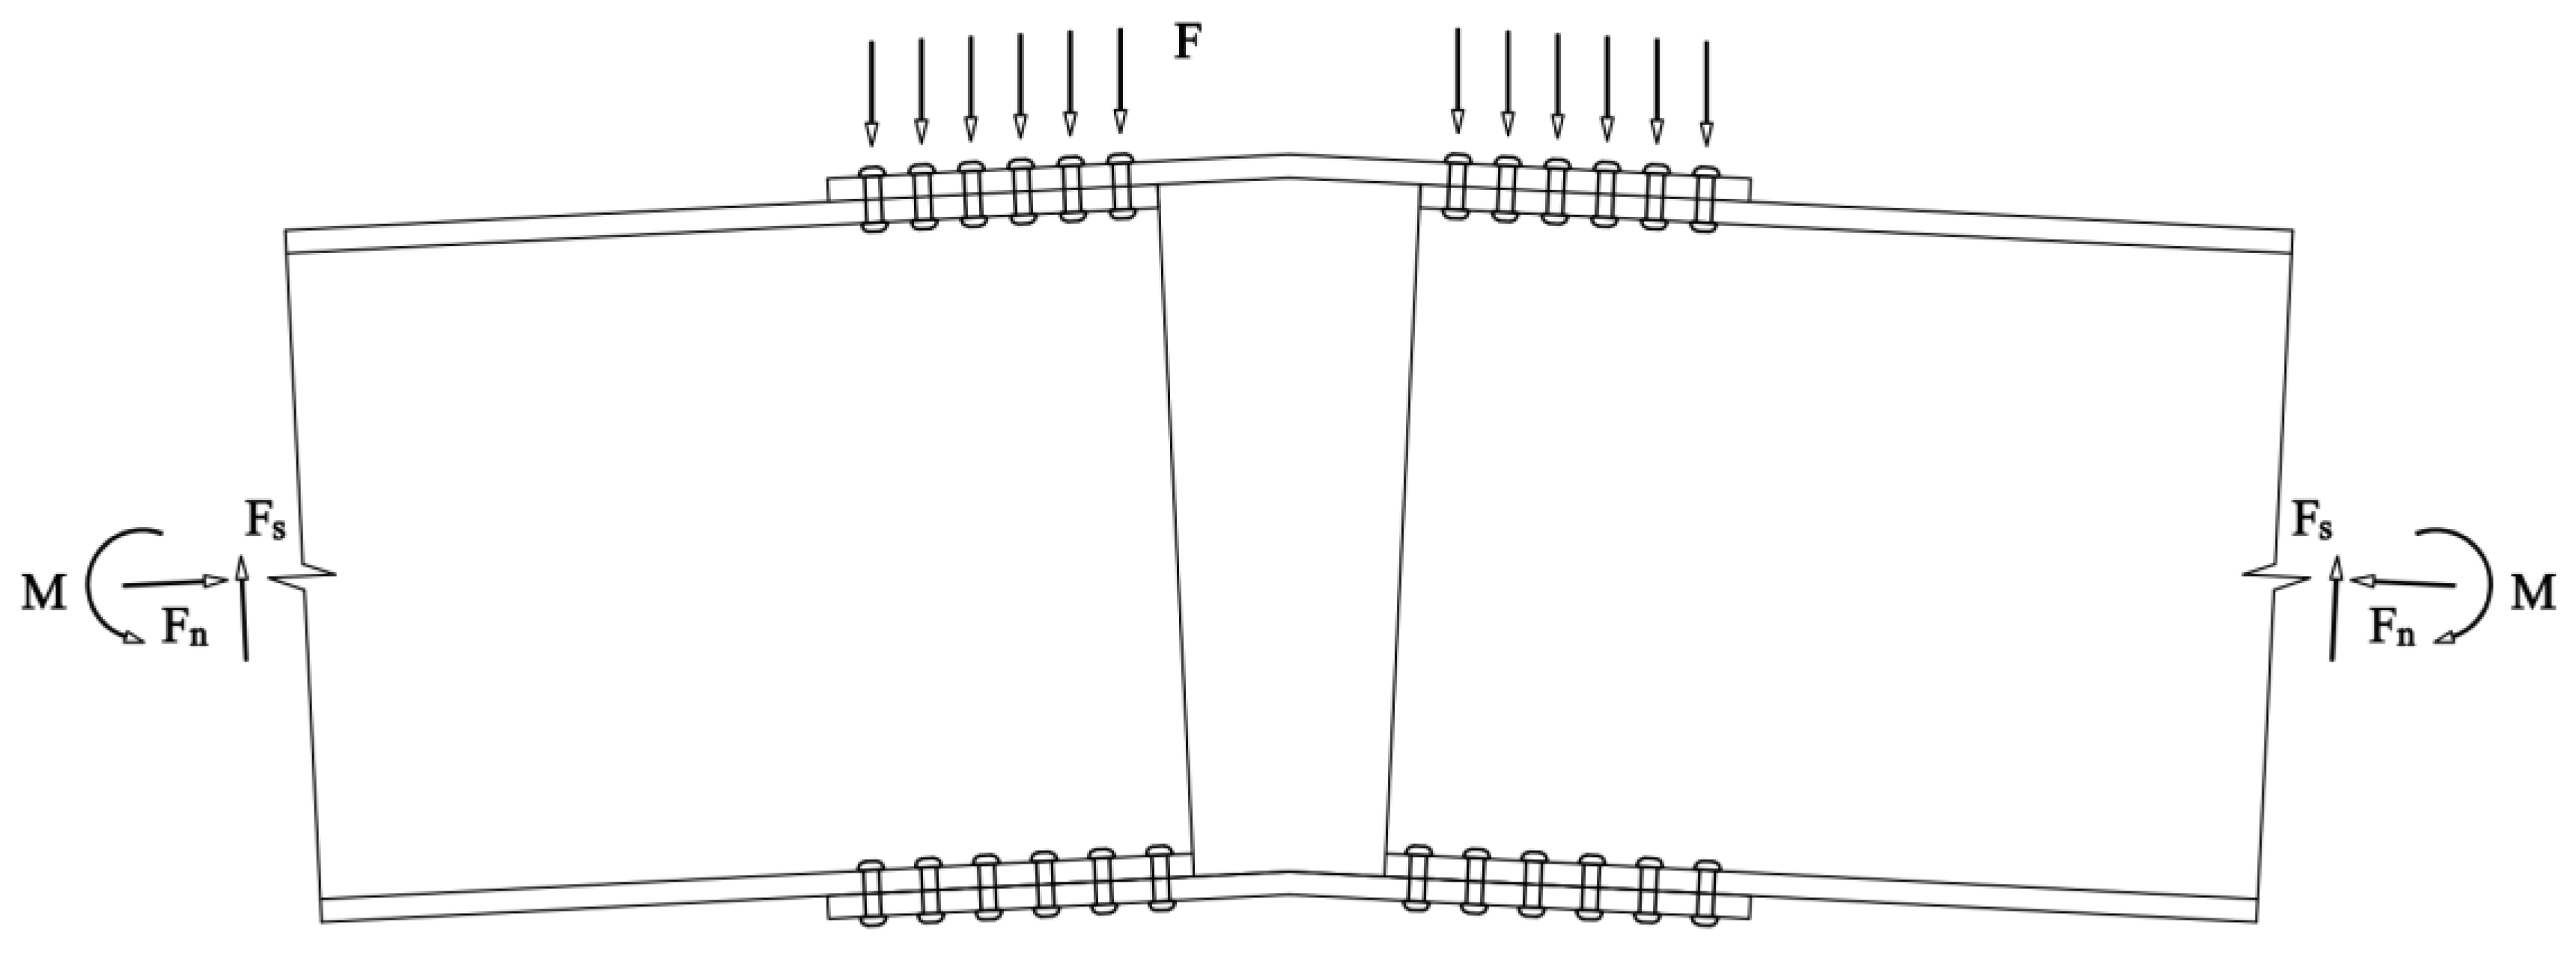
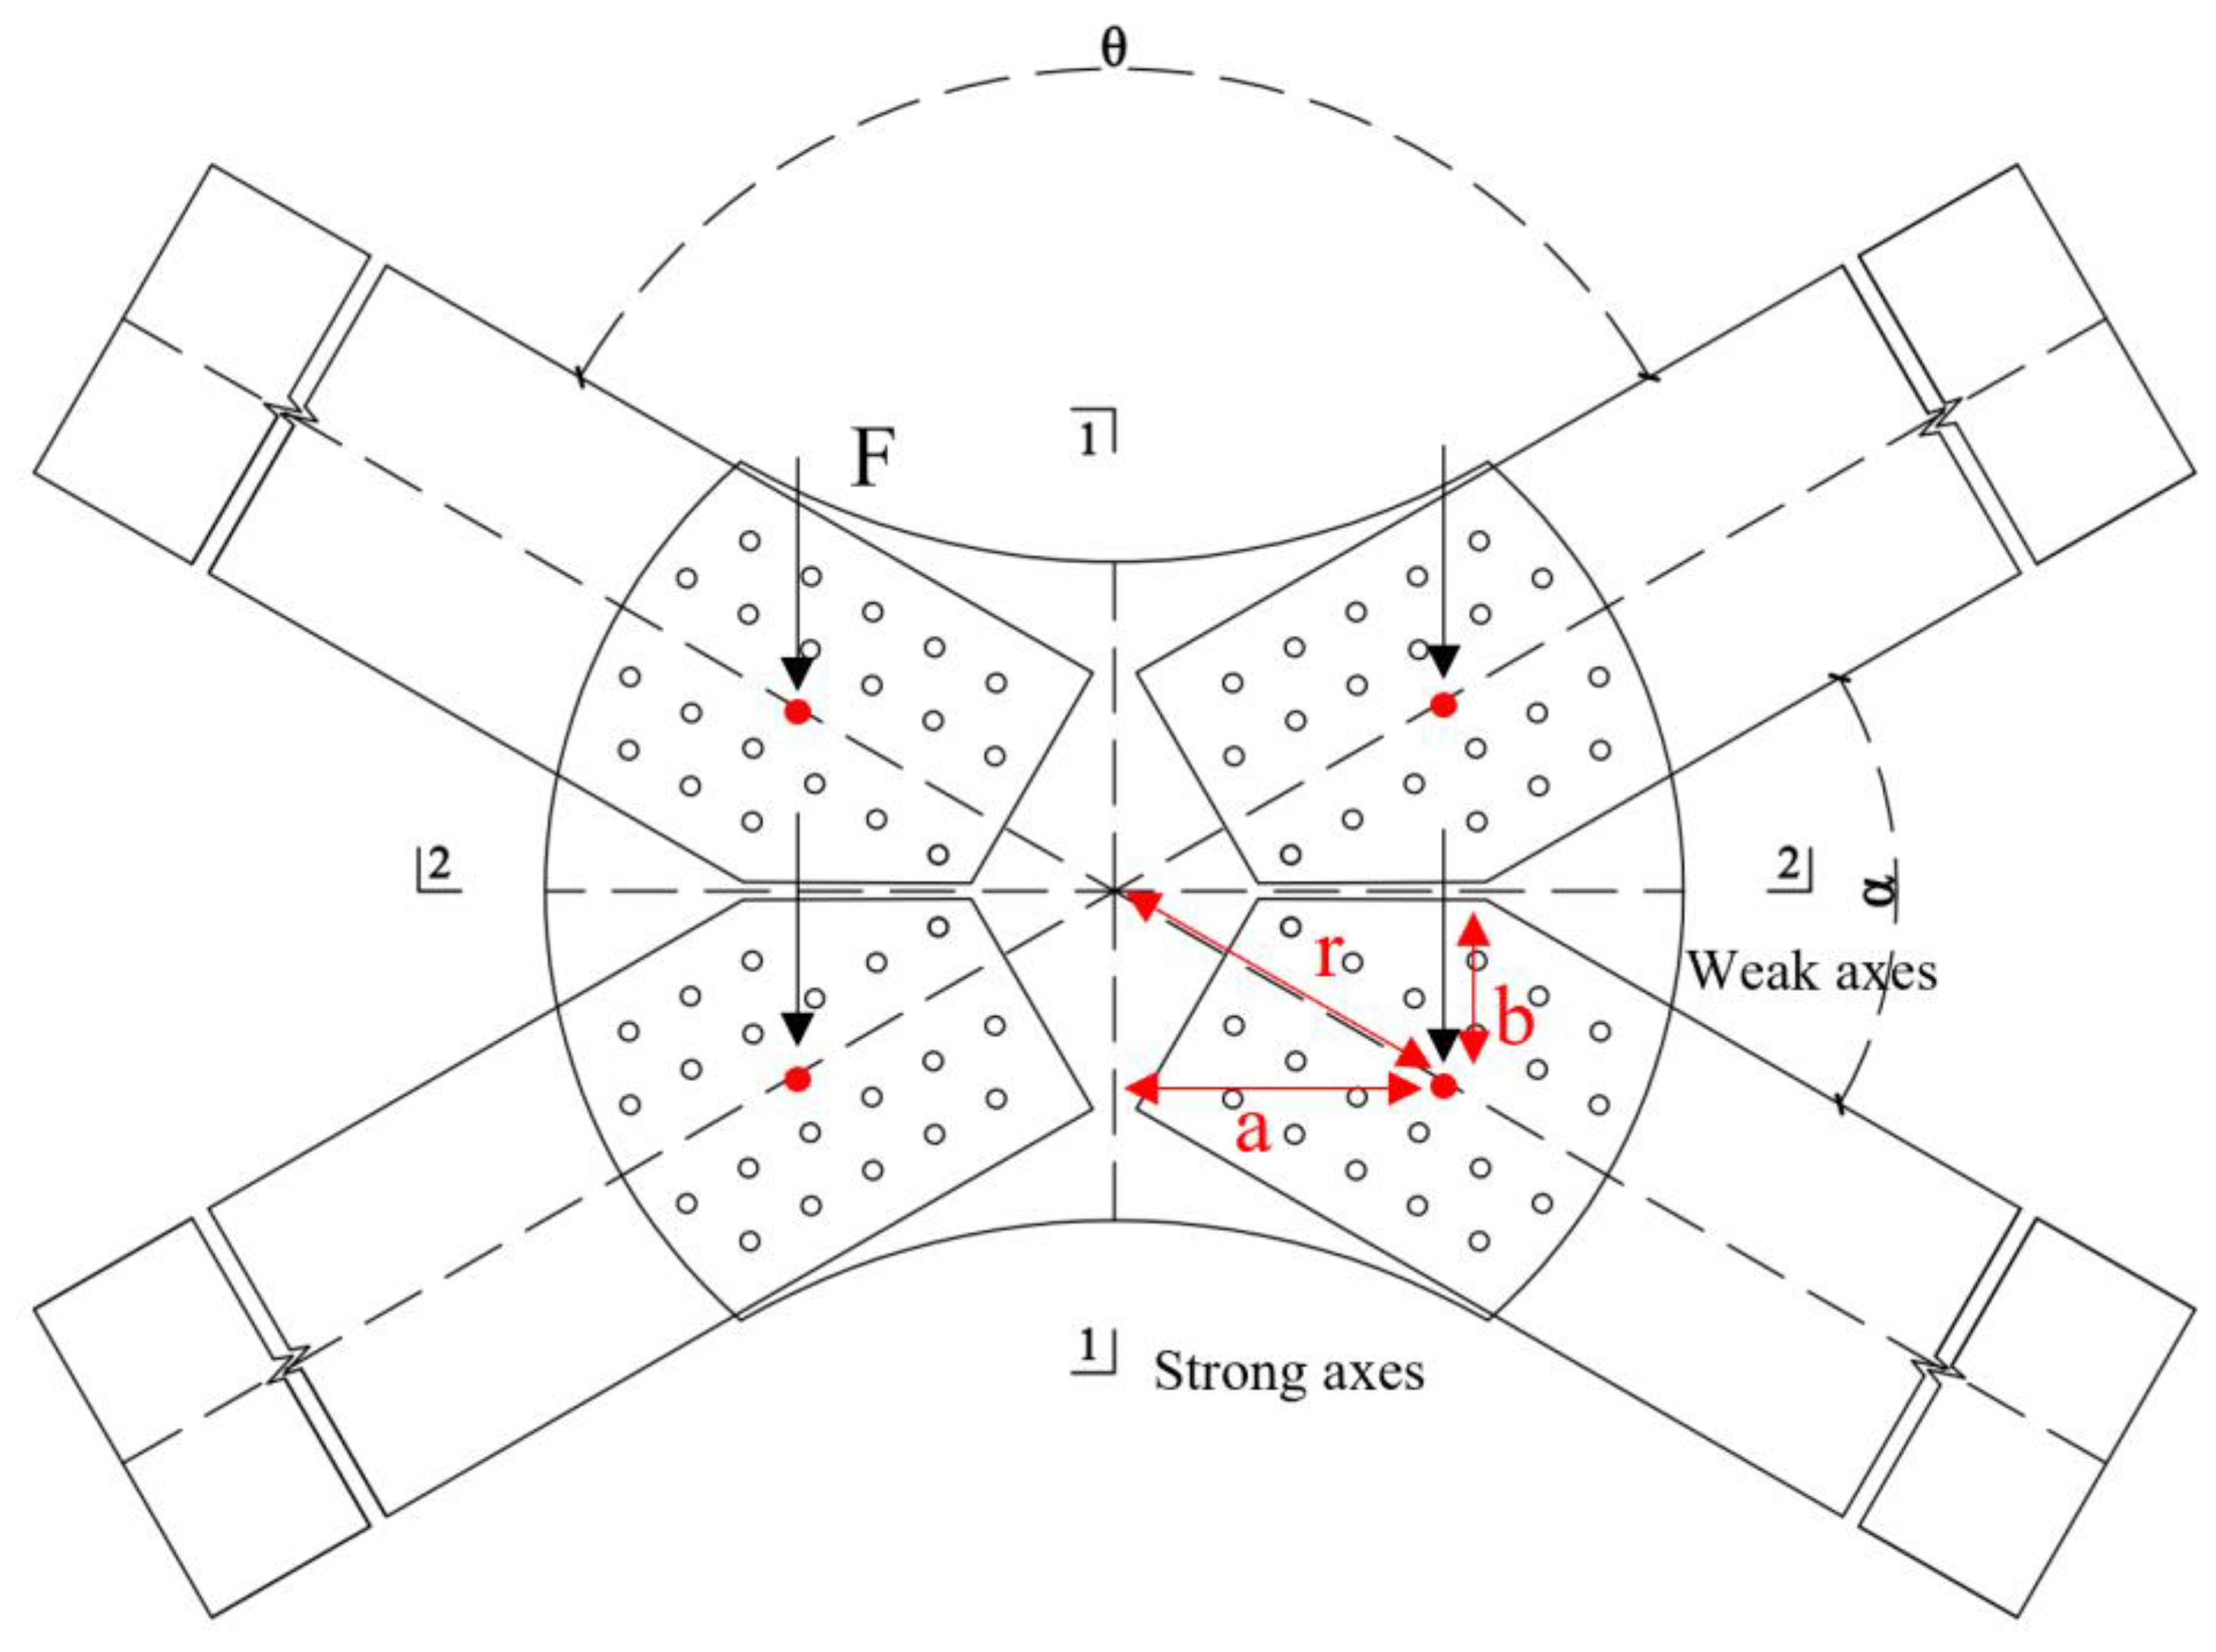
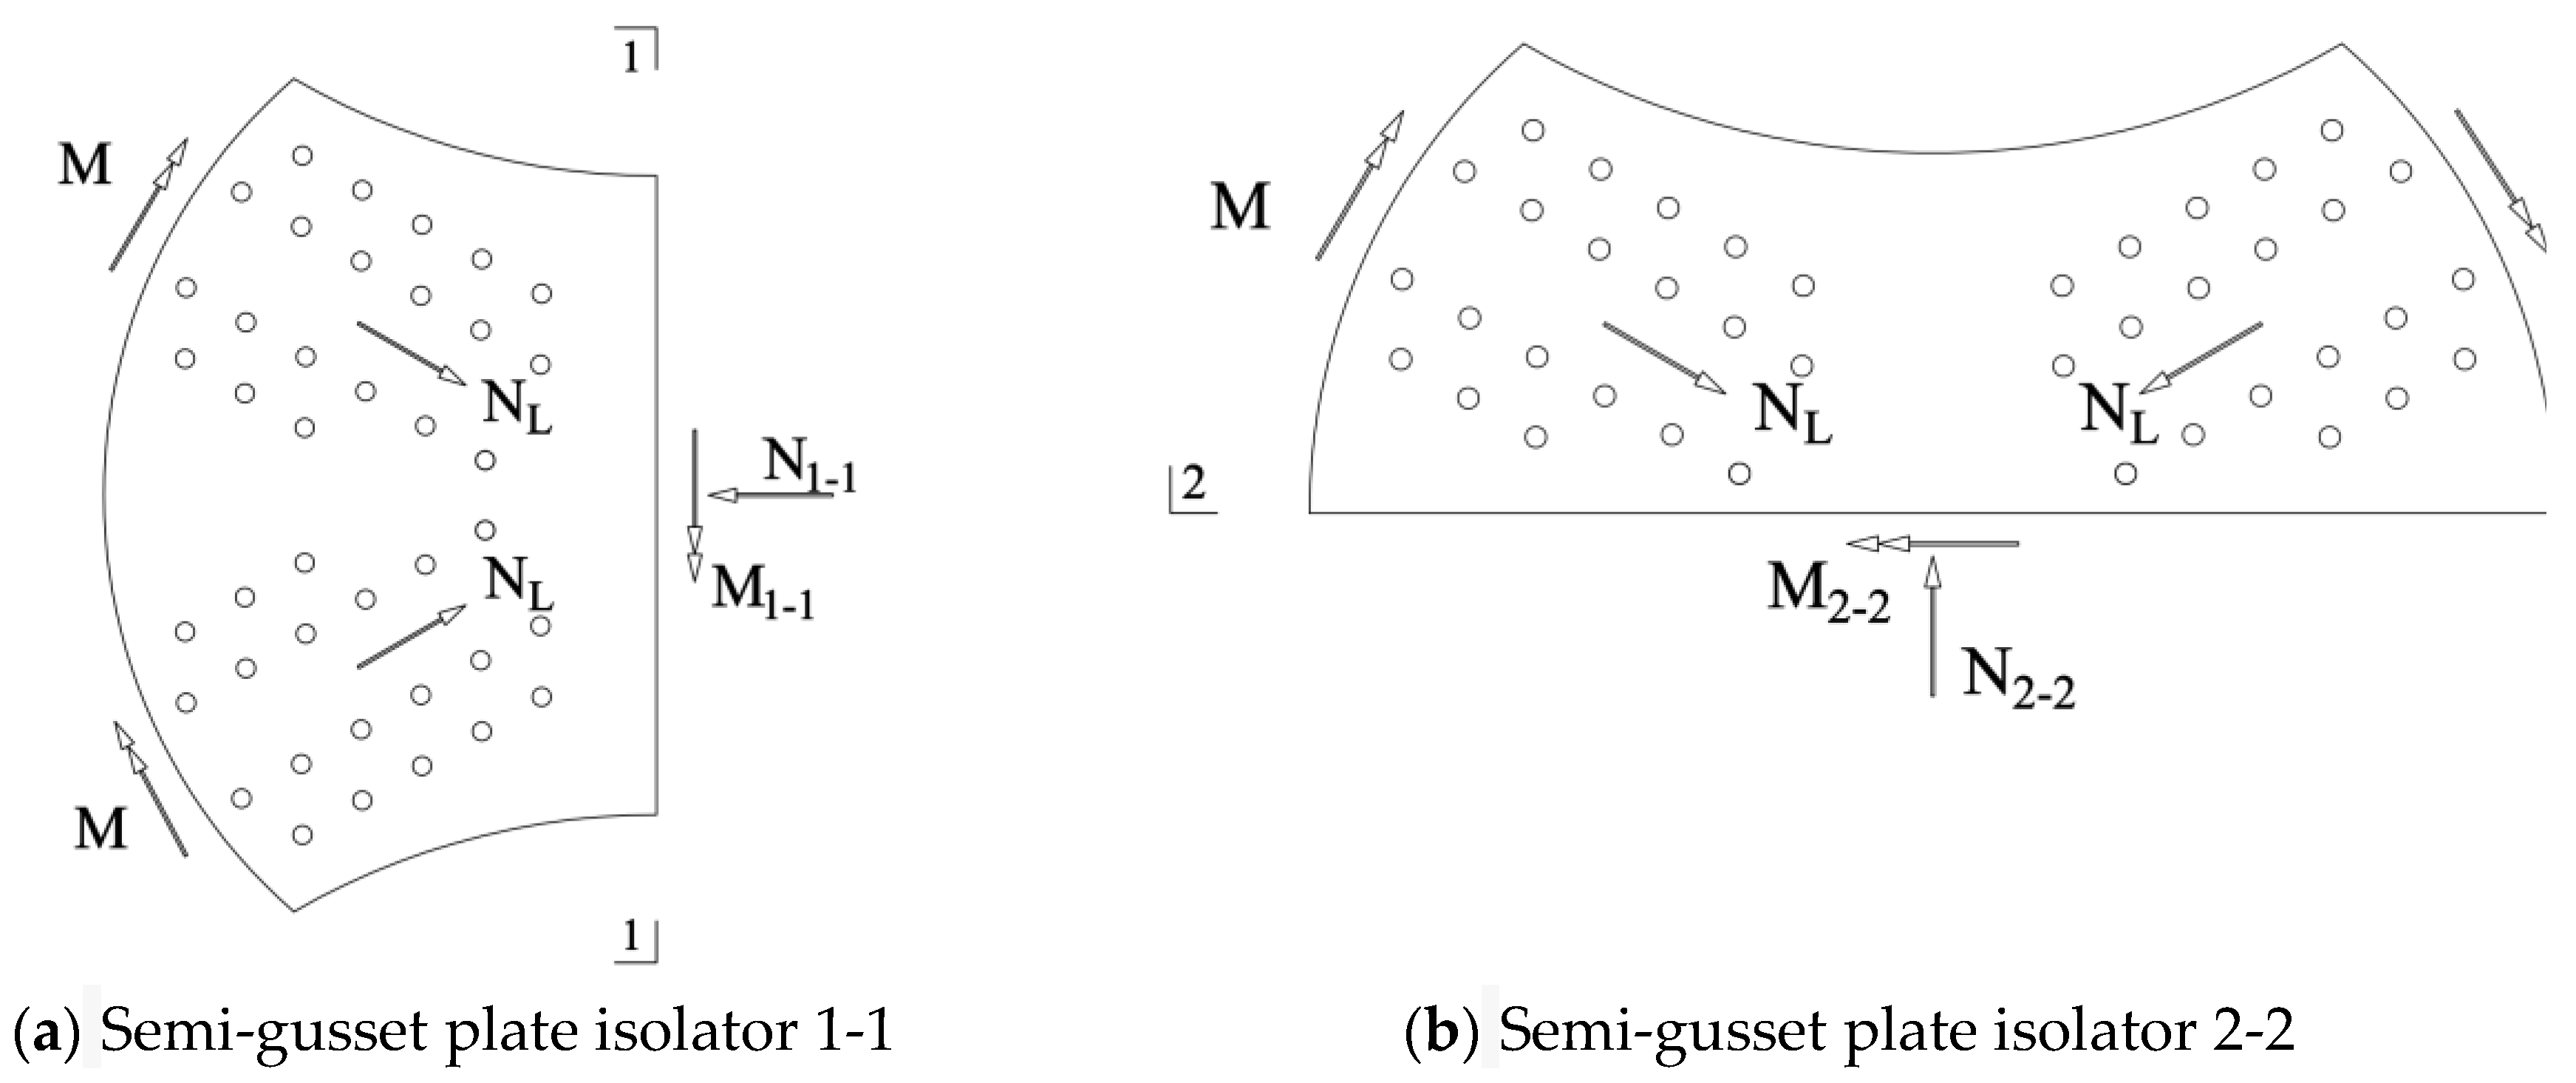
5. Theoretical Analysis
6. Result Analysis
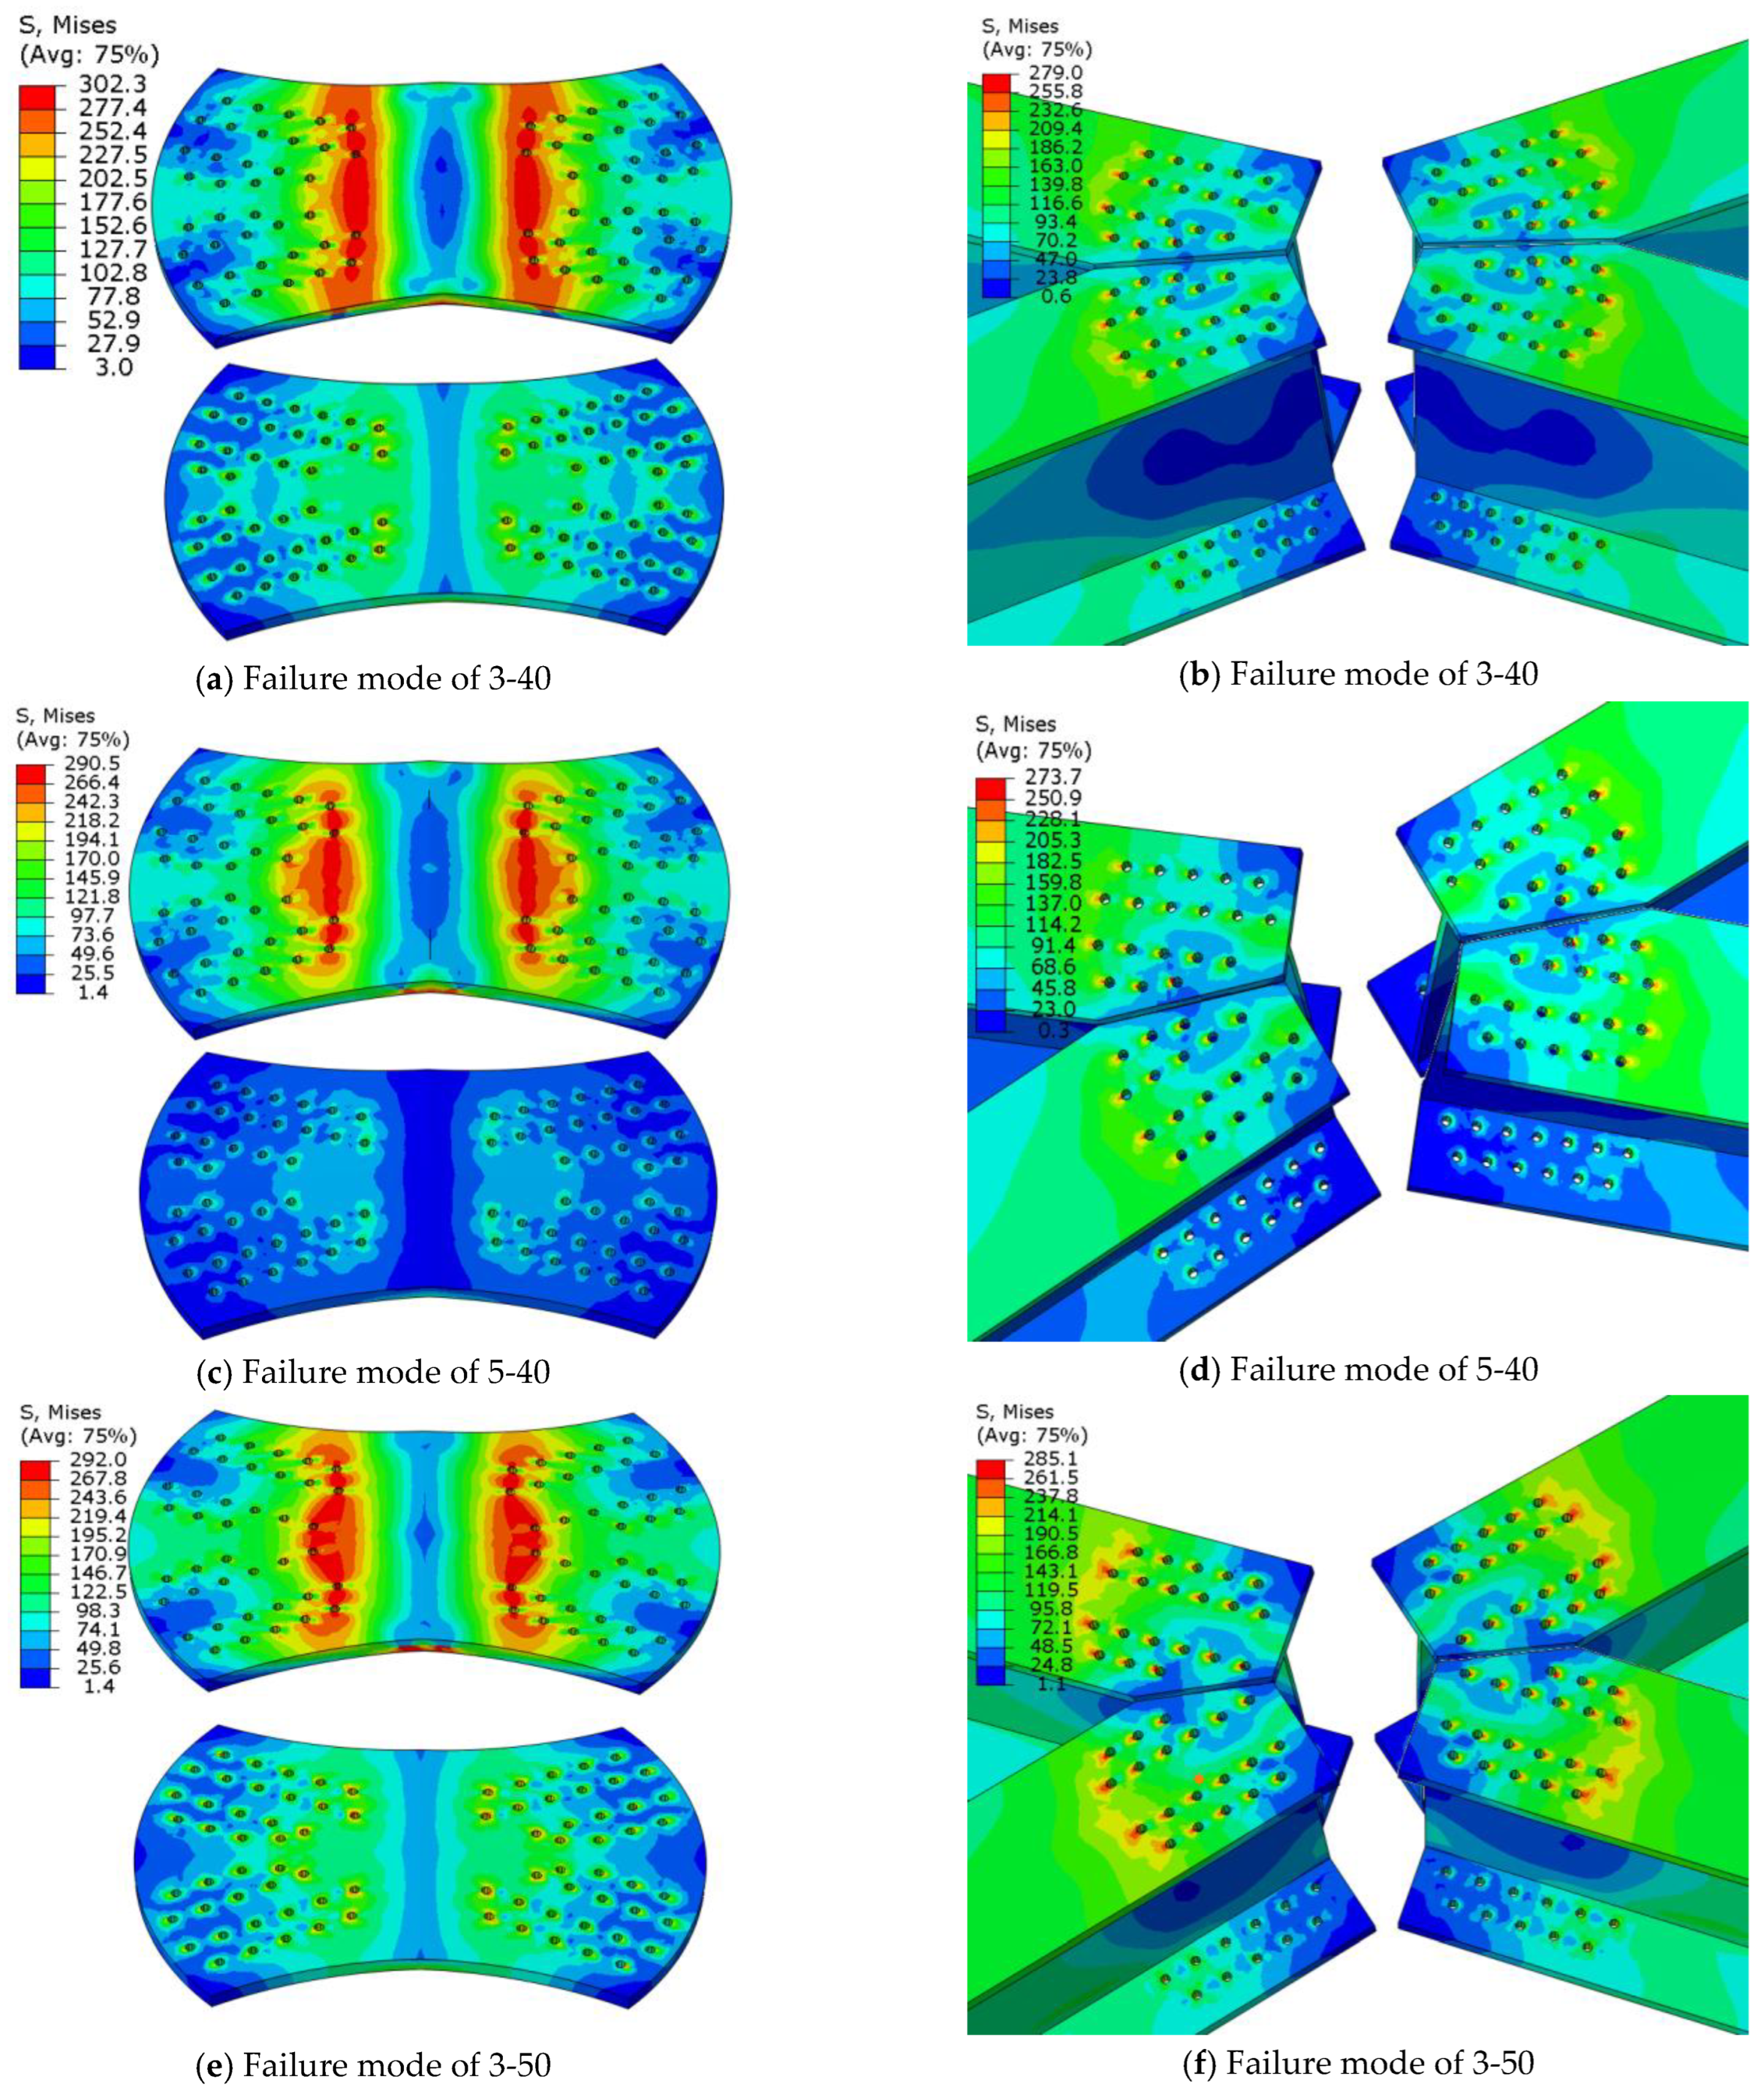
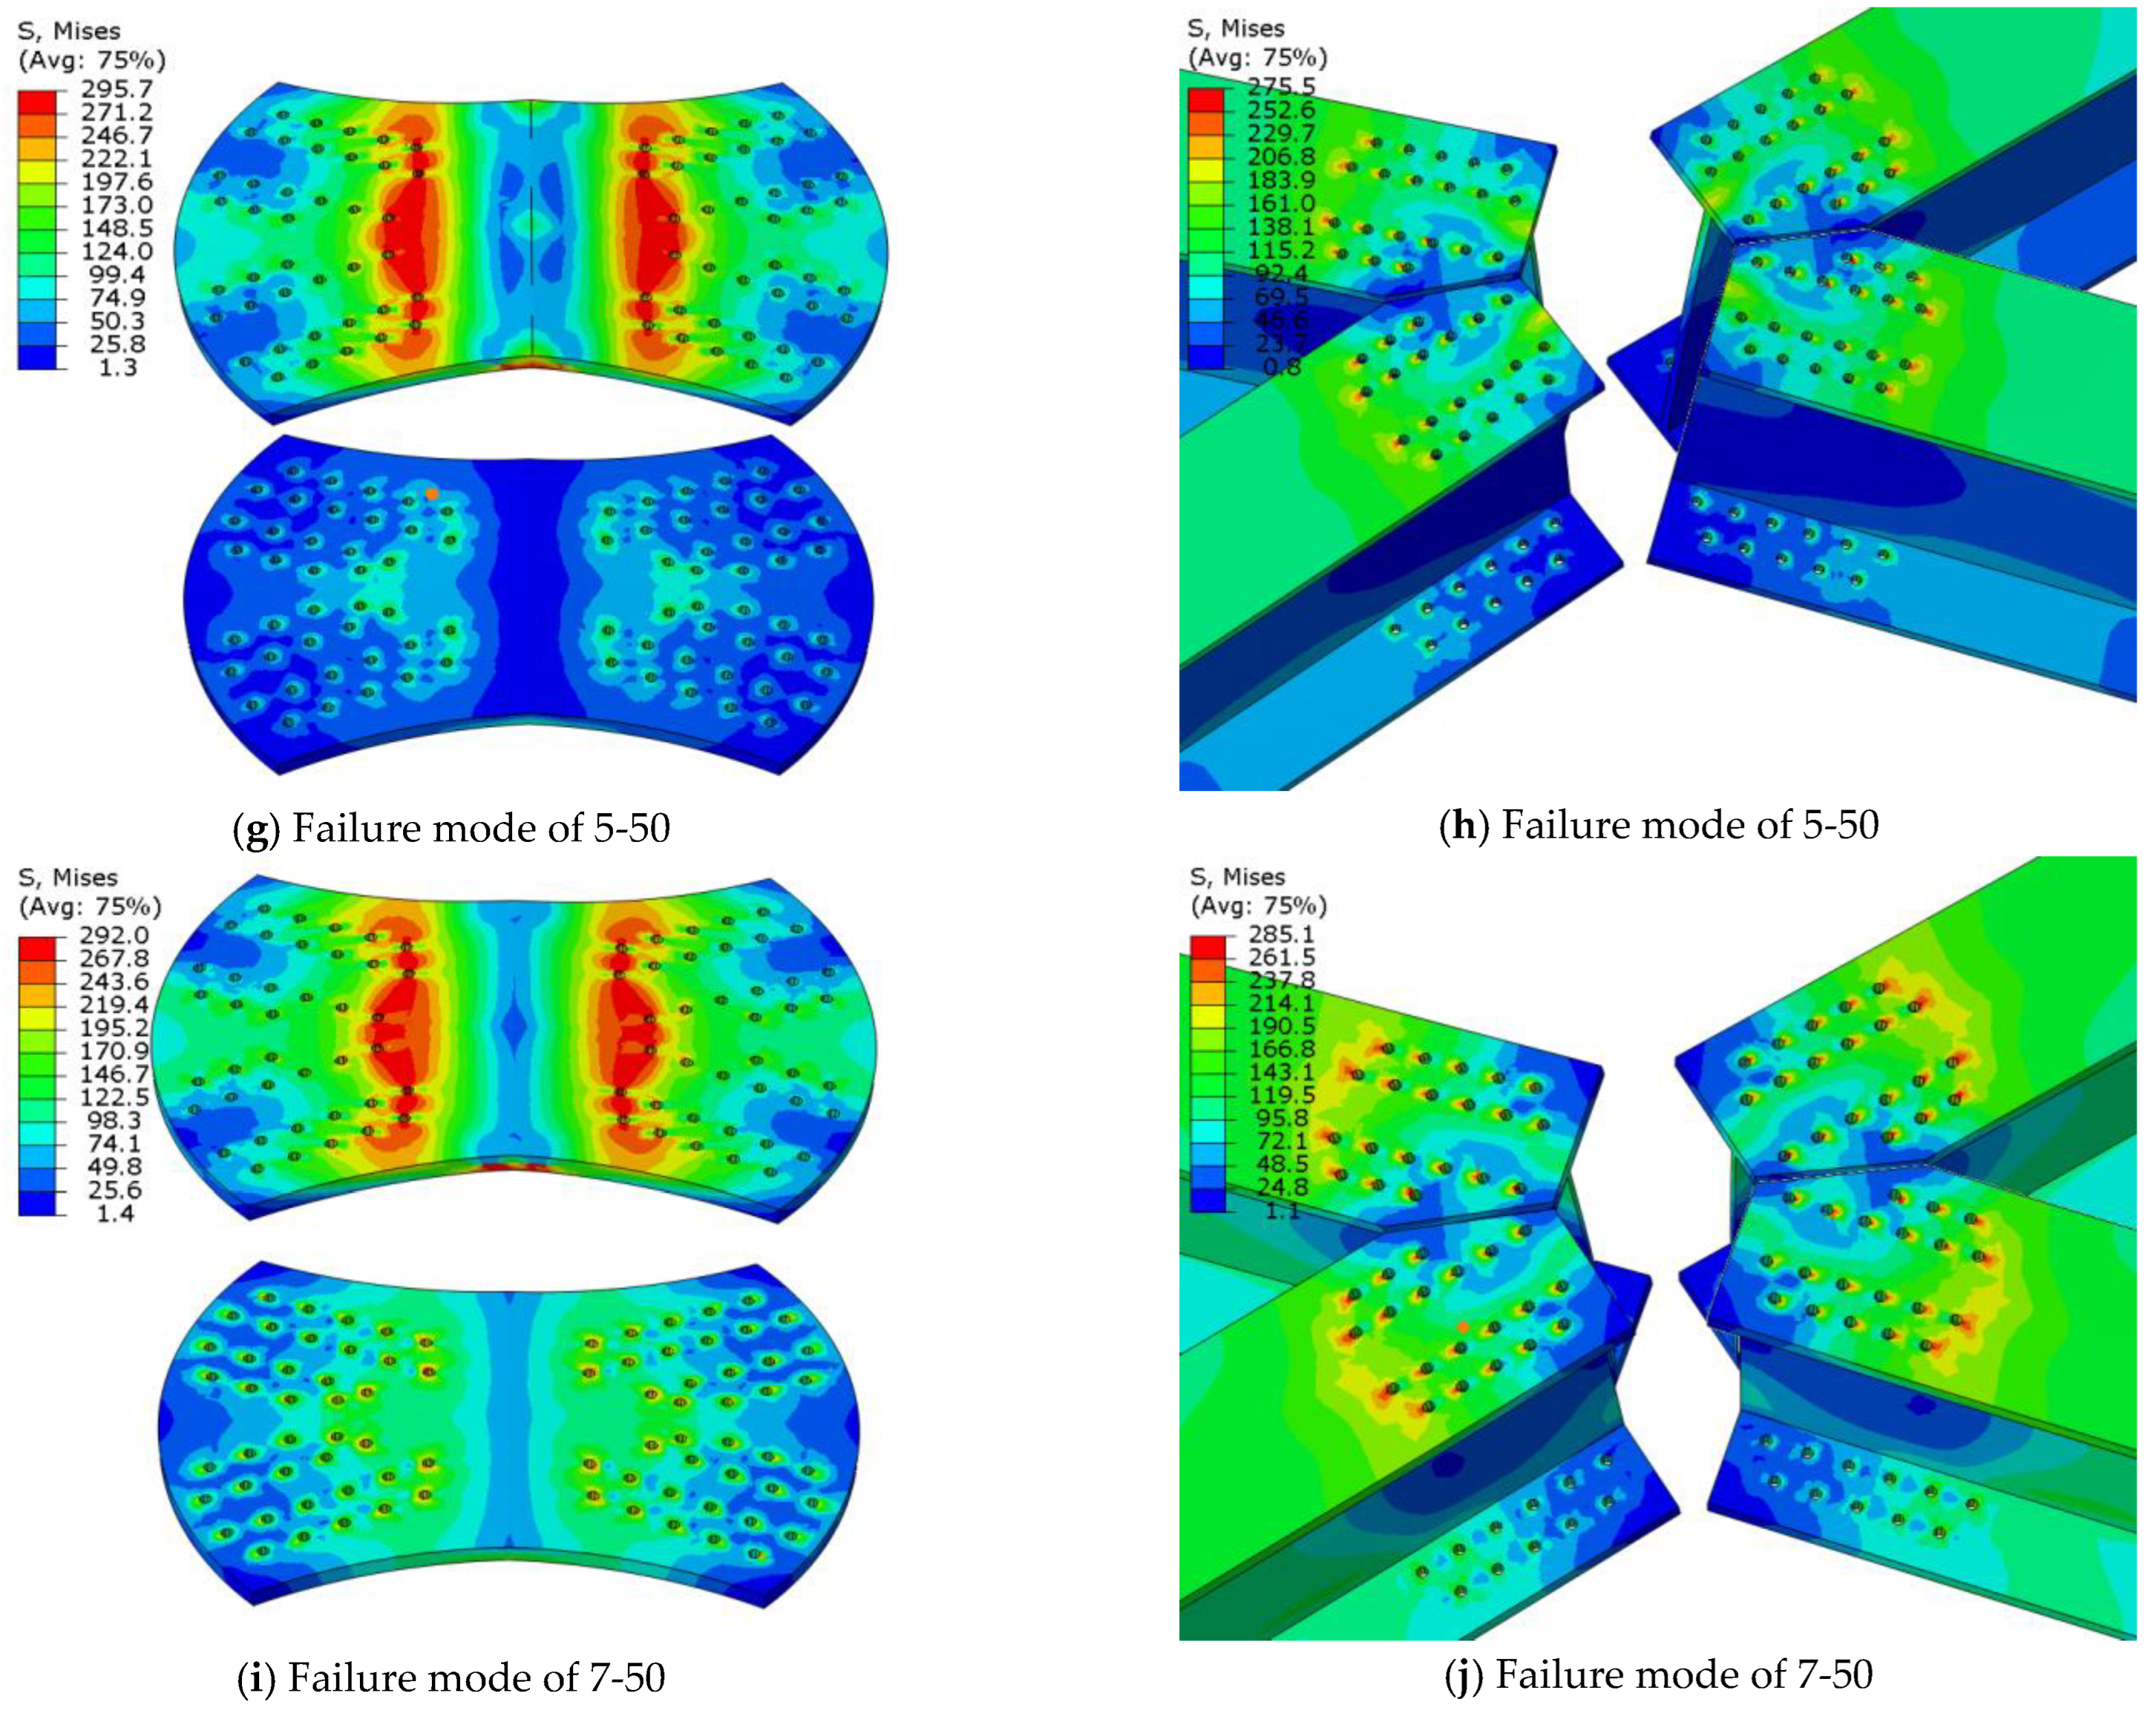
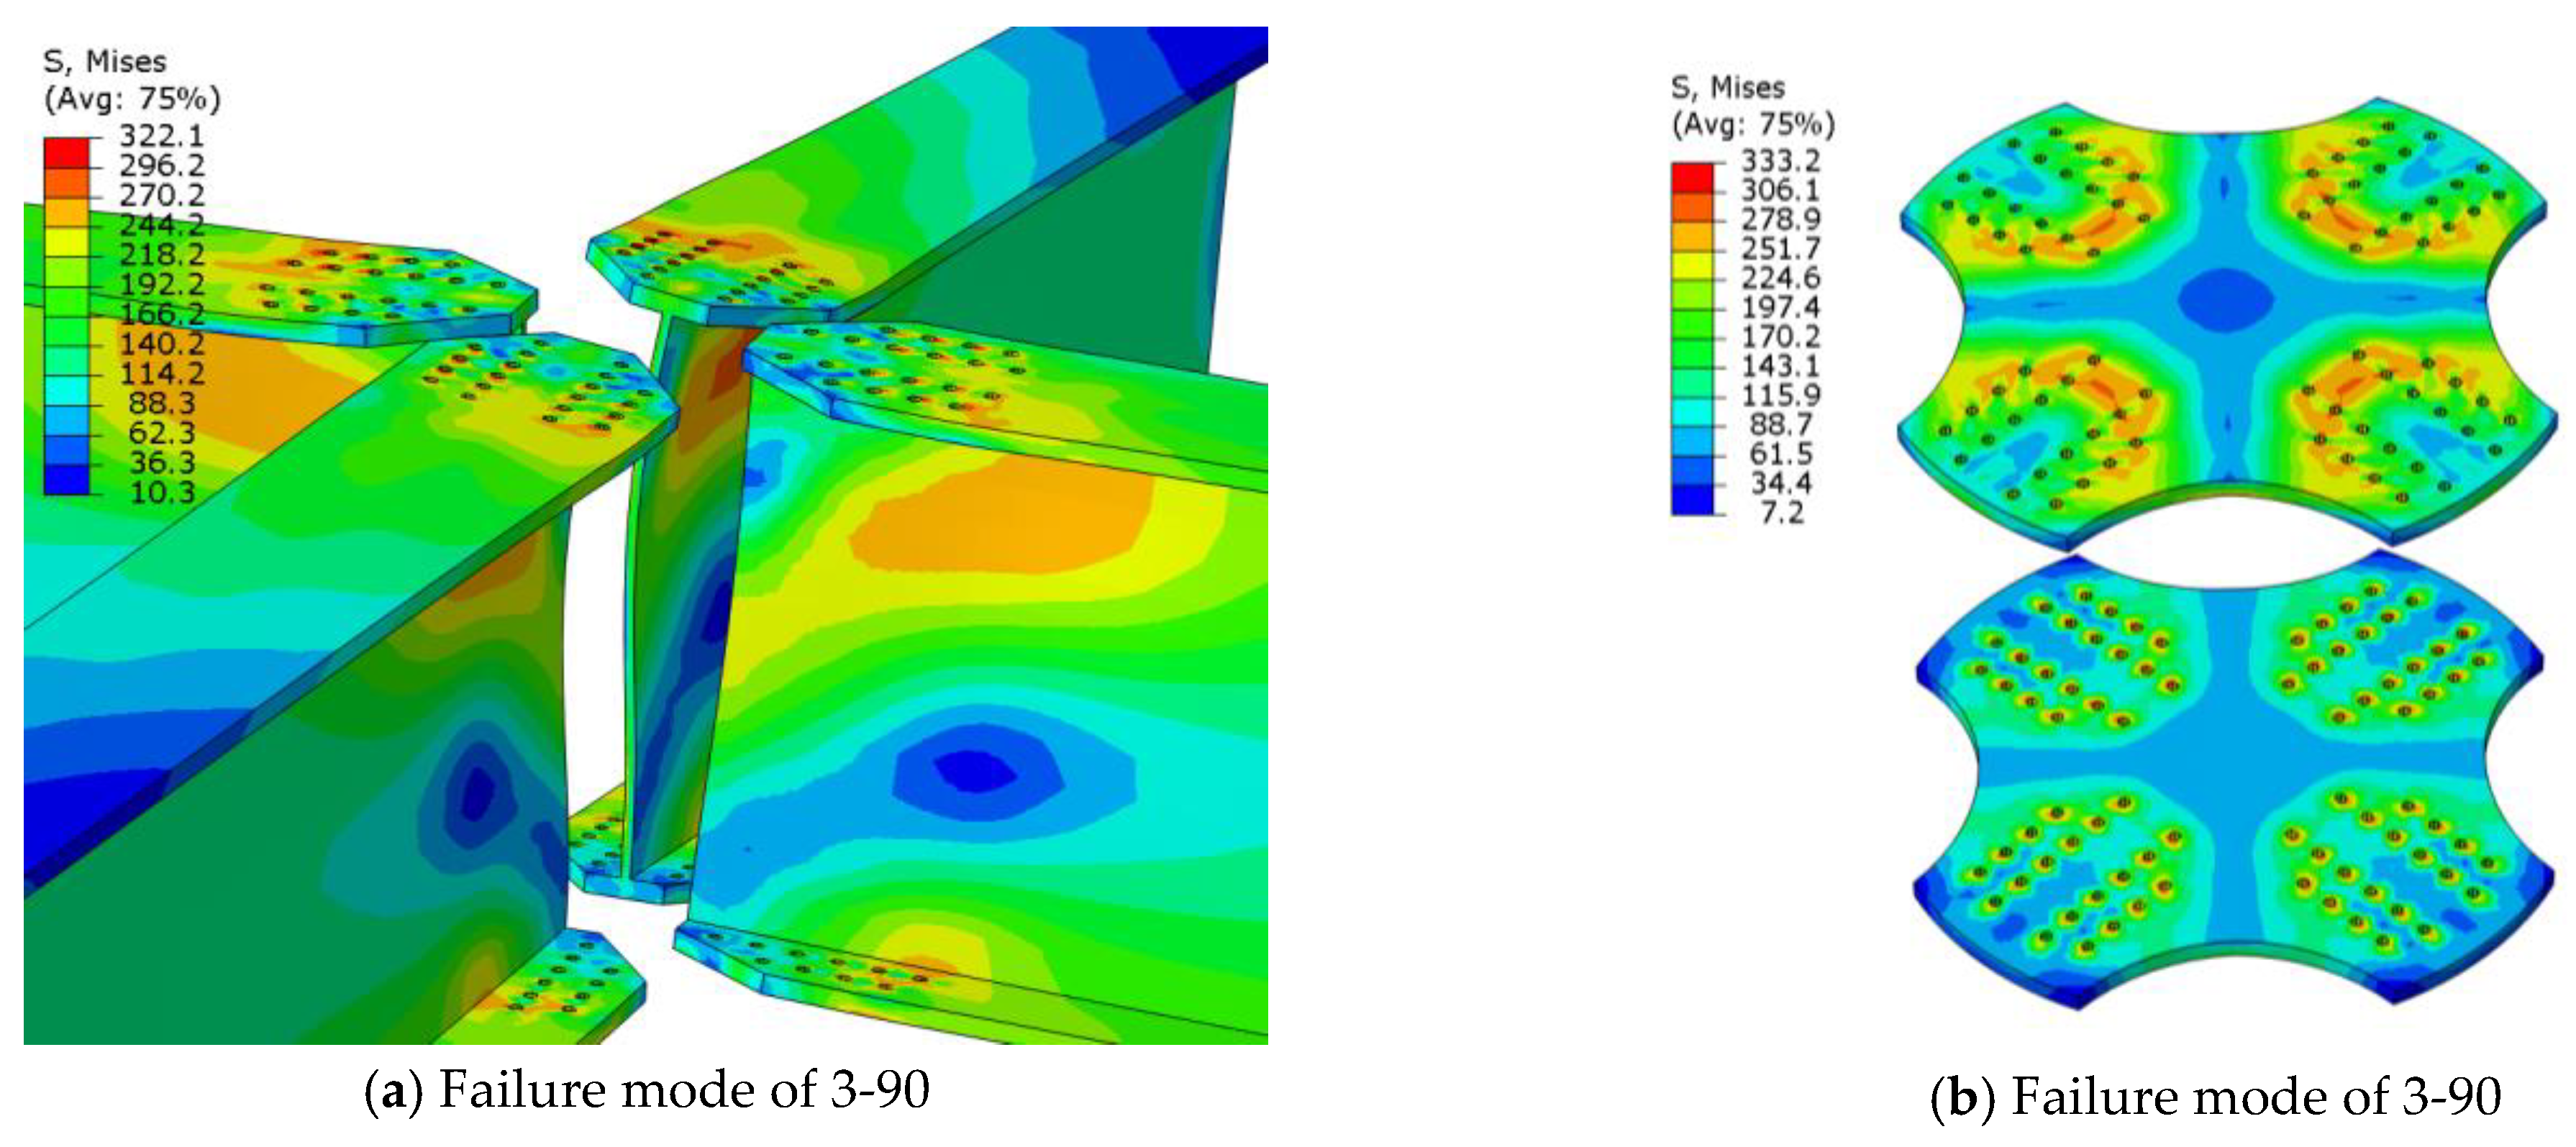
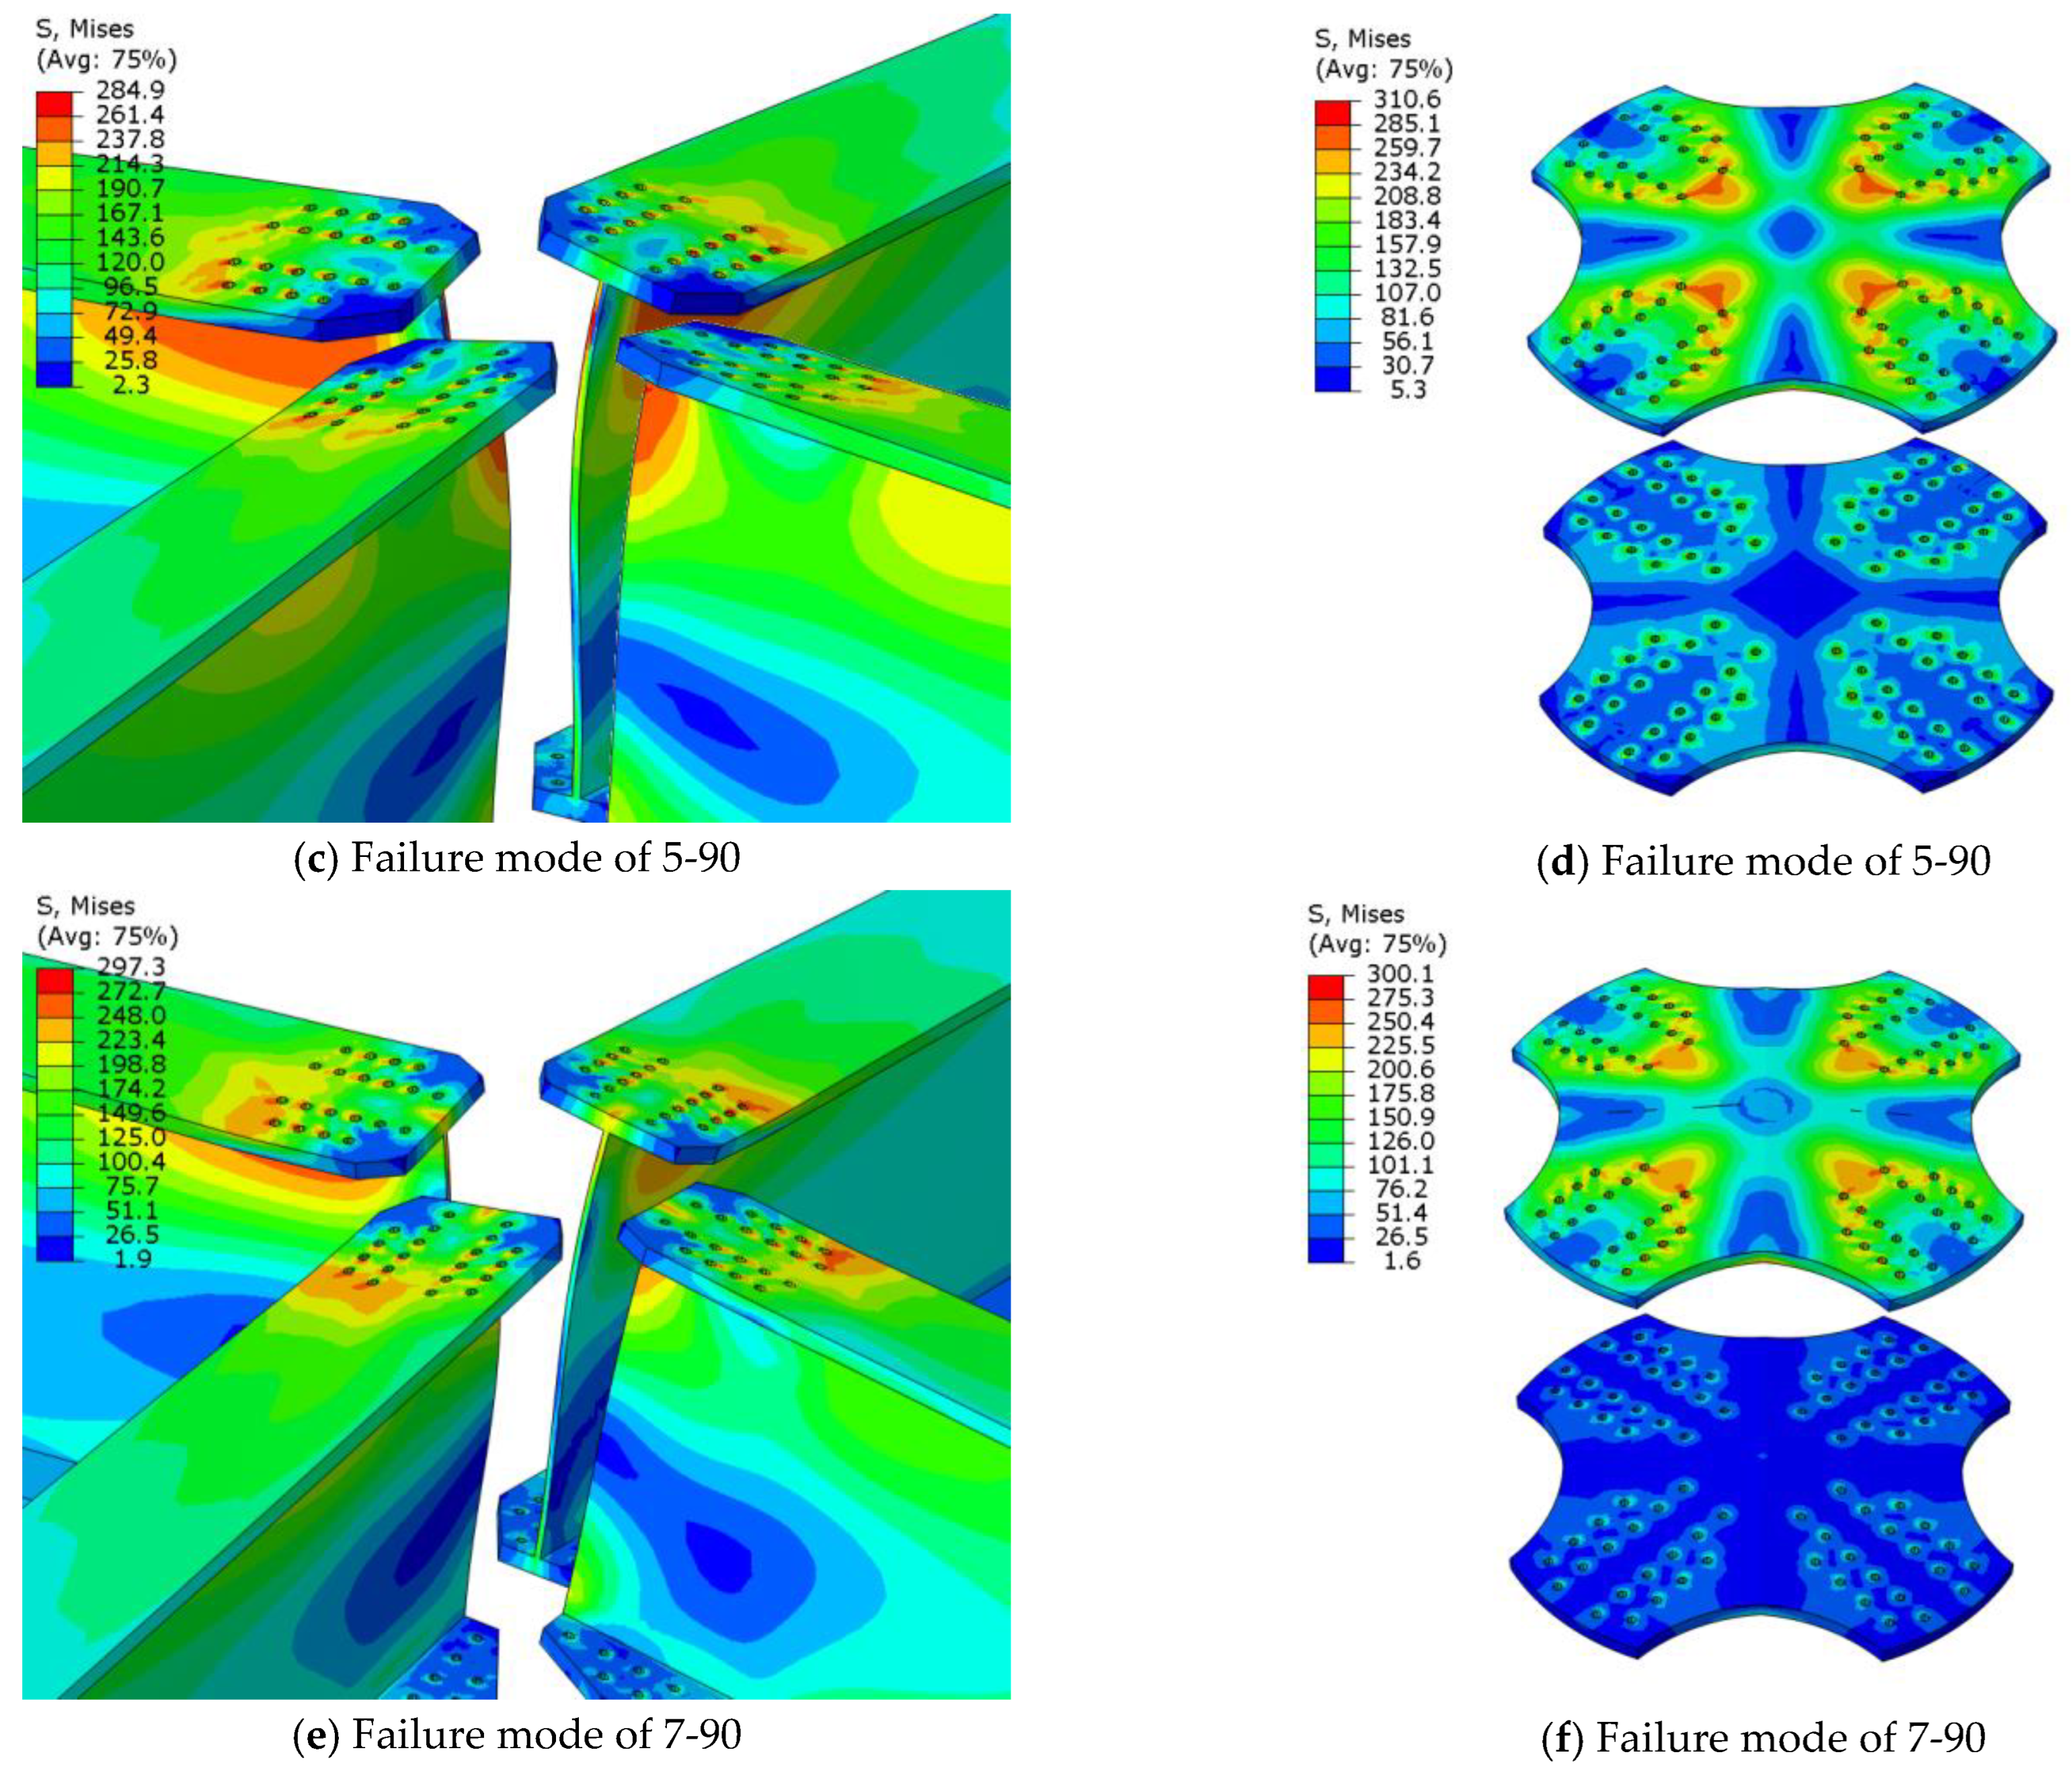
6.1. Failure Modes
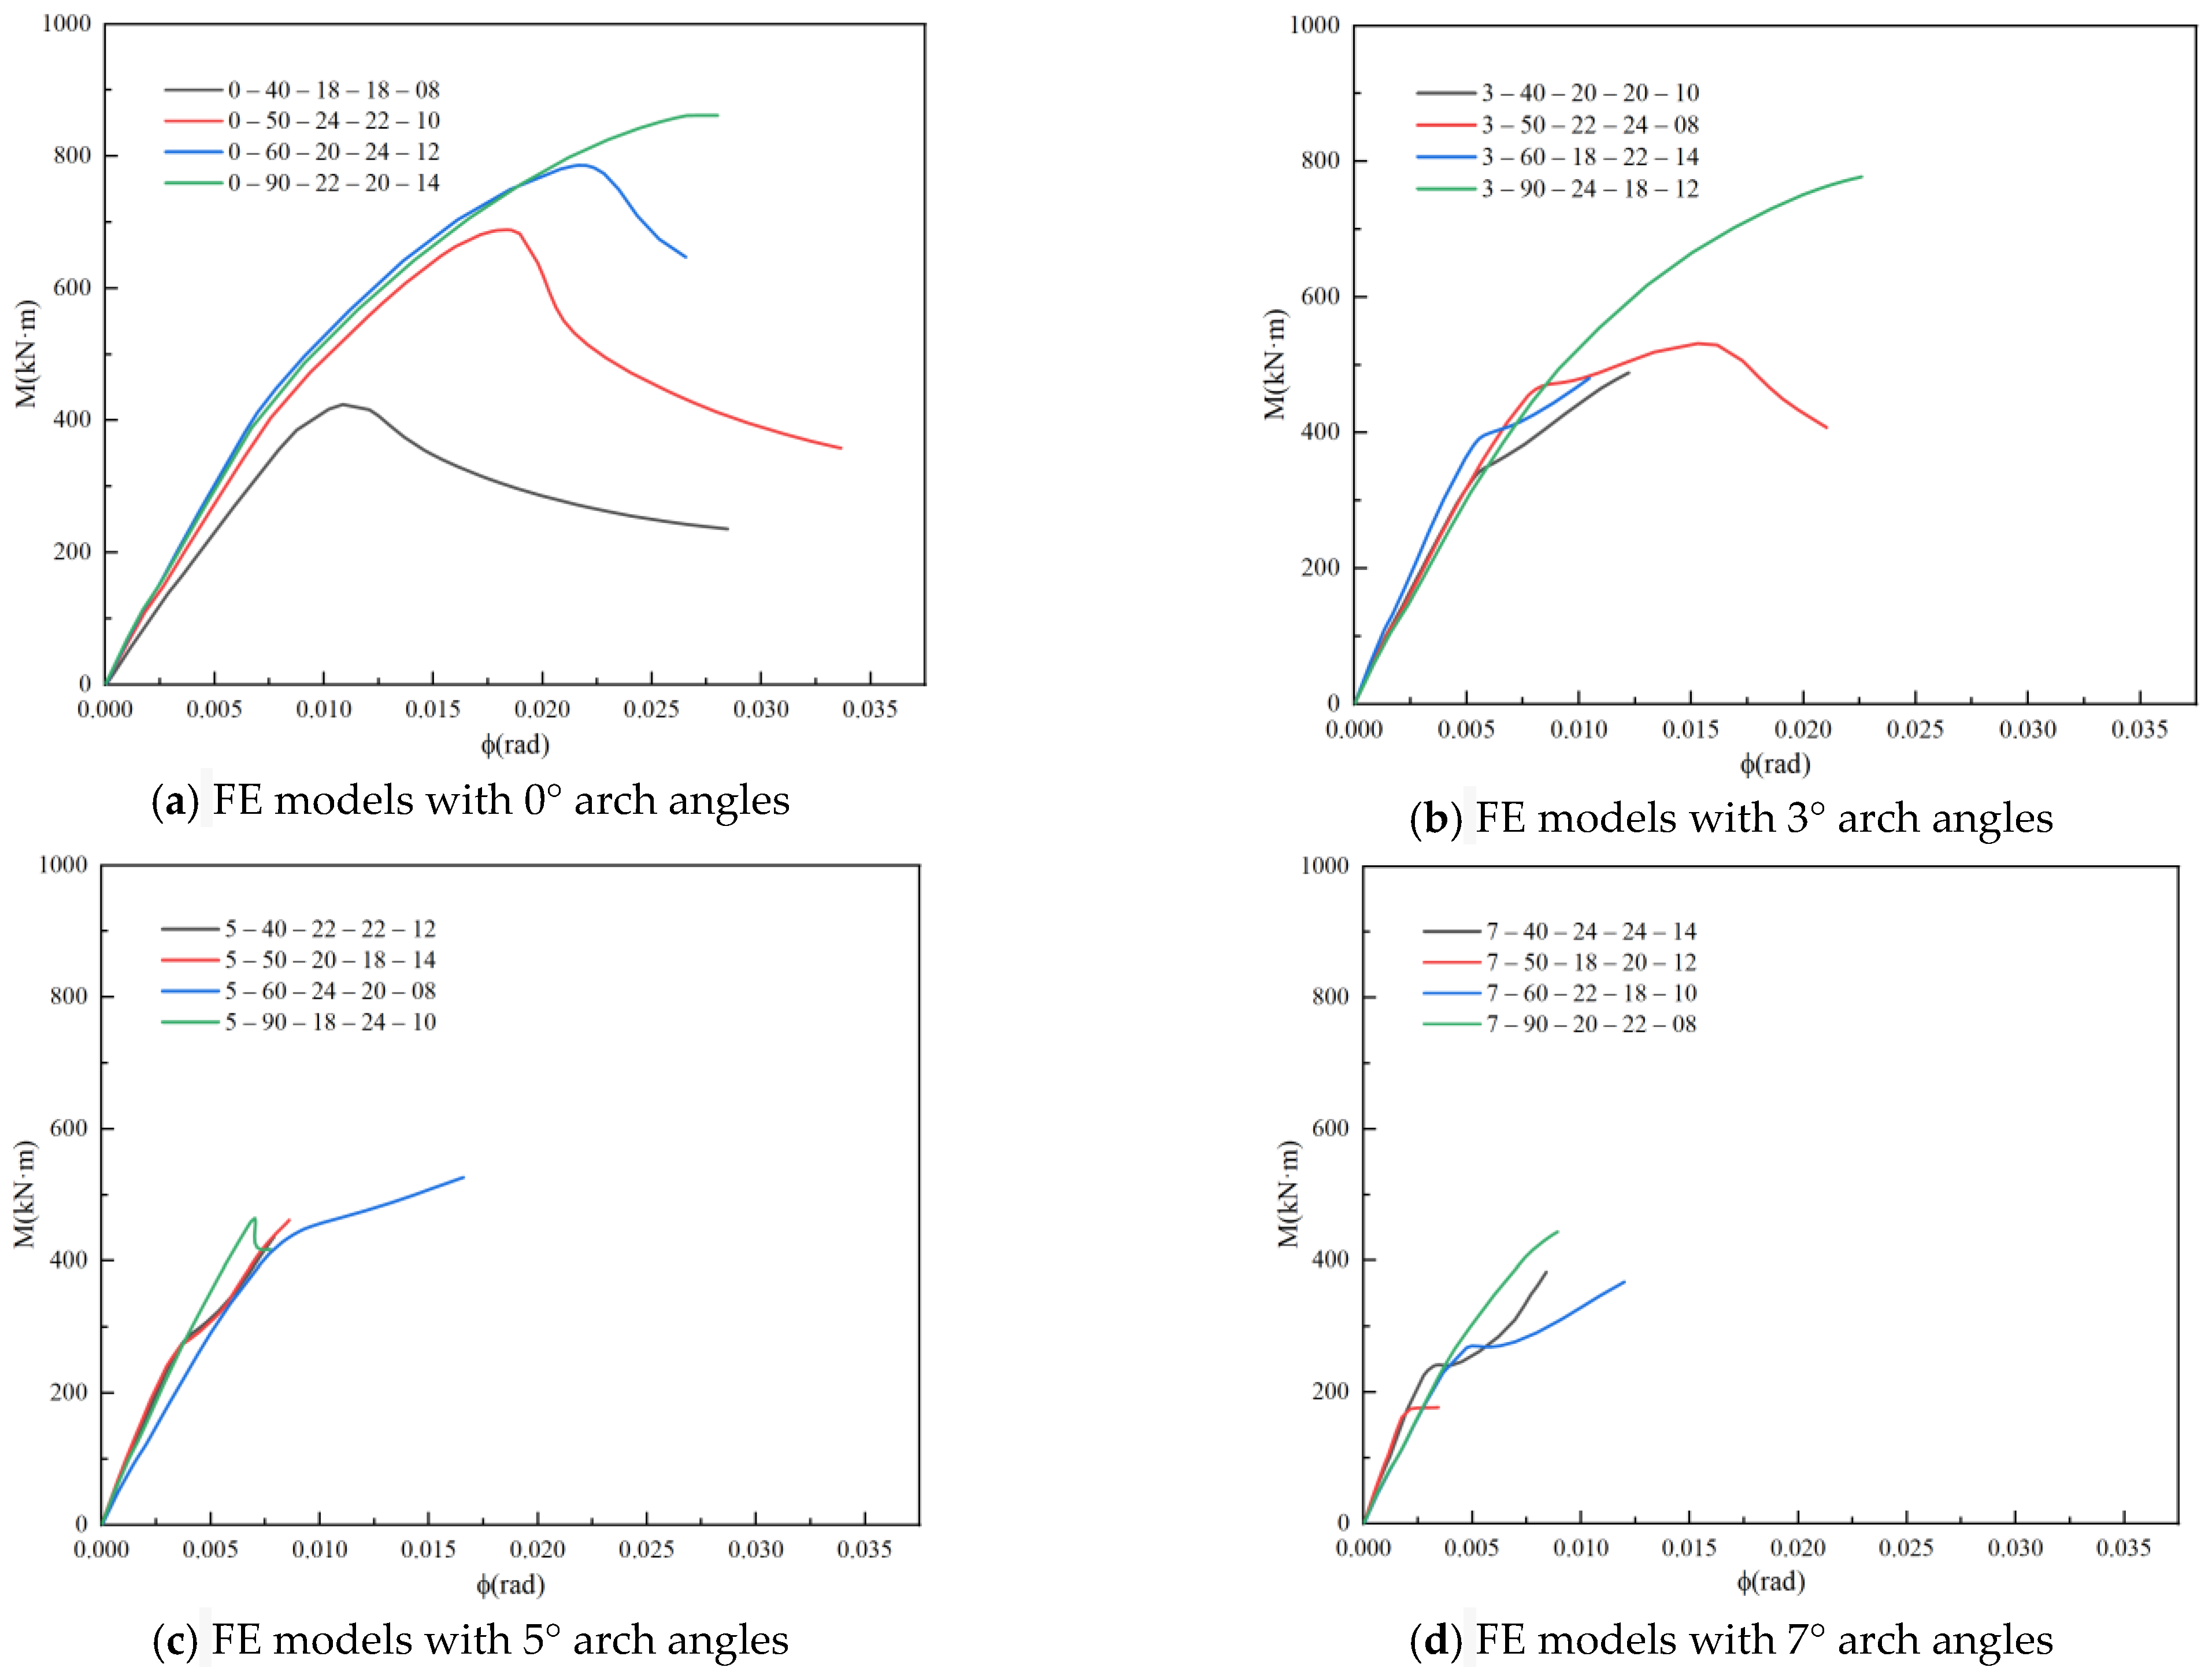
6.2. Stiffness and Bearing Capacity Analysis
6.2.1. Stiffness Analysis
6.2.2. Load-bearing Capacity Analysis
7. Conclusions
- A change in the planar angle affected the stress distribution of the joint. When the angles between the members were unequal, the symmetric sections experienced uneven stress and different section moduli, resulting in strong and weak axes, respectively. The joint was more likely to rotate around the weak axis, and the weak-axis section was more susceptible to damage. When the angles between the members were equal, the symmetric sections of the gusset plate had balanced stress, and the ultimate load-bearing capacity was much greater than when the angles between the members were unequal.
- The planar and arch angles were the main factors influencing the failure modes of the aluminum alloy gusset joints. The failure modes changed as the planar and arch angles changed. There are three main failure modes: compression failure in the middle of the gusset plate, local buckling of the web, and net cross-sectional failure of the member. Compression failure in the middle of the gusset plate occurs when adjacent members have unequal planar angles, and the gusset plate has an arching angle. The failure mode of gusset joints with a 90° angle between members and 40°, 50°, and 60° angles with 0° arch angles is local buckling of the web, and the failure mode of flat gusset joints with a 90° angle between members is the net cross-sectional failure of the member.
- The significance of the various factors affecting the initial stiffness was ranked as follows: arch angle > web thickness > flange thickness > gusset plate thickness > planar angle. The arch angles had the most significant impact on the initial stiffness, and the initial stiffness of the gusset joints with an arching angle was greater than that of the planar gusset joints. Moreover, an increase in the gusset-plate thickness resulted in a slight decrease in the initial stiffness, whereas increases in the web and flange thicknesses led to an increase in the initial stiffness. However, changes in the planar angle did not significantly affect the initial stiffness of the gusset joints.
- The significance of the various factors affecting the load-carrying capacity of gusset joints was ranked as follows: arch angle > planar angle > gusset plate thickness > flange thickness > web thickness. Among these factors, the arch and planar angles had the most significant effects on the load-carrying capacity of the gusset joints. This outcome occurred mainly because the arch and planar angles of the gusset plate changed the failure modes of the joints. When adjacent members had unequal planar angles, and the gusset plate was arched, the gusset plate experienced uneven stress, and the failure mode was compression failure in the middle of the gusset plate. As the thicknesses of the gusset plate, flange, and web increased, the load-carrying capacity of the gusset joints increased.
- Based on the research analysis of the study results, we can make the following recommendations for practical engineering: (1) Changes in the planar angle will affect the stress distribution of the joint, causing the joint to enter the plastic phase prematurely, with the primary failure mode being the mid-section crushing the joint plate, which does not align with the “strong joint, weak member” concept. In real-world engineering, we should avoid this situation as much as possible by minimizing the inconsistency in the angles between members; (2) The initial stiffness of the joint will increase with an increase in the planar angle, but in cases in which the angles between the members are not equal, an increase in the planar angle will lead to a rapid decrease in the ultimate bearing capacity. In practical engineering, we recommend setting the planar angle equal to the angles between the members (all angles between the members are either 60° or 90°) to maximize the joint’s load-bearing performance.
Author Contributions
Funding
Institutional Review Board Statement
Informed Consent Statement
Data Availability Statement
Acknowledgments
Conflicts of Interest
References
- Lane, J. Aluminium in Building; Routledge: London, UK, 2018; ISBN 978-0-429-46337-2. [Google Scholar]
- Shen, Z.; Guo, X.; Li, Y. A brief review on the research status of aluminum alloy structures. J. Build. Struct. 2007, 100–109. [Google Scholar] [CrossRef]
- Shibata, R.; Kato, S.; Yamada, S.; Ueki, T. 42. Experimental study on the ultimate strength of single-layer reticular domes. In Space Structures 4; Thomas Telford Publishing: London, UK, 1993; pp. 387–395. ISBN 978-0-7277-4941-3. [Google Scholar]
- Kato, S.; Yamashita, T.; Nakazawa, S.; Kim, Y.; Fujibayashi, A. Analysis based evaluation for buckling loads of two-way elliptic paraboloidal single layer lattice domes. J. Constr. Steel Res. 2007, 63, 1219–1227. [Google Scholar] [CrossRef]
- Kato, S.; Mutoh, I.; Shomura, M. Collapse of semi-rigidly jointed reticulated domes with initial geometric imperfections. J. Constr. Steel Res. 1998, 48, 145–168. [Google Scholar] [CrossRef]
- López, A.; Puente, I.; Serna, M.A. Direct evaluation of the buckling loads of semi-rigidly jointed single-layer latticed domes under symmetric loading. Eng. Struct. 2007, 29, 101–109. [Google Scholar] [CrossRef]
- López, A.; Puente, I.; Serna, M.A. Numerical model and experimental tests on single-layer latticed domes with semi-rigid joints. Comput. Struct. 2007, 85, 360–374. [Google Scholar] [CrossRef]
- Guo, X.; Liang, S.; Shen, Z. Experiment on aluminum alloy members under axial compression. Front. Struct. Civ. Eng. 2015, 9, 48–64. [Google Scholar] [CrossRef]
- Guo, X.; Xiong, Z.; Luo, Y.; Qiu, L.; Liu, J. Experimental investigation on the semi-rigid behaviour of aluminium alloy gusset joints. Thin-Walled Struct. 2015, 87, 30–40. [Google Scholar] [CrossRef]
- Guo, X.; Xiong, Z.; Luo, Y.; Qiu, L.; Huang, W. Application of the Component Method to Aluminum Alloy Gusset Joints. Adv. Struct. Eng. 2015, 18, 1931–1946. [Google Scholar] [CrossRef]
- Guo, X.; Xiong, Z.; Luo, Y.; Xu, H.; Liang, S. Block tearing and local buckling of aluminum alloy gusset joint plates. KSCE J. Civ. Eng. 2016, 20, 820–831. [Google Scholar] [CrossRef]
- Xiong, Z.; Guo, X.; Luo, Y.; Zhu, S. Elasto-plastic stability of single-layer reticulated shells with aluminium alloy gusset joints. Thin-Walled Struct. 2017, 115, 163–175. [Google Scholar] [CrossRef]
- Xiong, Z.; Guo, X.; Luo, Y.; Zhu, S.; Liu, Y. Experimental and numerical studies on single-layer reticulated shells with aluminium alloy gusset joints. Thin-Walled Struct. 2017, 118, 124–136. [Google Scholar] [CrossRef]
- Xiong, Z.; Guo, X.; Luo, Y.; Xu, H. Numerical analysis of aluminium alloy gusset joints subjected to bending moment and axial force. Eng. Struct. 2017, 152, 1–13. [Google Scholar] [CrossRef]
- Guo, X.; Zhu, S.; Liu, X.; Wang, K. Study on out-of-plane flexural behavior of aluminum alloy gusset joints at elevated temperatures. Thin-Walled Struct. 2018, 123, 452–466. [Google Scholar] [CrossRef]
- Guo, X.; Zhu, S.; Liu, X.; Liu, L. Experimental study on hysteretic behavior of aluminum alloy gusset joints. Thin-Walled Struct. 2018, 131, 883–901. [Google Scholar] [CrossRef]
- Liu, H.; Ying, J.; Meng, Y.; Chen, Z. Flexural behavior of double- and single-layer aluminum alloy gusset-type joints. Thin-Walled Struct. 2019, 144, 106263. [Google Scholar] [CrossRef]
- Liu, H.; Liu, X.; Chen, Z.; Ouyang, Y.; Yin, J. Mechanical properties of bolted connections for aluminum alloy structures at elevated temperatures. Thin-Walled Struct. 2020, 157, 107067. [Google Scholar] [CrossRef]
- Liu, H.; Li, B.; Chen, Z.; Ouyang, Y. Damage analysis of aluminum alloy gusset joints under cyclic loading based on continuum damage mechanics. Eng. Struct. 2021, 244, 112729. [Google Scholar] [CrossRef]
- Gang, W.; Caiqi, Z.; Jun, M. Experimental and numerical study on the bending performance of an aluminium alloy flower-gusset composite joint. Structures 2021, 33, 2475–2486. [Google Scholar] [CrossRef]
- Gang, W.; Caiqi, Z. Experimental and theoretical study on the bearing capacity of FGC joints for single-layer aluminium alloy lattice shell structures. Structures 2021, 33, 2445–2458. [Google Scholar] [CrossRef]
- Ma, H.; Jiang, Y.; Li, C.; Yu, Z.; Fan, F. Performance analysis and comparison study of two aluminum alloy joint systems under out-of-plane and in-plane loading. An experimental and numerical investigation. Eng. Struct. 2020, 214, 110643. [Google Scholar] [CrossRef]
- Sugizaki, K.; Kohmura, S.; Hangai, Y. Experimental study on structural behaviour of an aluminum single-layer lattice shell. Trans. AIJ 1996, 61, 113–122. [Google Scholar] [CrossRef]
- Sugizaki, K.; Kohmura, S.; Hangai, Y. Analytical study of an aluminum single-layer lattice shell with insertion joint. Trans. AIJ 1996, 61, 97106. [Google Scholar]
- Hiyama, Y.; Takashima, H.; Iijima, T. Experiment and analyses of ball joints for aluminum single layered reticular domes. Trans. AIJ 1997, 62, 8592. [Google Scholar] [CrossRef]
- Kato, S.; Fujimoto, M.; Ogawa, T. Buckling load of steel single-layer reticulated domes of circular plan. J. Int. Assoc. Shell Spat. Struct. 2005, 46, 41–63. [Google Scholar]
- Wu, J.; Zang, M.; Sun, G.; Chen, S. Experimental study on the static performance of arched aluminium alloy gusset joints. Eng. Struct. 2021, 246, 113013. [Google Scholar] [CrossRef]
- Wang, Y.; Liu, X.; Shi, Y.; Yin, J.; Ouyang, Y. Finite element parametric analysis of the static performance of aluminum alloy disc-type joints. J. Wuhan Univ. 2017, 50, 688–696+732. [Google Scholar] [CrossRef]
- Guo, X.; Shen, Z.; Li, Y.; Su, C.; Qiu, Z.; Yao, N. Research on the constitutive relationship and physical and mechanical properties of domestic structural aluminum alloy materials. J. Build. Struct. 2007, 110–117. [Google Scholar] [CrossRef]
- Guo, X.; Xiong, Z.; Luo, Y.; Xu, H. Experimental study on the bearing capacity of aluminum alloy plate-type joints. J. Tongji Univ. 2014, 42, 1024–1030. [Google Scholar]
- EN1993-1-8; Eurocode 3: Design of Steel Structures. Part 1-8: Design of Joints. European Committee for Standardization: Brussels, Belgium, 2005.


| Number | Arch Angles | Planar Angles | Thickness of Joint Plate | Thickness of Flange | Thickness of Web |
|---|---|---|---|---|---|
| (°) | (°) | (mm) | (mm) | (mm) | |
| 1 | 0 | 40 | 18 | 18 | 8 |
| 2 | 0 | 50 | 24 | 22 | 10 |
| 3 | 0 | 60 | 20 | 24 | 12 |
| 4 | 0 | 90 | 22 | 20 | 14 |
| 5 | 3 | 40 | 20 | 20 | 10 |
| 6 | 3 | 50 | 22 | 24 | 8 |
| 7 | 3 | 60 | 18 | 22 | 14 |
| 8 | 3 | 90 | 24 | 18 | 12 |
| 9 | 5 | 40 | 22 | 22 | 12 |
| 10 | 5 | 50 | 20 | 18 | 14 |
| 11 | 5 | 60 | 24 | 20 | 8 |
| 12 | 5 | 90 | 18 | 24 | 10 |
| 13 | 7 | 40 | 24 | 24 | 14 |
| 14 | 7 | 50 | 18 | 20 | 12 |
| 15 | 7 | 60 | 22 | 18 | 10 |
| 16 | 7 | 90 | 20 | 22 | 8 |
| Component | Material | (kg/m3) | E (MPa) | f0.2 (MPa) | fu (MPa) | fv (MPa) | |
|---|---|---|---|---|---|---|---|
| H-shaped members; Joint plates | 6061T6 | 2700 | 70,400 | 0.33 | 264 | 304 | 180 |
| Bolt | 304HC | 7850 | 189,000 | 0.3 | 460 | 720 | 504 |
| Contact or Constraint | Master Surface | Slave Surface | Tangential Behavior | Friction Coefficient | Normal Behavior |
|---|---|---|---|---|---|
| Bolts-to-plate | Bolts | Plate | Penalty | 0.3 | Hard contact |
| Nuts-to-member flange | Nuts | Flange | Penalty | 0.3 | Hard contact |
| Member flange-to-plate | Plate | Flange | Penalty | 0.3 | Hard contact |
| Bolt shanks-to-bolt holes | Bolt shanks | Bolt holes | Frictionless | None | Hard contact |
Disclaimer/Publisher’s Note: The statements, opinions and data contained in all publications are solely those of the individual author(s) and contributor(s) and not of MDPI and/or the editor(s). MDPI and/or the editor(s) disclaim responsibility for any injury to people or property resulting from any ideas, methods, instructions or products referred to in the content. |
© 2023 by the authors. Licensee MDPI, Basel, Switzerland. This article is an open access article distributed under the terms and conditions of the Creative Commons Attribution (CC BY) license (https://creativecommons.org/licenses/by/4.0/).
Share and Cite
Wang, H.; Guo, R.; Zhang, Y.; Yang, Y.; Xiao, W. Bearing Capacity Performance and Optimal Design of a Novel Aluminum Alloy Arch Gusset Joint. Materials 2023, 16, 7165. https://doi.org/10.3390/ma16227165
Wang H, Guo R, Zhang Y, Yang Y, Xiao W. Bearing Capacity Performance and Optimal Design of a Novel Aluminum Alloy Arch Gusset Joint. Materials. 2023; 16(22):7165. https://doi.org/10.3390/ma16227165
Chicago/Turabian StyleWang, Huaihao, Rongxin Guo, Yubo Zhang, Yang Yang, and Weirong Xiao. 2023. "Bearing Capacity Performance and Optimal Design of a Novel Aluminum Alloy Arch Gusset Joint" Materials 16, no. 22: 7165. https://doi.org/10.3390/ma16227165