
Stress–Strain Behavior of Crushed Concrete as a Special Anthropogenic Soil


Abstract
:1. Introduction
2. Stress–Plastic Dilatancy Relationship for Soils
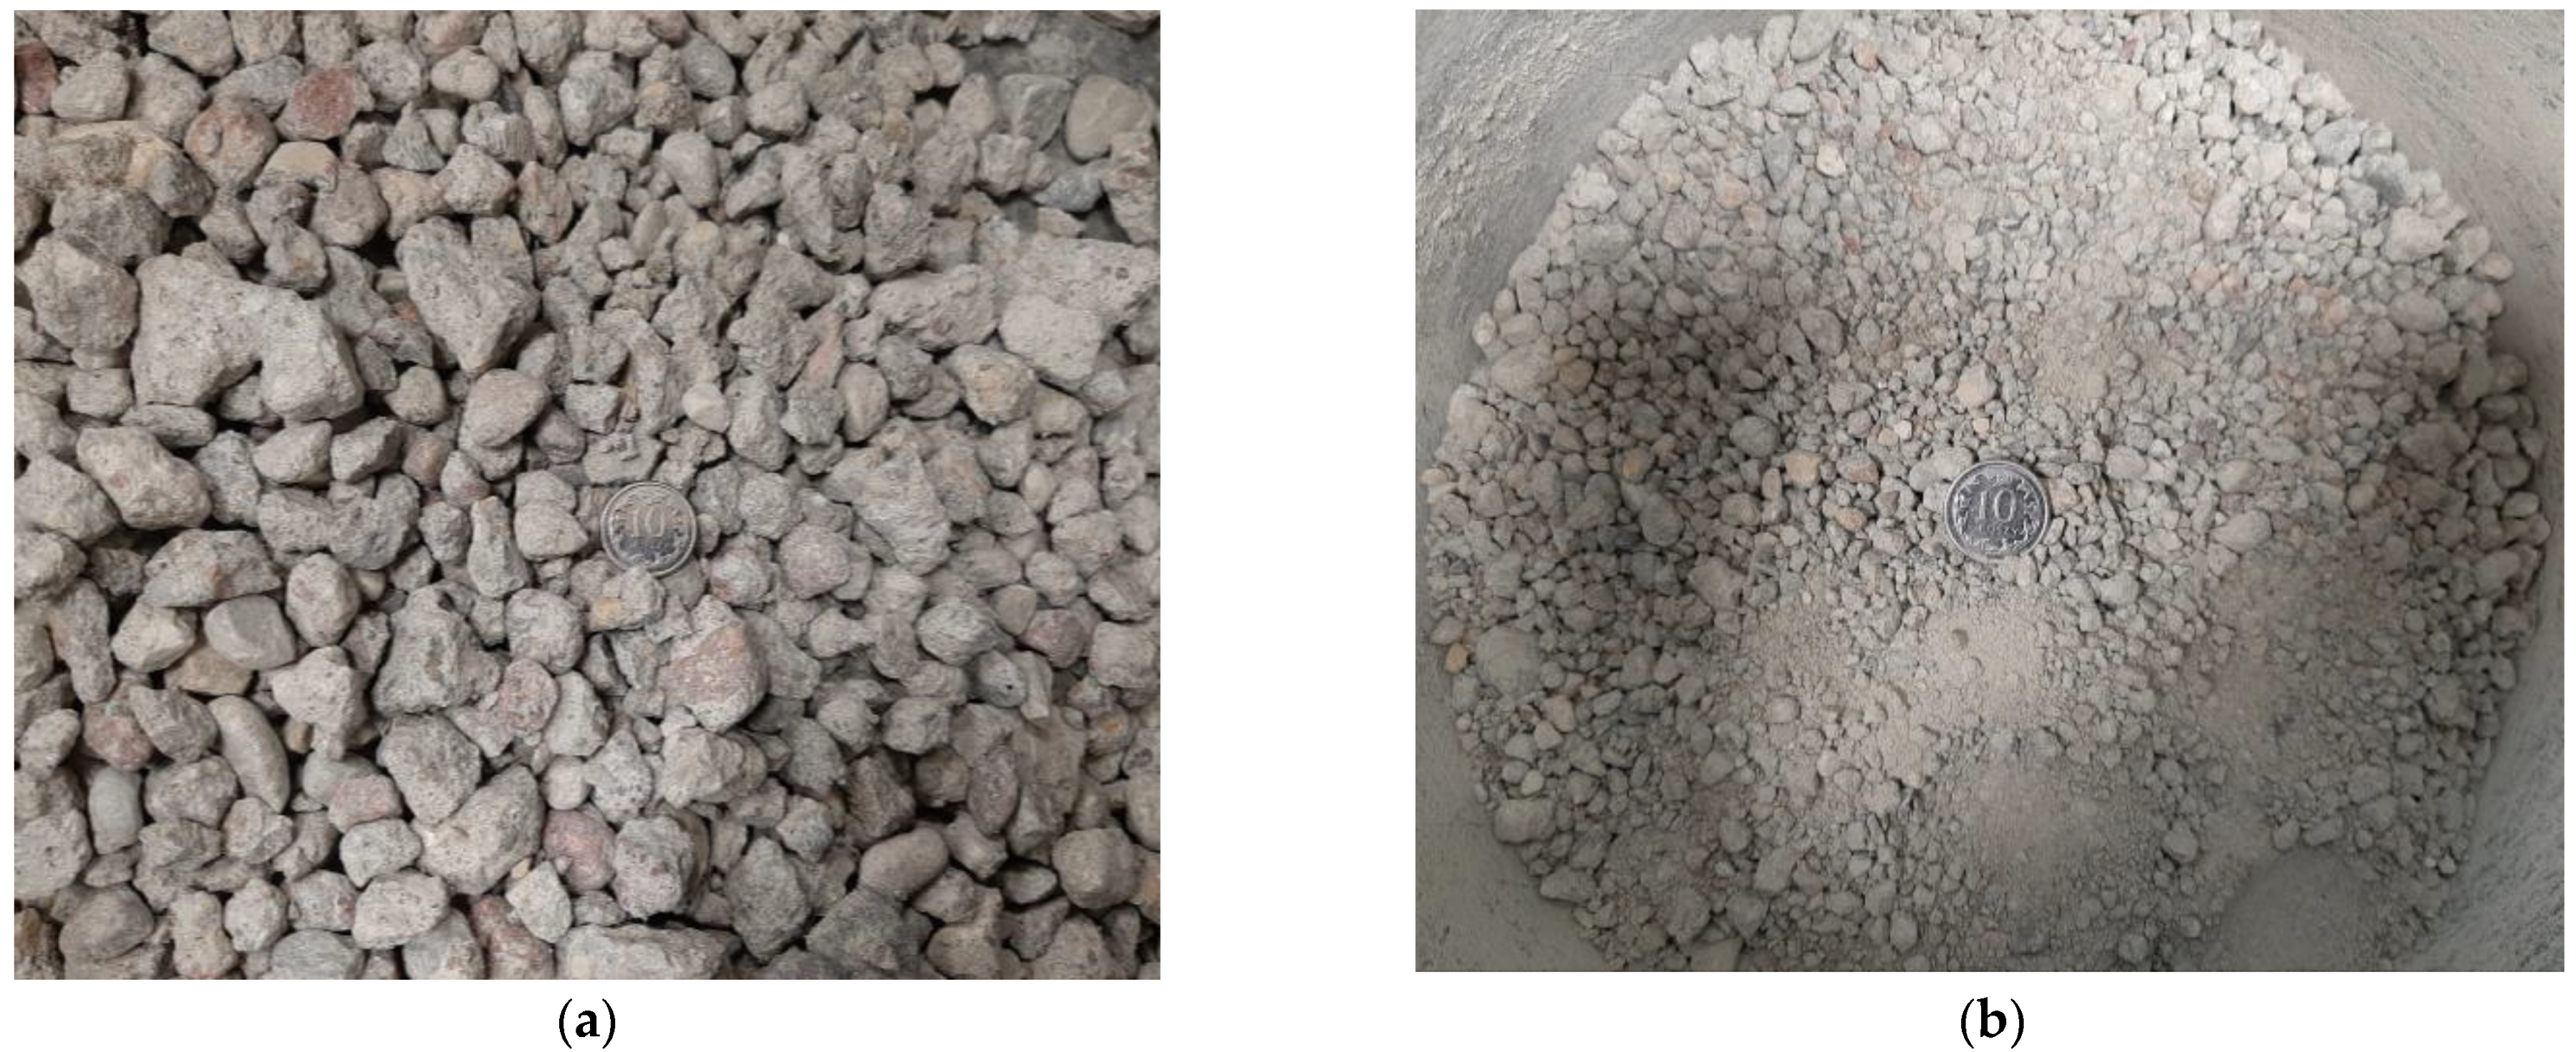
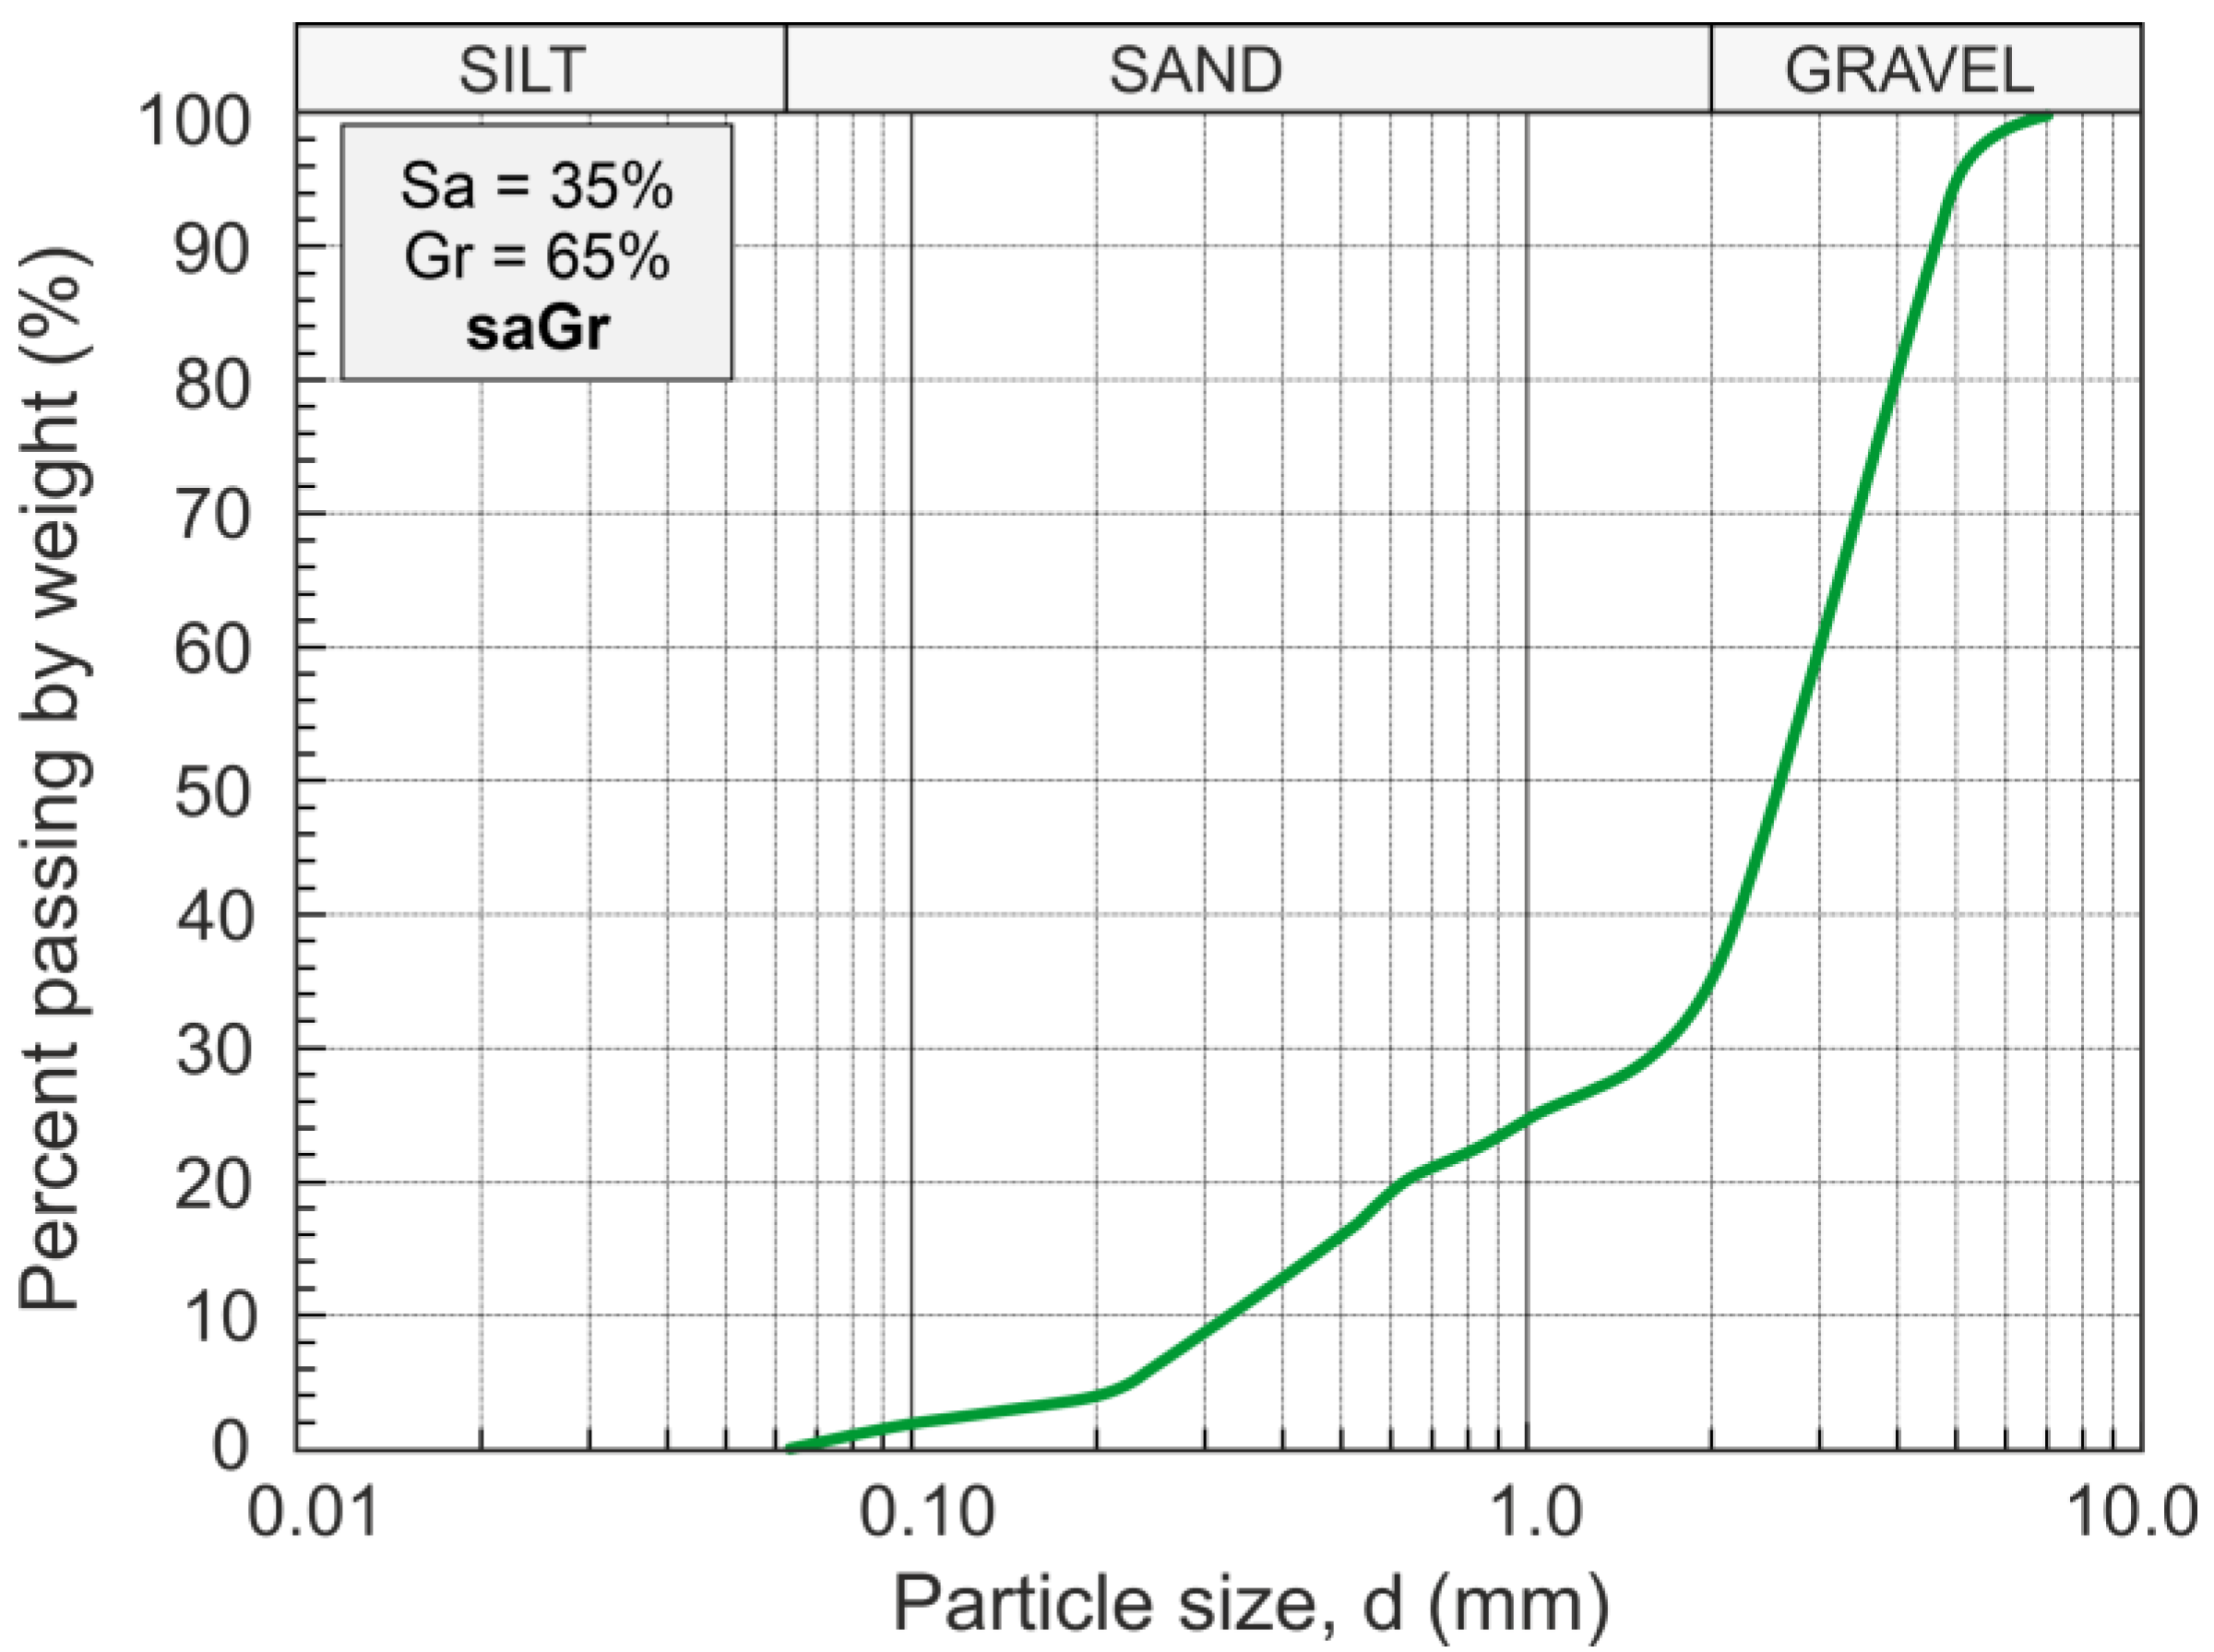
3. Test Material
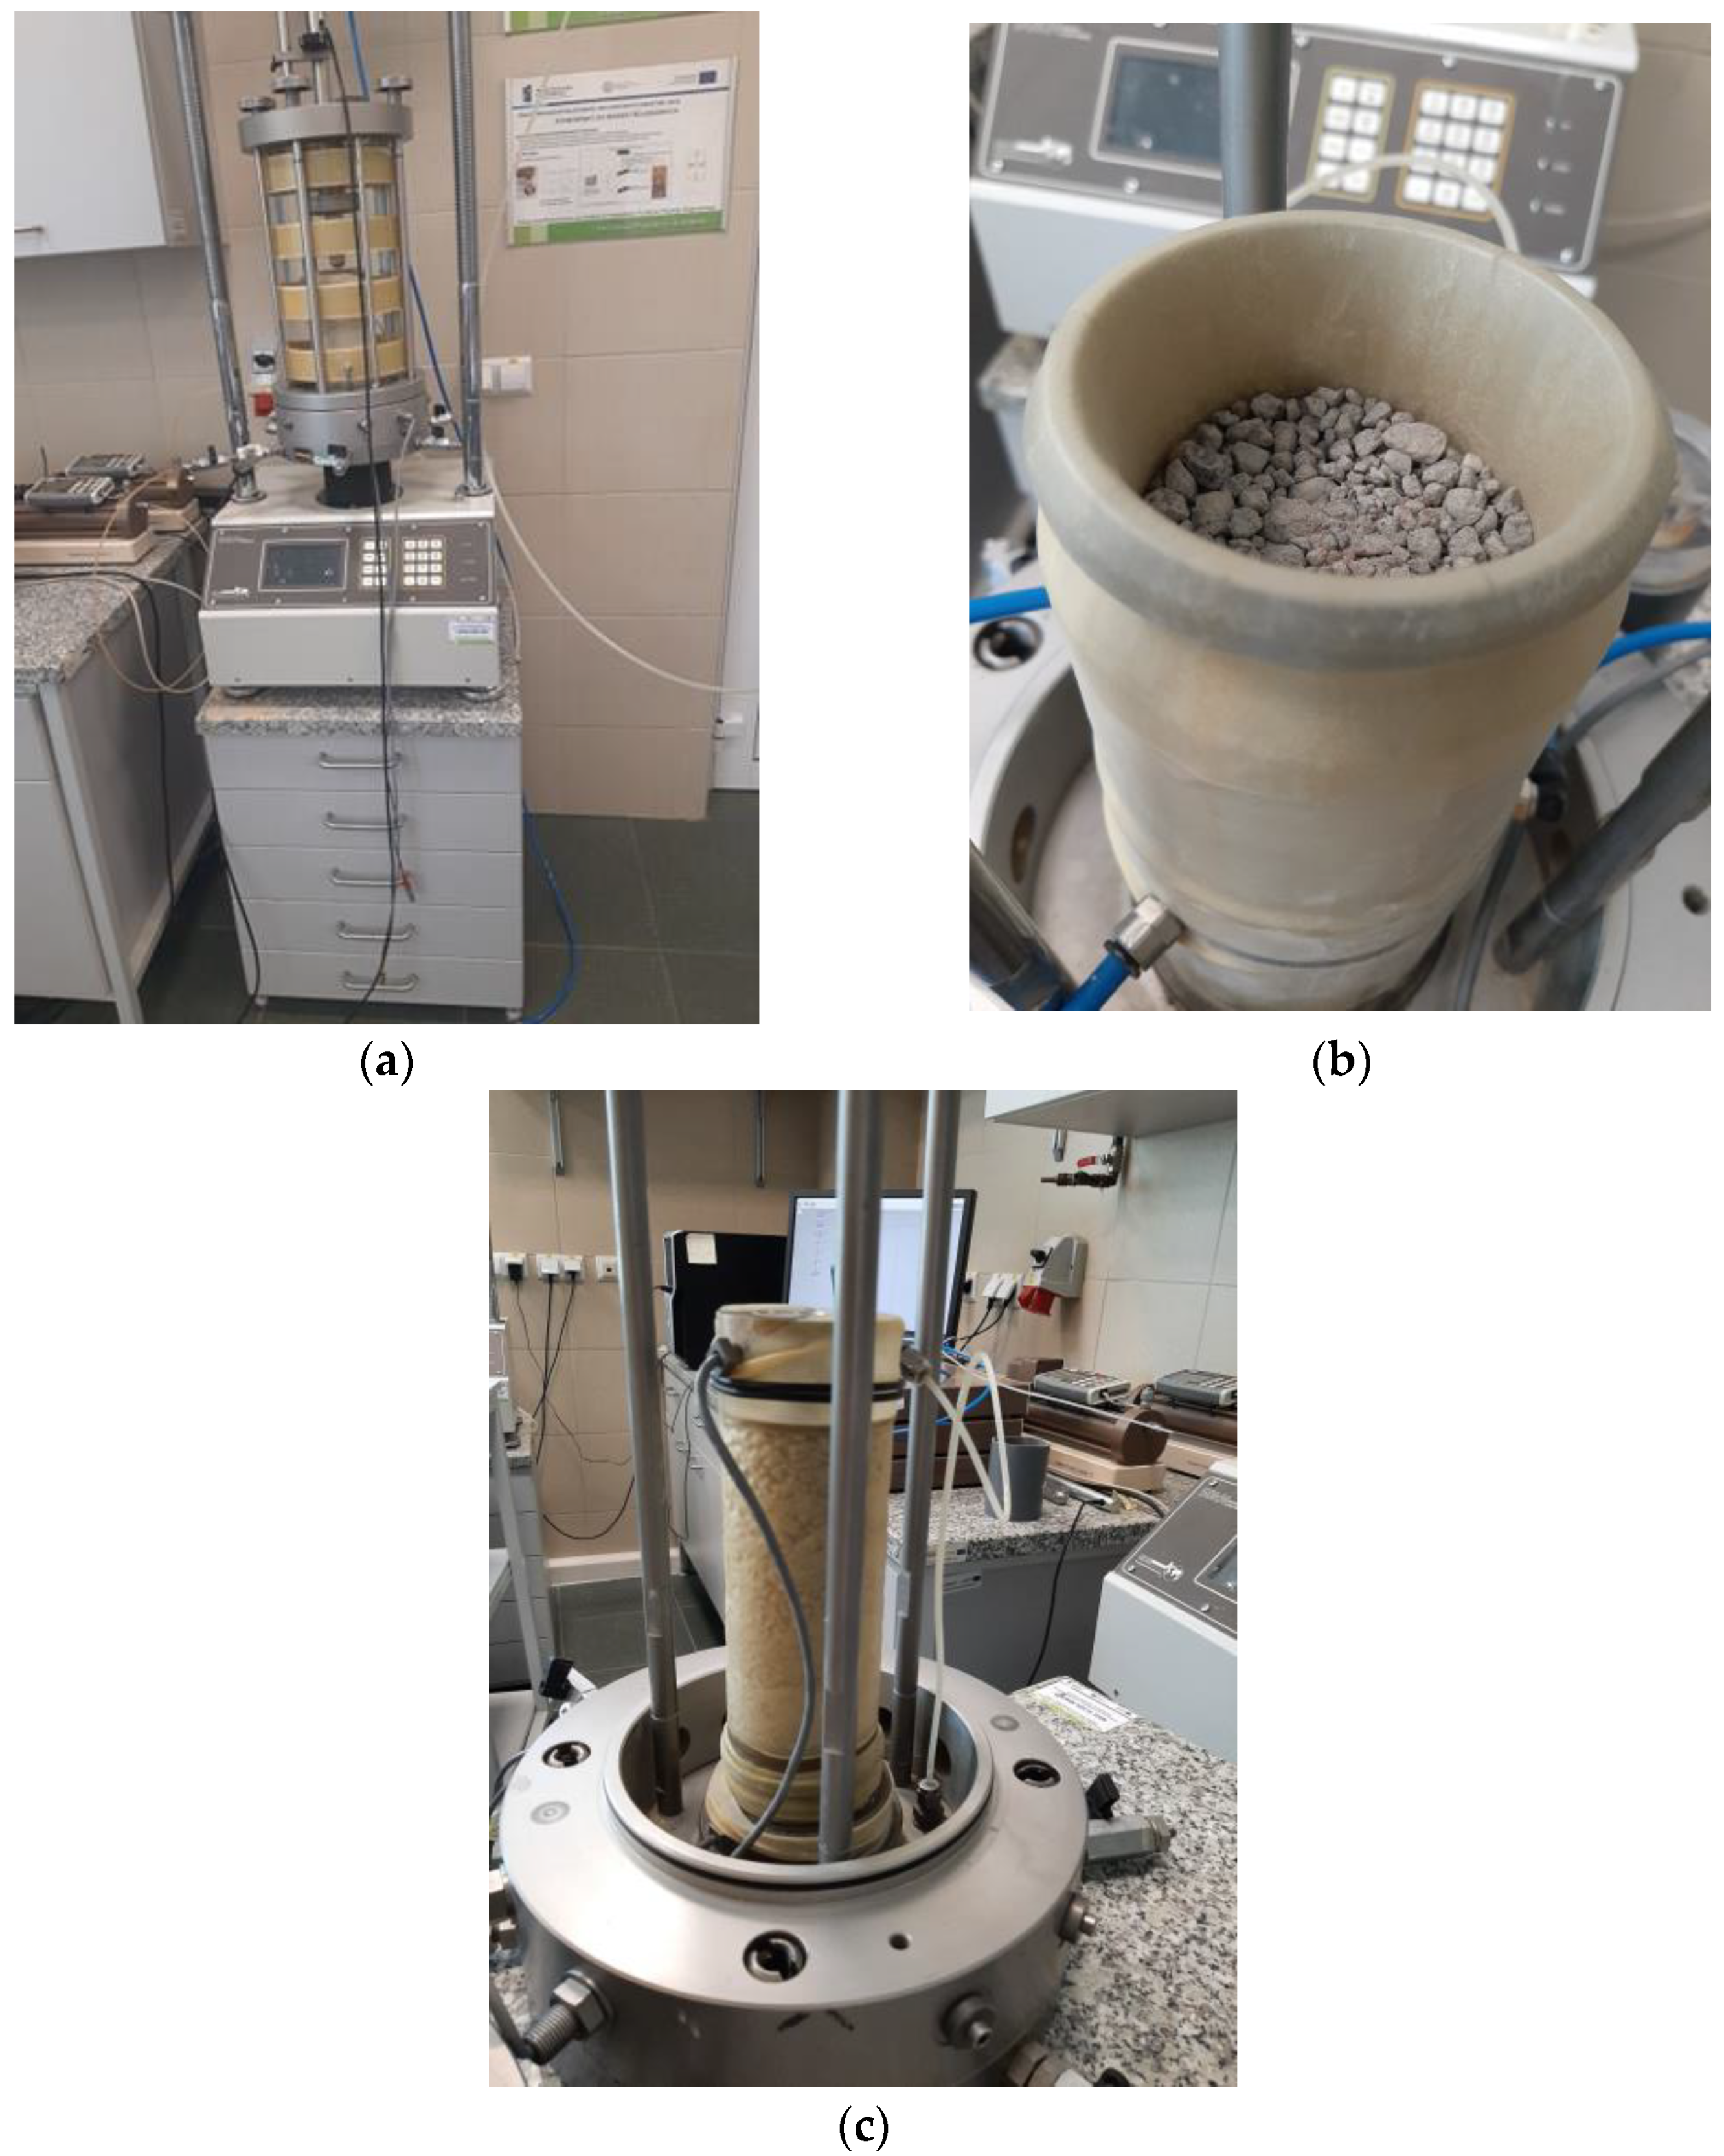
4. Test Procedure
5. Methodology
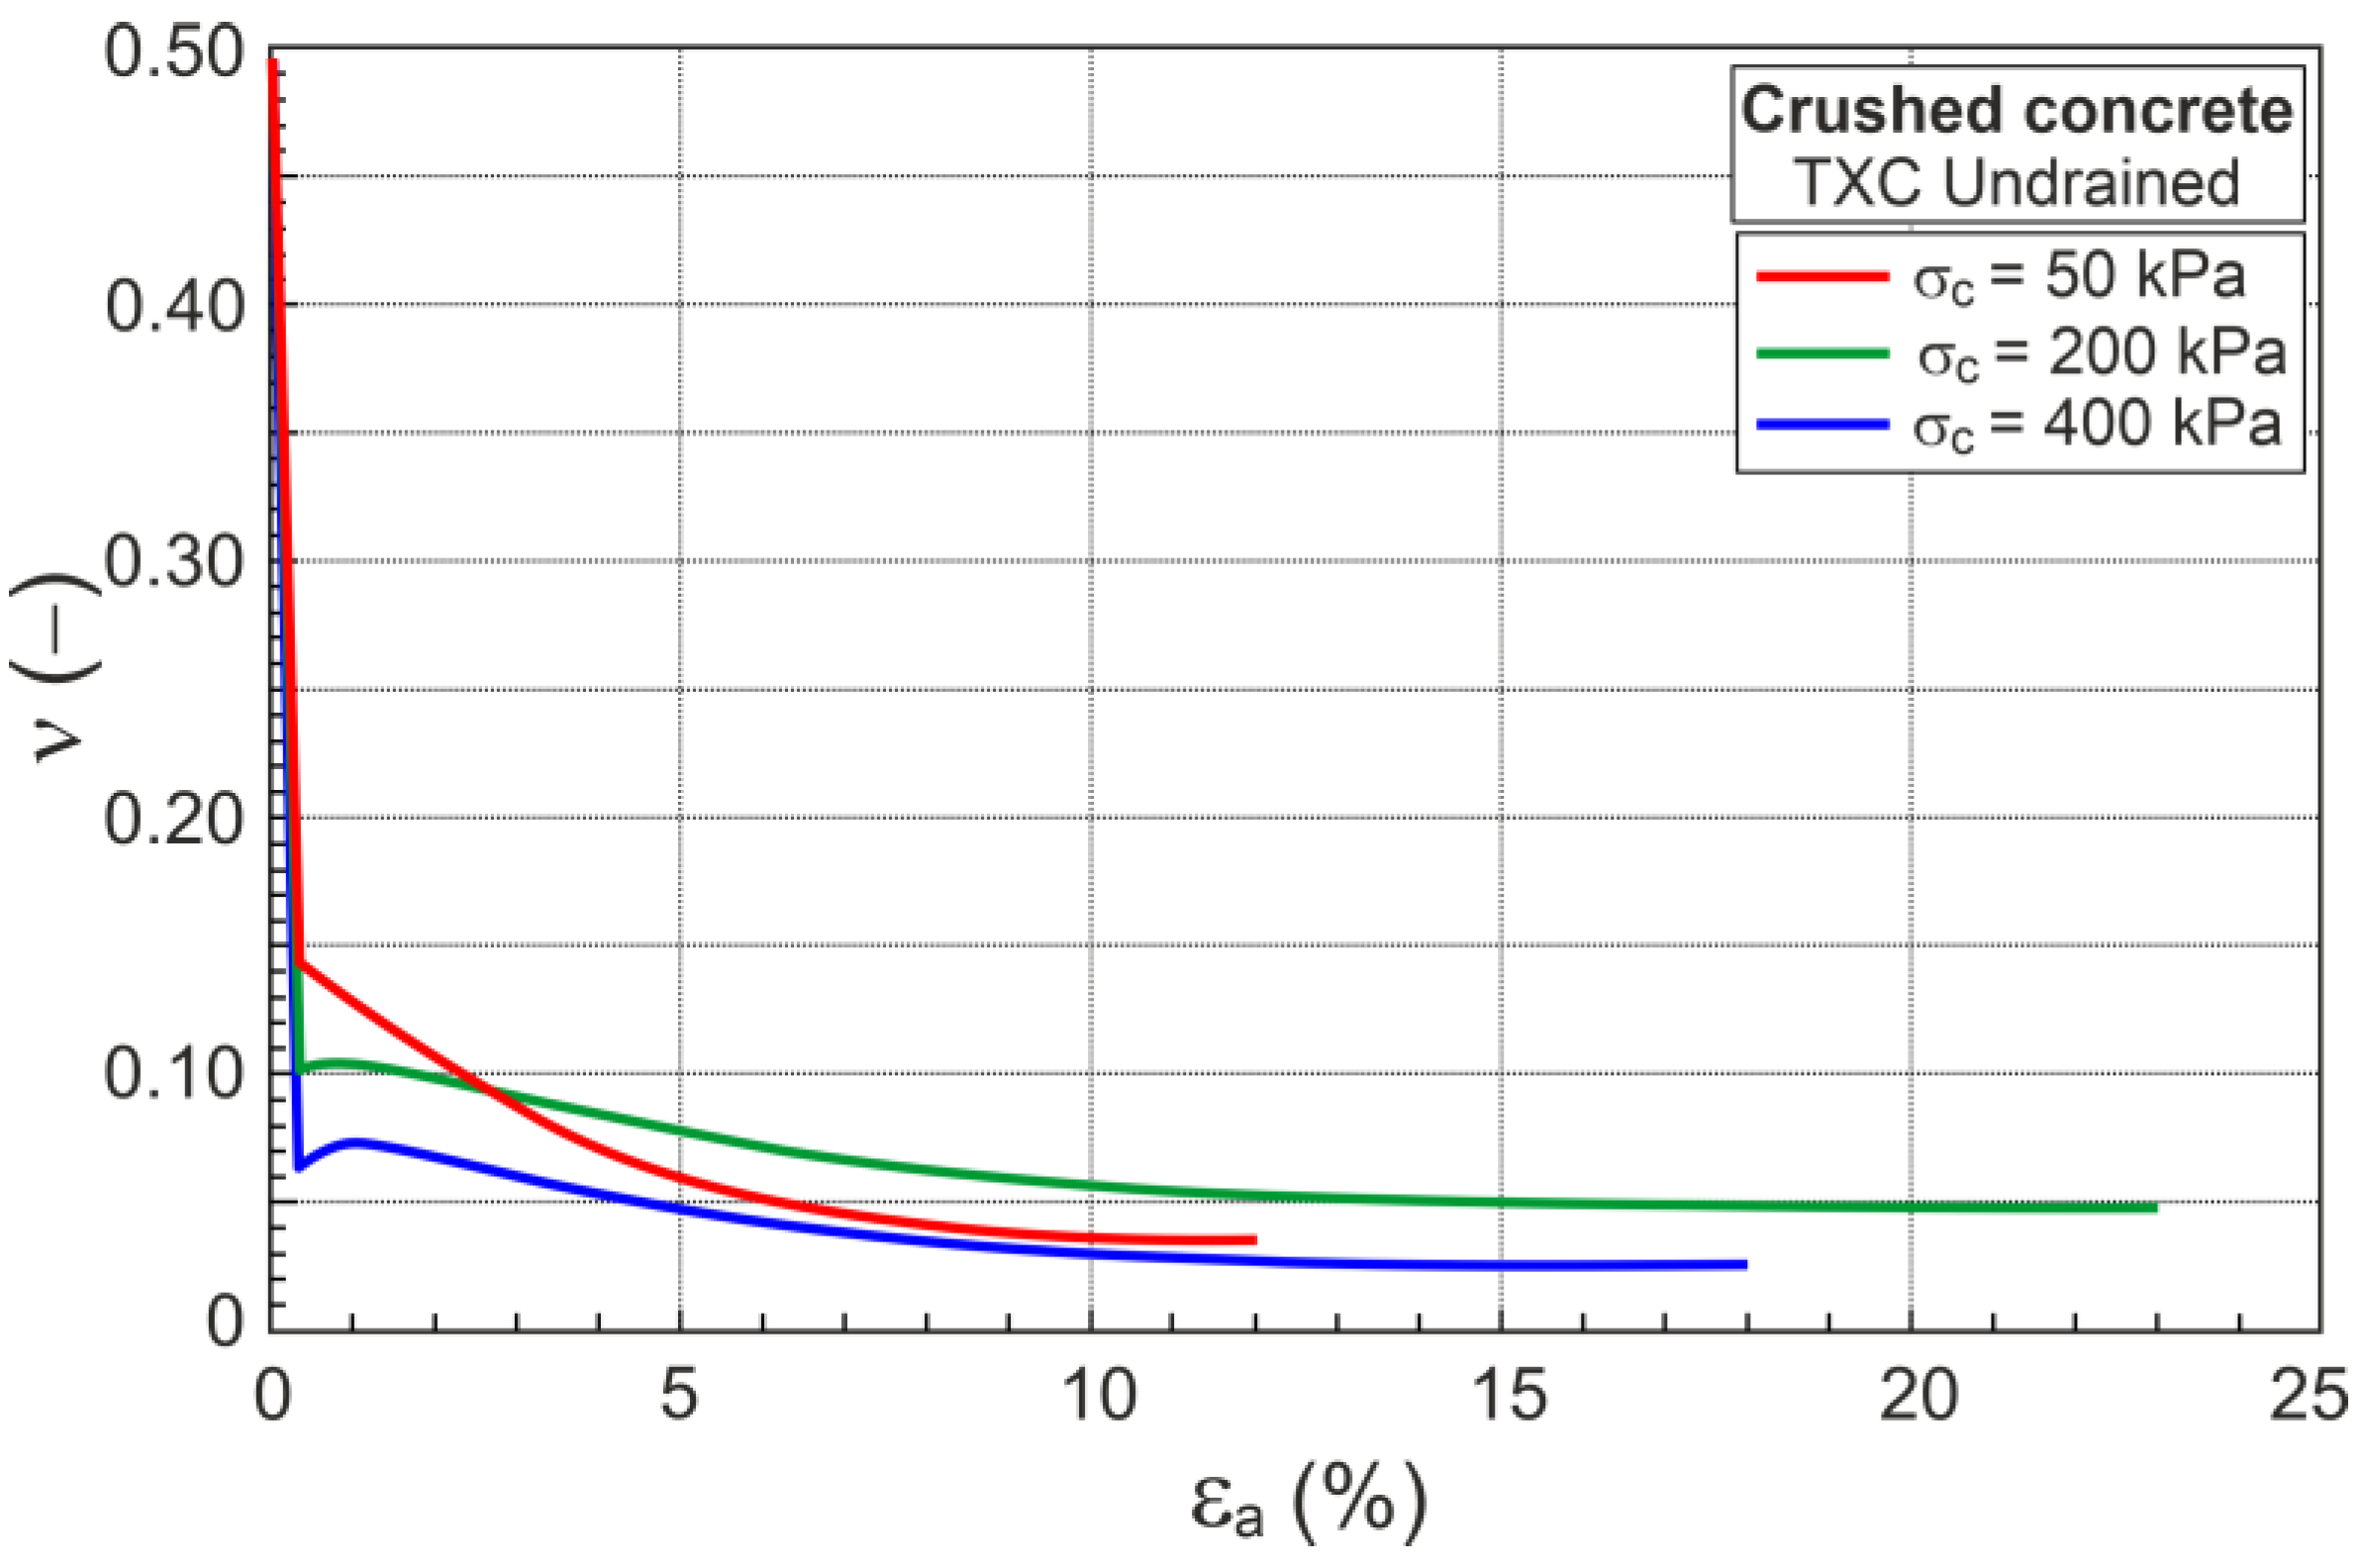
6. Elasticity Parameters
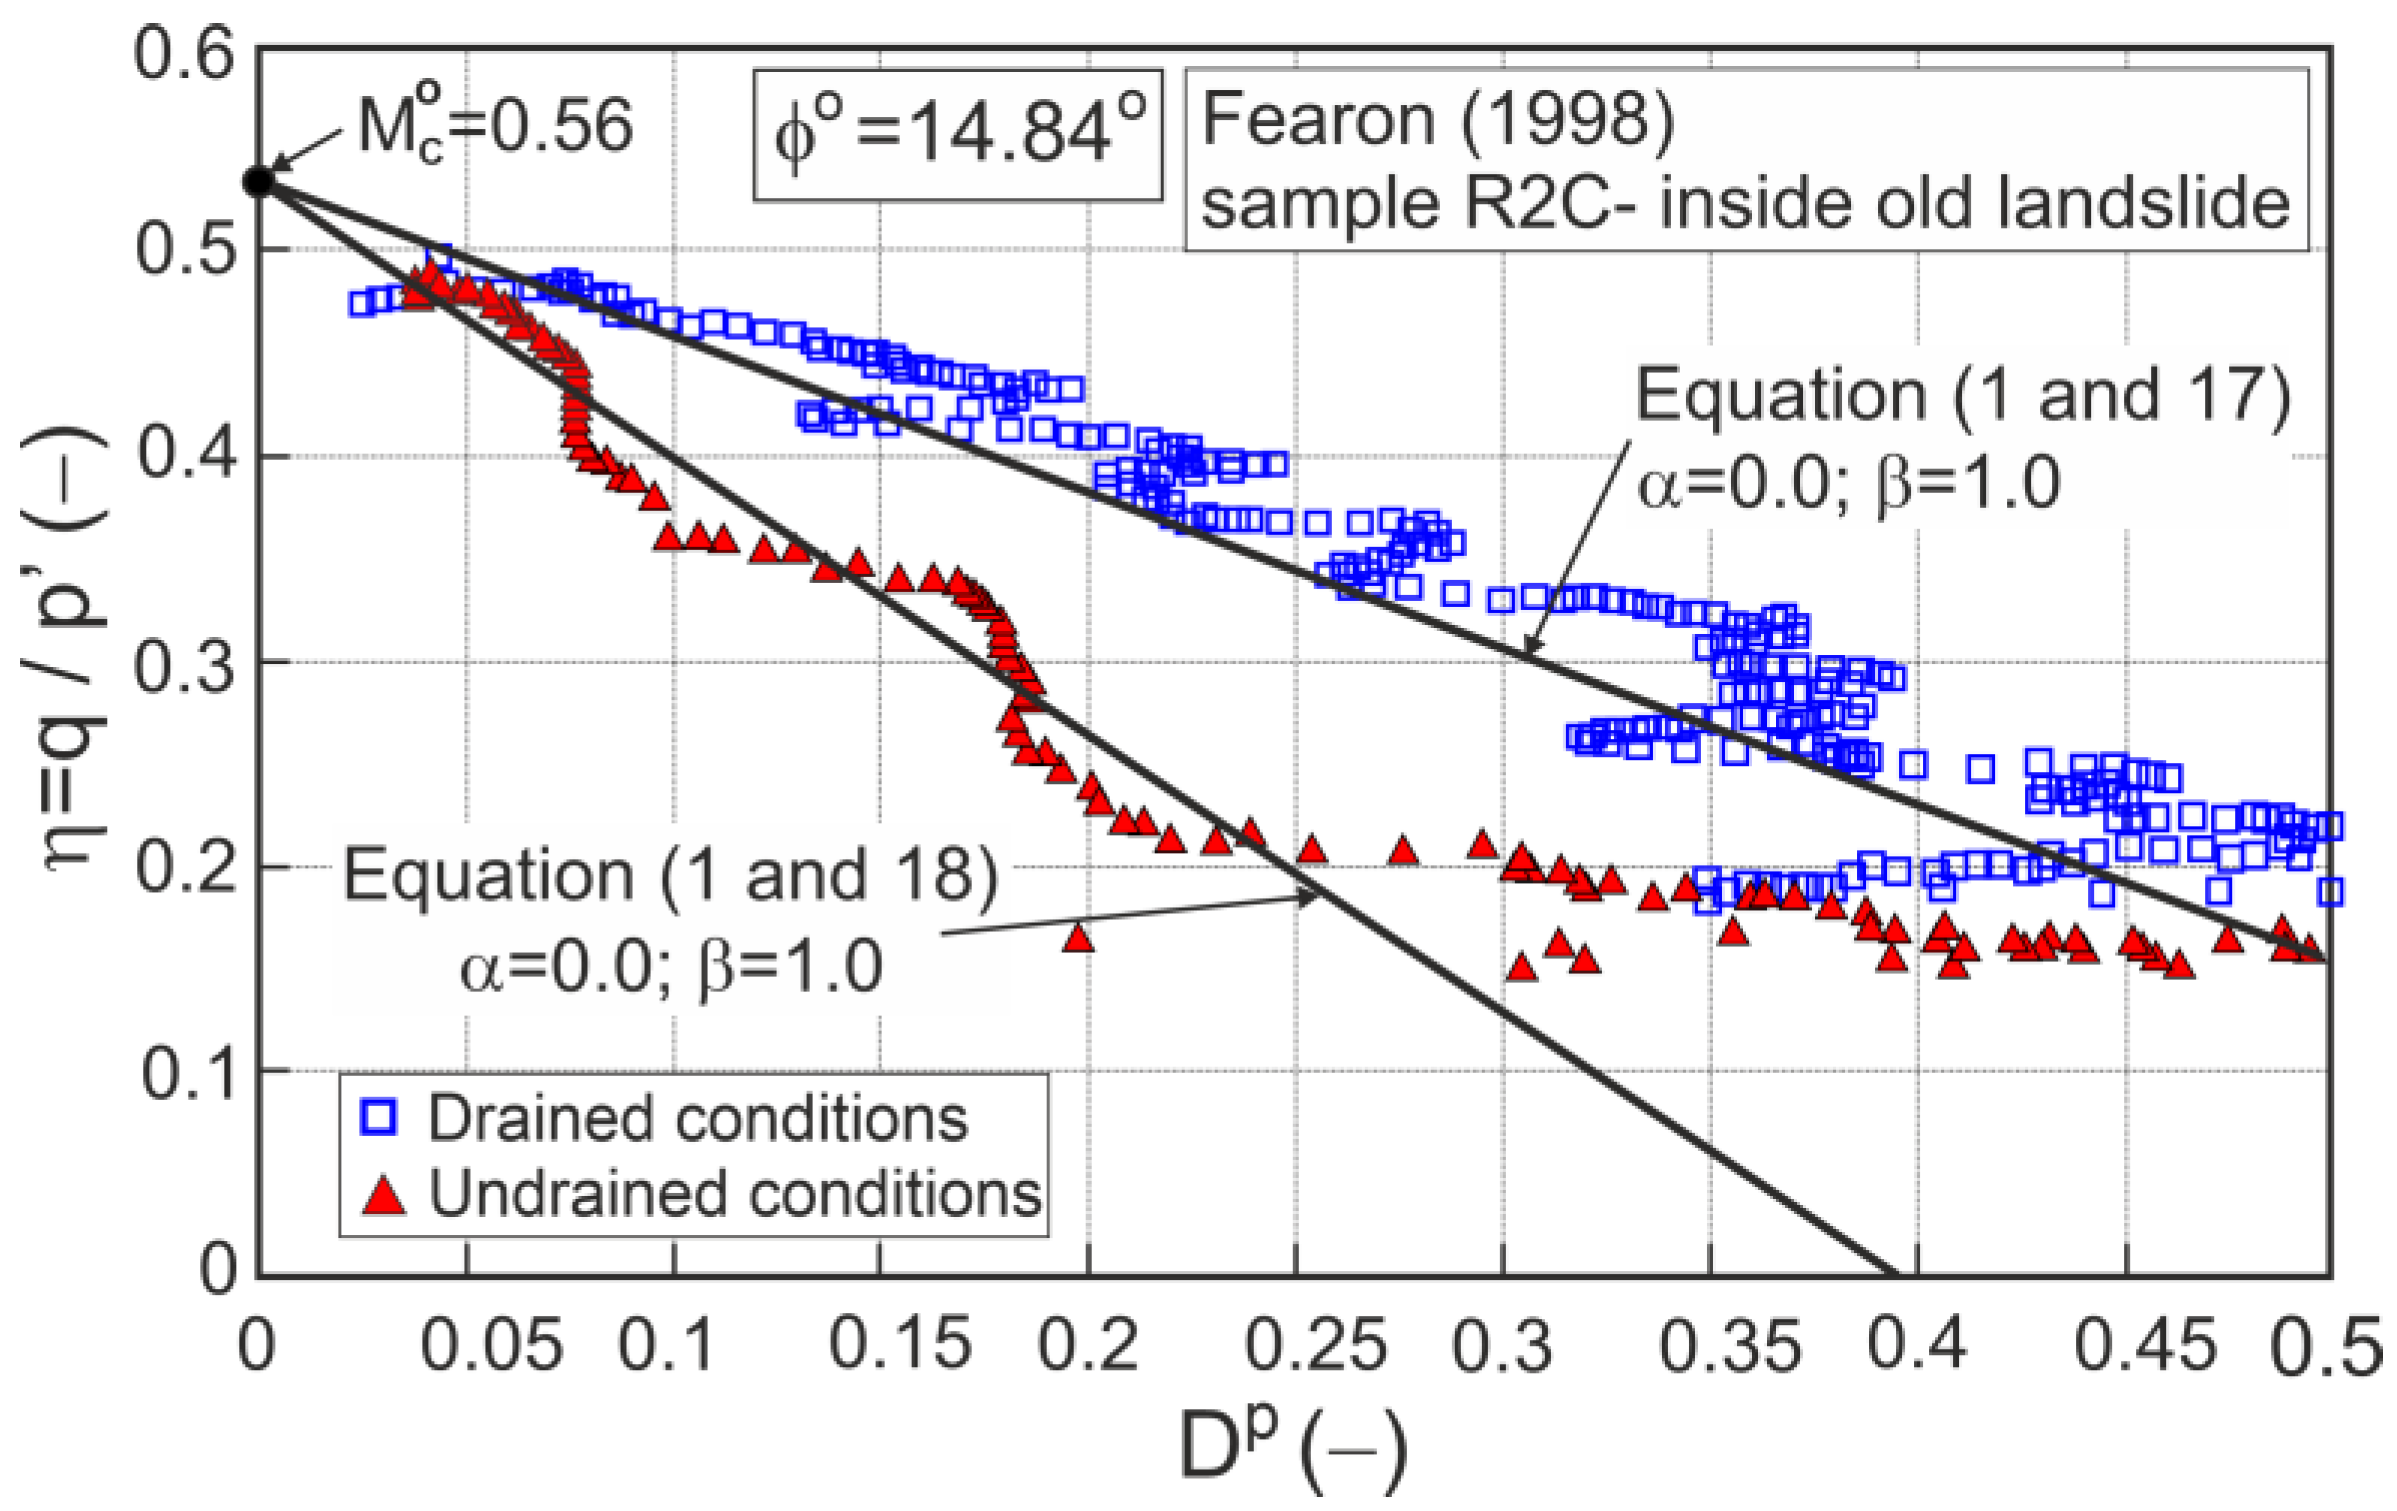
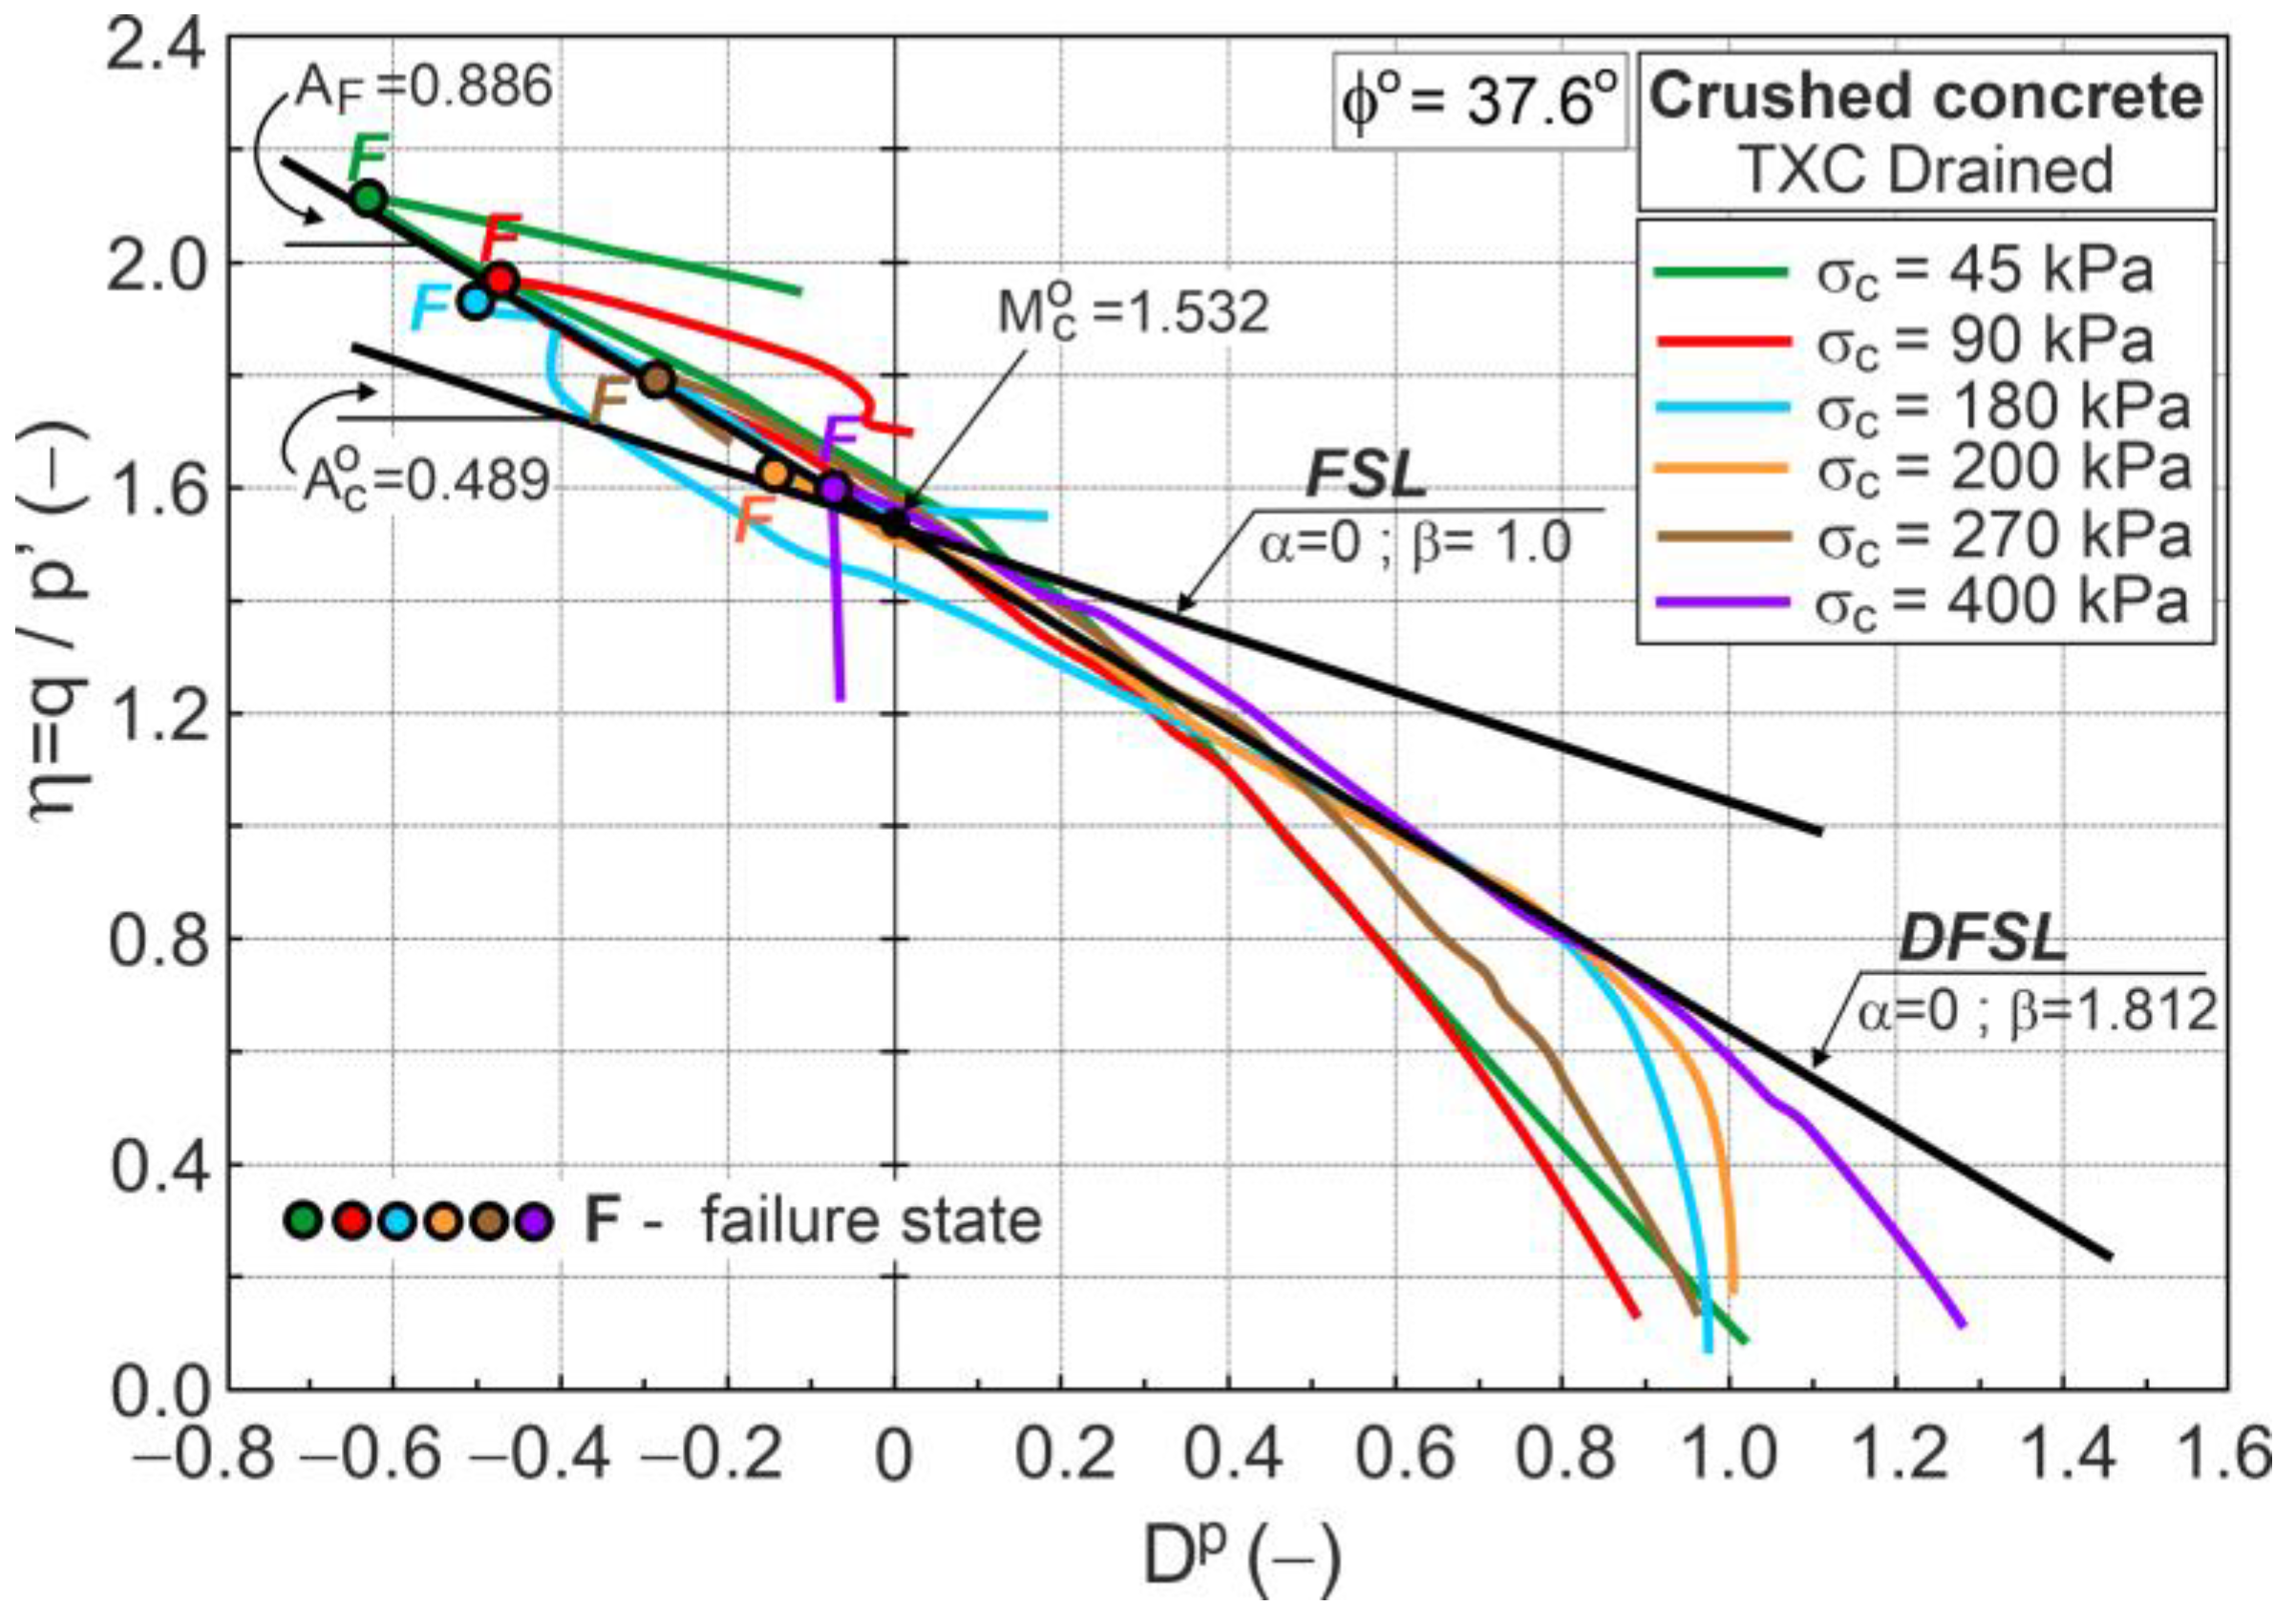
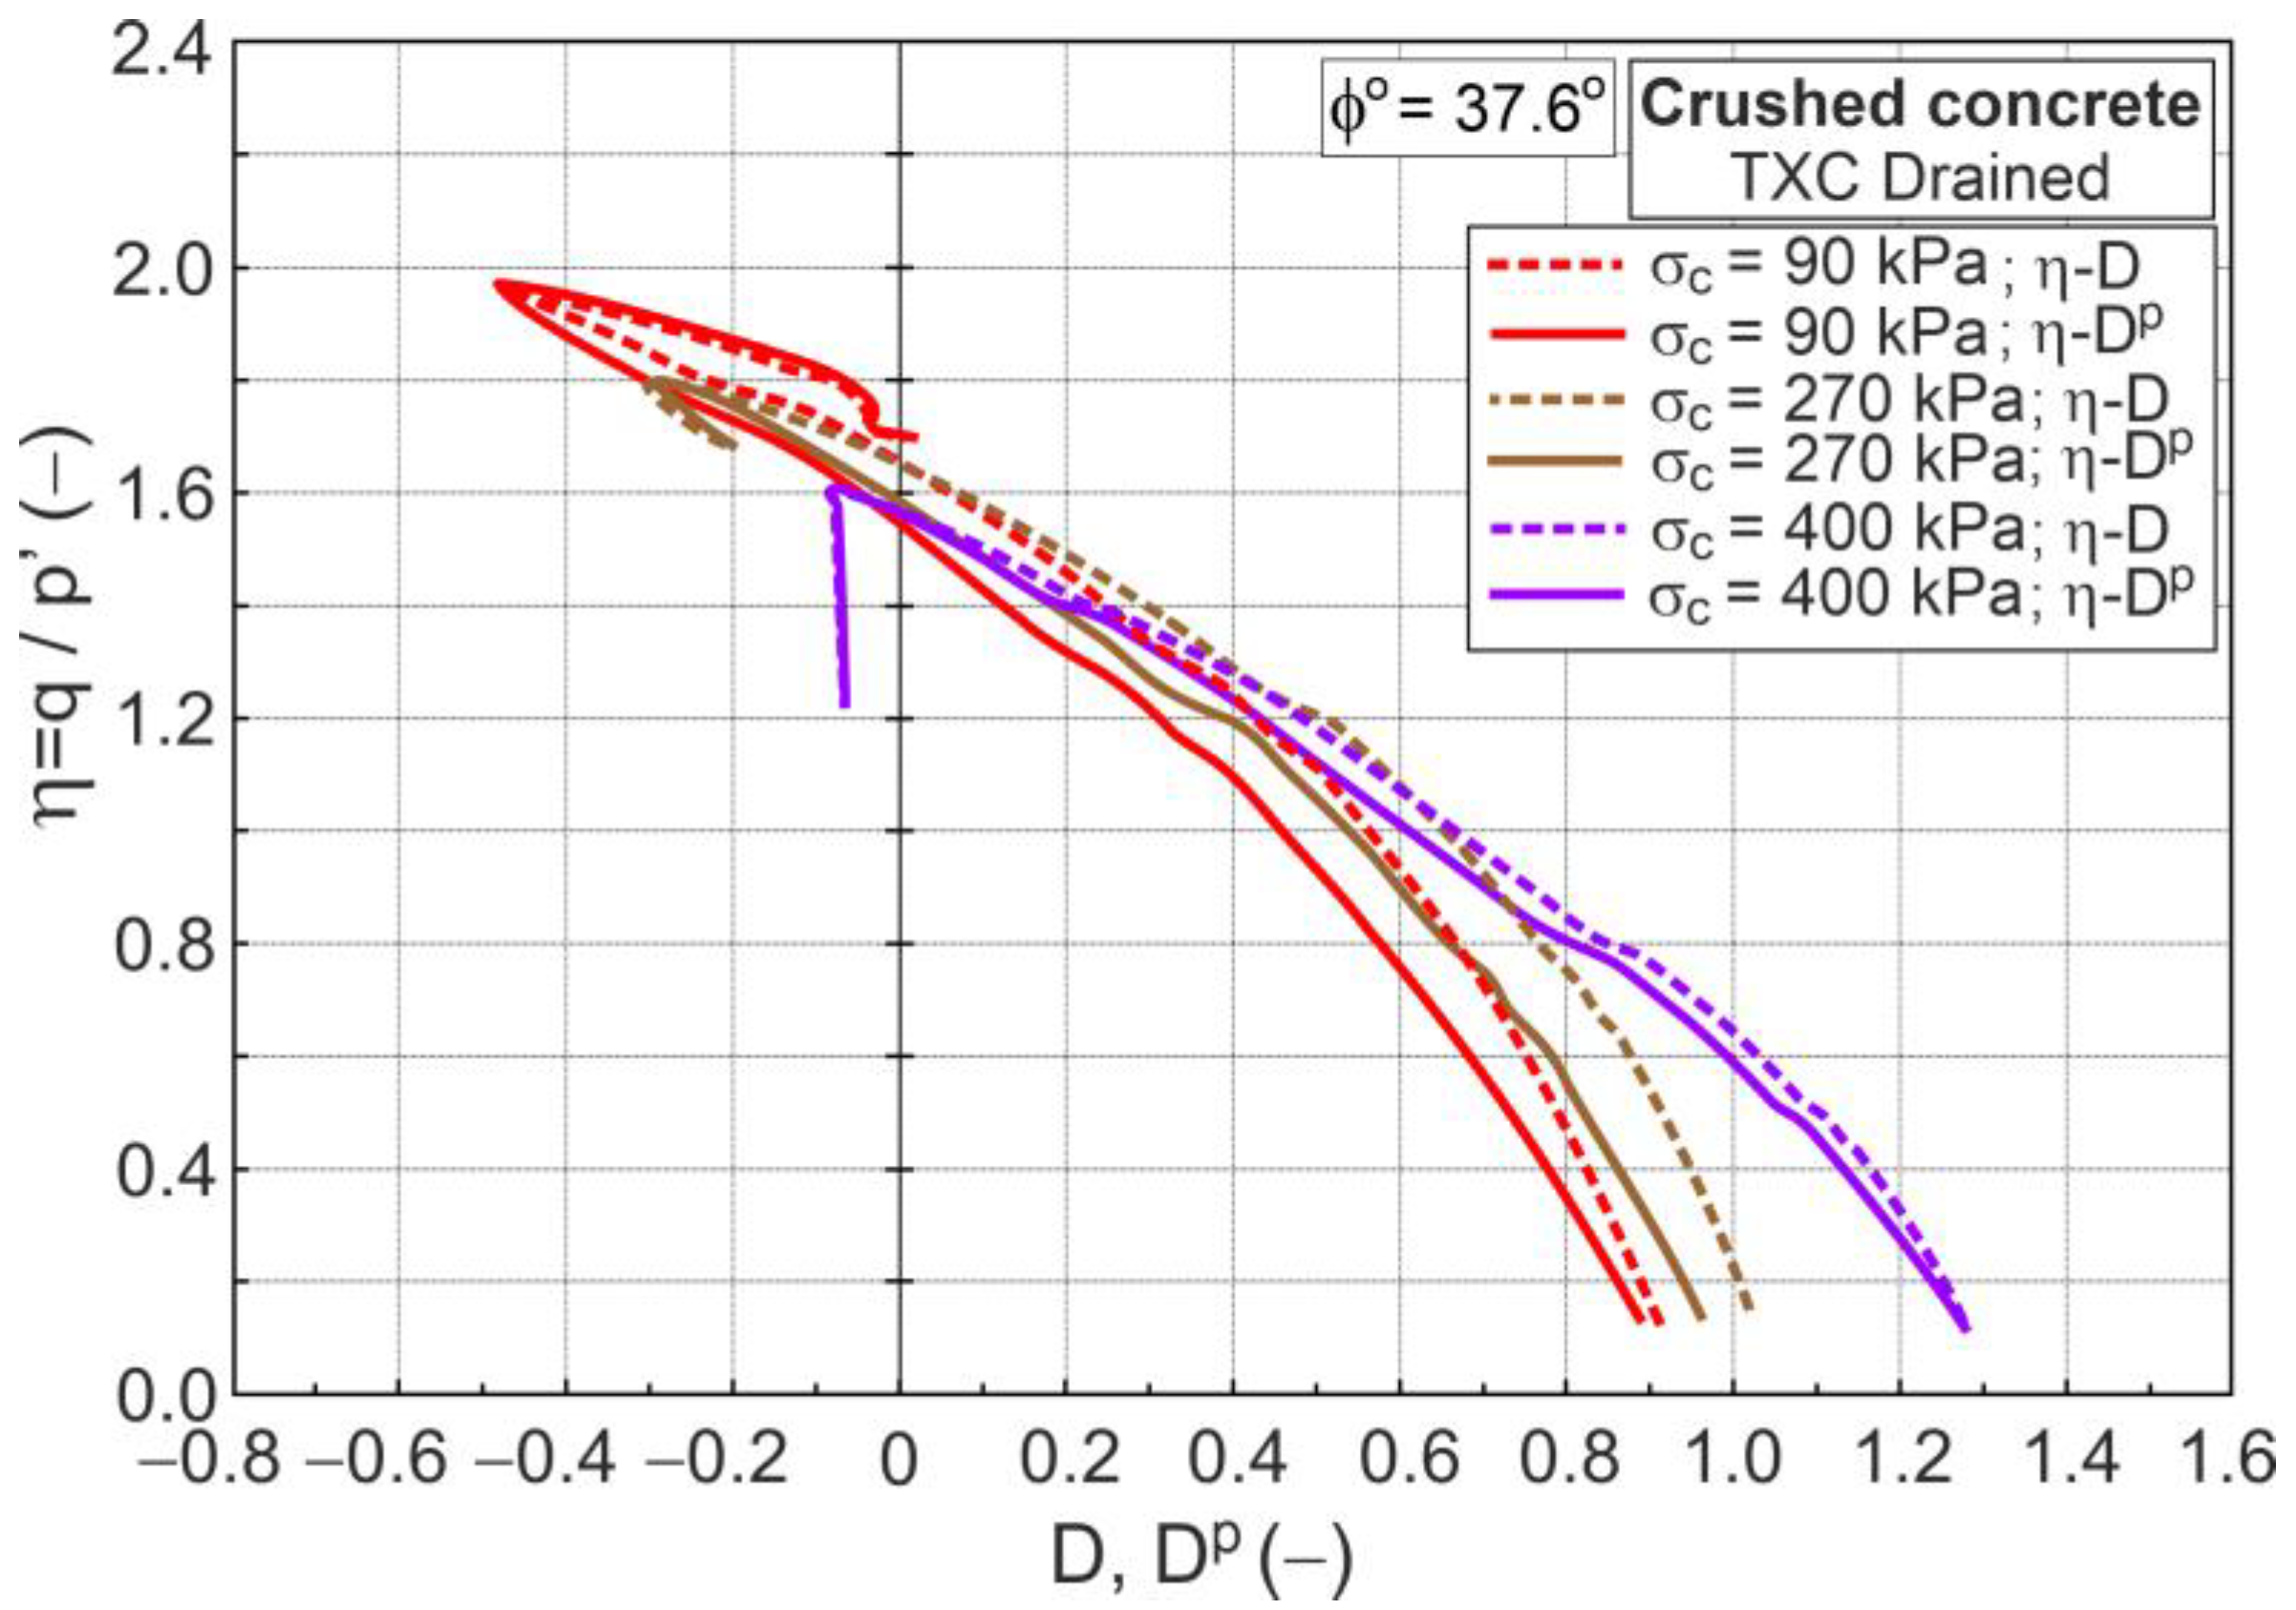
7. Stress Ratio–Plastic Dilatancy Relationship
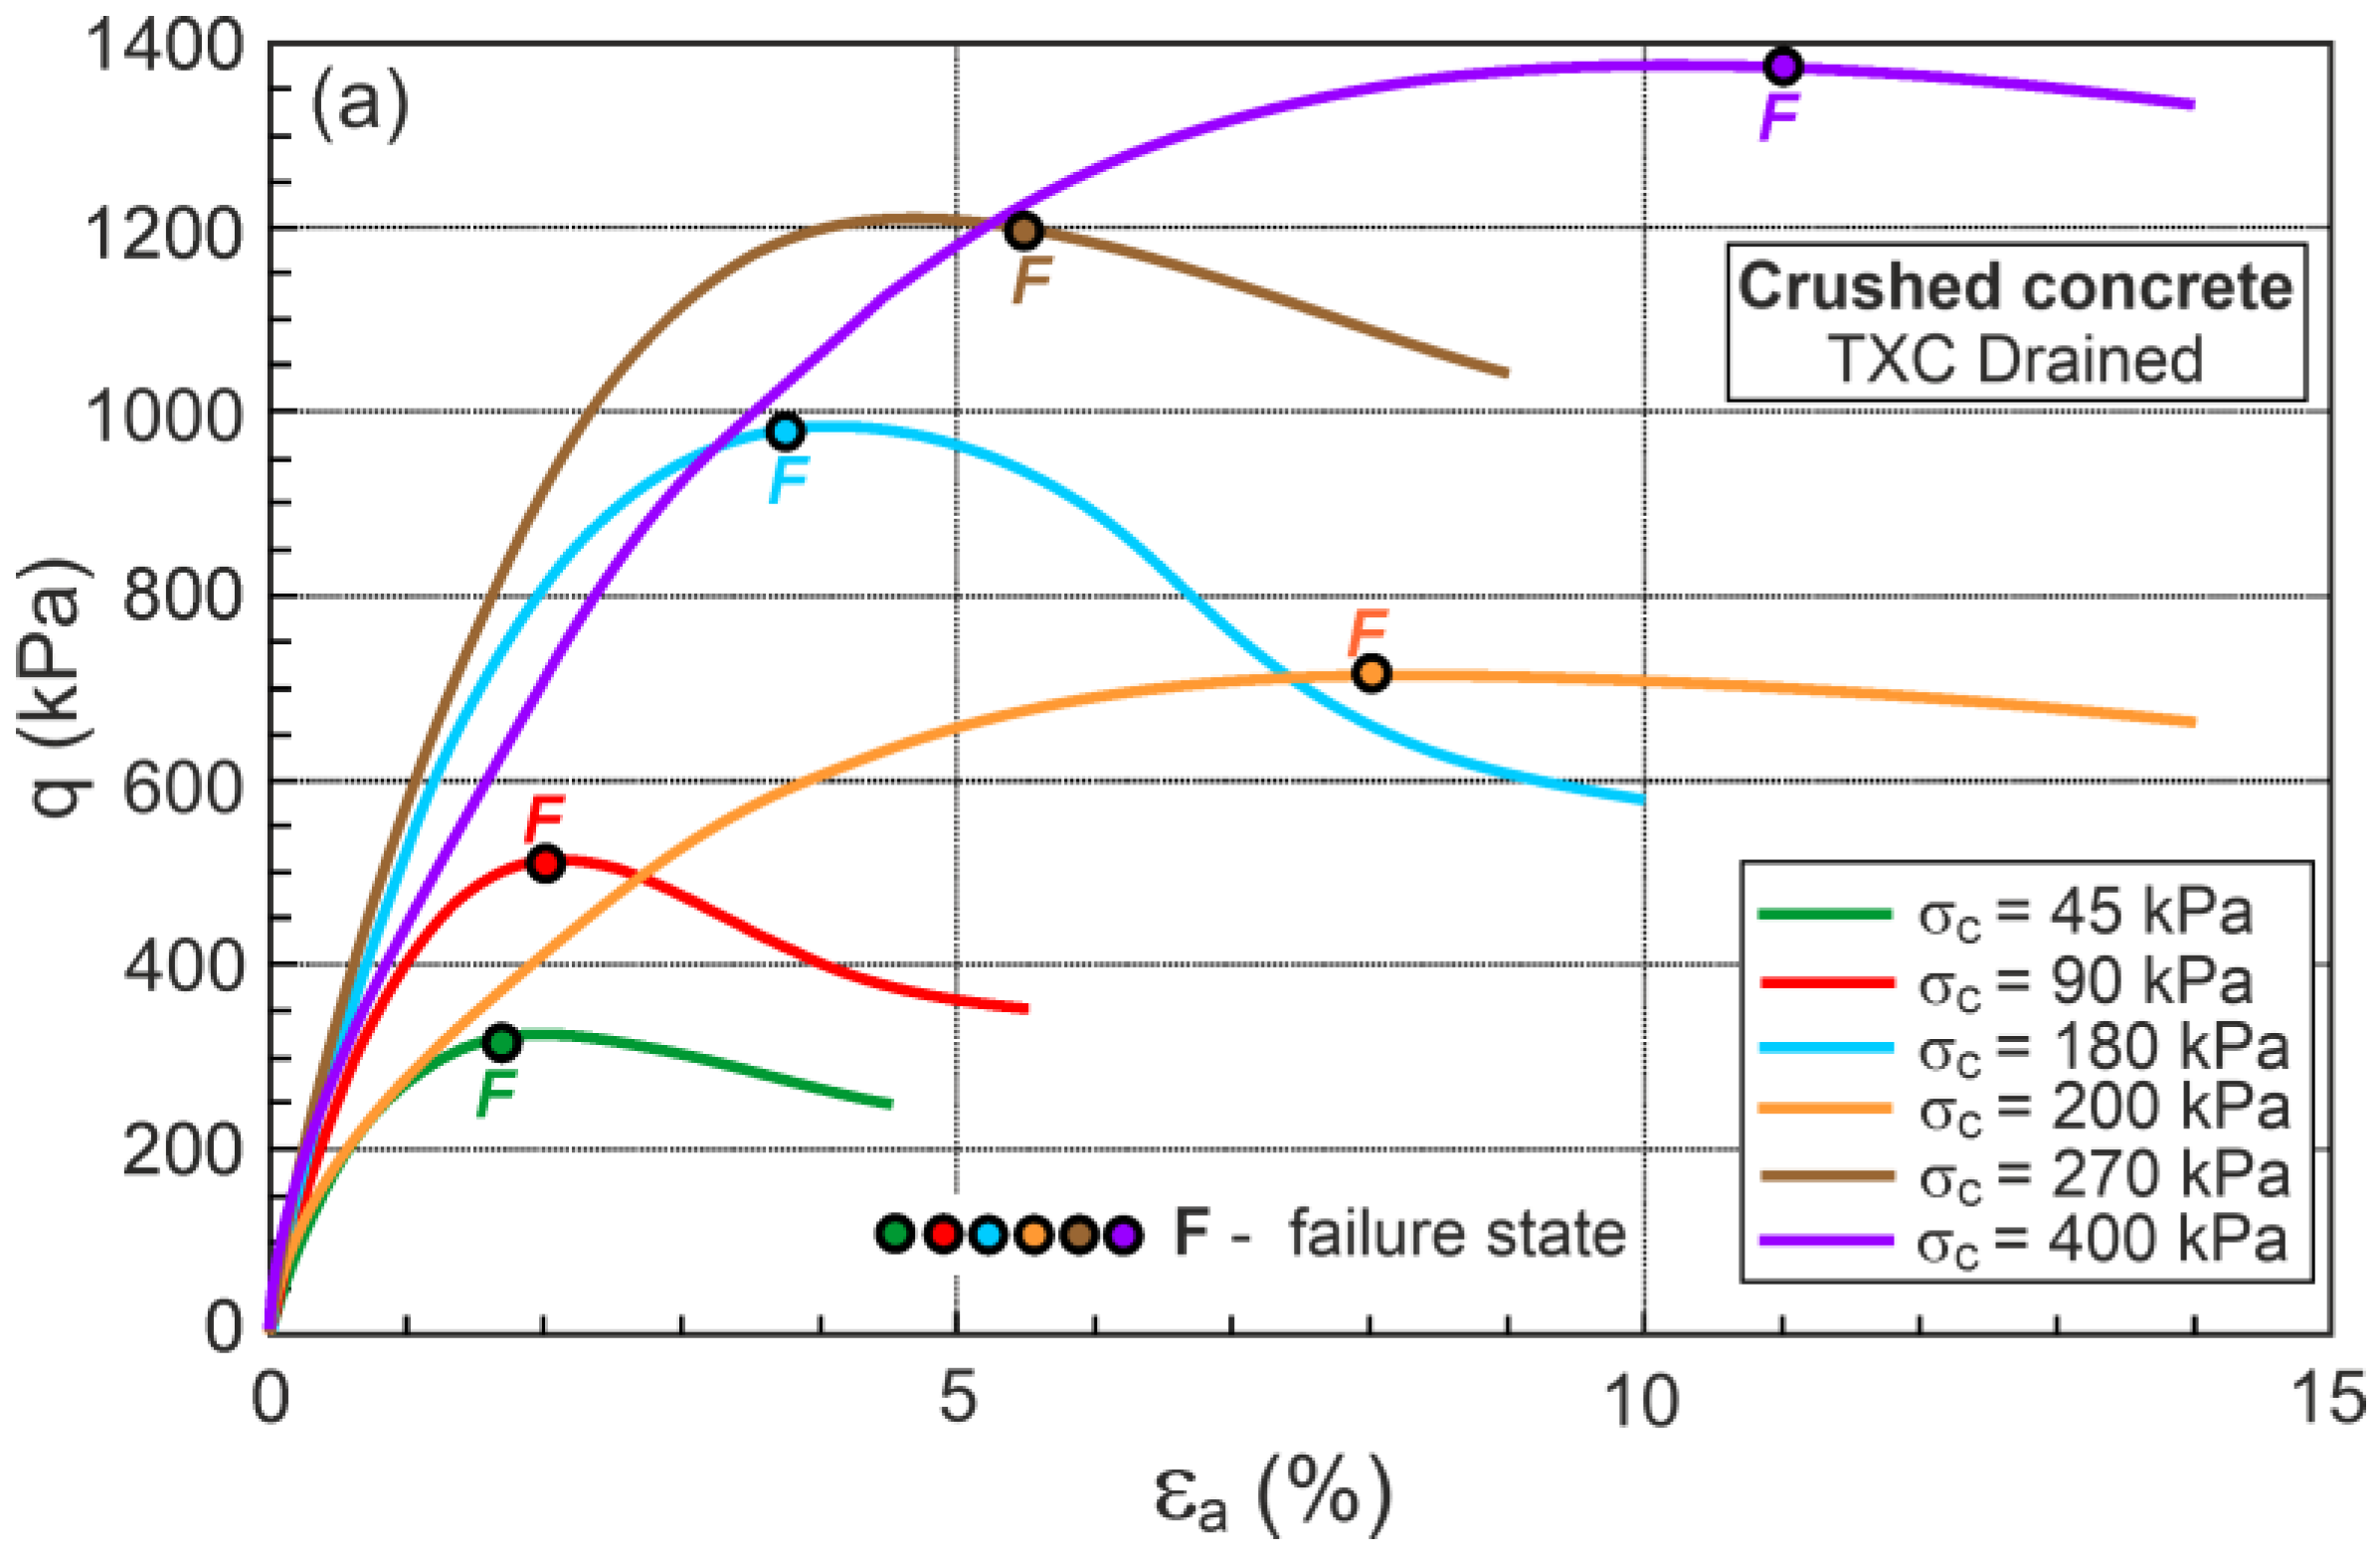
7.1. Drained Conditions
7.2. Undrained Conditions
8. Conclusions
- (1)
- The characteristic behavior of crushed concrete during triaxial shearing can be described using the frictional state concept.
- (2)
- The dilatant failure state can be easily identified only in the stress ratio–plastic dilatancy plane.
- (3)
- The values of the parameter, which represents the crushing effect, are almost identical for drained and undrained conditions. This means that the assumptions of the frictional state concept are correct. The crushing effect in the shearing of crushed concrete is observed at low stress levels.
- (4)
- The stress ratio–plastic dilatancy relationship, which is very important in elastic-plastic modeling, can be parametrized using the frictional state concept.
Author Contributions
Funding
Institutional Review Board Statement
Informed Consent Statement
Data Availability Statement
Acknowledgments
Conflicts of Interest
References
- Shi, X.; Mukhopadhyay, A.; Zollinger, D.; Grasley, Z. Economic input-output life cycle assessment of concrete pavement containing recycled concrete aggregate. J. Clean. Prod. 2019, 225, 414–425. [Google Scholar] [CrossRef]
- Nwakaire, C.M.; Yap, S.P.; Onn, C.C.; Yuen, C.W.; Ibrahim, H.A. Utilisation of recycled concrete aggregates for sustainable highway pavement applications; a review. Constr. Build. Mater. 2020, 235, 117444. [Google Scholar] [CrossRef]
- Ali, M.M.Y.; Arulrajah, A. Potential use of Recycled Crushed Concrete-Recycled Crushed Glass Blends in Pavement Subbase Applications. In Proceedings of the GeoCongress 2012, Oakland, CA, USA, 25–29 March 2012. [Google Scholar]
- Cai, X.; Wu, K.; Huang, W.; Yu, J.; Yu, H. Application of recycled concrete aggregates and crushed bricks on permeable concrete road base. Road Mater. Pavement Des. 2021, 22, 2181–2196. [Google Scholar] [CrossRef]
- Kisku, N.; Joshi, H.; Ansari, M.; Panda, S.K.; Nayak, S.; Dutta, S.C. A critical review and assessment for usage of recycled aggregate as sustainable construction material. Constr. Build. Mater. 2017, 131, 721–740. [Google Scholar] [CrossRef]
- Kalinowska-Wichrowska, K.; Pawluczuk, E.; Bołtryk, M.; Jimenez, J.R.; Fernandez-Rodriguez, J.M.; Suescum Morales, D. The Performance of Concrete Made with Secondary Products—Recycled Coarse Aggregates, Recycled Cement Mortar, and Fly Ash–Slag Mix. Materials 2022, 15, 1438. [Google Scholar] [CrossRef] [PubMed]
- CCANZ. Best Practice Guide for the Use of “RAs in New Concrete”; Technical Report TR 14; Cement & Concrete Association of New Zealand (CCANZ): Wellington, New Zealand, 2011. [Google Scholar]
- Marinković, S.; Carević, V. Comparative studies of the life cycle analysis between conventional and recycled aggregate concrete. In New Trends in Eco-Efficient and Recycled Concrete; de Brito, J., Agrela, F., Eds.; Woodhead Publishing Series in Civil and Structural Engineering; Woodhead Publishing: Sawston, UK, 2019; pp. 257–291. [Google Scholar] [CrossRef]
- Aquil, U.; Tatsuoka, F.; Uchmura, T.; Lohant, T.N.; Tomita, Y.; Matsushima, K. Strength and deformation characteristics of recycled concrete aggregate as a backfill material. Soils Found. 2005, 45, 53–72. [Google Scholar] [CrossRef] [PubMed]
- Meddah, M.S.; Al-Harthy, A.; Ismail, M.A. Recycled Concrete Aggregates and Their Influences on Performances of Low and Normal Strength Concretes. Buildings 2020, 10, 167. [Google Scholar] [CrossRef]
- Gómez-Soberón, J.M.V. Porosity of recycled concrete with substitution of recycled concrete aggregate: An experimental study. Cem. Concr. Res. 2002, 32, 1301–1311. [Google Scholar] [CrossRef]
- Tam, V.W.Y.; Soomro, M.; Evangelista, A.C.J. A review of recycled aggregate in concrete applications (2000–2017). Constr. Build. Mater. 2018, 172, 272–292. [Google Scholar] [CrossRef]
- Arulrajah, A.; Piratheepan, J.; Disfani, M.M. Reclaimed asphalt pavement and recycled concrete aggregate blends in pavement subbases: Laboratory and field evaluation. J. Mater. Civ. Eng. 2014, 26, 349–357. [Google Scholar] [CrossRef]
- Kianimehr, M.; Shourijeh, P.T.; Binesh, S.M.; Mohammadinia, A.; Arulrajah, A. Utilization of recycled concrete aggregates for light-stabilization of clay soils. Constr. Build. Mater. 2019, 227, 116792. [Google Scholar] [CrossRef]
- Akbas, M.; Subasi, O.; Iyisan, R. The effect of RCA pavements on the liquefaction-induced settlement. Sci. Rep. 2023, 13, 6944. [Google Scholar] [CrossRef] [PubMed]
- Akbarimehr, D.; Fakharian, K. Dynamic shear modulus and damping ratio of clay mixed with waste rubber using cyclic triaxial apparatus. Soil Dyn. Earthq. Eng. 2021, 140, 106435. [Google Scholar] [CrossRef]
- Tatsuoka, F.; Tomita, Y.-I.; Iguchi, Y.; Hirakawa, D. Strength and stiffness of compacted crushed concrete aggregate. Soils Found. 2013, 53, 835–852. [Google Scholar] [CrossRef]
- Indraratna, B.; Thakur, P.K.; Vinod, J.S. Experimental and numerical study of railway ballast behaviour under cyclic loading. Int. J. Geomech. 2010, 10, 136–144. [Google Scholar] [CrossRef]
- Honkanadavar, N.P.; Sharma, K.G. Testing and modelling the behaviour of riverbed and blasted quarrird rockfill materials. Int. J. Geomech. 2014, 14, 04014028. [Google Scholar] [CrossRef]
- Liu, M.; Gao, Y. Constitutive modeling of coarse-grained materials incorporating the effect of particle breakage on critical state behaviour in a framework of generalized plasticity. Int. J. Geomech. 2017, 17, 04016113. [Google Scholar] [CrossRef]
- Xiao, Y.; Liu, H. Elastoplastic constitutive model for rockfill materials considering particle breakage. Int. J. Geomech. 2017, 17, 04016041. [Google Scholar] [CrossRef]
- Xiao, Y.; Sun, Y.; Hanif, K.F. A particle breakage critical state model for rockfill material. Sci. China Technol. Sci. 2015, 58, 1125–1136. [Google Scholar] [CrossRef]
- Yin, Z.-Y.; Hicher, P.-Y.; Yin, Y.-F. Practice of Constitutive Modelling for Satureted Soil; Tongji University Press and Springer Nature Pte Ltd.: Singapore, 2020. [Google Scholar] [CrossRef]
- Szypcio, Z. Stress-dilatancy behaviour of calcareous sand. In Proceedings of the 8th International Symposium on Deformation Characteristic of Geomaterials, Porto, Portugal, 3–6 September 2023; Available online: https://www.issmge.org/publications/online-library?database=121&conference=all&page=4 (accessed on 29 September 2023).
- Schofield, A.; Wroth, P. Critical State Soil Mechanics; McGrow-Hill: London, UK, 1986. [Google Scholar]
- Dołżyk-Szypcio, K. Stress-strain behaviour of Toyoura sand in undrained triaxial compression. E3S Web Conf. 2019, 92, 15010. [Google Scholar] [CrossRef]
- Fearon, R. The Behaviour of Structurally Complex Clay from Italian Landslide. Ph.D. Thesis, City University London, London, UK, 1998. Available online: https://openaccess.city.ac.uk/id/eprint/7575/ (accessed on 29 September 2023).
- EN 206:2013+A2:2021/1M:2022; Concrete Part 1: Requirements, Performance, Production and Conformity. PKN: Warsaw, Poland, 2022.
- Abedinzadeh, Y.; Abedinzadeh, R. Quantification of particle shape and angularity using the image analyzer. Geotech. Test. J. 1991, 14, 269–308. [Google Scholar]
- PN-EN ISO 17892-4:2017-01; Rozpoznanie i Badania Geotechniczne—Badania Laboratoryjne Gruntów—Część 4: Badanie Uziarnienia Gruntów. PKN: Warsaw, Poland, 2017. Available online: https://sklep.pkn.pl/pn-en-iso-17892-4-2017-01e.html (accessed on 22 February 2018).
- PN-EN ISO 14688-1:2018-05; Rozpoznanie i Badania Geotechniczne—Oznaczanie i Klasyfikowanie Gruntów—Część 1: Oznaczanie i Opis. PKN: Warsaw, Poland, 2018. Available online: https://sklep.pkn.pl/pn-en-iso-14688-1-2018-05e.html (accessed on 22 February 2018).
- Kowalska, M. Compactness of Scrap Tyre Rubber Aggregates in Standard Proctor Test. Procedia Eng. 2016, 161, 975–979. [Google Scholar] [CrossRef]
- Sulewska, M. Neural modelling of compactibility characteristics of cohesionless soil. Comput. Assist. Methods Eng. Sci. 2010, 17, 27–40. [Google Scholar]
- Pisarczyk, S. Zagęszczalność Gruntów Gruboziarnistych i Kamienistych (Compactibility of Coarse-Grained and Stony Soils); Warsaw University of Technology: Warsaw, Poland, 1977. [Google Scholar]
- PN-EN 1744-1:2000; Badania Chemicznych Właściwości Kruszyw—Część 1: Analiza Chemiczna. PKN: Warsaw, Poland, 2010. Available online: https://sklep.pkn.pl/pn-en-1744-1-2000p.html (accessed on 22 February 2018).
- Kiedryńska, L.; Papciak, D.; Granops, M. Chemia Sanitarna; WULS-SGGW: Warsaw, Poland, 2006. [Google Scholar]
- PN-Z-15009:1997; Odpady Stałe. Przygotowanie Wyciągu Wodnego. PKN: Warsaw, Poland, 1997. Available online: https://sklep.pkn.pl/pn-z-15009-1997p.html (accessed on 22 February 2018).
- PN-EN ISO 17892-9:2018-05; Rozpoznanie i Badania Geotechniczne—Badania Laboratoryjne Gruntów—Część 9: Ściskanie Trójosiowe z Konsolidacją na Próbkach Całkowicie Nasyconych Wodą. PKN: Warsaw, Poland, 2020. Available online: https://sklep.pkn.pl/pn-en-iso-17892-9-2018-05p.html (accessed on 22 February 2018).
- Gabryś, K.; Sas, W.; Soból, E.; Głuchowski, A. Application of Bender Elements Technique in Testing of Anthropogenic Soil—Recycled Concrete Aggregate and Its Mixture with Rubber Chips. Appl. Sci. 2017, 7, 741. [Google Scholar] [CrossRef]
- Gabryś, K.; Soból, E.; Sas, W.; Šadzevičius, R.; Skominas, R. Warsaw Glacial Quartz Sand with Different Grain-Size Charac-teristics and Its Shear Wave Velocity from Various Interpretation Methods of BET. Materials 2021, 14, 544. [Google Scholar] [CrossRef] [PubMed]
- Jastrzębska, M.; Tokarz, K. Strength Characteristics of Clay–Rubber Waste Mixtures in Low-Frequency Cyclic Triaxial Tests. Minerals 2021, 11, 315. [Google Scholar] [CrossRef]
- Gabryś, K.; Radzevičius, A.; Szymański, A.; Šadzevičius, R. Shear Strength Characteristics of Recycled Concrete Aggregate and Recycled Tire Waste Mixtures from Monotonic Triaxial Tests. Materials 2021, 14, 7400. [Google Scholar] [CrossRef] [PubMed]
- Molina-Gómez, F.; Viana da Foncesa, A.; Ferreira, C.; Camacho-Tauta, J. Small-strain stiffness of liquefiable sands: A comparison between bender elements and resonant-column tests. In Proceedings of the 8th International Symposium on Deformation Characteristic of Geomaterials, Porto, Portugal, 3–6 September 2023; Available online: https://www.issmge.org/publications/publication/small-strain-stiffness-of-liquefiable-sands-a-comparison-between-bender-elements-and-resonant-column-tests (accessed on 25 October 2023).
- Lee, J.S.; Santamarina, J.C. Bender elements: Performance and signal interpretation. J. Geotech. Geoenviron. Eng. 2005, 131, 1063–1070. [Google Scholar] [CrossRef]
- Patel, A.; Singh, D.N.; Singh, K.K. Performance analysis of piezo-ceramic elements in soils. Geotech. Geol. Eng. 2010, 28, 681–694. [Google Scholar] [CrossRef]
- Szypcio, Z. Stress-dilatancy of gravel for triaxial compression tests. Ann. Wars. Univ. Life Sci. SGGW Land Reclam. 2018, 50, 119–128. [Google Scholar] [CrossRef]
- Dołżyk-Szypcio, K. Stress-dilatancy relationship for railway ballast. Stud. Geotech. Mech. 2018, 40, 79–85. [Google Scholar] [CrossRef]
- Indraratna, B.; Ionescu, D.; Christie, H.D. Shear behaviour of railway ballast based on large-scale triaxial tests. J. Geotech. Geoenviron. Eng. 1998, 124, 439–450. [Google Scholar] [CrossRef]
- Zhu, W.; Wang, J.; Wang, L.; Ying, M.; Hu, X.; Fu, H. Effect of particle distribution on the shear behavior of recycled concrete aggregate. Arab. J. Geosci. 2022, 15, 979. [Google Scholar] [CrossRef]


| Specimen | GS a | d50 b | Cu c | Cc d | ρ e | ρ d,max f | ρ d,min g | e h | OMC i |
|---|---|---|---|---|---|---|---|---|---|
| − | mm | − | − | g/cm3 | g/cm3 | g/cm3 | − | % | |
| RCA | 2.60 | 2.50 | 9.09 | 2.59 | 1.80 | 1.710 | 1.390 | 0.600 | 9.5 |
| Specimen | Co | Ni | Cu | Cd | Sulfate | Chlorides | Specific Conductivity | pH |
|---|---|---|---|---|---|---|---|---|
| mg/L | mg/L | mg/L | mg/L | mg/L | mg/L | μS/cm | − | |
| RCA | 0.1180 | <0.015 | 0.013 | <0.008 | 112.3 | 21.6 | 511.7 | 8.17 |
| Acceptance criteria * | 1 | 0.5 | 0.5 | 0.05 | 500 | 1000 |
| Test | Type of Test | Compaction State | Dr a | ρ b | ρd c | e0 d | p′ e | G0 f |
|---|---|---|---|---|---|---|---|---|
| % | g/cm3 | g/cm3 | − | kPa | MPa | |||
| RCA-1 | CD | dense | 65–85 | 1.751 | 1.638 | 0.588 | 45 | 75.461 |
| RCA-2 | CD | 1.772 | 1.634 | 0.592 | 90 | 98.678 | ||
| RCA-3 | CD | 1.793 | 1.675 | 0.594 | 180 | 177.434 |
| * | * | * | |||||
|---|---|---|---|---|---|---|---|
| kPa | − | kPa | kPa | − | − | kPa | − |
| 45 | 0.572 | 21,215 | 75,461 | 3.557 | 3.758 | 21,531 | 0.129 |
| 90 | 0.570 | 26,229 | 98,678 | 3.762 | 28,849 | 0.151 | |
| 180 | 0.566 | 44,874 | 177,439 | 3.954 | 43,954 | 0.119 | |
| 200 | 0.491 | 18,085 | − | − | 17,714 | 0.119 | |
| 270 | 0.564 | 31,152 | − | − | 30,621 | 0.120 | |
| 400 | 0.513 | 30,868 | − | − | 24,174 | 0.052 |
Disclaimer/Publisher’s Note: The statements, opinions and data contained in all publications are solely those of the individual author(s) and contributor(s) and not of MDPI and/or the editor(s). MDPI and/or the editor(s) disclaim responsibility for any injury to people or property resulting from any ideas, methods, instructions or products referred to in the content. |
© 2023 by the authors. Licensee MDPI, Basel, Switzerland. This article is an open access article distributed under the terms and conditions of the Creative Commons Attribution (CC BY) license (https://creativecommons.org/licenses/by/4.0/).
Share and Cite
Gabryś, K.; Dołżyk-Szypcio, K.; Szypcio, Z.; Sas, W. Stress–Strain Behavior of Crushed Concrete as a Special Anthropogenic Soil. Materials 2023, 16, 7381. https://doi.org/10.3390/ma16237381
Gabryś K, Dołżyk-Szypcio K, Szypcio Z, Sas W. Stress–Strain Behavior of Crushed Concrete as a Special Anthropogenic Soil. Materials. 2023; 16(23):7381. https://doi.org/10.3390/ma16237381
Chicago/Turabian StyleGabryś, Katarzyna, Katarzyna Dołżyk-Szypcio, Zenon Szypcio, and Wojciech Sas. 2023. "Stress–Strain Behavior of Crushed Concrete as a Special Anthropogenic Soil" Materials 16, no. 23: 7381. https://doi.org/10.3390/ma16237381