Article

Finite Element Analysis of Subperiosteal Implants in Edentulism—On the Basis of the MaI Implant® by Integra Implants®

1
Stomatologia na Ksiezym Mlynie, 16D Tymienieckiego, 90-365 Lodz, Poland
2
Department of Maxillofacial Surgery, Medical University of Lodz, 113st Zeromskiego, 90-001 Lodz, Poland
3
Private Dental Clinic, Tetmajera 3A Rd, 05-080 Izabelin C, Poland
*
Author to whom correspondence should be addressed.
Materials 2023, 16(23), 7466; https://doi.org/10.3390/ma16237466
Submission received: 6 November 2023 / Revised: 18 November 2023 / Accepted: 25 November 2023 / Published: 30 November 2023
(This article belongs to the Section Manufacturing Processes and Systems)

Abstract

:
The MaI Implants® method offers a modern treatment option for specific patients who lack sufficient bone for traditional screw-based implants. The aim of the article is to use Finite Element Analysis (FEA) to examine the behavior of a subperiosteal implant under actual conditions within the oral cavity and to assess the impact of various mechanical factors on the durability of the MaI Implants®. A strength analysis was conducted using Finite Element Analysis for two models. The first was a single subperiosteal implant, while the second was a model of an arch consisting of two single subperiosteal implants connected by a bar. Based on the obtained results, it can be observed that the increase in load from 100 N to 800 N leads to an increase in displacements throughout the implant. Changing the angle from 90 to 30 degrees resulted in a 576% increase in the average displacement value across all multi-units. Stresses in the multi-units range from 23.7 MPa to 268.5 MPa. The lack of proper stabilization of the implant has the greatest impact on the results of displacements. Such displacements are significant for the later positioning of the implant compared to the initial conditions.

1. Introduction

Patients with Cawood and Howell classes from V to VI have limited options of using permanent prosthodontic reconstruction on dental implants. Currently, the gold standard of bone reconstruction is still autogenous bone. Donor sites are, in most cases, the anterior iliac crest or calvarial bone grafts [1]. The main disadvantages of autografts include the need for a second surgical site and the morbidity related to bone harvesting [2].
Moreover, elderly patients are poor candidates for bone augmentation due to their decreased metabolic rate and decreased regenerative capacity [3]. When bone augmentation is not feasible, there are alternatives such as subperiosteal or zygomatic implants.
Another way to help edentulous patients with an atrophied maxilla is to apply zygomatic implants; however, these have a high risk of different complications such as prosthesis failure, zygomatic implant fracture, paresthesia/dysesthesia, oro-antral communication, sinusitis, infection located at the apex of an implant, peri-implant mucositis, peri-implantitis, and retraction of buccal/labial peri-implant tissue or penetration into the orbital cavity [4,5].
The clinical use of subperiosteal implants was largely abandoned over time with the advent of endosseous titanium implants. However, it is not possible to place these in patients with Cawood and Howell classes V–VI unless extensive bone grafting is performed.
Endosseous implants often integrate successfully with bone, but their placement and lasting success rely on having adequate bone quality and volume. Situations like significant bone loss due to disuse, trauma, or tumors can make it challenging or even unfeasible to place these implants [5,6,7]. Even after placing screw-type implants, whether in original alveolar bone or bone regenerated after grafting, the alveolar bone can continue to deteriorate [8].
Thanks to advancements in digital technology, we can now create custom-made implants for individual patients. The breakthroughs in 3D printing have also revived older ideas, like subperiosteal implants. This has led to the development of the Maxilla/Mandible Personalized Implants (MaI Implants®). MaI Implants® are made up of two segments (left and right), tailored to each patient’s skeletal structure using the provided CBCT data. Each segment comprises two wings, a foundational looped frame linking the wings, and the transmucosal multi-units. The wings are positioned at the canine and zygomatic buttress and are anchored there with osteosynthesis screws with a diameter of 2.0 and rescue screws with a diameter of 2.2 in case of the stability being too low. Both segments are initially joined inside the mouth with a provisional acrylic bridge and later replaced by either a metal–porcelain (PFM) bridge, a titanium alloy–acrylic bridge (Ti-acryl), or a titanium–zirconia dioxide–porcelain (Ti-ZrO-porc.) bridge.
The MaI Implants® method offers a modern treatment option for specific patients who lack sufficient bone for traditional screw-based implants (Figure 1). This customized approach not only provides anchorage to the bone but also gives patients immediate functional recovery on the surgery day. Further clinical studies are needed to validate the effectiveness of this updated approach. In the literature, some authors describe the FEA of subperiosteal implants; however, it was not conducted for individual cases and it was designed only for the premolar area [9].
The aim of the article is to use Finite Element Analysis (FEA) to examine the behavior of a subperiosteal implant under actual conditions within the oral cavity and to assess the impact of various mechanical factors on the durability of the MaI Implants®. The null hypothesis is that MaI Implants® are not suitable for edentulous reconstruction in the cases of high maxilla atrophy.

2. Materials and Methods

2.1. Methods

As part of the research section, a strength analysis was conducted using Finite Element Analysis for two models. The first was a single subperiosteal implant, while the second was a model of an arch consisting of two single subperiosteal implants connected by a bar, which was created in the Autodesk Inventor program. Using the Ansys Workbench software 19.4 (Canonsburg, PA, USA), the effect of loading the implants with selected forces and at specific angles on the state of displacements, deformations, and stresses resulting from the simulation was examined. Depending on the model adopted for the study, the simulation consisted of three or four stages.
For the model representing the arch, the first step was to create its geometry necessary for performing calculations. Then, both models underwent discretization, which involved generating a computational grid consisting of triangles of optimal sizes to obtain accurate results. The next step was to define boundary conditions, i.e., constant and unchanging restrictions in the appropriate places, intended to reflect real conditions. The final stage was to perform calculations for both models, taking into account the applied grid, as well as the boundary conditions, and a final analysis of the obtained results along with their graphical presentation (Figure 2).

2.2. Models

To conduct the strength analysis, two models were used: a single subperiosteal implant (Figure 3) and an arch consisting of two implants of the same type connected by a bar (Figure 4). For the subsequent analysis of results, the numbering of multi-units 1–3 and mounting holes 1–9 was additionally carried out for both models, and the arch was detailed into a left implant and a right implant. The geometry of the whole MaI Implant® (Integra Implants, Lodz, Poland) as designed on the basis of the experience of the practitioner, an implantologist and the author of the article. Using Autodesk Inventor software, the arch was designed using the primary subperiosteal implant, upon which a beam was created that was attached to each of the three multi-units, forming an arch connecting both subperiosteal implants. The width of the created arch, measured between the centers of the extreme multi-units of both implants, is about 104 mm, which corresponds to the average anatomical width of the mandible.

2.3. FEA Analysis

To conduct the strength analysis, Ansys software was used, which employs Finite Element Analysis (FEA). This method involves replicating the geometry of a given model by generating a computational grid, defining boundary conditions, i.e., loading the structure and securing the model, and also specifying material parameters based on which the simulation is carried out. The object undergoes discretization and is divided into many simple parts (finite elements) of a specific shape and density, determining the accuracy of the obtained results. The denser the grid, the more accurate the results, but this also extends the computation time. The displacements, deformations, and von Mises stresses resulting from the simulation were selected for analysis, indicating the new positions of the grid nodes after the model’s state change.

2.3.1. Model Import and Materials

Importing models into the Ansys Workbench was carried out by creating a “Geometry” block and loading a file in the .step format, then linking it with “Geometry” in the newly created “StaticStructural” block. In “Engineering Data”, a material was assigned, specifically titanium alloy grade 5—Ti-6Al-4V with the following predefined properties according to norm ISO 5832-2:
  • Density—4.405 [g/cm3],
  • Young’s modulus—107 [GPa],
  • Yield strength—1092 [MPa],
  • Poisson’s ratio—0.323.

2.3.2. Discretization of Models

The selection of the optimal computational grid, which determines the length and accuracy of the calculations, was based on a test analysis for three chosen grid element sizes: 0.2 mm, 0.5 mm, and 1 mm. The first element size resulted in an overly long computation time, while the results obtained between the 0.5 mm and 1 mm grids were similar. Therefore, for a shorter analysis duration, a grid with an element size of 1 mm was chosen. The comparison between the 0.5 mm and 1 mm meshes showed negligible differences in the results. This similarity in outcomes suggests that the 1 mm mesh size is sufficiently fine to capture the necessary detail of the implant geometry without significantly compromising the accuracy of the results. Based on these findings, we chose a 1 mm mesh size for its balance between computational efficiency and accuracy. This decision was not solely based on reducing computation time but also on the observed convergence of results between the 0.5 mm and 1 mm mesh sizes. As a result, the geometry of a single implant was obtained with 128,626 nodes and 71,121 elements, and the full arch was obtained with 282,424 nodes and 156,555 elements.

2.3.3. Border Conditions

The formulation of boundary conditions is essential to accurately replicate the conditions prevailing in the oral cavity during the use of a subperiosteal implant. They allow for certain assumptions and simplifications to be made. For both the single implant model and the arch, the holes (Figure 5a) through which screws are introduced to fix the implant to the bone tissue and the surfaces under the multi-units that rest on the bone tissue(Figure 5b) were taken as the anchoring points. The reason for this was osteosynthesis between the bone and the titanium alloy that lies firmly on the alveolar crest of the bone. Moreover, the multi-unit bar is screwed so that multi-units are more unmovable than any other part of the implant.
The load on the implants can be axial or non-axial. An axially applied force is directed along the long axis of the multi-unit, while a non-axial or horizontal load transfers tensile stresses, causing a bending motion, which is considered destructive [10].The site of the load application on a single implant was chosen as the upper surface in all three multi-units (Figure 6), whereas, in the arch, the site was the surfaces on the bar connecting both implants at the height of each of the six multi-units. Based on literature data (Table 1) [11,12,13,14,15,16,17,18] and despite the fact that the load model according to the PN-EN ISO 14801 standard is made for endosseous implants (Figure 7), the following force variants were chosen.
The reason why the PN-EN ISO 14801 standard was selected is because of the lack of any ISO norms or even data in the literature on how to perform virtual fatigue tests for subperiosteal individual maxillofacial implants.
  • Loads with values of 100 N and 800 N at an angle of 90 degrees relative to the vertical axis of the multi-units.

2.3.4. Localization of Measurements

The displacements, deformations, and stresses resulting from the application of loads were measured on both the external and internal sides of the single implant multi-units and arch, in the mounting holes, which were characterized by the highest values (Figure 8), and also in selected locations on the beam in the case of the arch model (Figure 9). The external side in both examined models is the side with 6 mounting holes, while the internal side has 3 holes.

3. Results

The obtained results of displacements, deformations, and stresses were compiled in tabular form for a single implant and arch. A description of the results for each model was made, and their mutual comparison was presented graphically using charts, as well as drawings from the Ansys program.

3.1. Displacement

In Table 2, the displacement results of individual elements of a single implant (multi-unit, mounting holes) and the arch (additionally, the connecting bar) are presented for variable loads of 100 N and 800 N at a 90-degree angle.
In Table 3, the displacement results of selected elements from the studied models (multi-units, mounting holes, and beam) are presented for a load of 800 N at varying angles of 90, 60, and 30 degrees.
Based on the obtained results, it can be observed that the increase in load from 100 N to 800 N leads to an increase in displacements throughout the implant (Figure 10).
On the external (cheek side) side of the multi-units, loading the implant with two force variants resulted in displacement values ranging from 3.5 × 10⁻⁵ mm to 6.5 × 10⁻⁴ mm. The highest displacements occur in the second multi-unit for both the 100 N and 800 N loads (Figure 11). The increase in force caused the average displacement value across all multi-units to rise by 713%.
On the internal (lingual) side, displacement values vary in the range from 5.5 × 10⁻⁵ mm to 1 × 10⁻³ mm. This range is larger than that observed on the external side. The greatest displacements are seen in the first multi-unit for both force variants (Figure 12). Increasing the load to 800 N caused the average displacement value across all multi-units to rise by 702%. Also located on the internal side is the mounting hole with the highest recorded values, which increased from 2.8 × 10⁻⁶ to 2.4 × 10⁻⁵.
Changing the angle between 90 and 30 degrees with a load of 800 N affects the displacement state throughout the single implant. The smallest values are obtained for the load variant at a 90-degree angle and increase as the angle decreases to 60 and then to 30 degrees (Figure 13). The recorded results in the multi-units on both sides range from 2.9 × 10⁻⁴ mm to 5 × 10⁻³ mm.
On the external side of the implant, the largest displacements occur in the first multi-unit for angle variants of 60 and 30 degrees. In the case of a 90-degree angle, the highest values are seen in the second multi-unit (Figure 14). Changing the angle from 90 to 30 degrees resulted in a 576% increase in the average displacement value across all multi-units.
On the internal side, the largest displacements are observed in the first multi-unit for every angle variant (Figure 15). Changing the angle from 90 to 30 degrees resulted in a 551% increase in the average displacement value across all multi-units. The results in the mounting hole increased from 2.4 × 10⁻⁵ mm to 1.7 × 10⁻⁴ mm.
Loading the arch with an increasing force from 100 N to 800 N at a 90-degree angle leads to an increase in displacements throughout the model (Figure 12). On both sides of the multi-units, results vary in the range from 2.1 × 10⁻⁵ mm to 7.9 × 10⁻⁴ mm, on the beam from 6.8 × 10⁻⁴ mm to 1.8 × 10⁻² mm, while in the selected mounting holes, they range from 2.5 × 10⁻⁶ mm to 4.4 ×10⁻⁵ mm.
In both the left and right implants of the arch, the third multi-unit on the external side is characterized by the highest displacement values for each load (Figure 13), while on the internal side, it is the first multi-unit (Figure 14). The highest values also occur in the eighth hole for both implants, which is located on the internal side of the second multi-unit.
Similarly, the change in angle between 90 and 30 degrees with a load of 800 N impacts the results obtained across the entire arch (Figure 15). On both sides of the multi-units, values vary in the range from 1.6 × 10⁻⁴ mm to 6 × 10⁻³ mm, on the beam from 5.4 × 10⁻³ mm to 1.6 × 10⁻¹ mm, and in the mounting holes, they range from 1.4 × 10⁻⁵ mm to 4.6 × 10⁻⁴ mm. For each element, the results are greater compared to the variable load at a 90-degree angle.
On the external side, for the angle variants of 60 and 30 degrees, the most significant displacements in the left implant occur in the first multi-unit, while in the right implant, they are seen in the second multi-unit. For the 90-degree angle variant, it was the third multi-unit in both implants (Figure 16). On the internal side, the largest values for the angles of 60 and 30 degrees were observed in the second multi-units, whereas for the 90-degree angle, they were in the first ones (Figure 17). An increase in displacements was also noted on the connecting beam of the implants. Directly adjacent to the third multi-unit of each implant, they increased from 5.5 × 10⁻³ mm to 4 × 10⁻² mm, while in the middle of the beam they went from 1.8 × 10⁻² mm to 0.2 mm. The results are more significant compared to the variable load value at a 90-degree angle.
Comparing both models, it is evident that with variable loads between 100 N and 800 N at a 90-degree angle, the single implant shows greater displacements on the internal side of the multi-units, which are on average 35% higher. For the arch, these displacements are larger on the external side, averaging 24% higher (Figure 18). For a load of 800 N with varying angles between 90 and 30 degrees, in the single implant, greater displacements occur on the internal side of the multi-units, averaging 46% higher. In the case of the arch, larger displacements appear on the internal side for angle variants of 60 and 30 degrees, averaging 39% higher. In contrast, for the 90-degree angle, they are 26% higher on the external side (Figure 19).

3.2. Shape Deformation

In Table 4, the deformation results of selected elements of a single implant (multi−units and mounting holes) and the arch (additionally the beam) are presented for a variable load between 100 N and 800 N at an angle of 90 degrees.
In Table 5, the deformation results of selected elements of the studied models (multi-units, mounting holes, and beam) are compiled for a load of 800 N with variable angles of 90, 60, and 30 degrees.
The obtained results show that increasing the load from 100 N to 800 N at an angle of 90 degrees causes an increase in deformations throughout the entire single implant (Figure 20). The results on both sides vary in the range from 2.9 × 10⁻⁵ to 6.3 × 10⁻⁴ and they were permanent.
On the external side, the largest deformations occur in the second multi-unit for both load variants (Figure 21). As a result of increasing the force to 800 N, it was observed that the average deformation in all multi-units increased by 731%.
On the internal side, the largest deformations were recorded in the first multi-unit for both load variants (Figure 22). An increase in load caused the average deformations in all multi-units to increase by 701%. On the internal side, there is also a mounting hole with the largest recorded deformations, which increased from 1 × 10⁻⁵ to 7.8 × 10⁻⁵.
Changing the angle between 90 and 30 degrees affects the deformation results throughout the implant. They increase with its gradual reduction (Figure 23). On both sides of the multi-units, the values vary in the range from 2.3 × 10⁻⁴ to 3.8 × 10⁻³. This is larger compared to the variable load at an angle of 90 degrees.

3.3. Stresses

Table 6 presents the stress results for individual elements of a single implant (multi-units and mounting holes) and for the arch (additionally the bar) for a variable load in the range of 100–800 N at an angle of 90 degrees.
In Table 7, the stress results of the same elements are compiled for a load of 800 N with variable angles of 90, 60, and 30 degrees.
For the last analyzed parameter, one can notice a similarity compared to displacements and deformations, that an increase in load simultaneously causes an increase in stresses throughout the entire single implant (Figure 24). In Figure 24, the stress values indicate a potential for microstructural damage or plastic deformation, which could impact the long-term integrity of the implant. This observation is critical for our ongoing research and development of these implants.
On the external side, the highest stresses occur in the second multi-unit for both load variants (Figure 25). The increase in force caused the average stress in all multi-units to rise by 740%. The values range from 3 MPa to 48.6 MPa.
On the internal side, the first multi-unit is characterized by the highest stresses for both loads (Figure 26), which range from 5 MPa to 57.5 MPa. An increase of 701% in stresses was noted in all multi-units. On the internal side, there is a mounting hole with the highest stresses, which increased from 1 MPa to 7.8 MPa.
For a load of 800 N with a variable angle, the results show that the lowest stresses occur for the 90-degree angle variant and increase linearly as it decreases to 30 degrees throughout the entire implant (Figure 27).
On the external side, the highest stresses occur in the second multi-unit for angle variants of 90 and 30 degrees. For the 60-degree case, they occur in the first multi-unit (Figure 28). Stresses in the multi-units range from 23.7 MPa to 268.5 MPa. Changing the angle of load interaction from 90 to 30 degrees caused the average stress in all multi-units to increase by 526%.
On the internal side, the highest stresses occur in the second multi-unit for angle variants of 60 and 30 degrees, while in the first they occur for the 90-degree angle (Figure 29). An increase of 556% in stresses was observed in all multi-units. Stresses in the multi-units range from 39.5 MPa to 371.7 MPa, whereas in the mounting hole with the highest stresses, they increase from 7.8 MPa to 57 MPa.

3.4. Analysis Results in the Absence of Bone Support for the Implant

The next step was to conduct a study for a single implant under a load of 800 N at a 30-degree angle from the vertical axis and to analyze the obtained results of displacements, deformations, and stresses. The analysis was conducted taking into account the fixation of the surface under the multi-units, that is, in the situation when the implant will be supported by bone, and without considering this surface, that is, in a situation where there will be a free space between the implant and the bone. In Table 8, the results of displacements on both sides of the multi-units and in the mounting holes with the highest recorded values for two variants of fixation were compiled.
In Table 9, the results of deformations on both sides of the multi-units and the mounting holes with the highest values are presented.
The lack of support under the multi-units, which causes a free space between the implant and the bone, has the most significant effect on the displacement results. Ensuring the proper seating of the implant on the bone results in displacements of very small values in the range of 8.9 × 10⁻⁴ mm to 3.5 × 10⁻³ mm, while its absence contributes to implant displacements of even up to 0.5 mm. It can be noticed that the lack of support contributes to an uneven distribution of displacements, and they are larger at the first and third multi-units (Figure 30). The impact of the lack of fixation is also noticeable in the mounting holes. The largest displacements were recorded in the ninth hole, which is on the inner side of the first multi-unit.
An increase in deformations in a single implant is also noticeable but on a smaller scale compared to the previously described displacements (Figure 31). The values in the multi-units mainly change in the range from 10−3 to 10−2; however, a decrease in deformation values can be observed as a result of the lack of support on the outer side of the second multi-unit. The location of the greatest deformations among the holes has also changed, which were recorded in the ninth hole, similarly as in the case of displacements.
The red zones in the figures represent areas of maximum stress or strain within the analyzed structure, as determined by our Finite Element Analysis. These areas are subjected to the highest mechanical loads and are therefore most prone to material fatigue, deformation, or failure. The stress levels in these areas may exceed the material’s yield strength or fatigue limit, which could lead to irreversible deformation or fracture over time, particularly under cyclic loading conditions. These zones are of particular concern as they could be indicative of areas where failure is most likely to occur. This could have significant implications for the longevity and reliability of the implant. The insights provided by the analysis of the red zones are invaluable in guiding future improvements and ensuring the highest standards of safety and efficacy in our designs.

4. Discussion

4.1. FEA in Subperiosteal Implants

FEM analysis is a powerful simulation tool that allows you to evaluate structural behavior and stresses in a variety of situations [19,20]. However, like any modeling and simulation tool, there are some limitations that are important to consider when using FEA to assess stress variations. Among them, we find the accuracy of the input data. In fact, the accuracy of FEA results depends on the quality of the input data used, such as loading conditions and material properties [21].
The conducted numerical analysis using the Finite Element Analysis allowed for showing the state of displacements, deformations, and stresses in the studied implants, which serve to assess the risk from a biomechanical point of view. Such studies have a significant advantage over clinical trials, as patients are not subjected to tests, for example, in terms of using a new material. Thanks to the mathematical model, it is possible to properly fit the implant in terms of shape and size. Bite forces in the oral cavity depend on individual anatomical characteristics of the jaw and mandible, but in healthy individuals for molar teeth, they are 260 N for women and 360 N for men. The load of 100 N adopted in the studies is one of the most commonly accepted values for testing all kinds of dental implants, while a load of 800 N should be considered especially in patients with dysfunctions of the masticatory organ, in which bite forces significantly differ from the values occurring in a healthy person. Additionally, the conditions of loads with changing angles of 90, 60, and 30 degrees were adopted for the studies. Forces acting vertically, i.e., along the long axis of the teeth at a 90-degree angle, cause direct contact of opposing teeth, providing uniform and spatial support. From a mechanical point of view, this is a favorable situation, as the forces generated during chewing cause symmetrical muscle work.
Daily functioning or improper bite conditions also lead to the occurrence of forces at various angles, as a result of which stretching stresses considered destructive arise. This is reflected in the studies on subperiosteal implants, which showed that the smallest values of displacements, deformations, and stresses were obtained for vertical loads at a 90-degree angle. The effect of loads at 60 and 30 degrees increased the obtained results. Although the observed changes were of very small values from 1.6 × 10⁻⁴ mm to 6 × 10⁻³ mm for displacements and from 1.2 × 10⁻⁴ to 5.5 × 10⁻³ for deformations, it can be seen that between 90 and 30 degrees, the results increased by over 500%. Similarly, the stress results for both a single implant and an arch showed that the stresses in the multi-units reached values of 40–50 MPa in the case of a vertical force at a 90-degree angle and grew to nearly 500 MPa as a result of the action of non-axial forces.

4.2. Evolution of Subperiosteal Implants

The longevity of traditional subperiosteal implants has been substantiated by various studies [22,23,24]. However, numerous reviews have also highlighted issues including infections, both immediate and delayed exposure of the implant, bone loss, formation of fistulas, and implant looseness. These problems have led to significant distress for patients and a high rate of implant failure [22,23,24,25,26,27]. Endosteal implants addressed many of the issues encountered with earlier subperiosteal implant designs, providing better long-term outcomes and causing less patient discomfort [25,26,27,28].With the ability to be produced in bulk, coupled with their straightforward insertion and removal process in case they fail, endosteal implants emerged as the preferred choice for treatment starting in the 1980s.
Nonetheless, endosseous implants are not a universal solution for all clinical conditions. Successful placement of endosseous implants requires a certain level of bone density and volume [29]. In the absence of these conditions, there is a risk that the implant could fail, harm critical anatomical structures, or the installation may be unfeasible [30].While smaller and shorter implants offer an alternative, they are not suitable in cases where there is a considerable loss of bone mass in both the vertical and horizontal dimensions [31].
If the available bone volume is too low for implant placement, there are multiple regenerative methods available to increase the size of the alveolar ridge vertically and horizontally. These methods, though, are only viable when there is enough native bone to sustain the grafts. Autologous bone, which can be collected from different anatomical locations, can be used for onlay grafts. Many practitioners frequently employ this method, and it is deemed by several experts to be the benchmark for regenerative procedures [32,33,34].
The primary limitation of using free grafts is that their harvest inevitably cuts off the microcirculation, which hinders the re-establishment of blood supply to the graft. For a graft to survive and osteogenesis to occur, revascularization is essential. This process takes time, and during this period, the viability of osteocytes can be significantly reduced [35]. As a result, necrotic bone spots can develop, leading to graft resorption that is both undesirable and unpredictable. The extent of this resorption largely depends on the source of the bone graft. Studies have shown that mandibular block grafts used for augmenting the maxillary ridge experience resorption rates ranging from 5 to 28% [34,36,37]. Grafts from the iliac crest are reported to lose an average of 50% of their volume within six months after being placed in an atrophied maxilla [38].Research by Fourcade et al. (2019) showed an average resorption rate of 25% for both calvarial (parietal) and ramus bone grafts used in pre-implant augmentation of maxillary alveolar ridges [39].
To counteract the issue of high resorption rates, guided bone regeneration (GBR) is often used alongside bone grafting. This method utilizes bone substitutes and barriers to isolate the graft from non-osteogenic cells, which facilitates the proliferation of osteoblasts and prevents the invasion of connective and epithelial tissues. This technique typically results in decreased resorption and increased bone volume post-ridge augmentation [40,41].
Despite the variability in bone graft resorption rates, the overall success rates for implants placed in grafted bone remain high. Aghaloo et al. (2016) reviewed the implant outcomes in fully edentulous maxillae that underwent bone grafting [33]; they observed 2446 implants over a period of 1 to 12 years, noting survival rates from 73.3% to 100%. When GBR techniques were applied, survival rates ranged from 96.1% to 100%. Furthermore, Motamedian et al. (2016) documented success rates of 72.8% to 100% for 2647 implants placed in the atrophied maxilla with onlay grafts made from autologous bone [42].
Beyond onlay grafting and guided bone regeneration, the elevation of the maxillary sinus floor is another widely utilized method for increasing bone volume. Nevertheless, the success of this procedure is highly dependent on the skill with which it is executed. One of the main causes of failure during this procedure is the intraoperative tearing of the Schneiderian membrane. Membrane perforation occurs relatively often during surgery, with studies citing an incidence rate that varies widely, from 3.6% to 41.8% [43].When the membrane is torn, it is unable to serve its critical role in containing the graft, which is vital for bone regeneration [44].
Maxillary sinus floor augmentation typically confines the extent of maxillary reconstruction to the area of the premolars. In cases where the maxilla has significantly atrophied, severe ridge degradation often also occurs in the premaxillary area. This part of the ridge may not be suitable for augmentation. Despite these challenges, various research studies have reported high implant success rates, exceeding 90%, with observation periods ranging from one to eleven years [34,35,36,37,38,39,40,41,42,43,44,45].
The development of 3D printing technology for titanium and advancements in 3D planning software have renewed interest in the subperiosteal implant design. Cone Beam Computed Tomography (CBCT) can accurately depict a patient’s remaining bone volume, and the data from CBCT scans are utilized to create a precise virtual model of the bone using reconstruction software. This advancement significantly improves the custom fit of subperiosteal implants for individual patients.
Titanium (Ti) and its alloys are renowned for their biocompatibility, making them the materials of choice for various medical and dental applications. This is a stark contrast to the Vitallium alloy made of cobalt, chromium, and molybdenum, which was used in earlier subperiosteal implants made with the lost-wax technique and lacked the ability to integrate with soft tissue or bone. In the cranio-maxillofacial skeleton, there is minimal bone loss observed beneath titanium alloy osteosynthesis plates that are rigidly fixed [43]. Furthermore, in both trauma and orthognathic surgeries, over a quarter of the osteosynthesis materials become covered by bone over time [46,47].
The phenomenon of alveolar ridge resorption in patients without teeth has been extensively recorded in the literature [48,49]. The degree of bone loss varies among individuals, and significant differences in the rate of resorption at different times and locations within the same patient have been observed [31].
Initially, a rapid phase of bone loss is commonly seen within the first three months following tooth extraction. This phase is succeeded by a slower, yet persistent, resorption that continues over the individual’s lifetime [44]. Koodaryan and Hafezeqoran’s systematic review and meta-analysis in 2016 highlighted that the average early bone loss around maxillary and mandibular implants is approximately 1.5 mm in the first year after the final prosthesis is placed [50]. Subsequently, an annual bone loss rate of about 0.2 mm is observed. It is expected that the Maxilla/Mandible Individual Implants (MaI Implants®) would follow a similar pattern of bone loss after the first year of functioning. Clinical data indicate that patients with prostheses supported by AMSJI experienced an average alveolar ridge resorption of 0.33 mm (with a standard deviation of 0.76 mm) and 0.08 mm (with a standard deviation of 0.33 mm) at the wings and basal frame on the underlying zygomatic-maxillary bone one year after loading [51].

4.3. Segmentation Process of MaI Implants®

Several obstacles complicate the segmentation of CBCT data for the MaI Implants®, including the following: (1) compromised bone quality in some patients, impeding clear 3D visualization of the bone structure; (2) the titanium alloy used in MaI Implants®, which leads to beam-hardening artifacts; (3) the adjacent soft tissues; (4) the inadequate contrast resolution in many CBCT scans; and (5) a scarcity of underlying bone in certain instances. These issues contribute to the semi-automated segmentation technique’s susceptibility to human error during measurement. Moreover, the technique of surface-based superimposition, which relies solely on the outermost layer of the 3D structure for alignment, demands a high-quality surface to ensure precise superimposition [52].

4.4. Clinical Implication and Future Research

The analyzed models assumed proper implantation through fixing holes and settlement on the bone tissue of implants, which should provide proper stabilization in the oral cavity for future prosthetic supplements. However, a situation may occur unnoticed by the doctor where the implanted subperiosteal implant will not fully settle on the bone and there will be a small free space between the anatomical support site and the implant surface. This is shown by the results obtained during the analysis of the load of 800 N at an angle of 30 degrees from the vertical axis, taking into account the fixation of the implant under the multi-units and without fixation.
In summary, while no synthetic system is flawless within the human organism, the MaI Implants® (Integra Implants, Lodz, Poland) stand out as a noteworthy option for addressing significant maxillary atrophy, surpassing extensive bone grafts and zygomatic implants. This is primarily because it enables immediate restoration of chewing function through a single surgical procedure, which often only necessitates local anesthesia. The effectiveness of the MaI Implants® has been demonstrated and it holds considerable potential. However, their long-term efficiency is yet to be fully established and requires further validation through extended prospective studies or observational research. A forthcoming modification under consideration, which involves situating all connecting arms beneath the palatal gingival or the usage of a template that enables positioning the multi-units deeper, presents a new aspect for evaluation. Ensuring stable attachment of the epithelial junction to the titanium posts will pose a challenge, making additional research essential to enhance the MaI Implants’® long-term success.
Time-varying masticatory loads may provide more reliable results as they can cause more criticality than static loads. The load was applied in a concentrated way on the anchor points, but the insertion of the bridge in Co-Cr and Ti could create a different stress distribution due to the variation in the mechanical properties of the two materials. These aspects need to be further investigated.

5. Conclusions

The lack of proper stabilization of the implant has the greatest impact on the results of displacements, which change in the range from 8.9 × 10⁻⁴ mm to even 0.5 mm. Because implant treatment is a multi-year process, such displacements are significant for the later positioning of the implant compared to the initial conditions.

Author Contributions

Conceptualization, R.Z.; methodology, R.Z.; software, R.Z.; validation, R.Z., M.K., J.S., M.P., and J.O.; formal analysis, R.Z.; investigation, R.Z.; resources, R.Z., M.K., J.S., M.P., and J.O.; data curation, R.Z.; writing—original draft preparation, R.Z.; writing—review and editing, R.Z.; visualization, R.Z.; supervision, R.Z.; project administration, R.Z.; funding acquisition, R.Z. All authors have read and agreed to the published version of the manuscript.
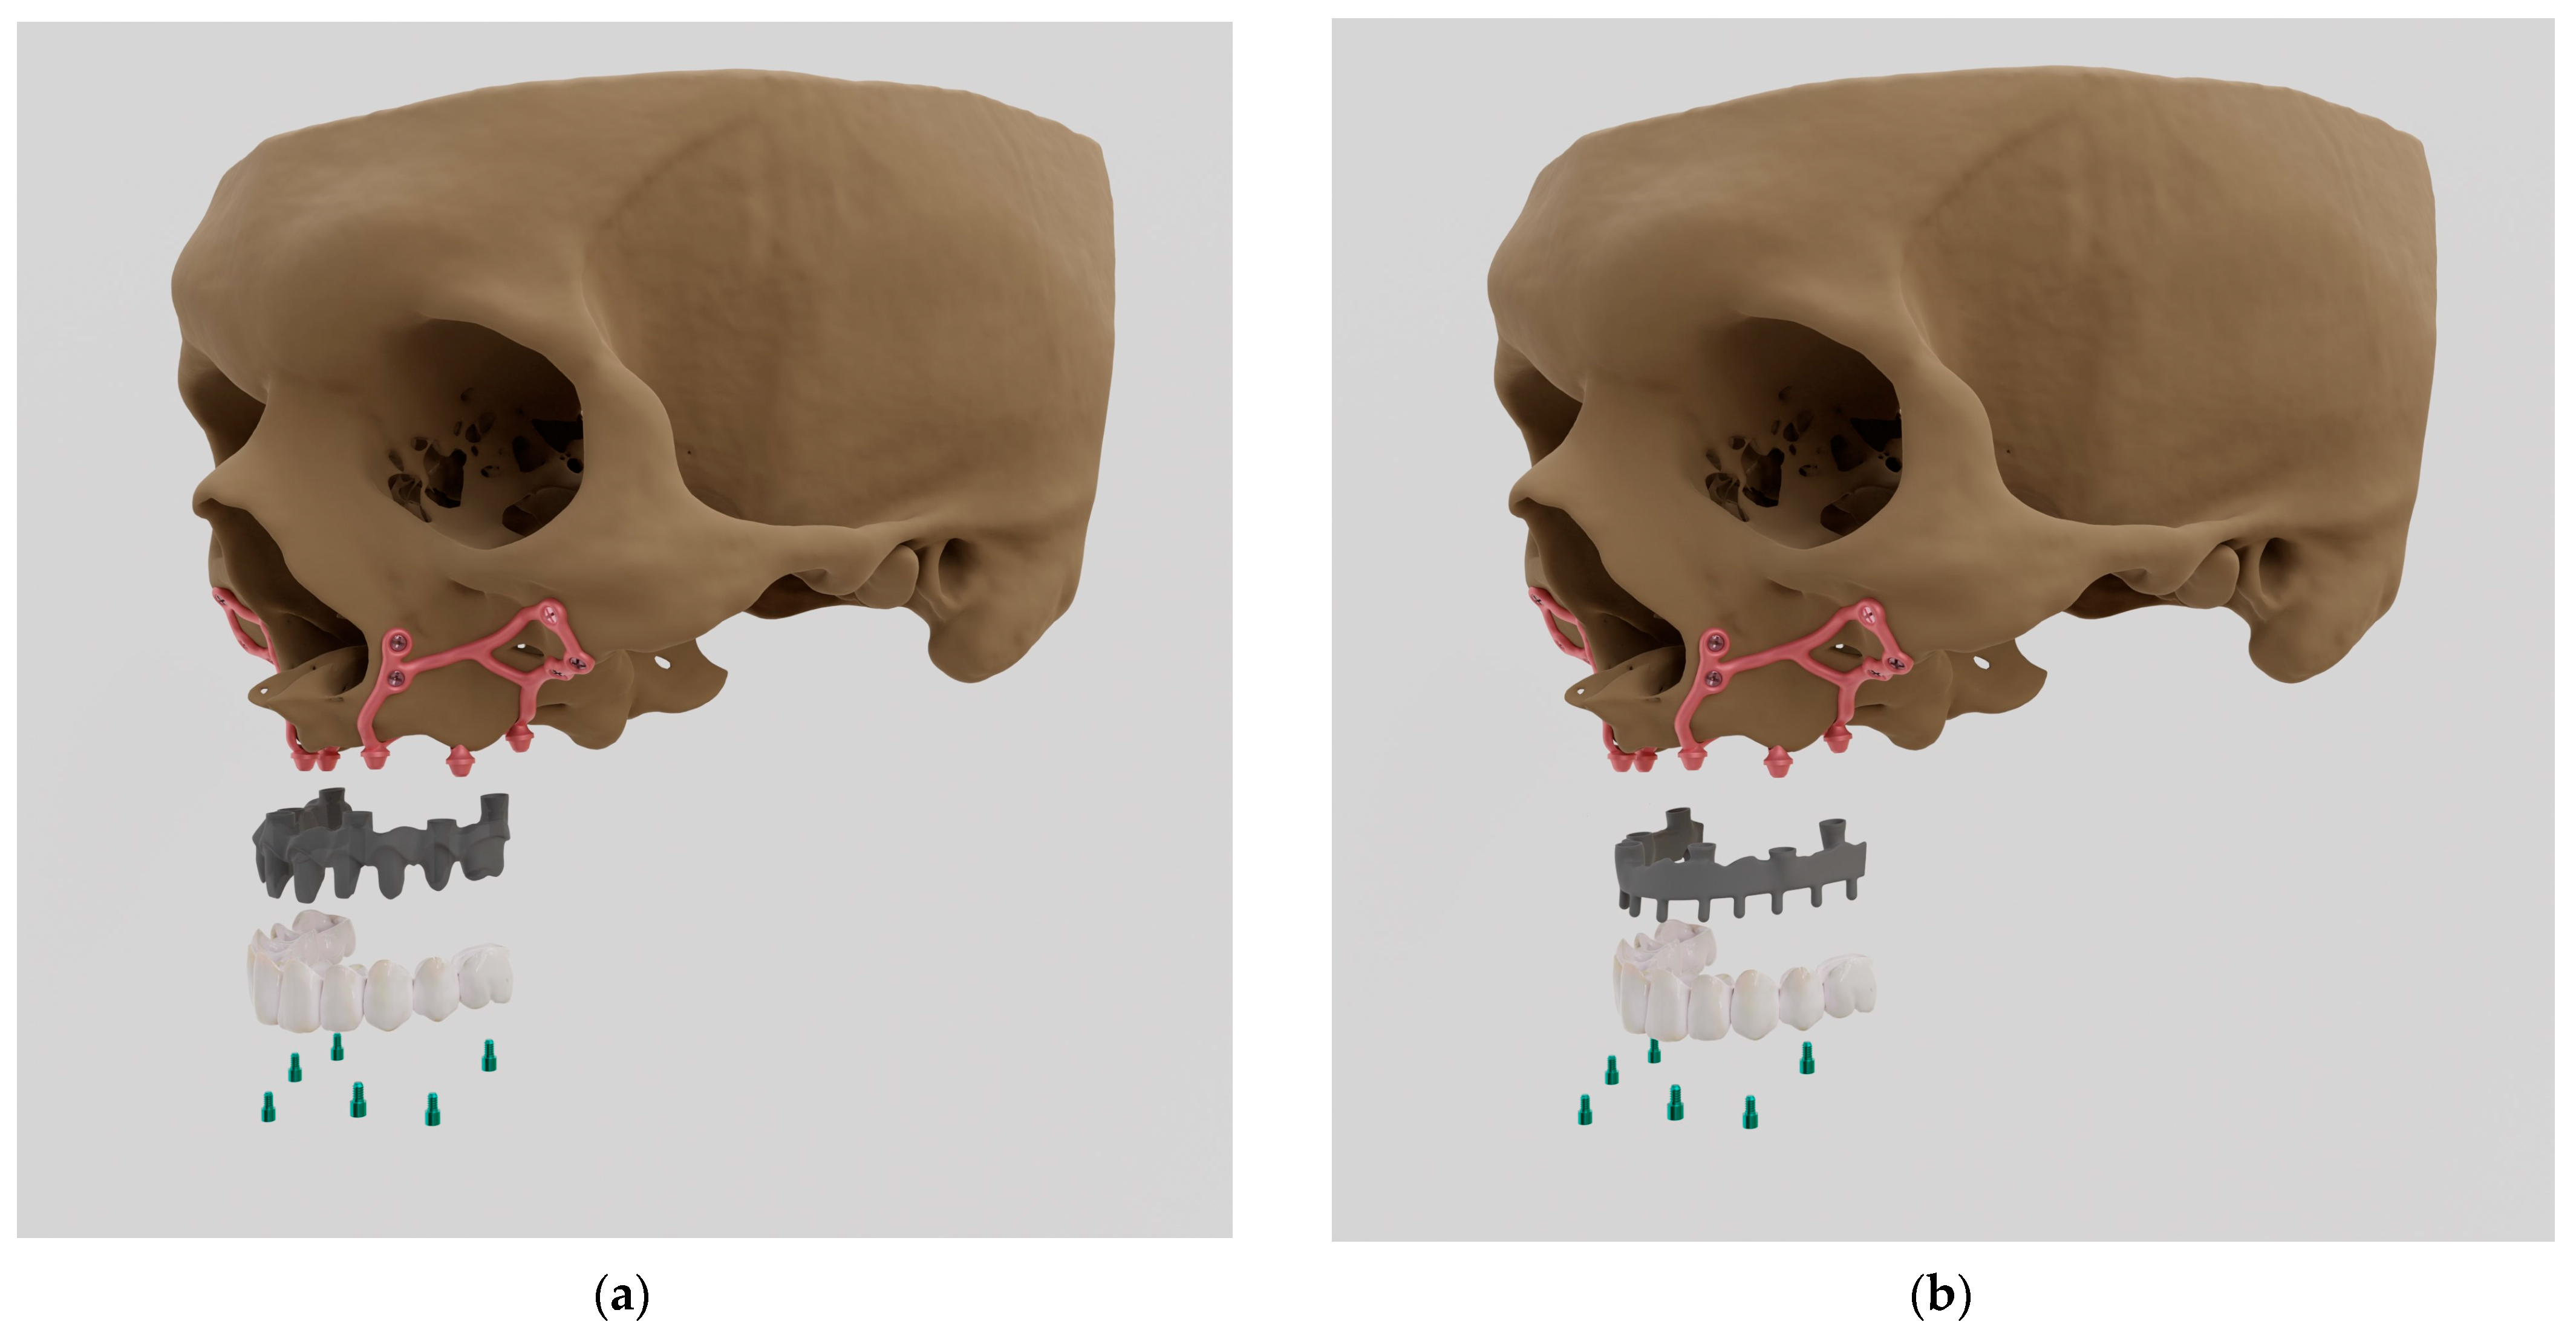
Funding

This research received no external funding.

Institutional Review Board Statement

Not applicable.

Informed Consent Statement

Not applicable.

Data Availability Statement

Data are contained within the article.

Acknowledgments

We would like to thank Company named Integra Implants (www.integra-implants.com (accessed on 18 November 2023), Lodz, ul. Dostawcza 12, Poland) for sharing 3D models.

Conflicts of Interest

Authors Rafal Zielinski and Martyna Piechaczek were employed by the company Stomatologia na Ksiezym Mlynie and author Jerzy Sowinski was employed by the company Private Clinic, Tetmajera 3A Rd, Izabelin C 05-080. The remaining authors declare that the research was conducted in the absence of any commercial or financial relationships that could be construed as a potential conflict of interest.

References

  1. Peters, F.; Wingels, M.; Möhlhenrich, S.C.; Raith, S.; Katz, M.S.; Bock, A.; Hölzle, F.; Modabber, A. Cross-sectional analysis of spatial distribution and total amount of harvestable calvarian split bone. Ann. Anat. 2021, 234, 151655. [Google Scholar] [CrossRef] [PubMed]
  2. Goyal, S.; Masood, M.; Le, C.; Rajendran, Y.; Nanjapa, S.; Vaderhobli, R. Comparative Bone Graft Evaluation for Dental Implant Success: An Evidence-Based Review. J. Long-Term Eff. Med. Implant. 2021, 31, 33–44. [Google Scholar] [CrossRef] [PubMed]
  3. Urban, I.A.; Saleh, M.H.A.; Ravidà, A.; Forster, A.; Wang, H.L.; Barath, Z. Vertical bone augmentation utilizing a titanium-reinforced PTFE mesh: A multi-variate analysis of influencing factors. Clin. Oral Implant. Res. 2021, 32, 828–839. [Google Scholar] [CrossRef] [PubMed]
  4. Solà Pérez, A.; Pastorino, D.; Aparicio, C.; Pegueroles Neyra, M.; Khan, R.S.; Wright, S.; Ucer, C. Success Rates of Zygomatic Implants for the Rehabilitation of Severely Atrophic Maxilla: A Systematic Review. Dent. J. 2022, 10, 151. [Google Scholar] [CrossRef] [PubMed]
  5. Zielinski, R.; Okulski, J.; Simka, W.; Kozakiewicz, M. The Zygomatic Anatomy-Guided Approach, Zygomatic Orbital Floor Classification, and ORIS Criteria-A 10-Year Follow-Up. J. Clin. Med. 2023, 12, 6681. [Google Scholar] [CrossRef]
  6. Toneatti, D.J.; Graf, R.R.; Burkhard, J.P.; Schaller, B. Survival of dental implants and occurrence of osteoradionecrosis in irradiated head and neck cancer patients: A systematic review and meta-analysis. Clin. Oral Investig. 2021, 25, 5579–5593. [Google Scholar] [CrossRef] [PubMed]
  7. Kim, D.D.; Ghali, G.E. Dental implants in oral cancer reconstruction. Oral Maxillofac. Surg. Clin. N. Am. 2011, 23, 337–345, vii. [Google Scholar] [CrossRef] [PubMed]
  8. Insua, A.; Monje, A.; Wang, H.L.; Miron, R.J. Basis of bone metabolism around dental implants during osseointegration and peri-implant bone loss. J. Biomed. Mater. Res. Part A 2017, 105, 2075–2089. [Google Scholar] [CrossRef]
  9. Nicolas-Silvente, A.I.; Velasco-Ortega, E.; Ortiz-Garcia, I.; Jimenez-Guerra, A.; Monsalve-Guil, L.; Ayuso-Montero, R.; Gil, J.; Lopez-Lopez, J. Influence of Connection Type and Platform Diameter on Titanium Dental Implants Fatigue: Non-Axial Loading Cyclic Test Analysis. Int. J. Environ. Res. Public Health 2020, 17, 8988. [Google Scholar] [CrossRef]
  10. Cipollina, A.; Ceddia, M.; Di Pietro, N.; Inchingolo, F.; Tumedei, M.; Romasco, T.; Piattelli, A.; Specchiulli, A.; Trentadue, B. Finite Element Analysis (FEA) of a Premaxillary Device: A New Type of Subperiosteal Implant to Treat Severe Atrophy of the Maxilla. Biomimetics 2023, 8, 336. [Google Scholar] [CrossRef]
  11. Bahrami, B.; Ghalichi, F.; Mirzakouchaki, B.; Marghoub, A. Finite element analysis of stress distribution in immediatele loaded dental implant. In Proceedings of the 19th Iranian Conference of Biomedical Engineering, Tehran, Iran, 20–21 December 2012. [Google Scholar]
  12. Burlibasa, M. Finite element method analysis of the stress induced upon the dental implant by the mastication process. Rom. Biotechnol. Lett. 2017, 22, 12706–12714. [Google Scholar]
  13. Gultekin, A.; Turkoglu, P. Application of Finite Element Analysis in Implant Dentistry. In Finite Element Analysis—New Trends and Developments; IntechOpen: London, UK, 2012; pp. 21–54. [Google Scholar]
  14. Kayumi, S.; Takayama, Y.; Yokoyama, A.; Ueda, N. Effect of bite force in occlusal adjustment of dental implants on the distribution of occlusal pressure: Comparison among three bite forces in occlusal adjustment. Int. J. Implant. Dent. 2015, 1, 14. [Google Scholar] [CrossRef] [PubMed]
  15. Liu, J.; Pan, S.; Dong, J.; Mo, Z.; Fan, Y.; Feng, H. Infulence of implant number on the biomechanical behaviour of mandibular implant-retained/supported overdentures: A three-dimensional finite element analysis. J. Dent. 2013, 41, 241–249. [Google Scholar] [CrossRef] [PubMed]
  16. Materac, A.; Niesłony, A. Analiza stanu naprężenia w połączeniu łącznik-korona dla korony zęba z nawisem. Aktual. Probl. Biomech. 2015, 9, 79–82. [Google Scholar]
  17. Mommaerts, M.Y. Evolutionary steps in the design and biofunctionalization of the additively manufactured subperiosteal jaw implant ‘AMSJI’ for the maxilla. Int. J. Oral Maxillofac. Surg. 2019, 48, 108–114. [Google Scholar] [CrossRef]
  18. PN-EN ISO 14801:2008; Stomatologia—Implanty—Badanie Zmęczeniowe Śródkostnych Implantów Dentystycznych. ISO: Geneva, Switzerland, 2008.
  19. Shamami, D.Z.; Karimi, A.; Beigzadeh, B.; Haghpanahi, M.; Navidbakhsh, M. A 3D Finite Element Study for Stress Analysis in Bone Tissue Around Single Implants with Different Materials and Various Bone Qualities. J. Biomater. Tissue Eng. 2014, 8, 632–637. [Google Scholar] [CrossRef]
  20. Shirazi, H.A.; Ayatollahi, M.; Karimi, A.; Navidbakhsh, M. A comparative finite element analysis of two types of axial and radial functionally graded dental implants with titanium one around implant-bone interface. Sci. Eng. Compos. Mater. 2016, 5, 747–754. [Google Scholar] [CrossRef]
  21. Di Pietro, N.; Ceddia, M.; Romasco, T.; De Bortoli Junior, N.; Mello, B.F.; Tumedei, M.; Specchiulli, A.; Piattelli, A.; Trentadue, B. Finite Element Analysis (FEA) of the Stress and Strain Distribution in Cone-Morse Implant–Abutment Connection Implants Placed Equicrestally and Subcrestally. Appl. Sci. 2023, 13, 8147. [Google Scholar] [CrossRef]
  22. Bodine, R.L. Evaluation of 27 mandibular subperiosteal implant dentures after 15 to 22 years. J. Prosthet. Dent. 1974, 32, 188–197. [Google Scholar] [CrossRef]
  23. Young, L.; Michel, J.D.; Moore, D.J. A twenty-year evaluation of subperiosteal implants. J. Prosthet. Dent. 1983, 49, 690–694. [Google Scholar] [CrossRef]
  24. Yanase, R.; Bodine, R.; Tom, J.; White, S. The mandibular subperiosteal implant denture: A prospective survival study. J. Prosthet. Dent. 1994, 71, 369–374. [Google Scholar] [CrossRef] [PubMed]
  25. Albrektsson, T.; Sennerby, L. State of the art in oral implants. J. Clin. Periodontol. 1991, 18, 474–481. [Google Scholar] [CrossRef] [PubMed]
  26. Bodine, R.L.; Yanase, R.T.; Bodine, A. Forty years of experience with subperiosteal implant dentures in 41 edentulous patients. J. Prosthet. Dent. 1996, 75, 33–44. [Google Scholar] [CrossRef] [PubMed]
  27. Schou, S.; Pallesen, L.; Pedersen, C.S.; Fibæk, B.; Hjørting-Hansen, E. A 41-year history of a mandibular subperiosteal implant. Clin. Oral Implant. Res. 2000, 11, 171–178. [Google Scholar]
  28. Van Steenberghe, D.; Branemark, P.-I.; Quirynen, M.; De Mars, G.; Naert, I. The rehabilitation of oral defects by osseointegrated implants. J. Clin. Periodontol. 1991, 18, 488–493. [Google Scholar] [CrossRef] [PubMed]
  29. Esposito, M.; Grusovin, M.G.; Felice, P.; Karatzopoulos, G.; Worthington, H.V.; Coulthard, P. The efficacy of horizontal and vertical bone augmentation procedures for dental implants—A Cochrane systematic review. Eur. J. Oral Implantol. 2009, 2, 167–184. [Google Scholar] [PubMed]
  30. Clark, D.; Barbu, H.; Lorean, A.; Mijiritsky, E.; Levin, L. Incidental findings of implant complications on postimplantation CBCTs: A cross-sectional study. Clin. Implant. Dent. Relat. Res. 2017, 19, 776–782. [Google Scholar] [CrossRef]
  31. Van Doorne, L.; Fonteyne, E.; Matthys, C.; Bronkhorst, E.; Meijer, G.; De Bruyn, H. Longitudinal Oral Health-Related Quality of Life in maxillary mini dental implant overdentures after 3 years in function. Clin. Oral Implant. Res. 2020, 32, 23–36. [Google Scholar] [CrossRef]
  32. Chiapasco, M.; Zaniboni, M.; Boisco, M. Augmentation procedures for the rehabilitation of deficient edentulous ridges with oral implants. Clin. Oral Implant. Res. 2006, 17, 136–159. [Google Scholar] [CrossRef]
  33. Gonzalez-Garcia, R.; Naval-Gias, L.; MunozGuerra, M.F.; Sastre-Perez, J.; Rodriguez-Campo, F.J.; Gil-Diez-Usandizaga, J.L. Preprosthetic and implantological surgery in patients with severe maxillary atrophy. Med. Oral Patol. Oral Cir. Bucal. 2005, 10, 343–354. [Google Scholar]
  34. Aghaloo, T.L.; Misch, C.; Lin, G.-H.; Iacono, V.J.; Wang, H.-L. Bone Augmentation of the Edentulous Maxilla for Implant Placement: A Systematic Review. Int. J. Oral Maxillofac. Implant. 2017, 31, s19–s30. [Google Scholar] [CrossRef] [PubMed]
  35. Simon, B.I.; Chiang, T.F.; Drew, H.J. Alternative to the gold standard for alveolar ridge augmentation: Tenting screw technology. Quintessence Int. 2010, 41, 379–386. [Google Scholar] [PubMed]
  36. Alérico, F.A.; Bernardes, S.R.; Fontao, F.G.K.; Diez, G.F.; Alérico, J.H.S.; Claudino, M. Prospective Tomographic Evaluation of Autogenous Bone Resorption Harvested From Mandibular Ramus in Atrophic Maxilla. J. Craniofacial Surg. 2014, 25, e543–e546. [Google Scholar] [CrossRef] [PubMed]
  37. Gultekin, B.A.; Bedeloglu, E.; Kose, T.E.; Mijiritsky, E. Comparison of Bone Resorption Rates after Intraoral Block Bone and Guided Bone Regeneration Augmentation for the Reconstruction of Horizontally Deficient Maxillary Alveolar Ridges. BioMed Res. Int. 2016, 2016, 4987437. [Google Scholar] [CrossRef] [PubMed]
  38. Johansson, B.; Grepe, A.; Wannfors, K.; Hirsch, J.M. A clinical study of changes in the volume of bone grafts in the atrophic maxilla. Dentomaxillofac. Radiol. 2001, 30, 157–161. [Google Scholar] [CrossRef] [PubMed]
  39. Fourcade, C.; Lesclous, P.; Guiol, J. Assignment of autogenous bone grafts for reconstruction of the alveolar ridge before implant placement. J. Oral Med. Oral Surg. 2019, 25, 1. [Google Scholar] [CrossRef]
  40. Von Arx, T.; Buser, D. Horizontal ridge augmentation using autogenous block grafts and the guided bone regeneration technique with collagen membranes: A clinical study with 42 patients. Clin. Oral Implant. Res. 2006, 17, 359–366. [Google Scholar] [CrossRef]
  41. Maiorana, C.; Beretta, M.; Salina, S.; Santoro, F. Reduction of autogenous bone graft resorption by means of bio-oss coverage: A prospective study. Int. J. Periodontics Restor. Dent. 2005, 25, 19–25. [Google Scholar]
  42. Khojasteh, A.; Motamedian, S.R.; Khojaste, M. Success rate of implants placed in autogenous bone blocks versus allogenic bone blocks: A systematic literature review. Ann. Maxillofac. Surg. 2016, 6, 78–90. [Google Scholar] [CrossRef]
  43. Al-Dajani, M. Incidence, Risk Factors, and Complications of Schneiderian Membrane Perforation in Sinus Lift Surgery. Implant. Dent. 2016, 25, 409–415. [Google Scholar] [CrossRef]
  44. Baj, A.; Trapella, G.; Lauritano, D.; Candotto, V.; Mancini, G.E.; Giannì, A.B. An overview on bone reconstruction of atrophic maxilla: Success parameters and critical issues. J. Biol. Regul. Homeost. Agents 2016, 30 (Suppl. S1), 209–215. [Google Scholar] [PubMed]
  45. Bortoluzzi, M.C.; Cecconello, R.; Derech, E.D.; Fabris, V.; Manfro, R. Comparative study of immediately inserted dental implants in sinus lift: 24 months of follow-up. Ann. Maxillofac. Surg. 2014, 4, 30–33. [Google Scholar] [CrossRef] [PubMed]
  46. O’Connell, J.; Murphy, C.; Ikeagwuani, O.; Adley, C.; Kearns, G. The fate of titanium miniplates and screws used in maxillofacial surgery: A 10 year retrospective study. Int. J. Oral Maxillofac. Surg. 2009, 38, 731–735. [Google Scholar] [CrossRef] [PubMed]
  47. Cornelis, M.A.; Scheffler, N.R.; Mahy, P.; Siciliano, S.; De Clerck, H.J.; Tulloch, J.C. Modified Miniplates for Temporary Skeletal Anchorage in Orthodontics: Placement and Removal Surgeries. J. Oral Maxillofac. Surg. 2008, 66, 1439–1445. [Google Scholar] [CrossRef] [PubMed]
  48. Lavstedt, S.; Bolin, A.; Henrikson, C.O.; Carstensen, J. Proximal alveolar bone loss in a longitudinal radiographic investigation I. Methods of measurement and partial recording. Acta Odontol. Scand. 1986, 44, 149–157. [Google Scholar] [CrossRef] [PubMed]
  49. Bergström, J.; Henrikson, C.O. Quantitative longitudinal study of alveolar bone tissue in man. J. Periodontal Res. 1970, 5, 237–247. [Google Scholar] [CrossRef]
  50. Wyatt, C.C. The effect of prosthodontic treatment on alveolar bone loss: A review of the literature. J. Prosthet. Dent. 1998, 80, 362–366. [Google Scholar] [CrossRef]
  51. Koodaryan, R.; Hafezeqoran, A. Evaluation of Implant Collar Surfaces for Marginal Bone Loss: A Systematic Review and Meta-Analysis. BioMed Res. Int. 2016, 2016, 4987526. [Google Scholar] [CrossRef]
  52. Van den Borre, C.; Rinaldi, M.; De Neef, B.; Loomans, N.A.J.; Nout, E.; Van Doorne, L.; Naert, I.; Politis, C.; Schouten, H.; Klomp, G.; et al. Radiographic Evaluation of Bone Remodeling after Additively Manufactured Subperiosteal Jaw Implantation (AMSJI) in the Maxilla: A One-Year Follow-Up Study. J. Clin. Med. 2021, 10, 3542. [Google Scholar] [CrossRef]
Figure 1. Mai Implants® showing (a) milled metal CoCr alloy + porcelain bridge (PFM); (b) milled titanium alloy + acryl (Ti-acryl).
Materials 16 07466 g001
Figure 2. The model of a single subperiosteal implant along with numbering. Anchoring points are numbered from 1–9 as “O-shaped” whereas multi-units are numbered from 1–3 at the top of the figure.
Materials 16 07466 g002
Figure 3. Flow chart showing the process of Finite Element Analysis (FEA).
Materials 16 07466 g003
Figure 4. The designed arch along with the division into left and right implants.
Materials 16 07466 g004
Figure 5. (a) Anchoring holes; (b) surface adjustment for multi-units.
Materials 16 07466 g005
Figure 6. Place and direction of vertical loads for a single model. A, B, C are numbered multi-units.
Materials 16 07466 g006
Figure 7. The loading scheme of the implant according to ISO norm 14801.
Materials 16 07466 g007
Figure 8. Measurement location in the multi-units and the mounting hole marked by means of red arrows. Two graphs below illustrate in magnification above graph.
Materials 16 07466 g008
Figure 9. Measurement location in the bar marked by means of red arrows.
Materials 16 07466 g009
Figure 10. Displacement state for a single implant: (a) 100 N, (b) 800 N.
Materials 16 07466 g010aMaterials 16 07466 g010b
Figure 11. Displacements on the external side of the multi-units of a single implant.
Materials 16 07466 g011
Figure 12. Displacements on the internal side of the multi-units of a single implant.
Materials 16 07466 g012
Figure 13. Displacement state for a single implant under an 800 N force at angles of (a) 30 degrees, (b) 60 degrees, and (c) 90 degrees.
Materials 16 07466 g013aMaterials 16 07466 g013b
Figure 14. Displacements on the external side of the multi-units for a single implant.
Materials 16 07466 g014
Figure 15. Displacements on the internal side of the multi-units for a single implant.
Materials 16 07466 g015
Figure 16. Displacement state for the arch under load: (a) 100 N, (b) 800 N.
Materials 16 07466 g016aMaterials 16 07466 g016b
Figure 17. Displacements on the external side of the multi-units for the arch.
Materials 16 07466 g017
Figure 18. Displacements on the internal side of the multi-units for the arch.
Materials 16 07466 g018
Figure 19. Displacement state for the arch under a load of 800 N at angles of (a) 30 degrees, (b) 60 degrees, and (c) 90 degrees.
Materials 16 07466 g019aMaterials 16 07466 g019b
Figure 20. The state of strain for a single implant under forces of (a) 100 N and(b) 800 N.
Materials 16 07466 g020aMaterials 16 07466 g020b
Figure 21. Deformations on the external side of multi-units for a single implant.
Materials 16 07466 g021
Figure 22. Deformations on the internal side of multi-units for a single implant.
Materials 16 07466 g022
Figure 23. The state of strain for a single implant under a force of 800 N at angles of (a) 30 degrees, (b) 60 degrees, and (c) 90 degrees.
Materials 16 07466 g023aMaterials 16 07466 g023b
Figure 24. Stress state for a single implant under the forces of (a) 100 N and (b) 800 N.
Materials 16 07466 g024aMaterials 16 07466 g024b
Figure 25. Stresses on the external side of the multi-units for a single implant.
Materials 16 07466 g025
Figure 26. Stresses on the internal side of the multi-units for a single implant. Deformation was measured with 2 different forces—100 N and 800 N.
Materials 16 07466 g026
Figure 27. Stress state for a single implant under a load of 800 N at angles of (a) 30 degrees, (b) 60 degrees, and (c) 90 degrees.
Materials 16 07466 g027aMaterials 16 07466 g027b
Figure 28. Stresses on the external side of the multi-units for a single implant. Deformation was measured with 3 different angles—30°, 60°, 90°.
Materials 16 07466 g028
Figure 29. Stresses on the internal side of the multi-units for a single implant.
Materials 16 07466 g029
Figure 30. Displacements: (a) with multi-unit fixation, (b) without fixation.
Materials 16 07466 g030
Figure 31. Deformations: (a) with fixation under multi-units, (b) without fixation.
Materials 16 07466 g031
Table 1. Compilation of materials, load values, and angles used in the literature [10,11,12,13,14,15,16,17].
AuthorsMaterialForce [N]Angle [°]
Bahrami et al.Ti-6Al-4V20090
Burlibasa et al.Ti-6Al-4V5090, 60, 45, 30, 0
Gultekin et al.Ti-6Al-4V100, 15090
Kayumi et al.-40, 100, 200, 400, 80090
Liu et al.Ti-6Al-4V10090
Materac et al.Ti-6Al-4V100, 200, 50090
MommaertsTi-6Al-4V10090
PN-EN ISO 14801-80030
Table 2. Compilation of displacement results for varying force values.
ElementImplantElementSideSingle Implant (mm)Arch (mm)
100 N800 N100 N800 N
Multi-unitLeft1outer3.50 × 10−52.89 × 10−45.40 × 10−54.75 × 10⁻⁴
inner1.30 × 10−41.04 × 10−58.81 × 10−57.04 × 10⁻⁴
2outer7.89 × 10−56.45 × 10−46.76 × 10−55.42 × 10⁻⁴
inner7.55 × 10−56.05 × 10−46.99 × 10−55.61 × 10⁻⁴
3outer7.78 × 10−56.24 × 10−49.65 × 10−57.78 × 10⁻⁴
inner5.48 × 10−54.39 × 10−42.09 × 10−51.64 × 10⁻⁴
Right3outer--9.91 × 10−57.94 × 10−4
inner--2.22 × 10−51.70 × 10−4
2outer--8.07 × 10−56.41 × 10−4
inner--6.85 × 10−55.46 × 10−4
1outer--5.65 × 10−54.50 × 10−4
inner--9.07 × 10−57.28 × 10−4
Mounting holesLeft8-2.76 × 10−62.38 × 10−55.69 × 10−64.35 × 10−5
Right8---2.52 × 10−61.41 × 10−5
BarLeftnear 3---6.89 × 10−45.48 × 10−3
-middle---2.27 × 10−31.82 × 10−2
Leftnear 3---6.77 × 10−45.41 × 10−3
Table 3. Compilation of displacement results for varying angle values.
ElementImplantPositionSideSingle Implant (mm)Arch (mm)
90°60°30°90°60°30°
Multi-unitLeft1outer2.89 × 10−42.43 × 10−34.41 × 10−34.75 × 10−42.74 × 10−35.10 × 10⁻³
inner1.04 × 10−33.47 × 10−35.01 × 10−37.04 × 10−43.24 × 10−34.94 × 10⁻³
2outer6.45 × 10−41.82 × 10−33.79 × 10−35.42 × 10−42.48 × 10−34.96 × 10⁻³
inner6.05 × 10−42.81 × 10−34.25 × 10−35.61 × 10−43.62 × 10−35.71 ×10⁻³
3outer6.24 × 10−48.88 × 10−42.33 × 10−37.78 × 10−48.02 × 10−42.19 × 10⁻³
inner4.39 × 10−42.66 × 10−34.32 × 10−31.64 × 10−42.49 × 10−34.41 × 10⁻³
Right3outer---7.94 × 10−48.58 × 10−41.98 × 10⁻³
inner---1.70 × 10−42.77 × 10−34.87 × 10⁻³
2outer---6.41 × 10−43.02 × 10−35.96 × 10⁻³
inner---5.46 × 10−43.62 × 10−35.73 × 10⁻³
1outer---4.50 × 10−42.75 × 10−35.12 ×10⁻³
inner---7.28 × 10−43.34 × 10−35.03 × 10⁻³
Mounting holesLeft8-2.38 × 10−51.15 × 10−41.74 × 10−44.35 × 10−52.77 × 10−44.55 × 10−4
Right8----1.41 × 10−51.45 × 10−42.40 × 10⁻⁴
BarLeftnear 3----5.48 × 10−32.24 × 10−23.94 × 10⁻²
-middle----1.82 × 10−21.00 × 10−11.60 × 10⁻¹
Leftnear 3----5.41 × 10−32.28 × 10−23.95 × 10⁻²
Table 4. Compilation of deformation results for a variable force value.
ElementImplantPositionSideSingle Implant (%)Arch (%)
100 N800 N100 N800 N
Multi-unitLeft1outer2.92 × 10−52.32 × 10−45.39 × 10−54.30 × 10⁻⁴
inner7.90 × 10−56.34 × 10−47.29 × 10−55.88 × 10⁻⁴
2outer5.24 × 10−54.65 × 10−46.34 × 10−55.06 × 10⁻⁴
inner6.84 × 10−55.55 × 10−46.12 × 10−54.89 × 10⁻⁴
3outer5.13 × 10−54.07 × 10−48.43 × 10−56.69 × 10⁻⁴
inner4.85 × 10−53.81 × 10−41.60 × 10−51.23 × 10⁻⁴
Right3outer--7.26 × 10−55.80 × 10−4
inner--1.64 × 10−51.25 × 10−4
2outer--4.82 × 10−53.67 × 10−4
inner--6.53 × 10−55.20 × 10−4
1outer--5.02 × 10−54.05 × 10−4
inner--7.09 × 10−55.73 × 10−4
Mounting holesLeft8-1.00 × 10−57.77 × 10−51.30 × 10−59.66 × 10−5
Right8---6.54 × 10−58.46 × 10−5
BarLeftNear 3---6.57 × 10−55.46 × 10−4
-Middle---2.76 × 10−71.56 × 10−6
RightNear 3---6.97 × 10−55.60 × 10−4
Table 5. Compilation of deformation results for a variable angle value.
ElementImplantPositionSideSingle Implant (%)Arch (%)
90°60°30°90°60°30°
Multi-unitLeft1outer2.32 ×10−41.38 ×10−32.65 ×10−34.30 ×10−42.24 × 10−34.33 × 10⁻³
inner6.34 × 10−42.22 × 10−33.26 × 10−35.88 × 10−42.89 × 10−34.55 × 10⁻³
2outer4.65 × 10−41.18 × 10−32.59 × 10−35.06 × 10−42.29 × 10−34.49 × 10⁻³
inner5.55 × 10−42.46 × 10−33.78 × 10−34.89 × 10−43.18 × 10−34.92 × 10⁻³
3outer4.07 × 10−47.17 × 10−41.83 × 10−36.69 × 10−48.37 × 10−42.17 × 10⁻³
inner3.81 × 10−42.19 × 10−33.39 × 10−31.23 × 10−42.66 × 10−34.58 × 10⁻³
Right3outer---5.80 × 10−46.55 × 10−41.76 × 10⁻³
inner---1.25 × 10−42.56 × 10−34.39 × 10⁻³
2outer---3.67 × 10−41.82 × 10−33.66 × 10⁻³
inner---5.20 × 10−43.94 × 10−35.51 × 10⁻³
1outer---4.05 × 10−42.22 × 10−34.27 × 10⁻³
inner---5.73 × 10−42.89 × 10−34.40 × 10⁻³
Mounting holesLeft8-7.77 × 10−53.76 × 10−45.71E−04 9.66 × 10−56.75 × 10−41.03 × 10⁻³
Right8----6.54 × 10−54.51 × 10−47.24 × 10⁻⁴
BarLeftnear 3----5.46 × 10−48.10 × 10−41.13 × 10⁻³
-middle----1.56 × 10−65.96 × 10−51.39 × 10⁻⁴
Rightnear 3----5.60 × 10−48.80 × 10−41.22 × 10⁻³
Table 6. Compilation of stress results for a variable load value.
ElementImplantPositionSideSingle Implant MPaArch (MPa)
100 N800 N100 N800 N
Multi-unitLeft1outer3.023.75.544.6
inner7.157.56.956.3
2outer5.448.66.551.7
inner7.055.45.848.3
3outer5.342.48.970.6
inner5.039.51.713.0
Right3outer--7.760.9
inner--1.713.0
2outer--5.037.9
inner--6.754.7
1outer--5.241.4
inner--6.855.9
Mounting holesLeft8-1.07.81.39.7
Right8---0.74.9
BarLeftnear 3---6.755.9
-middle---2.4 × 10−20.1
Rightnear 3---7.156.2
Table 7. Compilation of stress results for a variable angle value.
Implant Position Side Single Implant, MPa Arch, MPa
90°60°30°90°60°30°
Left1Outer23.7134.7261.544.6227.5440.5
inner57.5189.4283.556.3274.8416.5
2outer48.6123.0268.551.7233.8462.6
inner55.4243.9371.748.3303.0481.0
3outer42.473.4188.270.688.5228.5
inner39.5223.5344.913.0277.5481.0
Right3outer---60.968.7176.6
inner---13.0269.0460.0
2outer---37.9181.0370.6
inner---54.7371.0567.0
1outer---41.4227.3436.7
inner---55.9270.0417.0
Left8-7.837.757.19.767.1103.0
Right8----4.940.070.2
Leftnear 3----55.981.3112.0
-middle----0.15.115.0
Rightnear 3----56.286.0119.0
Table 8. Displacement results for a single implant.
ElementPositionSideAnchorage under Multi-Units, mm
YesNo
Multi-unit1outer2.4 × 10−30.5
inner3.5 × 10−30.4
2outer1.8 × 10−32.8 × 10⁻²
inner2.8 × 10−38.7 × 10⁻²
3outer8.9 × 10−40.4
inner2.7 × 10−30.4
Mounting hole8-1.1 × 10⁻⁴-
9--1.9 × 10⁻³
Table 9. Deformation results for a single implant.
ElementPositionSideAnchorage under Multi-Units,
%
YesNo
Multi-unit1outer1.4 × 10−34.1 × 10⁻³
inner2.2 × 10−31.1 × 10⁻²
2outer1.2 × 10−35.9 × 10⁻⁴
inner2.5 × 10−31.1 × 10⁻²
3outer7.2 × 10−41.1 × 10⁻²
inner2.2 × 10−31.1 × 10⁻²
Mounting hole8-3.8 × 10⁻⁴-
9--6.1 × 10⁻³
The highest values are presented.
Disclaimer/Publisher’s Note: The statements, opinions and data contained in all publications are solely those of the individual author(s) and contributor(s) and not of MDPI and/or the editor(s). MDPI and/or the editor(s) disclaim responsibility for any injury to people or property resulting from any ideas, methods, instructions or products referred to in the content.

