Article

Up-Converting K2Gd(PO4)(WO4):20%Yb3+,Ho3+ Phosphors for Temperature Sensing

by
Julija Grigorjevaite
and
Arturas Katelnikovas
*
Institute of Chemistry, Faculty of Chemistry and Geosciences, Vilnius University, Naugarduko 24, LT-03225 Vilnius, Lithuania
*
Author to whom correspondence should be addressed.
Materials 2023, 16(3), 917; https://doi.org/10.3390/ma16030917
Submission received: 21 November 2022 / Revised: 14 January 2023 / Accepted: 16 January 2023 / Published: 18 January 2023

Abstract

:
Inorganic luminescent materials that can be excited with NIR radiation and emit in the visible spectrum have recently gained much scientific interest. Such materials can be utilized as anti-counterfeiting pigments, luminescent thermometers, bio-imaging agents, etc. In this work, we report the synthesis and optical properties of K2Gd(PO4)(WO4):Ho3+ and K2Gd(PO4)(WO4):20%Yb3+,Ho3+ powders. The single-phase samples were prepared by the solid-state reaction method, and the Ho3+ concentration was changed from 0.5% to 10% with respect to Gd3+. It is interesting to note that under 450 nm excitation, no concentration quenching was observed in K2Gd(PO4)(WO4):Ho3+ (at least up to 10% Ho3+) samples. However, adding 20% Yb3+ has caused a gradual decrease in Ho3+ emission intensity with an increase in its concentration. It turned out that this phenomenon is caused by the increasing probability of Ho3+ → Yb3+ energy transfer when Ho3+ content increases. K2Gd(PO4)(WO4):20%Yb3+,0.5%Ho3+ sample showed exceptionally high up-conversion (UC) emission stability in the 77–500 K range. The UC emission intensity reached a maximum at ca. 350 K, and the intensity at 500 K was around four times stronger than the intensity at 77 K. Moreover, the red/green emission ratio gradually increased with increasing temperature, which could be used for temperature sensing purposes.

Graphical Abstract

1. Introduction

In recent decades, the up-converting luminescent materials based on lanthanide ions attracted much scientific interest due to their outstanding luminescence properties. The up-converting luminescent materials are widely used in a variety of applications, such as solar energy [1,2], anti-counterfeiting pigments [3], temperature sensors [4], fluorescence probes [5], bio-imaging [6], cancer therapeutics [7], etc. Usually, the inorganic up-converting luminescent materials contain at least two incorporated lanthanide ions: one as a sensitizer, typically Yb3+, and another as an emitter, such as Er3+ [8,9], Ho3+ [10,11,12,13], Tm3+ [14,15,16], etc. Another critical step in preparing up-converting phosphors is the selection of an appropriate host matrix. The researchers usually focus on the fluoride (or another halide) and tellurate glass hosts because they possess relatively low phonon frequencies, which, in turn, reduces the energy losses via non-radiative processes and yield high up-conversion luminescence efficiencies [10]. Among the fluoride-based hosts for up-converting phosphors, the (Li,Na,K)(La,Y,Gd,Lu)F4 host is probably the most studied [17,18,19]. On the other hand, these host matrices have several drawbacks, for instance, insufficient thermal, physical, and chemical stability. They are also toxic, hygroscopic, and so on [20]. Therefore, other inorganic matrices, such as tungstates, molybdates, vanadates, titanates, etc., are gaining more and more attention [21]. Among these materials, tungstates are widely studied as luminescent materials due to their excellent thermal and chemical stability [22,23,24]. For this reason, the well-known K2Gd(PO4)(WO4) [25,26,27] was chosen as a host matrix in this study.
There is a long list of lanthanide ions used as emitters in up-converting phosphors. We want to stress that Ho3+ is one of the most exciting lanthanide ions due to its unique energy level structure. Besides, Ho3+ energy levels match well with the energy levels of Yb3+, thus, the Yb3+/Ho3+ couple could be one of the choices for preparing up-converting phosphors [28]. Solely Ho3+ doped matrices could be used as a down-conversion (DC) material if Ho3+ is directly excited with 450 nm radiation. Furthermore, Yb3+/Ho3+ co-doped materials are bi-functional since they can be suitable for up-conversion and down-conversion (DC) applications.
In this contribution, we report the successful synthesis of K2Gd(PO4)(WO4) host lattice co-doped with Yb3+ and Ho3+. Yb3+ concentration was fixed at 20% with respect to Gd3+, whereas Ho3+ concentration was varied between 0.5% and 10%. The influence of Ho3+ concentration on luminescence properties was investigated and discussed. The obtained results show that this particular compound could be used as an NIR-excited luminescent security pigment.

2. Materials and Methods

A series of K2Gd(PO4)(WO4) samples doped with Ho3+ and co-doped with 20% Yb3+ and Ho3+ (where Ho3+ concentration was 0%, 0.5%, 1%, 2%, 5%, and 10% with respect to Gd3+) were synthesized by the solid-state reaction method. The starting materials, namely, Gd2O3 (99.99% Tailorlux, Münster, Germany), K2CO3 (99+% Acros Organics, Geel, Belgium), NH4H2PO4 (99% Reachem Slovakia, Petržalka, Slovakia), WO3 (99+% Acros Organics), Yb2O3 (99.99% Alfa Aesar, Haverhill, MA, USA), and Ho2O3 (99.99% Alfa Aesar) were weighed and blended in stoichiometric amounts. The powders were blended in an agate mortar. A few milliliters of acetone were added to accelerate the homogenization. The mixed reagents were poured into the porcelain crucible and annealed at 873 K temperature for 10 h in the air in a muffle furnace. Subsequently, the annealing process was repeated twice more with intermediate grinding of the products.
The structural analysis of the synthesized materials was performed using a Rigaku MiniFlexII diffractometer working on a Bragg–Brentano-focusing geometry (Tokyo, Japan). SEM images were taken on a field-emission scanning electron microscope FE-SEM Hitachi SU-70. The optical properties (room temperature reflection, excitation, and emission spectra; temperature-dependent emission spectra; PL decay) were investigated employing the modular Edinburgh Instruments FLS980 spectrometer. The instrumental parameters for each measurement are summarized in Tables S1–S4.
Rietveld refinement of the XRD patterns was performed using FullProf Suite software (version 2 December 2022). Peak profiles were modeled using a pseudo-Voigt peak shape. A 24-term Chebyshev-type background function was used. Other experimental parameters refined were the instrument zero, scale factor, lattice parameters, preferred orientation, and the peak shape parameters u, v, w, γ0, and γ1. For Rietveld fits, the K2Ho(PO4)(WO4) structure (PDF-4+ (ICDD) 04-015-9304) reported by Terebilenko et al. [29] was used and atomic coordinates were refined.

3. Results and Discussion
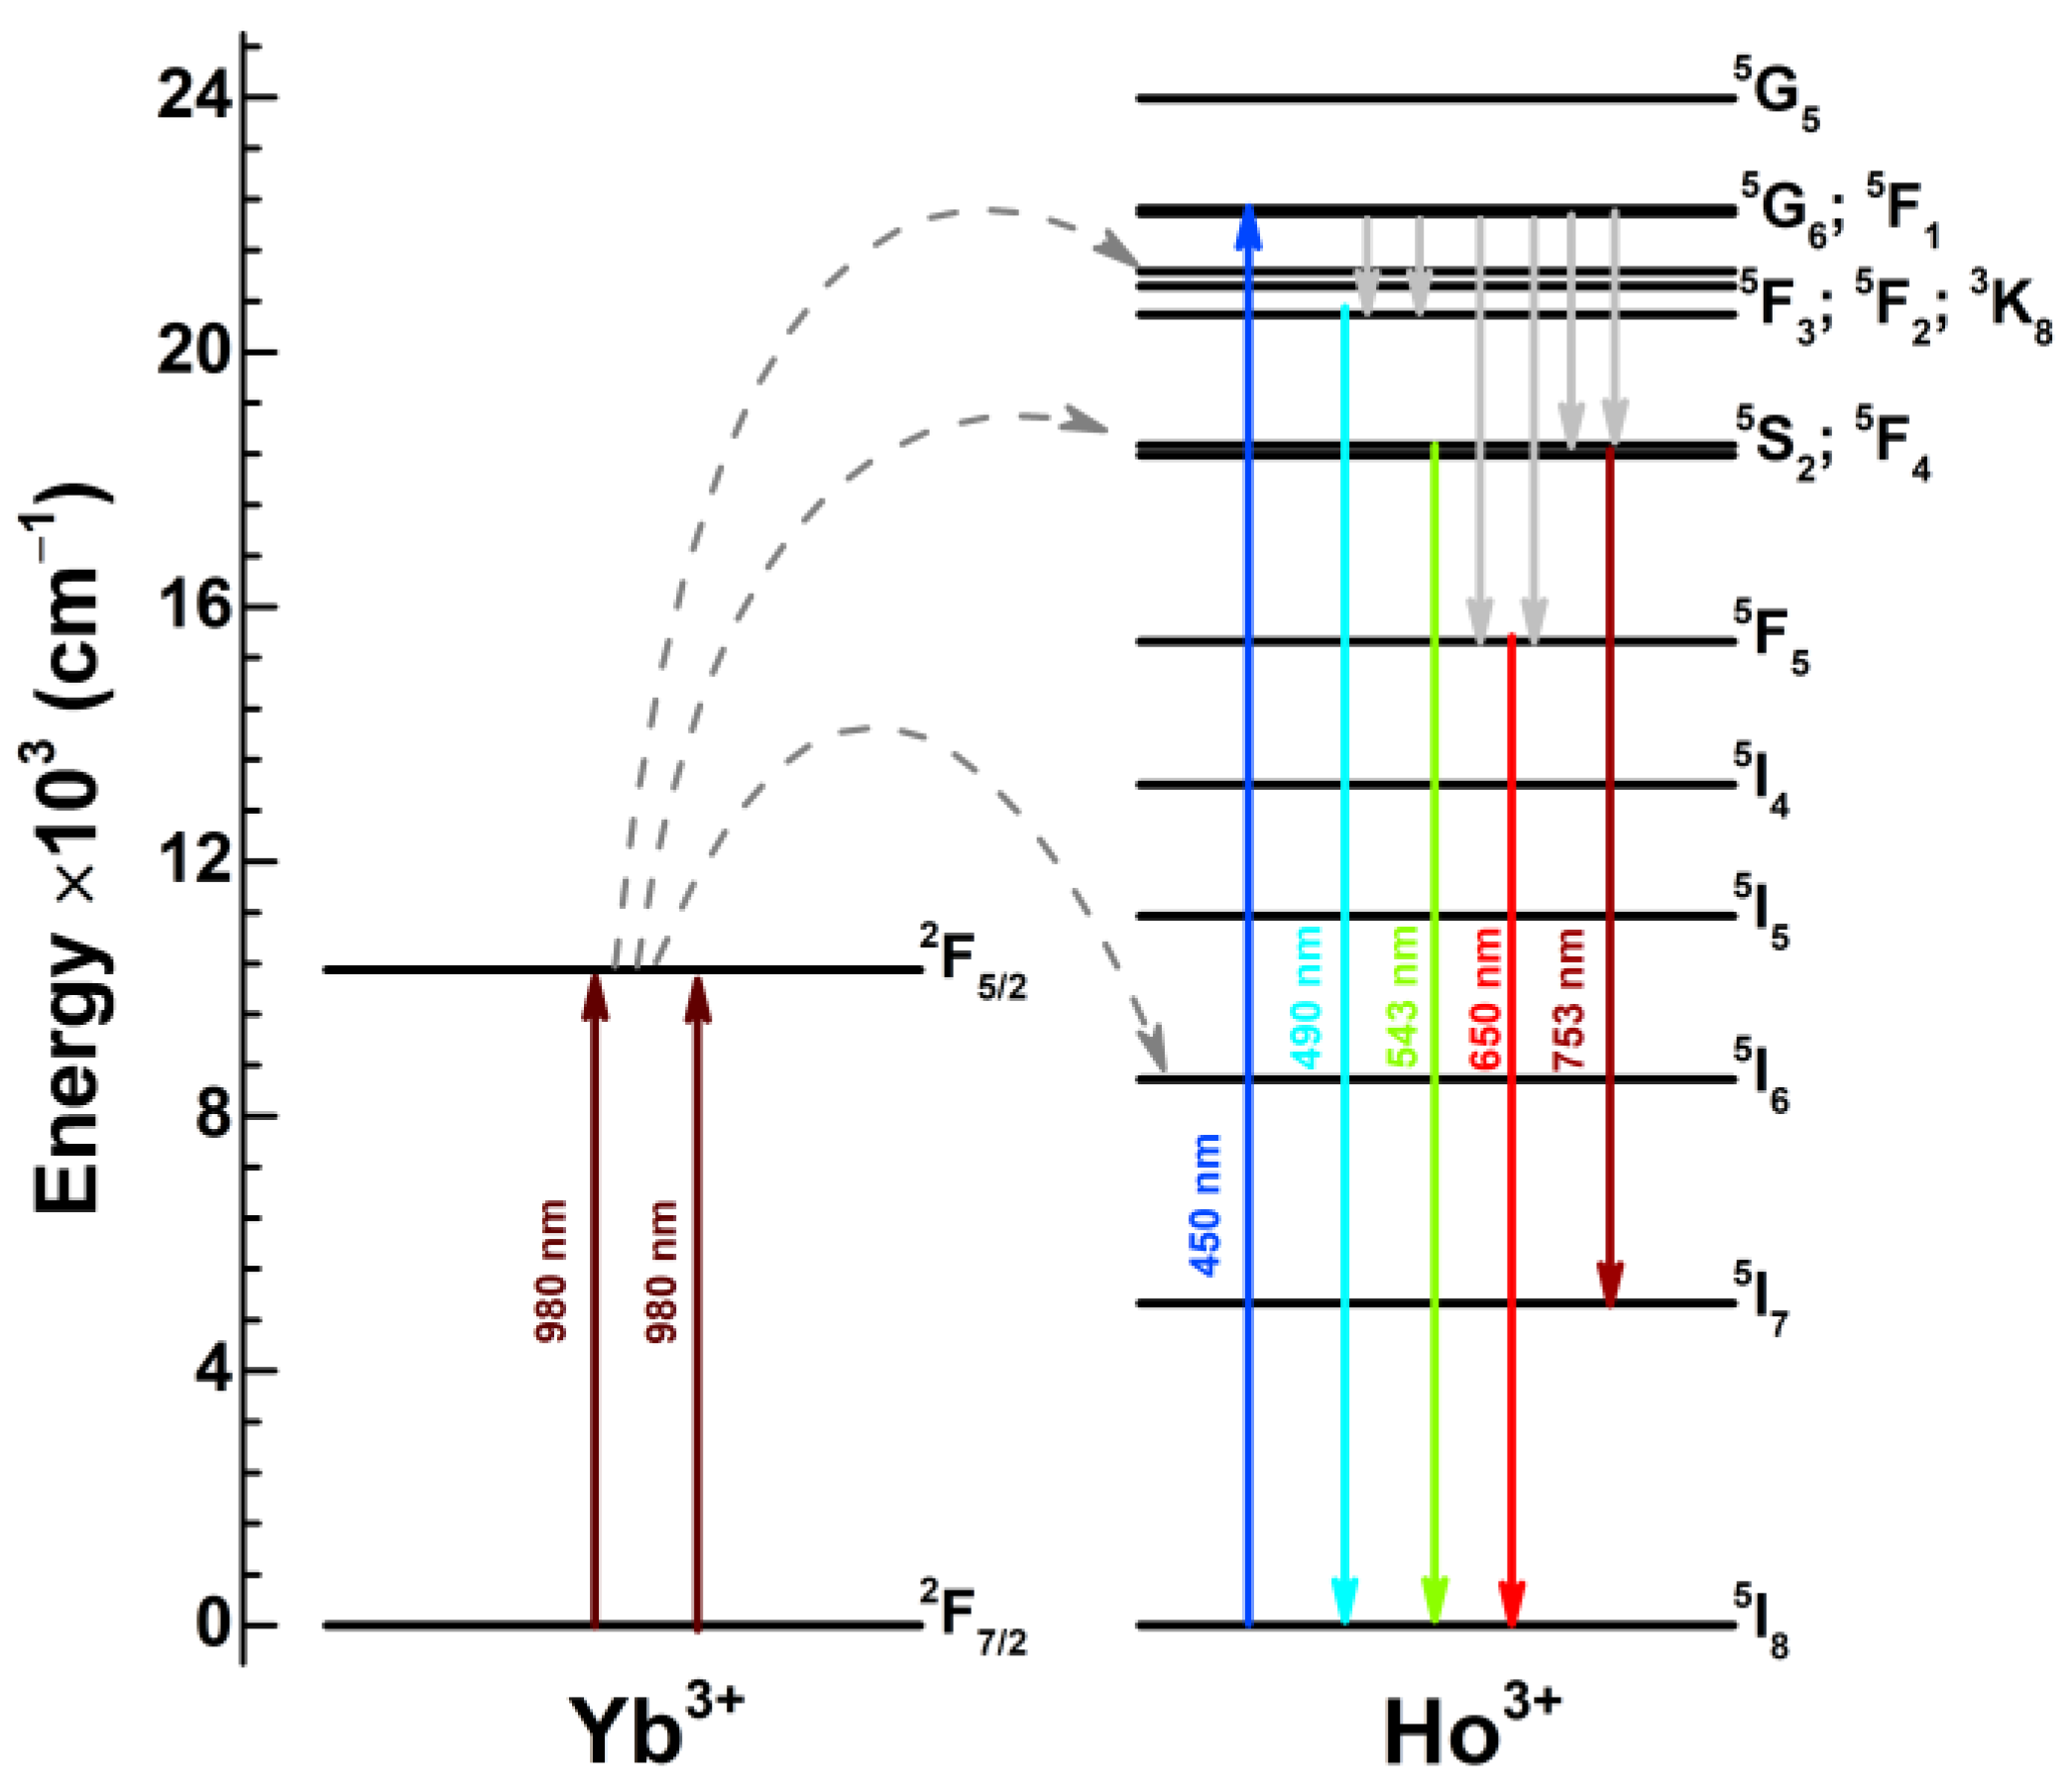
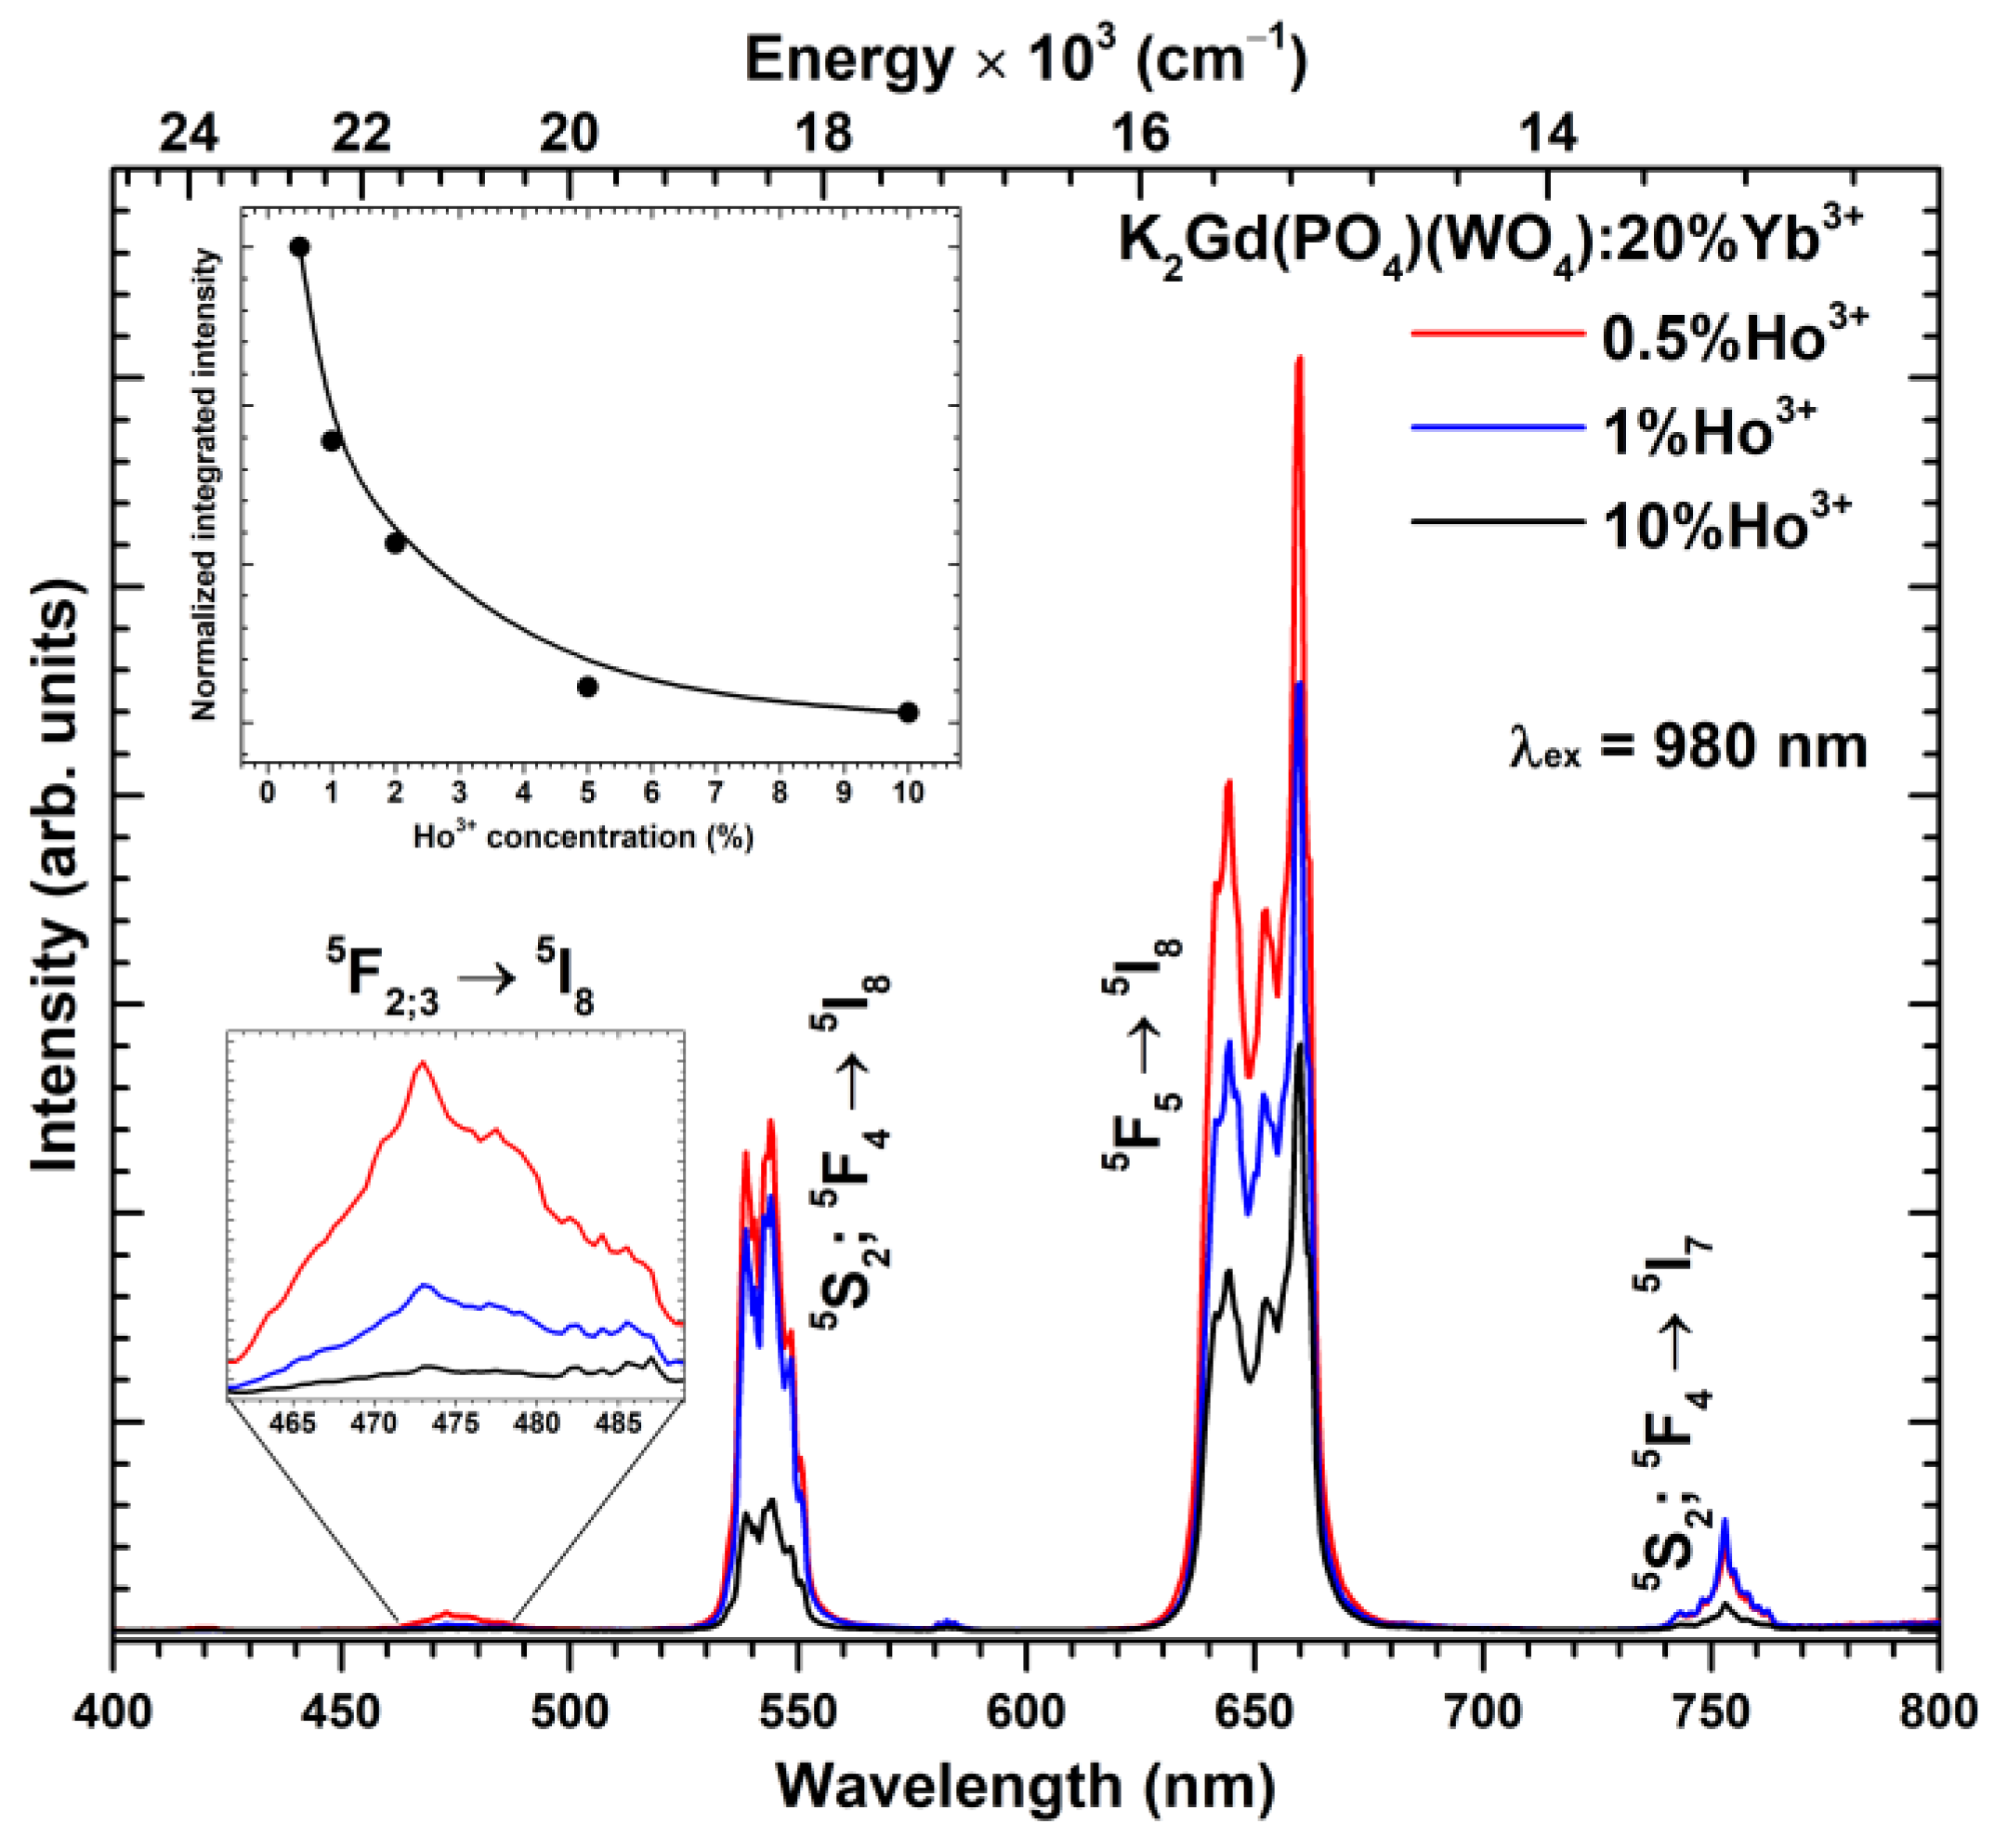
The phase purity of the synthesized K2Gd(PO4)(WO4):x%Ho3+ and K2Gd(PO4)(WO4):20%Yb3+,x%Ho3+ samples was investigated by recording powder XRD patterns. In order to extract the lattice parameters of the synthesized compounds, the Rietveld refinement of the recorded powder XRD patterns was performed. The Rietveld refinement of undoped K2Gd(PO4)(WO4), K2Gd(PO4)(WO4):10%Ho3+, K2Gd(PO4)(WO4):20%Yb3+, and K2Gd(PO4)(WO4):20%Yb3+,10%Ho3+ samples are shown in Figure 1. The calculated lattice parameters of K2Gd(PO4)(WO4), K2Gd(PO4)(WO4):10%Ho3+, K2Gd(PO4)(WO4):20%Yb3+, and K2Gd(PO4)(WO4):20%Yb3+,10%Ho3+ samples are given in Table S5. The lattice parameters decrease with increasing Yb3+ and Ho3+ content in the structure which, in fact, was expected since both ions are smaller than Gd3+. The XRD patterns of all the synthesized samples were similar and matched exceptionally well with the reference pattern, indicating that single-phase compounds were obtained. The synthesized K2Gd(PO4)(WO4):Yb3+,Ho3+ compounds crystalize in an orthorhombic crystal structure and adopt the Ibca (#73) space group [30]. The crystal structure of the K2Gd(PO4)(WO4) compound is constructed by PO4 and WO4 tetrahedrons and K+ and Gd3+ polyhedrons (both K+ and Gd3+ are eight-fold coordinated). Since the ionic radii of eight-coordinated Gd3+ (r = 1.053 Å), Yb3+ (r = 0.985 Å), and Ho3+ (r = 1.015 Å) [31] are very similar, we assumed that Yb3+ and Ho3+ occupied the Gd3+ sites in the crystal lattice. It is also worth mentioning that the K2Gd(PO4)(WO4) crystal structure is very versatile from a chemical point of view. For instance, potassium ions in the structure can be easily replaced by sodium [32] and rubidium [33] ions. Gd3+, in turn, can be replaced by nearly all rare-earth ions [34] as well as Y3+ [35], and Bi3+ [36]. WO4 groups can be also exchanged by MoO4 groups [36] making virtually endless possibilities for modification of chemical structures’ chemical composition.
The morphological features of the synthesized compounds were investigated by taking SEM images. The SEM images of K2Gd(PO4)(WO4):20%Yb3+, K2Gd(PO4)(WO4):10%Ho3+, and K2Gd(PO4)(WO4):20%Yb3+,10%Ho3+ specimens are depicted in Figure S1. All three SEM images demonstrate that the synthesized powders consist of aggregated microparticles with irregular shapes. Moreover, the powder particles were virtually identical, and no differences in crystallite size or morphology were observed with varying Yb3+ or Ho3+ concentrations.
The body color of the undoped K2Gd(PO4)(WO4) and 20% Yb3+ doped samples was white, indicating that both compounds do not absorb in the visible spectrum range. The Ho3+ doped samples, in turn, possessed a yellowish body color under sunlight and the reddish body color under fluorescent lamp (FL) illumination. The yellowish body color is caused by many strong absorption lines of Ho3+ in the visible spectrum, whereas the reddish body color is a result of Ho3+ excitation by the fluorescent lamp leading to red emission. The reflection spectra of undoped, 20% Yb3+ doped, and 10% Ho3+ doped, together with 20% Yb3+ and 10%Ho3+ co-doped samples are shown in Figure 2. The reflectance spectra were measured in a 250–800 nm range. The reflectance spectra of Ho3+ doped samples possess several sets of absorption lines typical to Ho3+, i.e., 5I83H6 (ca. 355–368 nm), 5I85G4 (ca. 380–390 nm), 5I85G5 (ca. 410–426 nm), 5I85G6;5F1 (ca. 440–464 nm), 5I85F2;3K8 (ca. 466–480 nm), 5I85F3 (ca. 483 nm), 5I85F4;5S2 (ca. 525–555 nm), and 5I85F5 (ca. 624–665 nm). The broad absorption band in the UV range (around 300 nm) can be assigned to the O2− → W6+ charge transfer transition in the host lattice [37].
The excitation (λem = 544 nm) spectra of K2Gd(PO4)(WO4):Ho3+ and K2Gd(PO4)(WO4):20%Yb3+,Ho3+ (where the Ho3+ concentration is 1% and 10%) samples were measured in the 250–500 nm range and are depicted in Figure 3a,c, respectively. The measured spectra consist of several sets of excitation lines which originated from the typical Ho3+ ground state (5I8) transitions to 3H6 (ca. 355–368 nm), 5G4 (ca. 380–390 nm), 5G5 (ca. 410–426 nm), 5G6 + 5F1 (ca. 440–464 nm), and 3K8 + 5F2 (ca. 466–480 nm) [38,39]. The highest excitation line intensity for solely Ho3+ doped samples was observed for the 10% doped sample. Moreover, a weak excitation line attributed to the 8S → 6P7/2 (ca. 311 nm) transition of Gd3+ [40] is also visible in the excitation spectra. This indicates that some Gd3+ → Ho3+ energy transfer occurs in the given host matrix. The same Gd3+ line was also observed in the K2Gd(PO4)(WO4):20%Yb3+,Ho3+ excitation spectra. Besides, the strongest Ho3+ excitation line intensity for Yb3+-containing samples was observed when the Ho3+ concentration was fixed at 1%. The broad excitation band in the range of 250–330 nm is attributed to the O2– to W6+ charge-transfer transition within the WO42−. Such transitions are typical for the tungstate compounds in this spectral range and reported by many authors [41,42].
The emission spectra (λex = 450 nm) of K2Gd(PO4)(WO4) and K2Gd(PO4)(WO4):20%Yb3+ samples doped with 1% and 10% Ho3+ were measured in 450–800 nm range and are presented in Figure 3b,d, respectively. Three sets of emission lines were observed in the emission spectra and the lines are attributed to Ho3+ transitions: 5S2 + 5F45I8 (ca. 530–555 nm), 5F55I8 (ca. 630–670 nm), and 5S2 + 5F45I7 (ca. 740–765 nm). Among solely Ho3+ doped samples, the one doped with 10% showed the most intensive emission. This finding is rather surprising since Ho3+ energy levels are exceptionally suitable for cross-relaxation processes [43,44]. However, the opposite tendency was observed when Yb3+ was incorporated into the host matrix. The sample doped with 1% Ho3+ showed the most intensive emission in this case. This is related to the increasing Ho3+ → Yb3+ energy transfer probability at higher Ho3+ concentrations resulting in a decrease in Ho3+ emission intensity. Similar results were also obtained by other authors working with other host matrices [10].
The schematic energy level diagram with the main Yb3+ and Ho3+ transitions is depicted in Figure 4. Samples containing Ho3+ could be directly excited to 5G6; 5F1 energy levels with the 450 nm excitation radiation (blue arrow). After relaxation to the lower-lying energy levels, emission in the cyan, green, red, and deep red spectral regions occurs. If the Ho3+ doped sample also contains Yb3+, the sample can be excited with the NIR radiation via the Yb3+ → Ho3+ energy transfer.
Yb3+ transfers energy to Ho3+ through several steps. First of all, the Yb3+ ion absorbs one NIR photon and transfers it to the 5I6 level of Ho3+ (I step). The subsequent NIR photon from Yb3+ excites the electrons within the 5I6 level to the 5S2 and 5F4 levels of Ho3+ (II step). of These transitions can be written. Since the UC emission spectra also contain emission lines from the 5F2;3 level, indicating that this level is also slightly populated through the cooperative sensitization as was also reported by the other researchers (III step) [45]. The mentioned UC mechanism can be expressed through these transitions [45,46,47]:
I step
  2F5/2(Yb3+) + 5I8(Ho3+) → 2F7/2(Yb3+) + 5I6(Ho3+)
II step
 2F5/2(Yb3+) + 5I6(Ho3+) → 2F7/2(Yb3+) + 5S2;5F4(Ho3+)
III step
2F5/2(Yb3+) + 5I8(Ho3+) → 2F7/2(Yb3+) + 5F3(Ho3+)
After the population of the mentioned energy levels of Ho3+, the emission from these levels occurs in the green, red, and deep-red spectral areas.
Up-conversion emission spectra (λex = 980 nm) of K2Gd(PO4)(WO4):20%Yb3+,Ho3+ and normalized integrated emissions as a function of Ho3+ concentration are depicted in Figure 5. As shown in Figure 1, Ho3+ does not have energy levels that could be directly excited with the 980 nm laser radiation; therefore, in this case, Yb3+ absorbs the laser radiation and transfers the energy to Ho3+. The measured Ho3+ up-conversion spectra are very similar to those when Ho3+ was directly excited with blue radiation (please refer to Figure 4). Typical Ho3+ emission lines were observed in up-conversion spectra measured in the 400–800 nm range, i.e., 5F2;35I8 (ca. 460–488 nm), 5S2;5F45I8 (ca. 530–555 nm), 5F55I8 (ca. 630–670 nm), and 5S2;5F45I7 (ca. 740–765 nm). The most intensive emission lines were observed for the 5F55I8 transition in the red spectral region. The highest up-conversion emission intensity was observed for the sample doped with 0.5% Ho3+. The up-conversion emission intensity decreases with further increasing the Ho3+ concentration. The normalized integrated emission of the samples (please refer to the inset in Figure 5) confirms that the total up-conversion emission intensity drastically decreases with increasing Ho3+ concentrations. The up-conversion emission intensity decrease with increasing Ho3+ concentration is caused by the increasing probability of Ho3+ → Yb3+ energy transfer, as discussed above. The digital images of K2Gd(PO4)(WO4):20%Yb3+,Ho3+ up-conversion luminescence (λex = 980 nm laser) as a function of Ho3+ concentration are given in Figure S2.
In order to better understand the up-conversion process of the prepared materials, the PL decay curves (λex = 980 nm, λem = 660 nm) of the most intensive emission peak (5F55I8 transition) were measured. The recorded UC PL decay curves of K2Gd(PO4)(WO4):20%Yb3+,Ho3+ samples as a function of Ho3+ concentration are shown in Figure 6a–c, in turn, show the calculated PL rise time and τeff values of the same samples, respectively. The PL decay curves become steeper with increasing Ho3+ concentration, indicating that PL lifetime values decrease. This indeed is true since the calculated τeff values decreased from 191 μs for 0.5% Ho3+ doped samples to 83 μs for 10% Ho3+ doped samples (please refer to Figure 6c). The opposite tendency, however, was observed for the PL rise time values, which increased with increasing Ho3+ concentration. The exact calculated PL rise time and lifetime values, together with standard deviations, are summarized in Table S6. The calculated UC PL lifetime values for 5F55I8 transition are very similar to the ones reported by other authors in a wide variety of materials, i.e., oxides, phosphates, titanates, silicates, tungsten tellurite glasses, and even fluorides. For instance, Guo et al. reported that the UC PL lifetime value of BaGdF5:20%Yb3+,1%Ho3+ is around 131 μs [28] which is close to the 122 μs for our K2Gd(PO4)(WO4):20%Yb3+,2%Ho3+ sample. Rather similar UC PL lifetimes were also observed in Sr3Y(PO4)3:10%Yb3+,2%Ho3+ (261 μs) and BaTiO3:3%Yb3+,0.2%Ho3+ (155 μs for cubic phase and 125 μs for tetragonal phase) compounds which were reported by Liu et al. [48] and Mahata et al. [11], respectively. However, there are also host matrixes where Ho3+ UC PL lifetimes are much shorter, for instance, La9.31(Si1.04O4)6O2:20%Yb3+,1%Ho3+ (around 18 μs) [49] and tungsten–tellurite glass (around 33 μs) [50]. An overview of these materials is given in Table 1.
In order to evaluate the PL lifetime values of Yb3+ in the prepared samples, the PL curves under the 980 nm laser excitation were recorded by monitoring emission at 1050 nm. The obtained PL decay curves are depicted in Figure 7. The PL lifetime values of Yb3+ 2F5/22F7/2 transition drastically decrease from 1279 ± 23 μs to 278 ± 6 μs with increasing Ho3+ concentration from 0% to 10%; the tendency and exact values are represented in Figure 7 inset and Table S7. Such an abrupt decrease of Yb3+ PL lifetime with increasing Ho3+ concentration is related to the Yb3+ → Ho3+ energy transfer. The energy transfer efficiency (ηtr) was calculated from the Yb3+ PL lifetime values by the following formula [51]:
η t r = ( 1 τ Y b H o τ Y b ) × 100 %
where τYb−Ho and τYb are Yb3+ PL lifetime values of 2F5/22F7/2 transition in the presence and absence of Ho3+, respectively. The calculated ηtr values are summarized in Figure 7 inset and Table S7. The ηtr increases from 66% to 78% when changing Ho3+ concentration from 0.5% to 10%, respectively. The obtained results show that the energy transfer from Yb3+ to Ho3+ is very efficient in this particular host matrix.
The temperature-dependent up-conversion emission spectra were recorded in the 77–500 K temperature range to evaluate samples’ performance at high temperatures. The temperature-dependent up-conversion emission (λex = 980 nm) spectra of K2Gd(PO4)(WO4):20%Yb3+,0.5%Ho3+ sample along with normalized integrated emission and red/green emission ratio are presented in Figure 8a. Ho3+ emission increases with increasing temperature from 77 to 350 K and then decreases with further temperature increases. However, it should be noted that the integrated UC emission intensity at 500 K is around four times higher than the emission at 77 K. The normalized integrated UC emission intensity reaches a maximum of around 300 K and then decreases. The red/green emission ratio decreases in the temperature range from 77 to 150 K and increases with further temperature increase. This shows that the green emission is quenched faster with increasing temperature compared to the red emission. Such temperature-dependent UC emission spectra feature could be used for luminescent temperature sensing. Moreover, the red/green ratio change is also reflected by a color change from orange-red (at 77 K) to orange (at 300 K) and then to a deep-red region with a further temperature increase to 500 K. The color point shifting could be observed in the CIE1931 color space diagram. All the calculated color points are near the edge of the CIE1931 color space diagram, showing the high color purity of the prepared samples. The exact calculated color coordinates of the prepared samples are tabulated in Table S8.

4. Conclusions

The single-phase K2Gd(PO4)(WO4):Ho3+ and K2Gd(PO4)(WO4):20%Yb3+,Ho3+ powders, where Ho3+ concentration varied from 0.5% to 10%, were successfully prepared by the solid-state reaction method. Solely Ho3+ doped samples under 450 nm excitation showed no concentration quenching (at least up to 10% Ho3+). However, adding 20% Yb3+ caused a gradual decrease in Ho3+ emission (under 450 nm excitation) intensity with an increase in its concentration. It turned out that this phenomenon is caused by the increasing probability of Ho3+ → Yb3+ energy transfer when Ho3+ content increases. This was also confirmed by the fact that the strongest UC emission was observed for the K2Gd(PO4)(WO4):20%Yb3+,0.5%Ho3+ sample. Moreover, the K2Gd(PO4)(WO4):20%Yb3+, 0.5%Ho3+ sample showed exceptionally high up-conversion (UC) emission stability in the 77–500 K range. The UC emission intensity reached a maximum at ca. 350 K, and the intensity at 500 K was around four times stronger compared to the intensity at 77 K. Furthermore, the red/green emission ratio gradually increased with increasing temperature from 150 to 500 K, and it could be used for temperature sensing purposes. This also indicates that green emission is quenched faster than red emission in Ho3+ temperature-dependent UC emission spectra. The bright UC emission of the synthesized phosphors could also be employed in preparing anti-counterfeiting pigments.

Supplementary Materials

The following supporting information can be downloaded at: https://www.mdpi.com/article/10.3390/ma16030917/s1, Table S1. Spectrometer settings for measuring reflection spectra of K2Gd(PO4)(WO4):20%Yb3+,x%Ho3+ phosphors. Table S2. Spectrometer settings for measuring excitation spectra of K2Gd(PO4)(WO4):20%Yb3+,x%Ho3+ phosphors. Table S3. Spectrometer settings for measuring emission spectra of K2Gd(PO4)(WO4):20%Yb3+,x%Ho3+ phosphors. Table S4. Spectrometer settings for measuring up-conversion emission spectra of K2Gd(PO4)(WO4):20%Yb3+,x%Ho3+ phosphors. Table S5. Lattice parameters of K2Gd(PO4)(WO4), K2Gd(PO4)(WO4):10%Ho3+, K2Gd(PO4)(WO4):20%Yb3+, and K2Gd(PO4)(WO4):20%Yb3+,10%Ho3+ samples derived from Rietveld refinement analysis. Table S6. Effective up-conversion PL rise time and lifetime values of K2Gd(PO4)(WO4):20%Yb3+ phosphors as a function of Ho3+ concentration (λex = 980 nm, λem = 660 nm). Table S7. Effective up-conversion PL decay lifetime values and energy transfer efficiency (ηtr) of K2Gd(PO4)(WO4):20%Yb3+,x%Ho3+ phosphors as a function of Ho3+ concentration (λex = 980 nm, λem = 1050 nm). Table S8. Color coordinates (CIE 1931 color space) of K2Gd(PO4)(WO4):20%Yb3+,0.5%Ho3+ as a function of temperature (λex = 980 nm). Figure S1. SEM images of K2Gd(PO4)(WO4):20%Yb3+ (a), K2Gd(PO4)(WO4):10%Ho3+ (b), and K2Gd(PO4)(WO4):20%Yb3+,10%Ho3+ (c), Figure S2. Digital images of the K2Gd(PO4)(WO4):20%Yb3+,Ho3+ up-conversion luminescence (λex = 980 nm laser) as a function of Ho3+ concentration.

Author Contributions

Conceptualization, A.K.; investigation, J.G.; writing—original draft preparation, J.G.; writing—review and editing, A.K.; visualization, J.G. and A.K.; funding acquisition, A.K. All authors have read and agreed to the published version of the manuscript.

Funding

This research was funded by a grant (No. D-2018-0703 “Controlling the upconversion emission by tuning bandgap of the host matrix”) from the Research Council of Lithuania.

Institutional Review Board Statement

Not applicable.

Informed Consent Statement

Not applicable.

Data Availability Statement

The data presented in this study are available on request from the corresponding author.

Acknowledgments

The authors gratefully thank Andrius Pakalniskis (Vilnius University) for taking SEM images.

Conflicts of Interest

The authors declare no conflict of interest.

References

  1. Yin, D.G.; Liu, Y.M.; Tang, J.X.; Zhao, F.F.; Chen, Z.W.; Zhang, T.T.; Zhang, X.Y.; Chang, N.; Wu, C.L.; Chen, D.W.; et al. Huge enhancement of upconversion luminescence by broadband dye sensitization of core/shell nanocrystals. Dalton. Trans. 2016, 45, 13392–13398. [Google Scholar] [CrossRef]
  2. Ramachari, D.; Esparza, D.; Lopez-Luke, T.; Romero, V.H.; Perez-Mayen, L.; De la Rosa, E.; Jayasankar, C.K. Synthesis of co-doped Yb3+-Er3+:ZrO2 upconversion nanoparticles and their applications in enhanced photovoltaic properties of quantum dot sensitized solar cells. J. Alloys Compd. 2017, 698, 433–441. [Google Scholar] [CrossRef]
  3. Zhou, J.; Liu, Q.; Feng, W.; Sun, Y.; Li, F.Y. Upconversion Luminescent Materials: Advances and Applications. Chem. Rev. 2015, 115, 395–465. [Google Scholar] [CrossRef]
  4. Raman, T.R.; Lakshmi, R.P.V.; Ratnakaram, Y.C. Effect of Ho3+ ion concentration on structure and spectroscopic properties of LiPbB5O9:Ho3+ phosphor. J. Mol. Struct. 2021, 1243, 130759. [Google Scholar] [CrossRef]
  5. Zhang, B.B.; Meng, J.J.; Mi, X.H.; Zhang, C.J.; Zhang, Z.L.; Zheng, H.R. Enhanced upconversion fluorescent probe of single NaYF4:Yb3+/Er3+/Zn2+ nanoparticles for copper ion detection. Rsc. Adv. 2018, 8, 37618–37622. [Google Scholar] [CrossRef] [Green Version]
  6. Yang, D.M.; Ma, P.A.; Hou, Z.Y.; Cheng, Z.Y.; Li, C.X.; Lin, J. Current advances in lanthanide ion (Ln3+)-based upconversion nanomaterials for drug delivery. Chem. Soc. Rev. 2015, 44, 1416–1448. [Google Scholar] [CrossRef] [Green Version]
  7. Liu, Y.Q.; Qin, L.Y.; Li, H.J.; Wang, Y.X.; Zhang, R.; Shi, J.M.; Wu, J.H.; Dong, G.X.; Zhou, P. Application of lanthanide-doped upconversion nanoparticles for cancer treatment: A review. Nanomedicine 2021, 16, 2207–2242. [Google Scholar] [CrossRef]
  8. Pavani, K.; Kumar, J.S.; Srikanth, K.; Soares, M.J.; Pereira, E.; Neves, A.J.; Graca, M.P.F. Highly efficient upconversion of Er3+ in Yb3+ codoped non-cytotoxic strontium lanthanum aluminate phosphor for low temperature sensors. Sci. Rep. 2017, 7, 17646. [Google Scholar] [CrossRef] [Green Version]
  9. Solis, D.; De la Rosa, E.; Meza, O.; Diaz-Torres, L.A.; Salas, P.; Angeles-Chavez, C. Role of Yb3+ and Er3+ concentration on the tunability of green-yellow-red upconversion emission of codoped ZrO2:Yb3+-Er3+ nanocrystals. J. Appl. Phys. 2010, 108, 023103. [Google Scholar] [CrossRef]
  10. Li, K.; Van Deun, R. Mutual energy transfer luminescent properties in novel CsGd(MoO4)2:Yb3+,Er3+/Ho3+ phosphors for solid-state lighting and solar cells. Phys. Chem. Chem. Phys. 2019, 21, 4746–4754. [Google Scholar] [CrossRef]
  11. Mahata, M.K.; Koppe, T.; Kumar, K.; Hofsass, H.; Vetter, U. Upconversion photoluminescence of Ho3+-Yb3+ doped barium titanate nanocrystallites: Optical tools for structural phase detection and temperature probing. Sci. Rep. 2020, 10, 8775. [Google Scholar] [CrossRef]
  12. Lim, C.S.; Atuchin, V.V.; Aleksandrovsky, A.S.; Molokeev, M.S.; Oreshonkov, A.S. Incommensurately modulated structure and spectroscopic properties of CaGd2(MoO4)4:Ho3+/Yb3+ phosphors for up-conversion applications. J. Alloys Compd. 2017, 695, 737–746. [Google Scholar] [CrossRef] [Green Version]
  13. Lim, C.S.; Aleksandrovsky, A.; Molokeev, M.; Oreshonkov, A.; Atuchin, V. Structural and Spectroscopic Effects of Li+ Substitution for Na+ in LixNa1−xCaGd0.5Ho0.05Yb0.45(MoO4)3 Scheelite-Type Upconversion Phosphors. Molecules 2021, 26, 7357. [Google Scholar] [CrossRef]
  14. Li, M.; Liu, X.Y.; Liu, L.; Ma, B.; Li, B.X.; Zhao, X.D.; Tong, W.M.; Wang, X.F. beta-NaYF4: Yb,Tm: Upconversion properties by controlling the transition probabilities at the same energy level. Inorg. Chem. Front. 2016, 3, 1082–1090. [Google Scholar] [CrossRef]
  15. Li, X.Y.; Zhou, S.S.; Jiang, G.C.; Wei, X.T.; Chen, Y.H.; Yin, M. Blue upconversion of Tm3+ using Yb3+ as energy transfer bridge under 1532 nm excitation in Er3+, Yb3+, Tm3+ tri-doped CaMoO4. J. Rare Earth 2015, 33, 475–479. [Google Scholar] [CrossRef]
  16. Yu, H.Q.; Jiang, P.P.; Chen, B.J.; Sun, J.S.; Cheng, L.H.; Li, X.P.; Zhang, J.S.; Xu, S. Electrospinning preparation and upconversion luminescence of Y2Ti2O7:Tm/Yb nanofibers. Appl. Phys. A-Mater. 2020, 126, 690. [Google Scholar] [CrossRef]
  17. Tessitore, G.; Mandl, G.A.; Brik, M.G.; Park, W.; Capobianco, J.A. Recent insights into upconverting nanoparticles: Spectroscopy, modeling, and routes to improved luminescence. Nanoscale 2019, 11, 12015–12029. [Google Scholar] [CrossRef]
  18. Wu, X.; Chen, G.Y.; Shen, J.; Li, Z.J.; Zhang, Y.W.; Han, G. Upconversion Nanoparticles: A Versatile Solution to Multiscale Biological Imaging. Bioconjugate Chem. 2015, 26, 166–175. [Google Scholar] [CrossRef] [Green Version]
  19. Dong, H.; Du, S.R.; Zheng, X.Y.; Lyu, G.M.; Sun, L.D.; Li, L.D.; Zhang, P.Z.; Zhang, C.; Yan, C.H. Lanthanide Nanoparticles: From Design toward Bioimaging and Therapy. Chem. Rev 2015, 115, 10725–10815. [Google Scholar] [CrossRef]
  20. Huang, H.N.; Wang, T.; Zhou, H.F.; Huang, D.P.; Wu, Y.Q.; Zhou, G.J.; Hu, J.F.; Zhan, J. Luminescence, energy transfer, and up-conversion mechanisms of Yb3+ and Tb3+ co-doped LaNbO4. J. Alloys Compd. 2017, 702, 209–215. [Google Scholar] [CrossRef]
  21. Kaczmarek, A.M.; Van Deun, R. Rare earth tungstate and molybdate compounds-from 0D to 3D architectures. Chem. Soc. Rev. 2013, 42, 8835–8848. [Google Scholar] [CrossRef]
  22. Su, J.Y.; Zhang, X.Y.; Li, X. Hydrothermal synthesis and green up-conversion luminescence of Yb3+ and Ho3+ co-doped SrGd2(WO4)2(MoO4)2 nanocrystal. Aip Adv. 2019, 9, 125246. [Google Scholar] [CrossRef] [Green Version]
  23. Atuchin, V.V.; Kesler, V.G.; Maklakova, N.Y.; Pokrovsky, L.D.; Sheglov, D.V. Core level spectroscopy and RHEED analysis of KGd0.95Nd0.05(WO4)2 surface. Eur. Phys. J. B 2006, 51, 293–300. [Google Scholar] [CrossRef]
  24. Atuchin, V.V.; Galashov, E.N.; Kozhukhov, A.S.; Pokrovsky, L.D.; Shlegel, V.N. Epitaxial growth of ZnO nanocrystals at ZnWO4(0 1 0) cleaved surface. J. Cryst. Growth 2011, 318, 1147–1150. [Google Scholar] [CrossRef]
  25. Huang, X.Y.; Li, B.; Guo, H. Highly efficient Eu3+-activated K2Gd(WO4)(PO4) red-emitting phosphors with superior thermal stability for solid-state lighting. Ceram. Int. 2017, 43, 10566–10571. [Google Scholar] [CrossRef]
  26. Fan, G.; Tian, Z.C.; Wang, X.J.; Tang, S.L.; Chen, Y.N. High quantum efficiency red-emitting K2Gd(PO4)(WO4): Sm3+ phosphor: Preparation, characterization and photoluminescence properties. J. Mater. Sci.-Mater. Electron. 2018, 29, 17681–17688. [Google Scholar] [CrossRef]
  27. Han, L.L.; Wang, Y.H.; Zhang, J.; Tao, Y. Visible quantum cutting via downconversion in a novel green-emitting K2Gd(WO4)(PO4):Tb3+ phosphor. Mater. Chem. Phys. 2014, 143, 476–479. [Google Scholar] [CrossRef]
  28. Guo, L.N.; Wang, Y.H.; Zhang, J.; Wang, Y.Z.; Dong, P.Y. Near-infrared quantum cutting in Ho3+, Yb3+-codoped BaGdF5 nanoparticles via first- and second-order energy transfers. Nanoscale Res. Lett. 2012, 7, 1–7. [Google Scholar] [CrossRef] [Green Version]
  29. Terebilenko, K.V.; Zatovsky, I.V.; Baumer, V.N.; Slobodyanik, N.S.; Shishkin, O.V. K2Ho(PO4)(WO4). Acta Crystallogr. Sect. E-Crystallogr. Commun. 2008, 64, i75. [Google Scholar] [CrossRef] [Green Version]
  30. Zatovsky, I.V.; Terebilenko, K.V.; Slobodyanik, N.S.; Baumer, V.N.; Shishkin, O.V. K2Bi(PO4)(WO4) with a layered anionic substructure. Acta Crystallogr. Sect. E-Crystallogr. Commun. 2006, 62, I193–I195. [Google Scholar] [CrossRef]
  31. Shannon, R.D. Revised Effective Ionic Radii and Systematic Studies of Interatomic Distances in Halides and Chalcogenides. Acta Crystallogr. 1976, A32, 751–767. [Google Scholar] [CrossRef]
  32. Huang, X.Y.; Guo, H.; Li, B. Eu3+-activated Na2Gd(PO4)(MoO4): A novel high-brightness red-emitting phosphor with high color purity and quantum efficiency for white light-emitting diodes. J. Alloys Compd. 2017, 720, 29–38. [Google Scholar] [CrossRef]
  33. Grigorjevaite, J.; Ezerskyte, E.; Minderyte, A.; Stanionyte, S.; Juskenas, R.; Sakirzanovas, S.; Katelnikovas, A. Optical Properties of Red-Emitting Rb2Bi(PO4)(MoO4):Eu3+ Powders and Ceramics with High Quantum Efficiency for White LEDs. Materials 2019, 12, 3275. [Google Scholar] [CrossRef] [Green Version]
  34. Daub, M.; Lehner, A.J.; Hoppe, H.A. Synthesis, crystal structure and optical properties of Na2RE(PO4)(WO4) (RE = Y, Tb-Lu). Dalton. T 2012, 41, 12121–12128. [Google Scholar] [CrossRef]
  35. Zhang, X.G.; Chen, M.Y.; Zhang, J.L.; Qin, X.Z.; Gong, M.L. Photoluminescence studies of high-efficient red-emitting K2Y(WO4)(PO4):Eu3+ phosphor for NUV LED. Mater. Res. Bull. 2016, 73, 219–225. [Google Scholar] [CrossRef]
  36. Zatovsky, I.V.; Terebilenko, K.V.; Slobodyanik, N.S.; Baumer, V.N.; Shishkin, O.V. Synthesis, characterization and crystal structure of K2Bi(PO4)(MoO4). J. Solid. State Chem. 2006, 179, 3550–3555. [Google Scholar] [CrossRef]
  37. Han, B.; Liu, B.K.; Zhang, J.; Shi, H.Z. Luminescence properties of novel Ba2MgWO6:Eu3+ and g-C3N4/Ba2MgWO6:Eu3+ phosphors. Optik 2017, 131, 764–768. [Google Scholar] [CrossRef]
  38. Foldvari, I.; Baraldi, A.; Capelletti, R.; Magnani, N.; Sosa, R.; Munoz, A.; Kappers, L.A.; Watterich, A. Optical absorption and luminescence of Ho3+ ions in Bi2TeO5 single crystal. Opt. Mater. 2007, 29, 688–696. [Google Scholar] [CrossRef]
  39. Kaczkan, M.; Malinowski, M. Optical Transitions and Excited State Absorption Cross Sections of SrLaGaO4 Doped with Ho3+ Ions. Materials 2021, 14, 3831. [Google Scholar] [CrossRef]
  40. Li, Y.C.; Chang, Y.H.; Chang, Y.S.; Lin, Y.J.; Laing, C.H. Luminescence and energy transfer properties of Gd3+ and Tb3+ in LaAlGe2O7. J. Phys. Chem. C 2007, 111, 10682–10688. [Google Scholar] [CrossRef]
  41. Wang, J.; Bu, Y.Y.; Wang, X.F.; Seo, H.J. A novel optical thermometry based on the energy transfer from charge transfer band to Eu3+-Dy3+ ions. Sci. Rep. 2017, 7, 6023. [Google Scholar] [CrossRef] [Green Version]
  42. Tang, Y.X.; Ye, Y.F.; Liu, H.H.; Guo, X.F.; Tang, H.X.; Yin, W.Z.; Gao, Y.P. Hydrothermal synthesis of NaLa(WO4)2: Eu3+ octahedrons and tunable luminescence by changing Eu3+ concentration and excitation wavelength. J. Mater. Sci.-Mater. Electron. 2017, 28, 1301–1306. [Google Scholar] [CrossRef]
  43. Malinowski, M.; Kaczkan, M.; Wnuk, A.; Szuflinska, M. Emission from the high lying excited states of Ho3+ ions in YAP and YAG. J. Lumin. 2004, 106, 269–279. [Google Scholar] [CrossRef]
  44. Malinowski, M.; Piramidowicz, R.; Frukacz, Z.; Chadeyron, G.; Mahiou, R.; Joubert, M.F. Spectroscopy and upconversion processes in YAlO3:Ho3+ crystals. Opt. Mater. 1999, 12, 409–423. [Google Scholar] [CrossRef]
  45. Wang, X.; Bu, Y.; Xiao, S.; Yang, X.; Ding, J. Upconversion in Ho3+-doped YbF3 particle prepared by coprecipitation method. Appl. Phys. B-Lasers O 2008, 93, 801–807. [Google Scholar] [CrossRef]
  46. Qian, H.Y.; Zhang, T.Q.; Jiang, X.L.; Wang, H.H.; Yang, W.L.; Li, C. Visible photon avalanche up-conversion of Yb3+ and Ho3+ doped NaBi(WO4)2 phosphors under excitation at 980 nm. J. Mater. Sci.-Mater. Electron. 2022, 33, 22718–22727. [Google Scholar] [CrossRef]
  47. Kochanowicz, M.; Zmojda, J.; Miluski, P.; Pisarska, J.; Pisarski, W.A.; Dorosz, D. NIR to visible upconversion in double-clad optical fiber co-doped with Yb3+/Ho3+. Opt Mater. Express 2015, 5, 1505–1510. [Google Scholar] [CrossRef]
  48. Liu, W.G.; Wang, X.J.; Zhu, Q.; Li, X.D.; Sun, X.D.; Li, J.G. Upconversion luminescence and favorable temperature sensing performance of eulytite-type Sr3Y(PO4)3:Yb3+/Ln3+ phosphors (Ln=Ho, Er, Tm). Sci. Technol. Adv. Mat. 2019, 20, 949–963. [Google Scholar] [CrossRef] [Green Version]
  49. Pei, Y.Q.; An, S.S.; Zhuang, C.; Sun, D.; Li, X.W.; Zhang, J. Yb3+-concentration-dependent upconversion luminescence of Ho3+-Yb3+ codoped La9.31(Si1.04O4)6O2 for optical thermometer. J. Lumin. 2022, 250, 119073. [Google Scholar] [CrossRef]
  50. Pandey, A.; Kumar, V.; Kroon, R.E.; Swart, H.C. Photon upconversion in Ho3+-Yb3+ embedded tungsten tellurite glass. J. Lumin. 2017, 192, 757–760. [Google Scholar] [CrossRef]
  51. Lupei, A.; Lupei, V.; Ikesue, A.; Gheorghe, C.; Hau, S. Nd → Yb energy transfer in (Nd, Yb):Y2O3 transparent ceramics. Opt. Mater. 2010, 32, 1333–1336. [Google Scholar] [CrossRef]
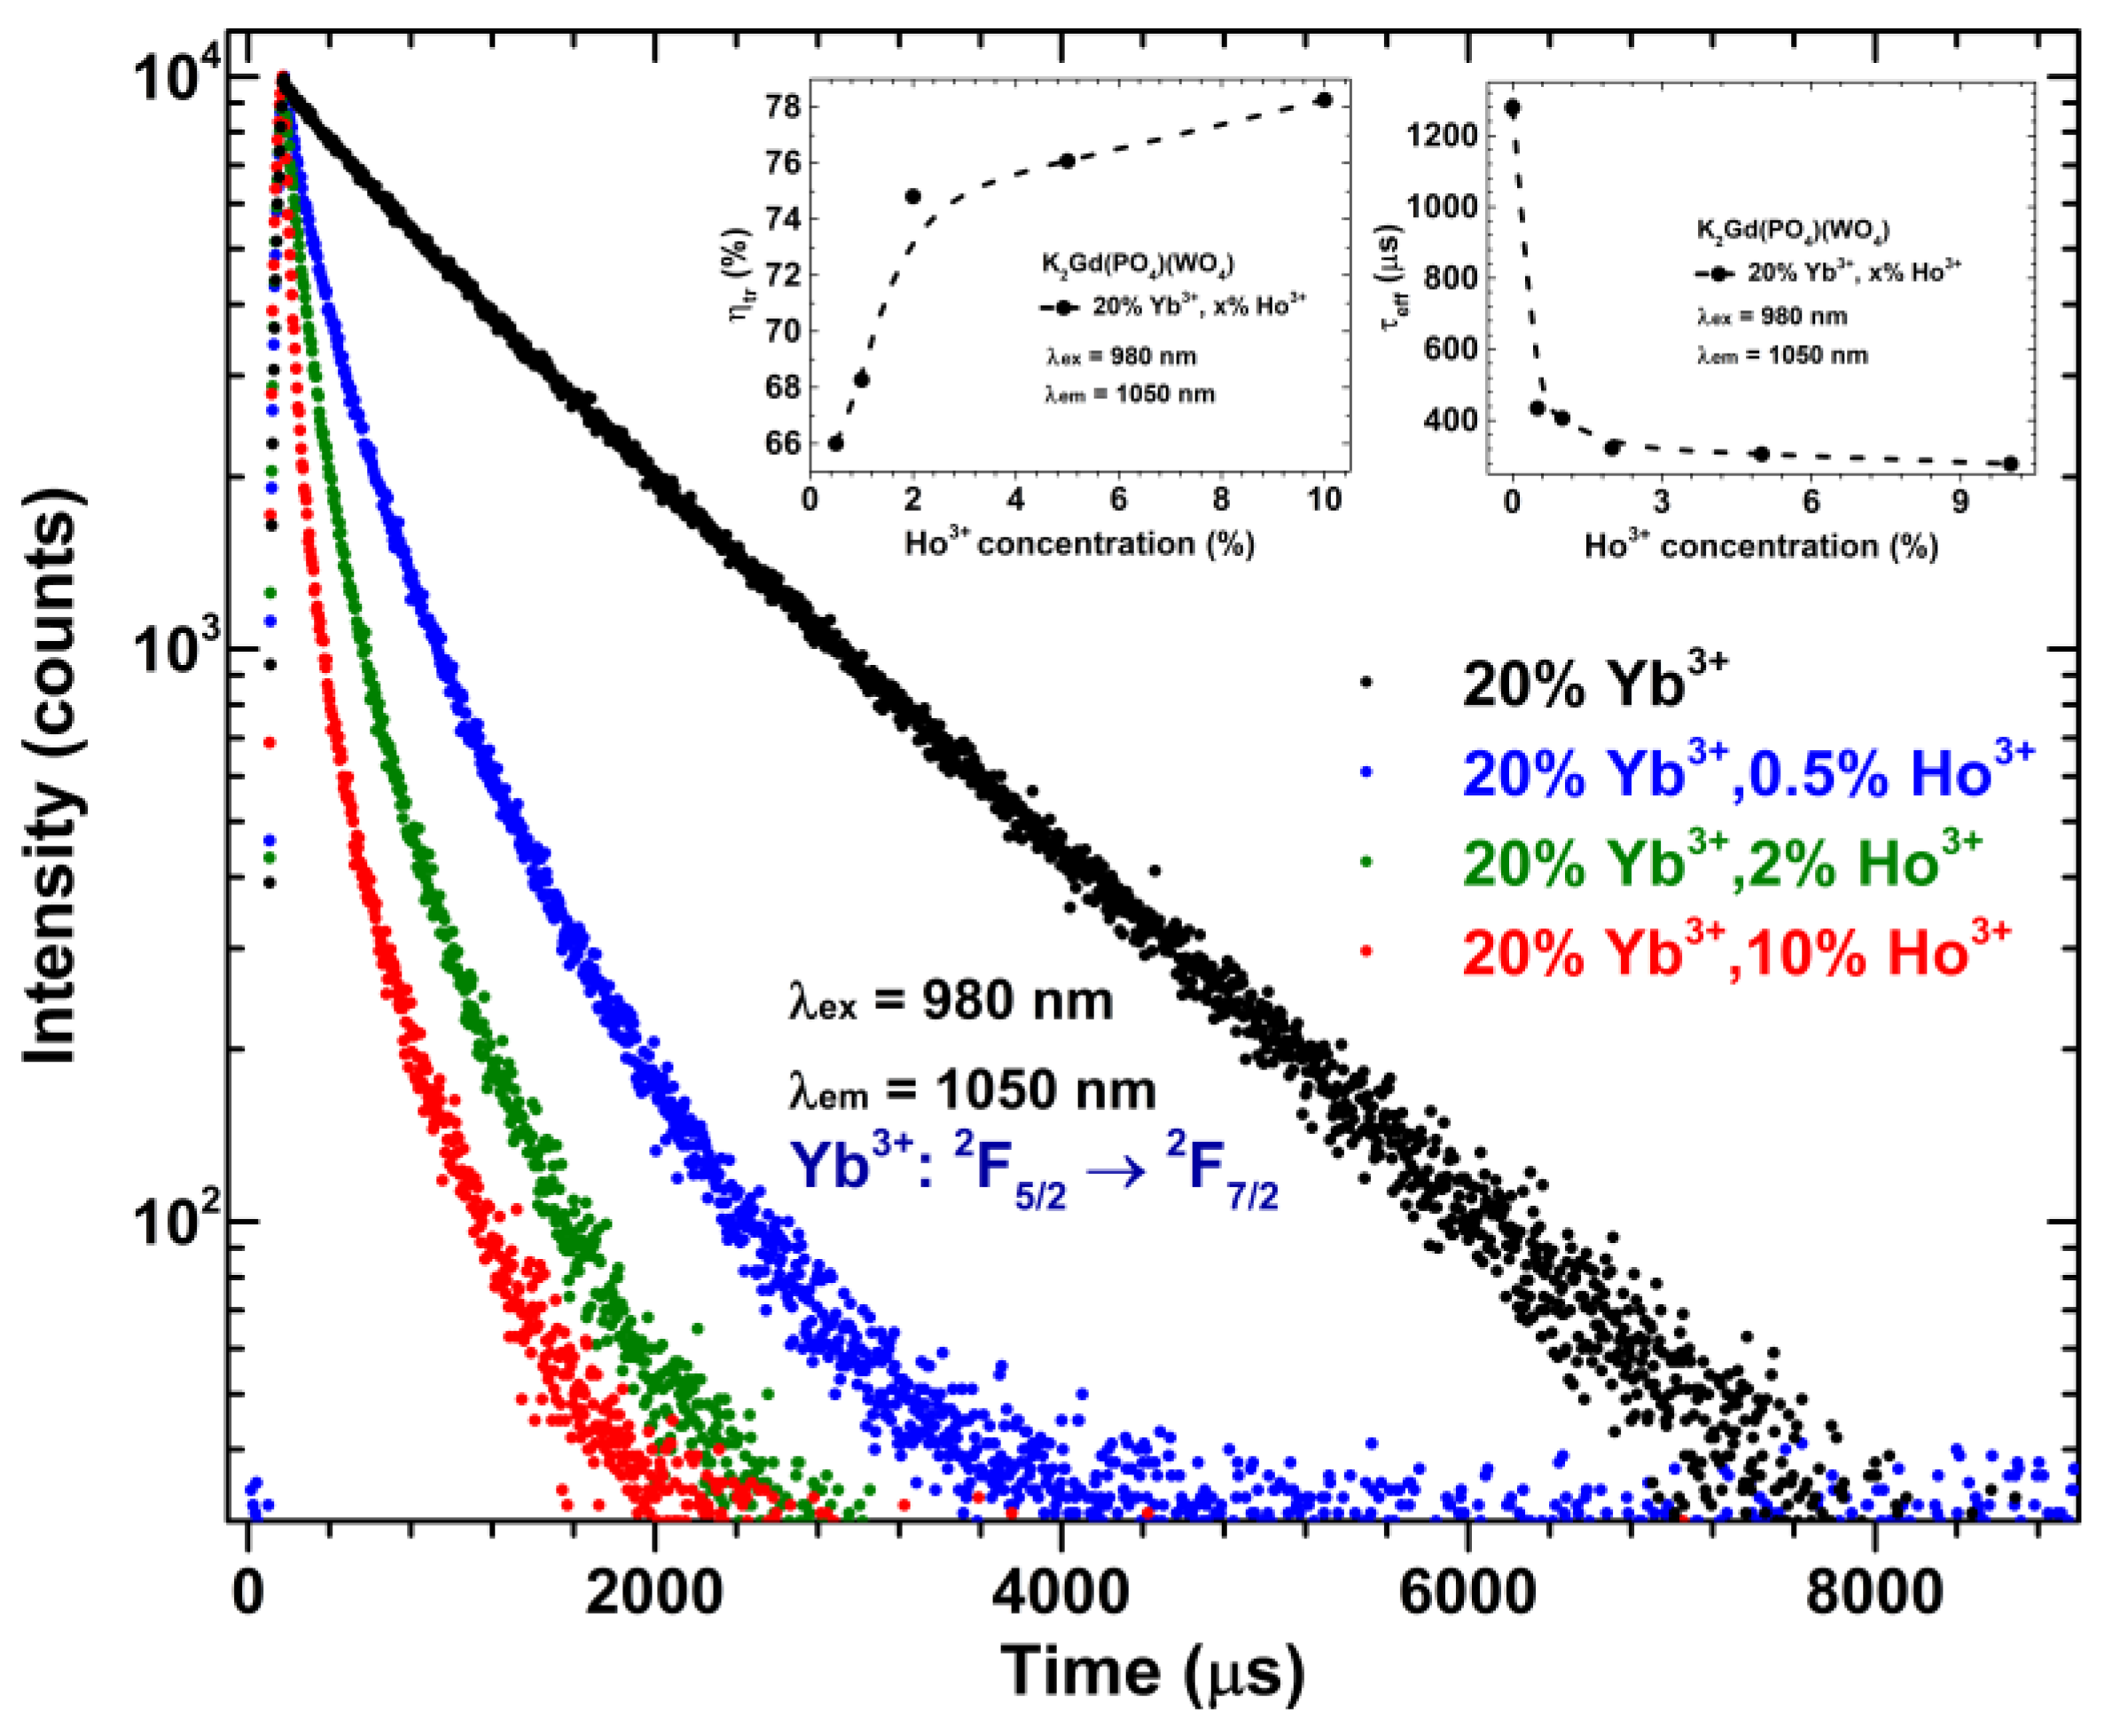
Figure 1. Rietveld refinement of undoped K2Gd(PO4)(WO4) (a), K2Gd(PO4)(WO4):10%Ho3+ (b), K2Gd(PO4)(WO4):20%Yb3+ (c), and K2Gd(PO4)(WO4):20%Yb3+,10%Ho3+ (d) XRD patterns.
Materials 16 00917 g001
Figure 2. Reflectance spectra of K2Gd(PO4)(WO4) (red line), K2Gd(PO4)(WO4):20%Yb3+ (black line), K2Gd(PO4)(WO4):10%Ho3+ (blue line), and K2Gd(PO4)(WO4):20%Yb3+,10%Ho3+ (green line) specimens.
Materials 16 00917 g002
Figure 3. (a) Excitation (λem = 544 nm) and (b) emission (λex = 450 nm) spectra of K2Gd(PO4)(WO4) doped with 1% and 10% Ho3+. (c) Excitation (λem = 544 nm) and (d) emission (λex = 450 nm) spectra of K2Gd(PO4)(WO4):20%Yb3+ doped with 1% and 10% Ho3+.
Materials 16 00917 g003
Figure 4. Schematic energy level diagram of energy transitions in Yb3+ and Ho3+.
Materials 16 00917 g004
Figure 5. Up-conversion emission spectra of K2Gd(PO4)(WO4) as a function of Ho3+ concentration, under the 980 nm excitation. The inset graph shows Ho3+ concentration-dependent normalized integrated emission.
Materials 16 00917 g005
Figure 6. (a) Up-conversion PL decay curves (λex = 980 nm, λem = 660 nm) of K2Gd(PO4)(WO4):20%Yb3+,Ho3+ as a function of Ho3+ concentration, (b) PL rise time and (c) effective decay lifetime (τeff) values of the same samples as a function of Ho3+ concentration.
Materials 16 00917 g006
Figure 7. Yb3+ decay curves of K2Gd(PO4)(WO4):20%Yb3+ as a function of Ho3+ concentration. Inset graphs show the energy transfer efficiency (ηtr) and τeff values as a function of Ho3+ concentration.
Materials 16 00917 g007
Figure 8. (a) Temperature-dependent up-conversion emission spectra of K2Gd(PO4)(WO4):20%Yb3+,0.5%Ho3+ sample under the 980 nm laser excitation. The inset shows normalized integrated emission intensity and the ratio between Red (630–680 nm) and Green (530–555 nm) emission integrals (lines were drawn to guide the eye). (b) temperature-dependent color coordinates of 0.5% Ho3+ doped sample.
Materials 16 00917 g008
Table 1. UC PL lifetime values of inorganic host matrixes doped with Ho3+.
Upconverting MaterialUC PL Lifetime (μs)Ref.
BaGdF5:20%Yb3+,1%Ho3+131[28]
Sr3Y(PO4)3:10%Yb3+,2%Ho3+261[48]
cubic BaTiO3:3%Yb3+,0.2%Ho3+155[11]
tetragonal BaTiO3:3%Yb3+,0.2%Ho3+125[11]
La9.31(Si1.04O4)6O2:20%Yb3+,1%Ho3+18[49]
TeO2–WO3 glass33[50]
K2Gd(PO4)(WO4):20%Yb3+,0.5%Ho3+191This work
K2Gd(PO4)(WO4):20%Yb3+,10%Ho3+83This work
Disclaimer/Publisher’s Note: The statements, opinions and data contained in all publications are solely those of the individual author(s) and contributor(s) and not of MDPI and/or the editor(s). MDPI and/or the editor(s) disclaim responsibility for any injury to people or property resulting from any ideas, methods, instructions or products referred to in the content.

